
An Adaptive Heart Rate Monitoring Algorithm for Wearable Healthcare Devices


Abstract
:1. Introduction
2. Background and Related Work
2.1. Wristband-Type PPG-Based Devices
2.2. Sources of Inaccuracy—Motion Artifacts
2.3. Learning Models
2.4. Time-Frequency Analysis
2.5. Background-AMPD Schemes
2.5.1. Heart Rate Detection
2.5.2. AMPD Algorithm
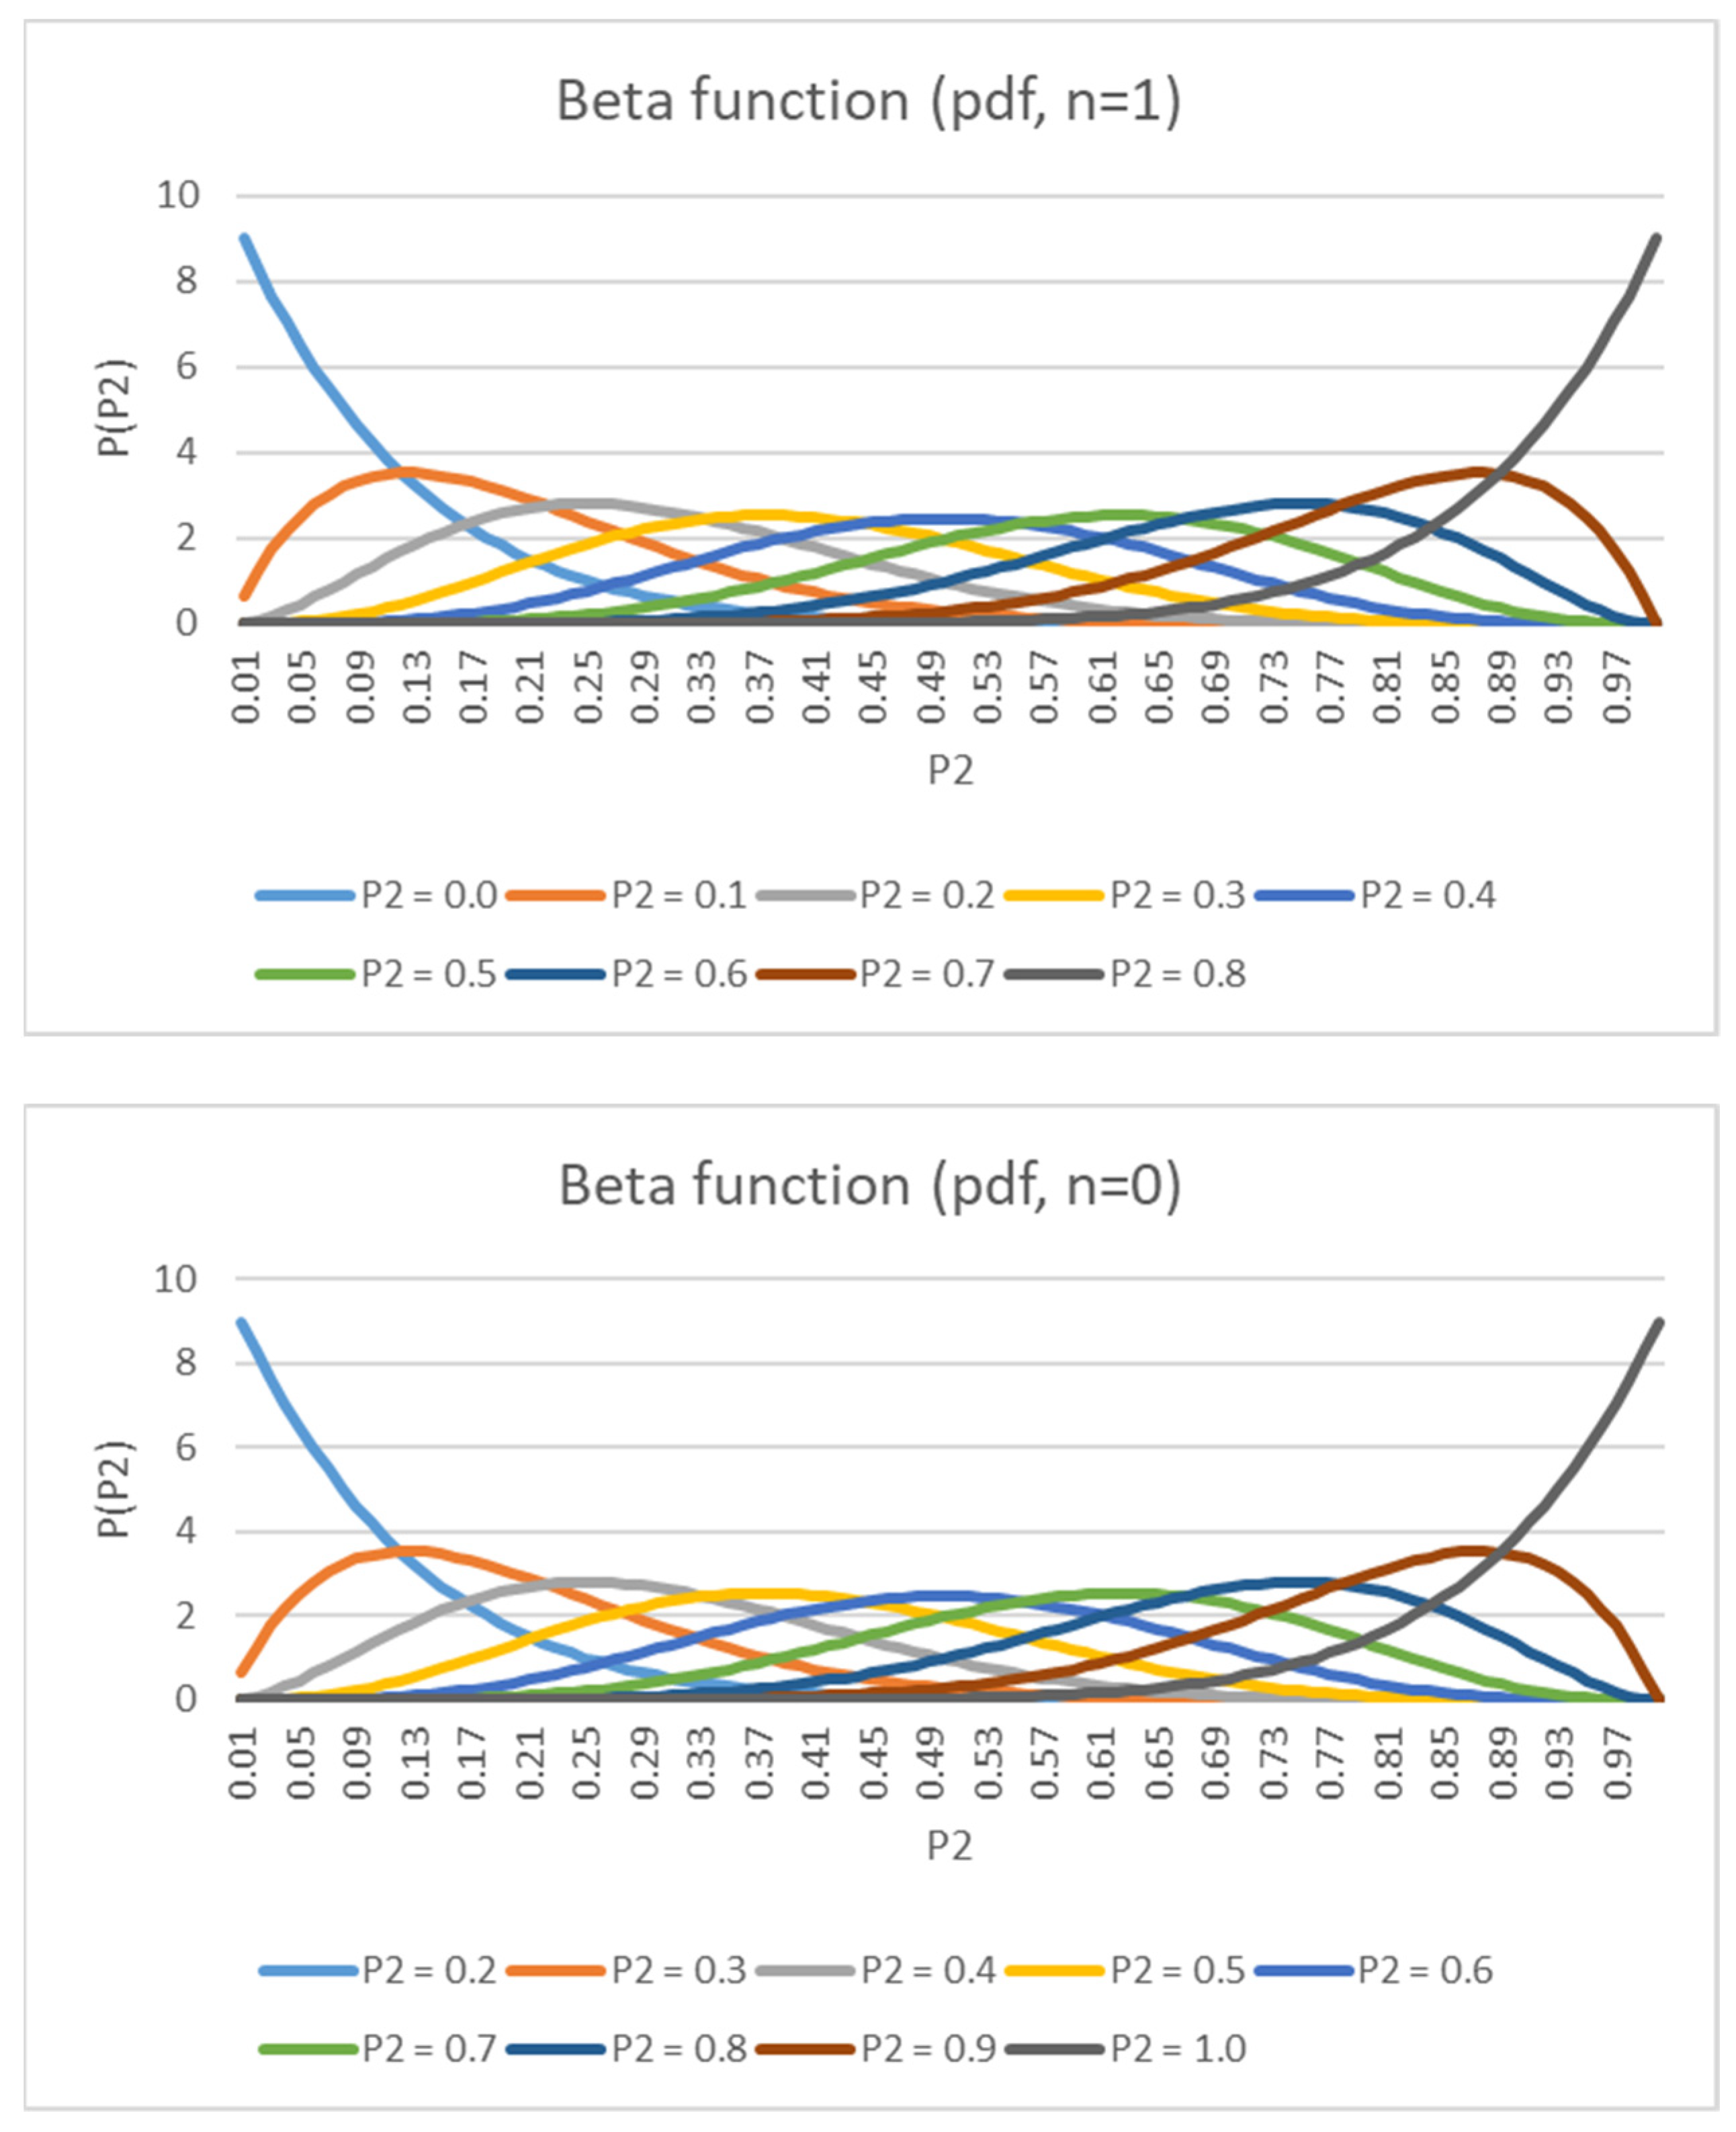
2.5.3. Laplacian Distribution
2.5.4. AMPD-BL Algorithm
2.5.5. Performance Discussion
3. The Adaptive Heart Rate Detection System
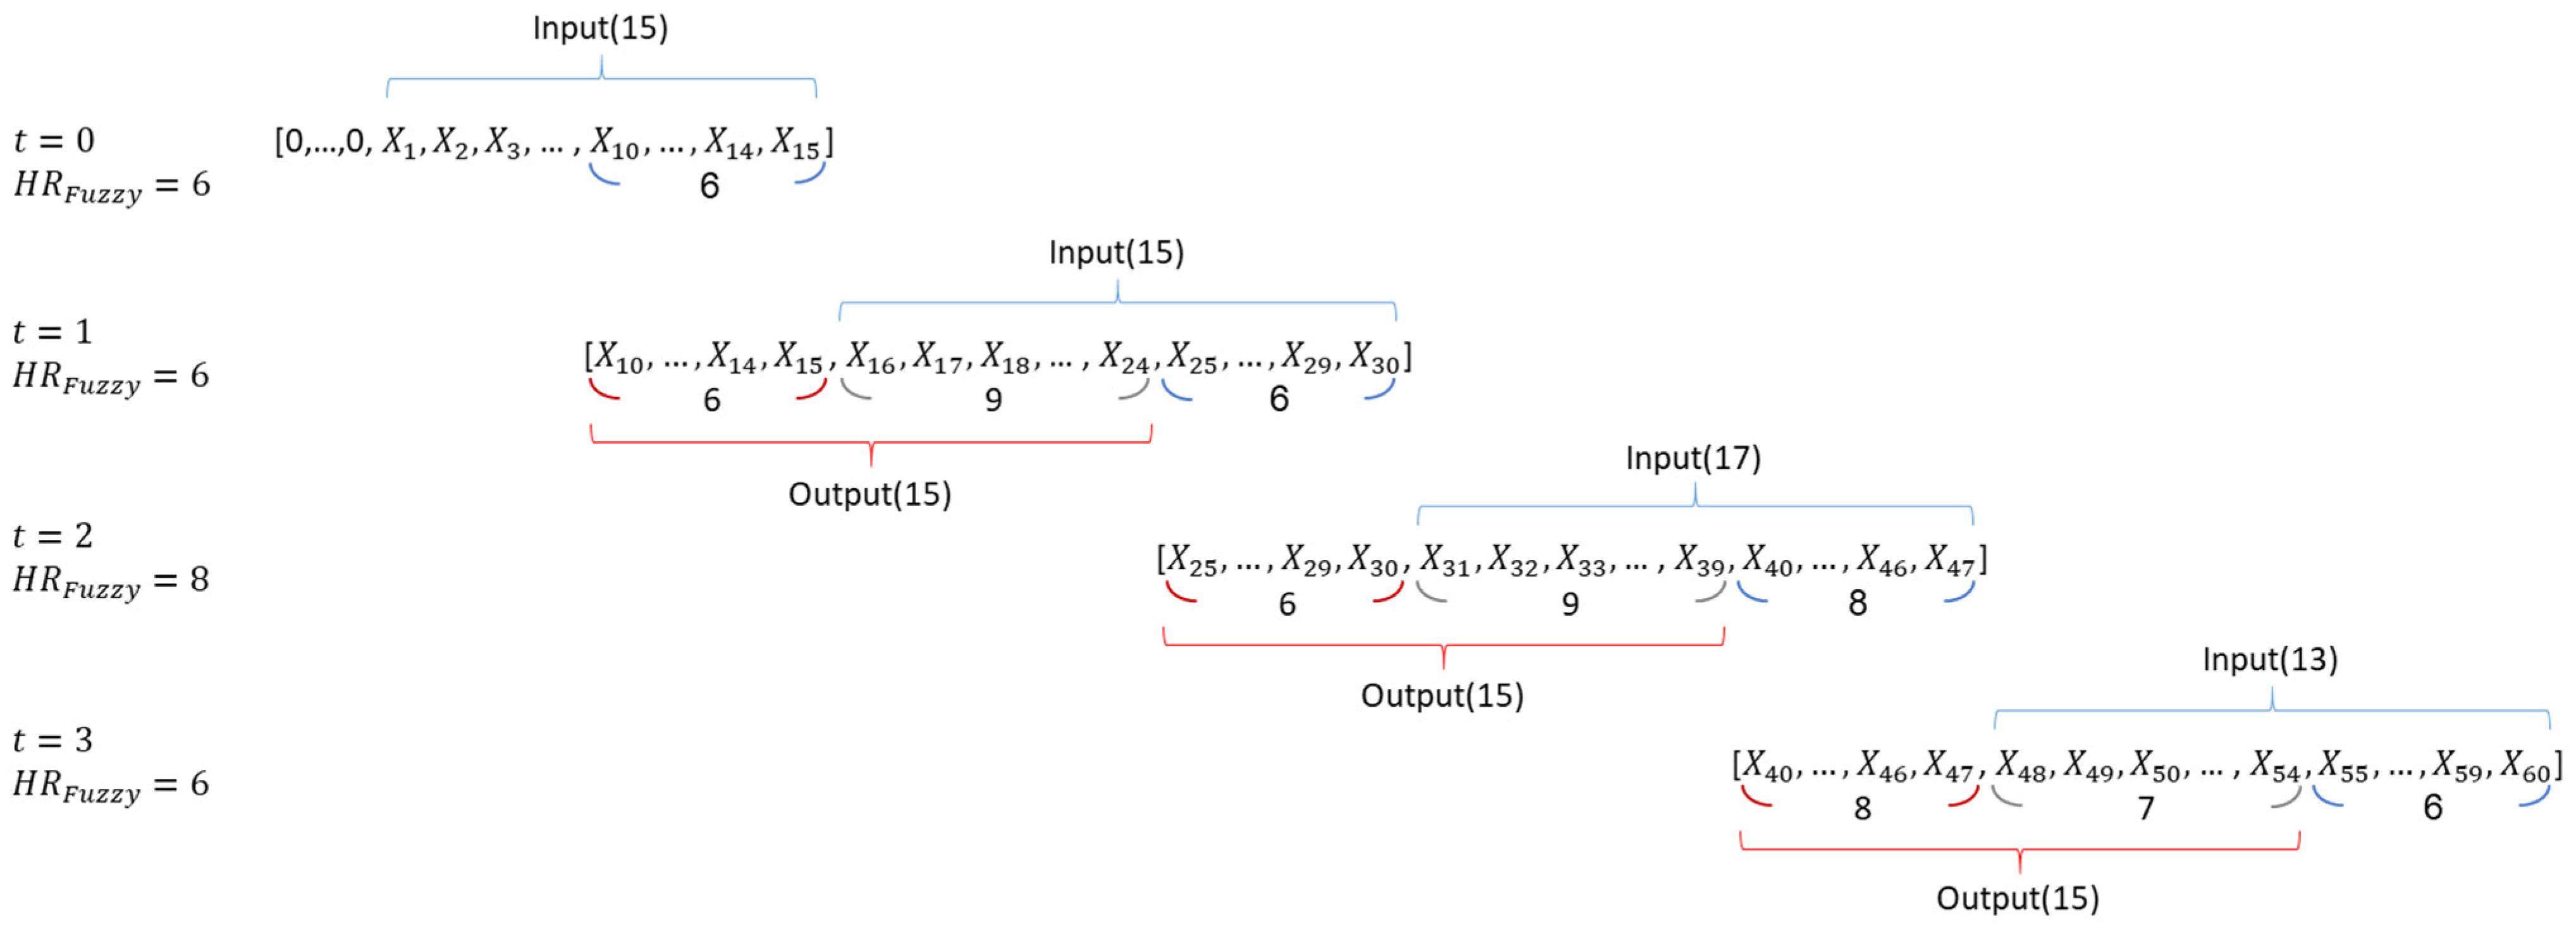
3.1. Design of a Sliding Window Protocol
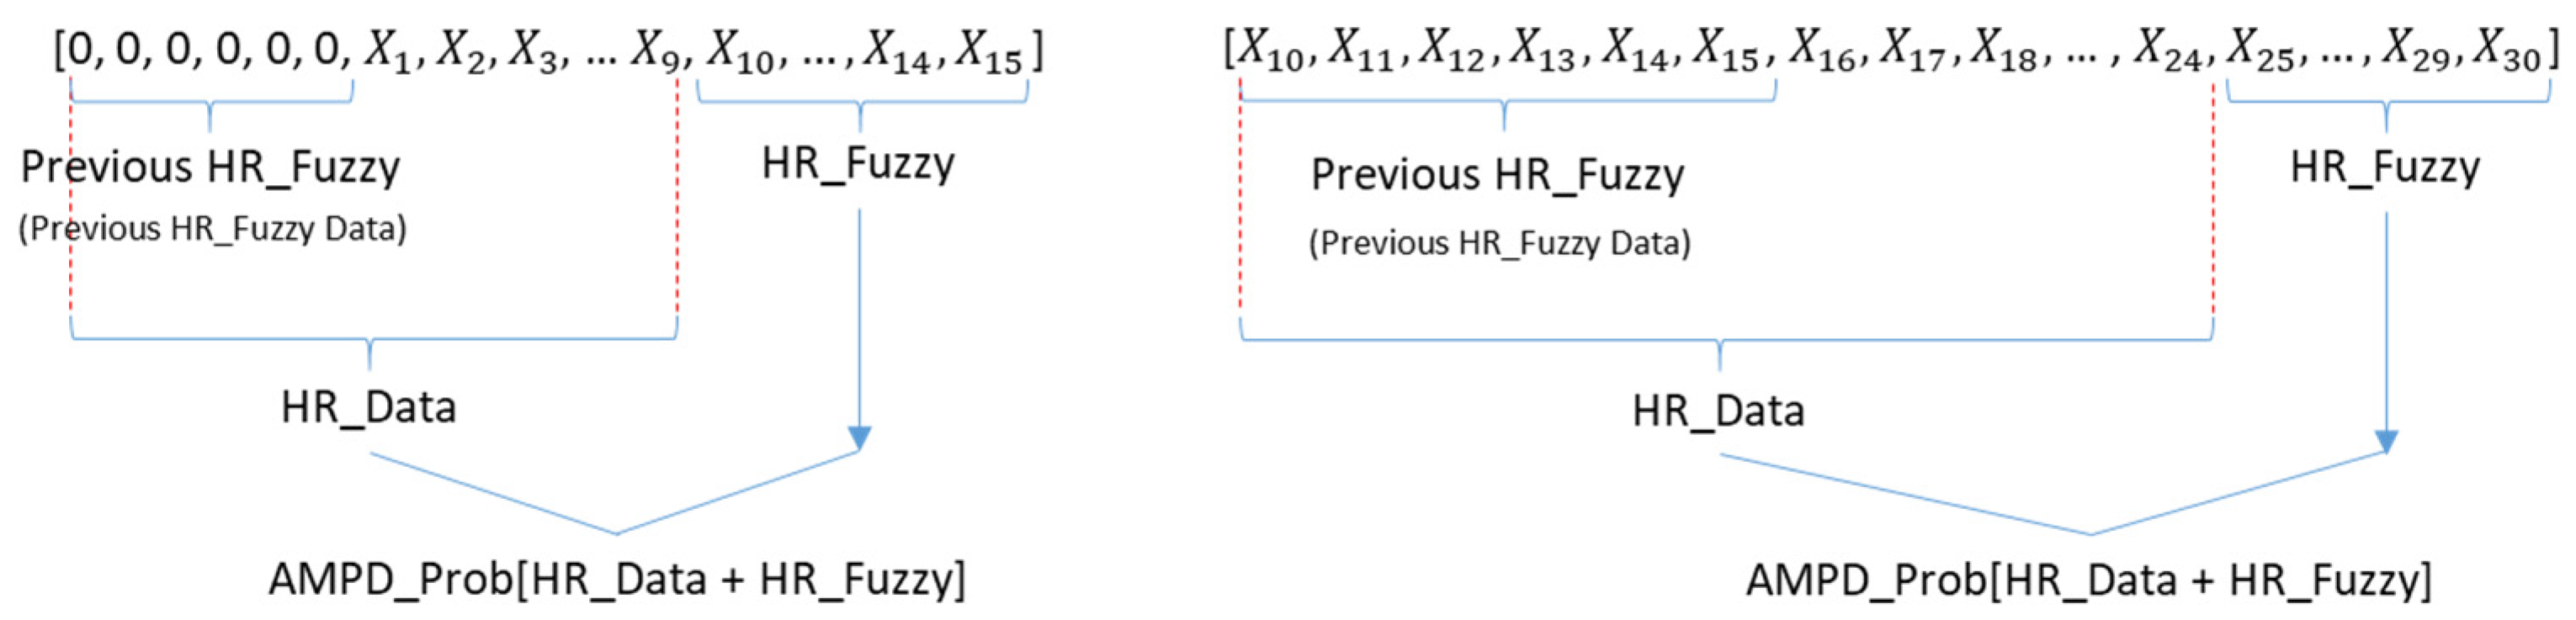
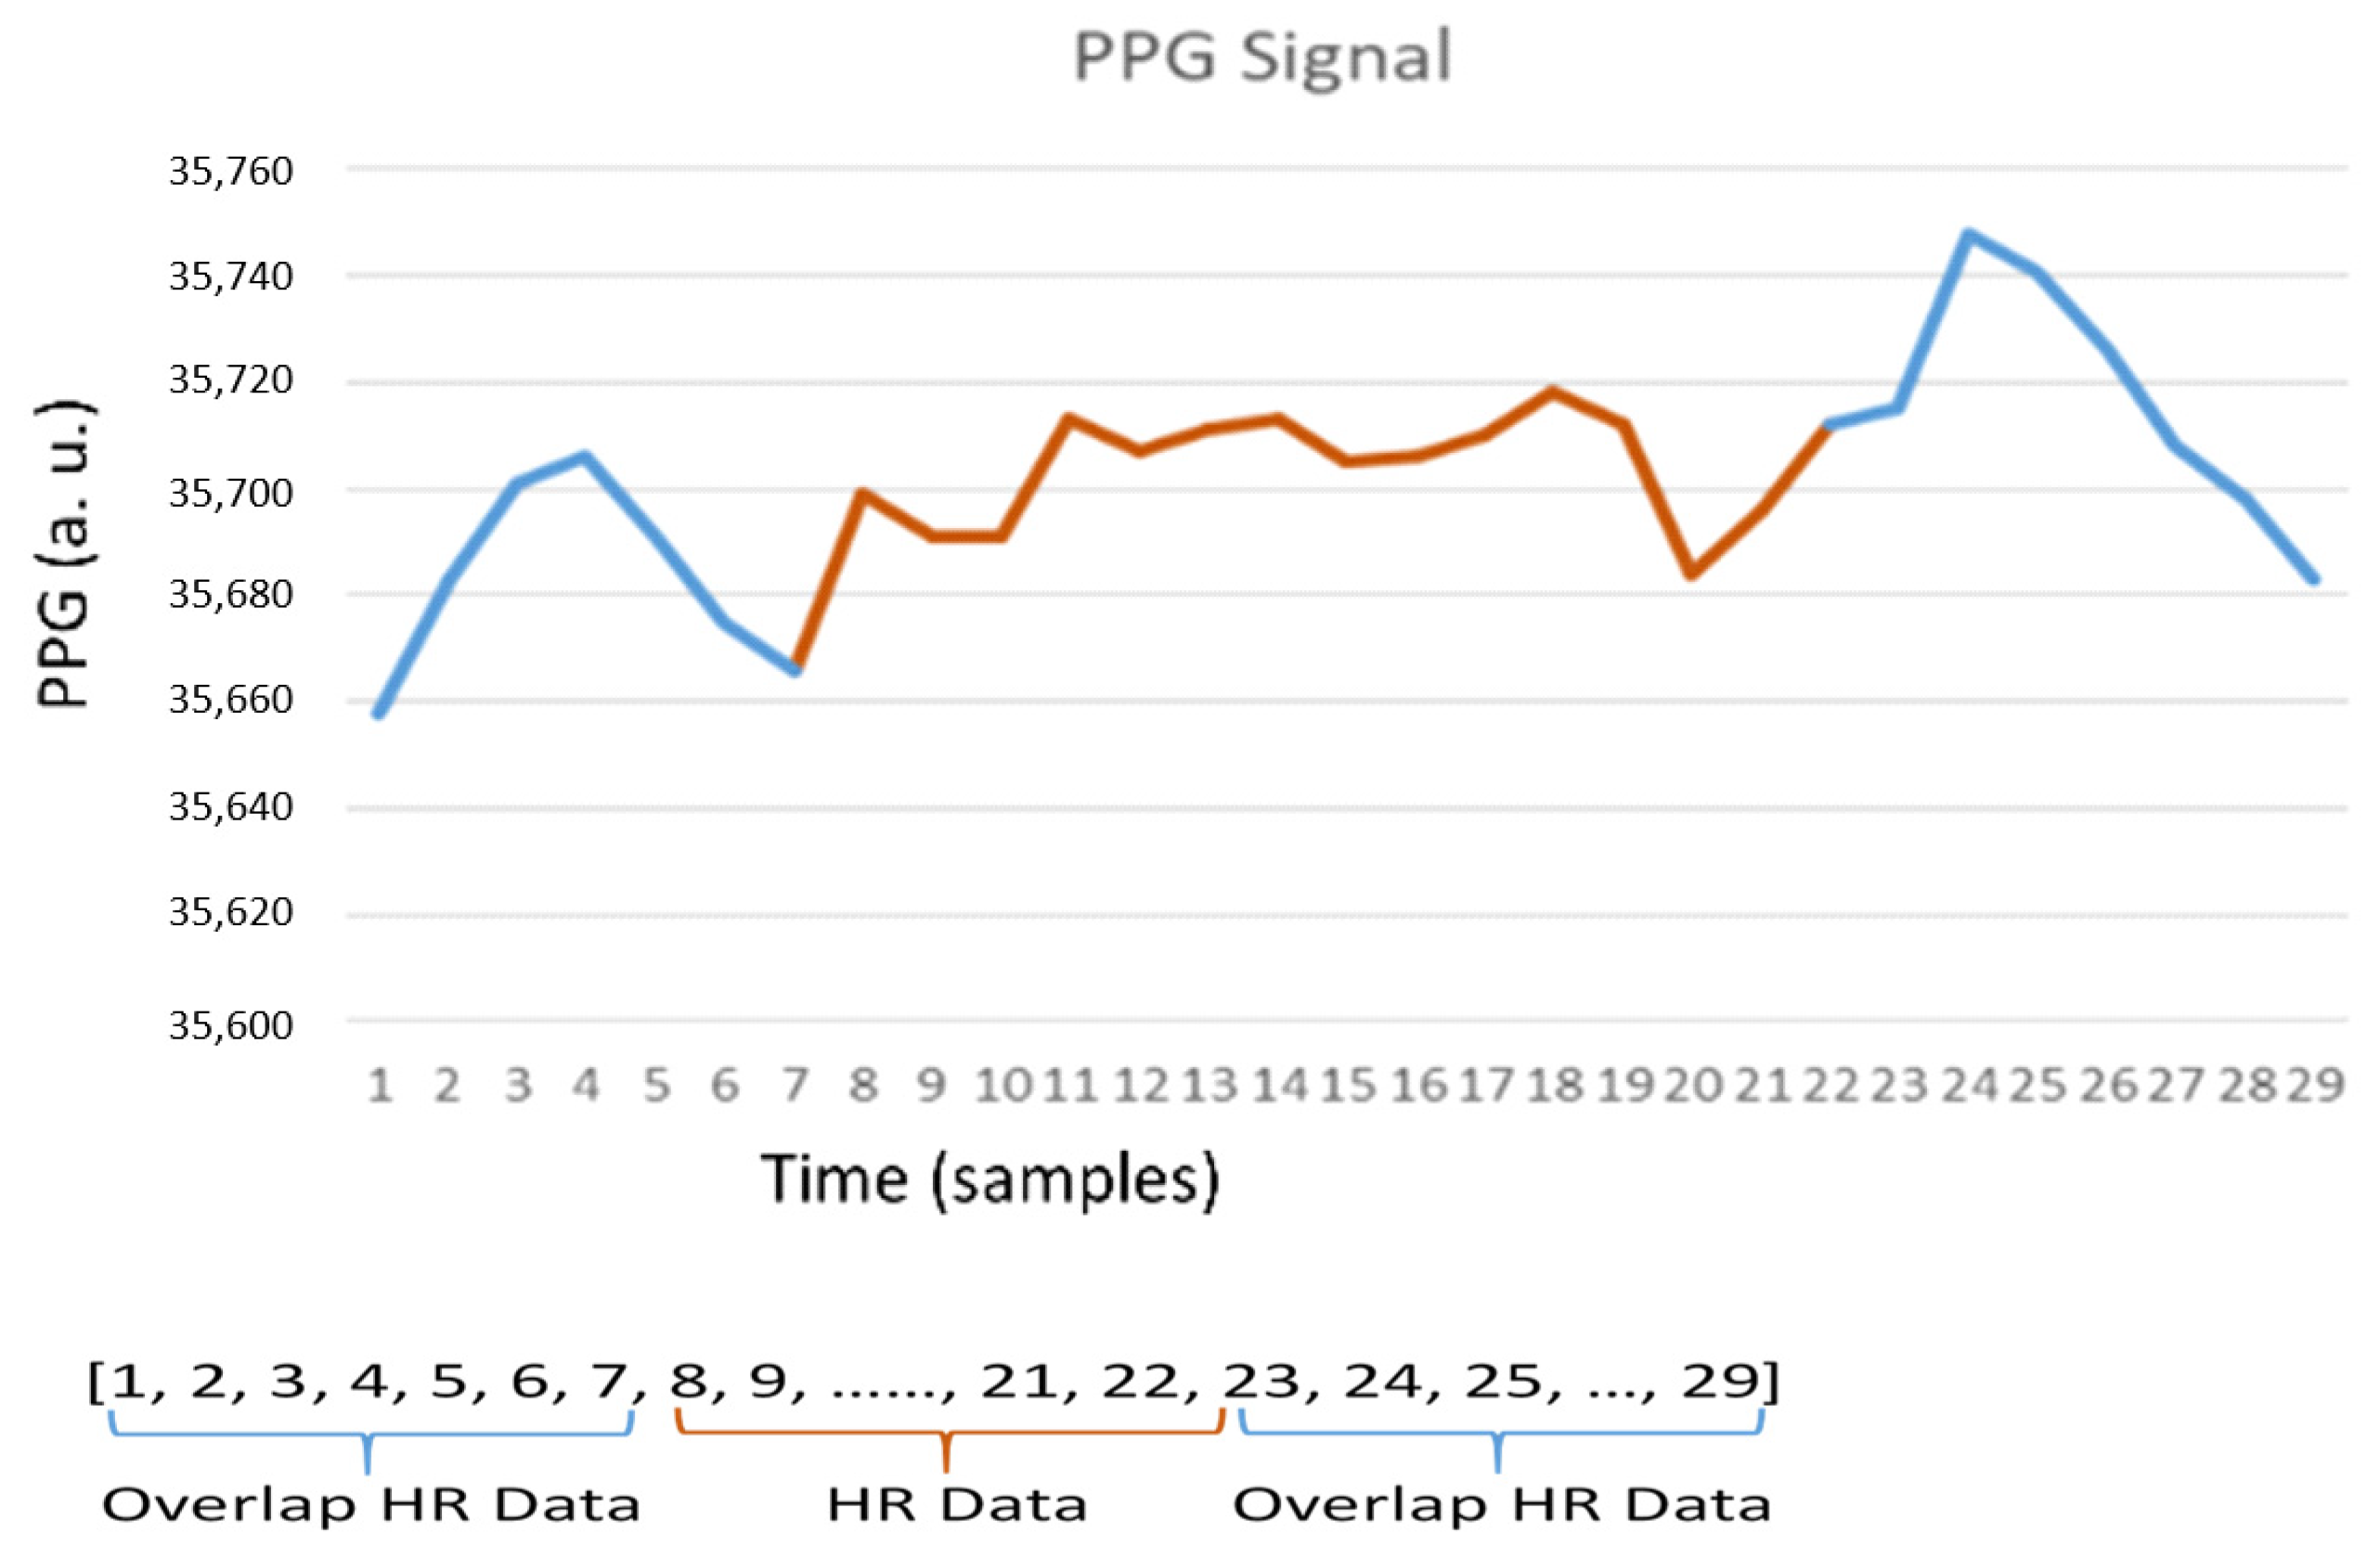
3.2. Principle of Signal Overlapping and Data Processing
3.3. Fuzzy Control Mechanism
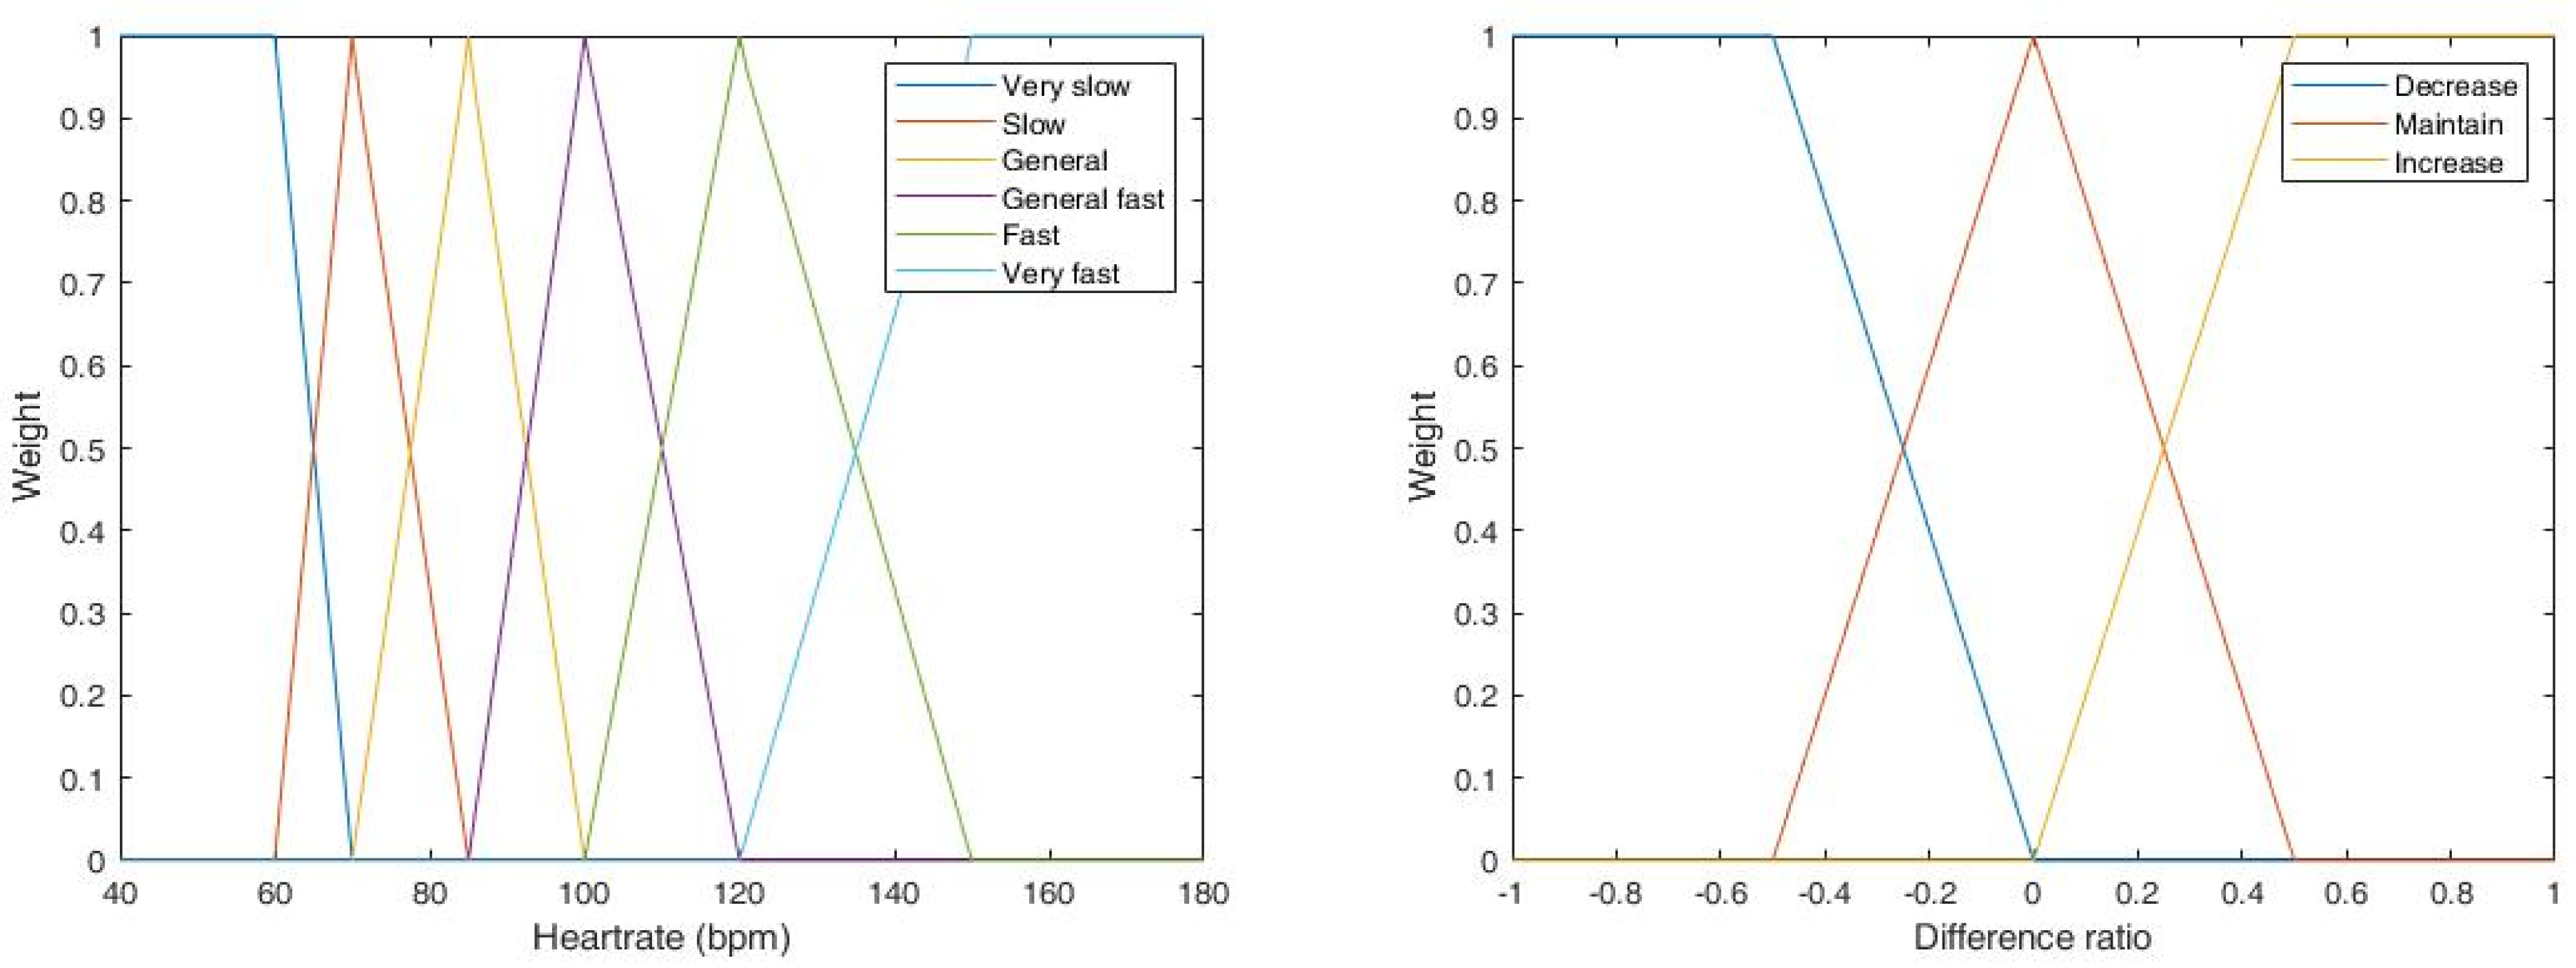
3.3.1. Fuzzy Inputs
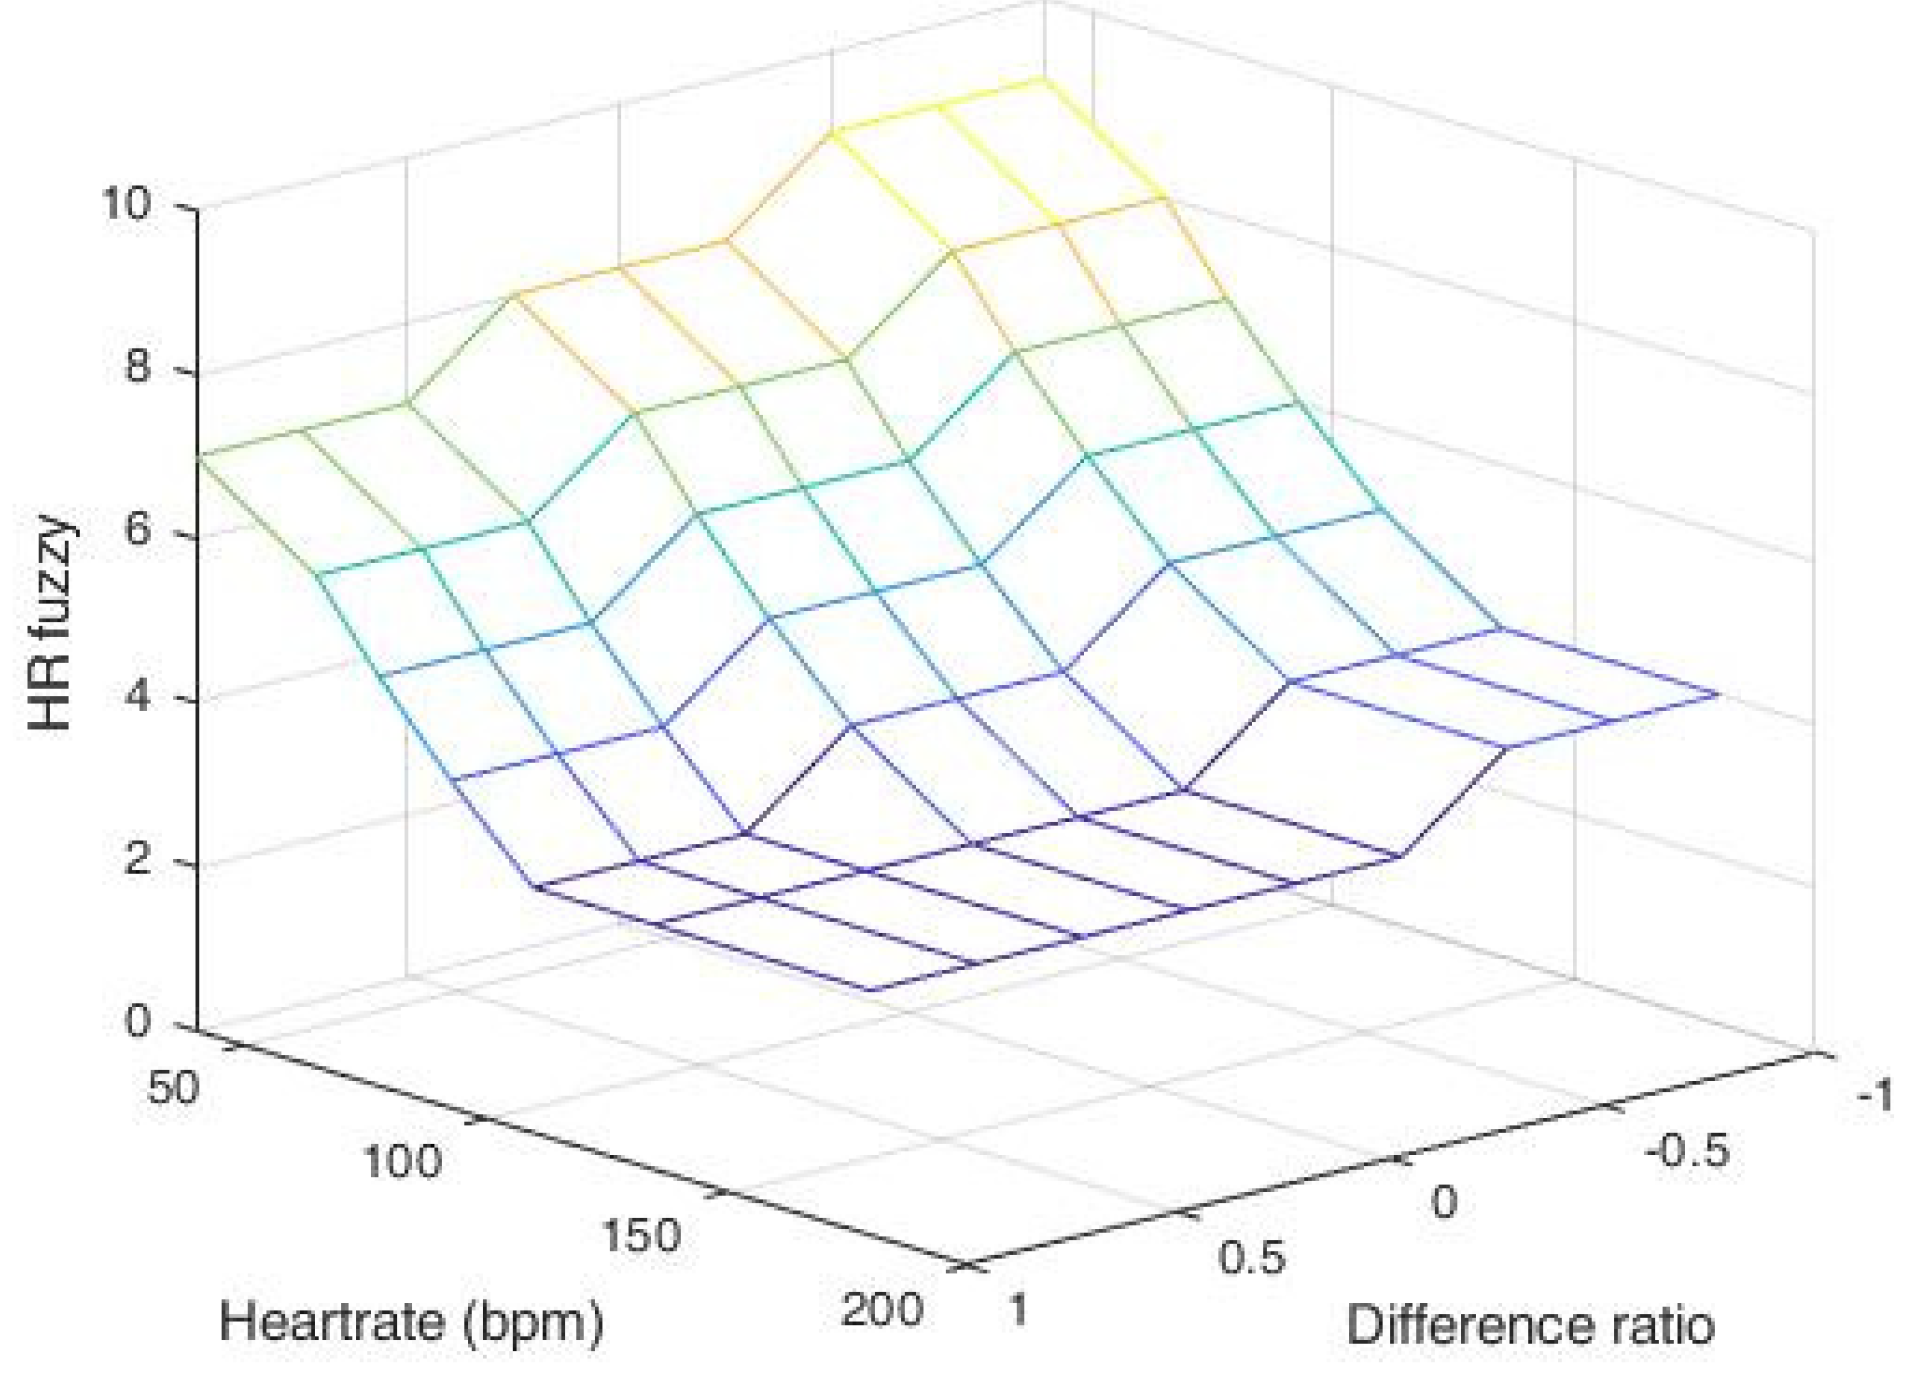
3.3.2. Fuzzy Output
3.4. Detection Threshold
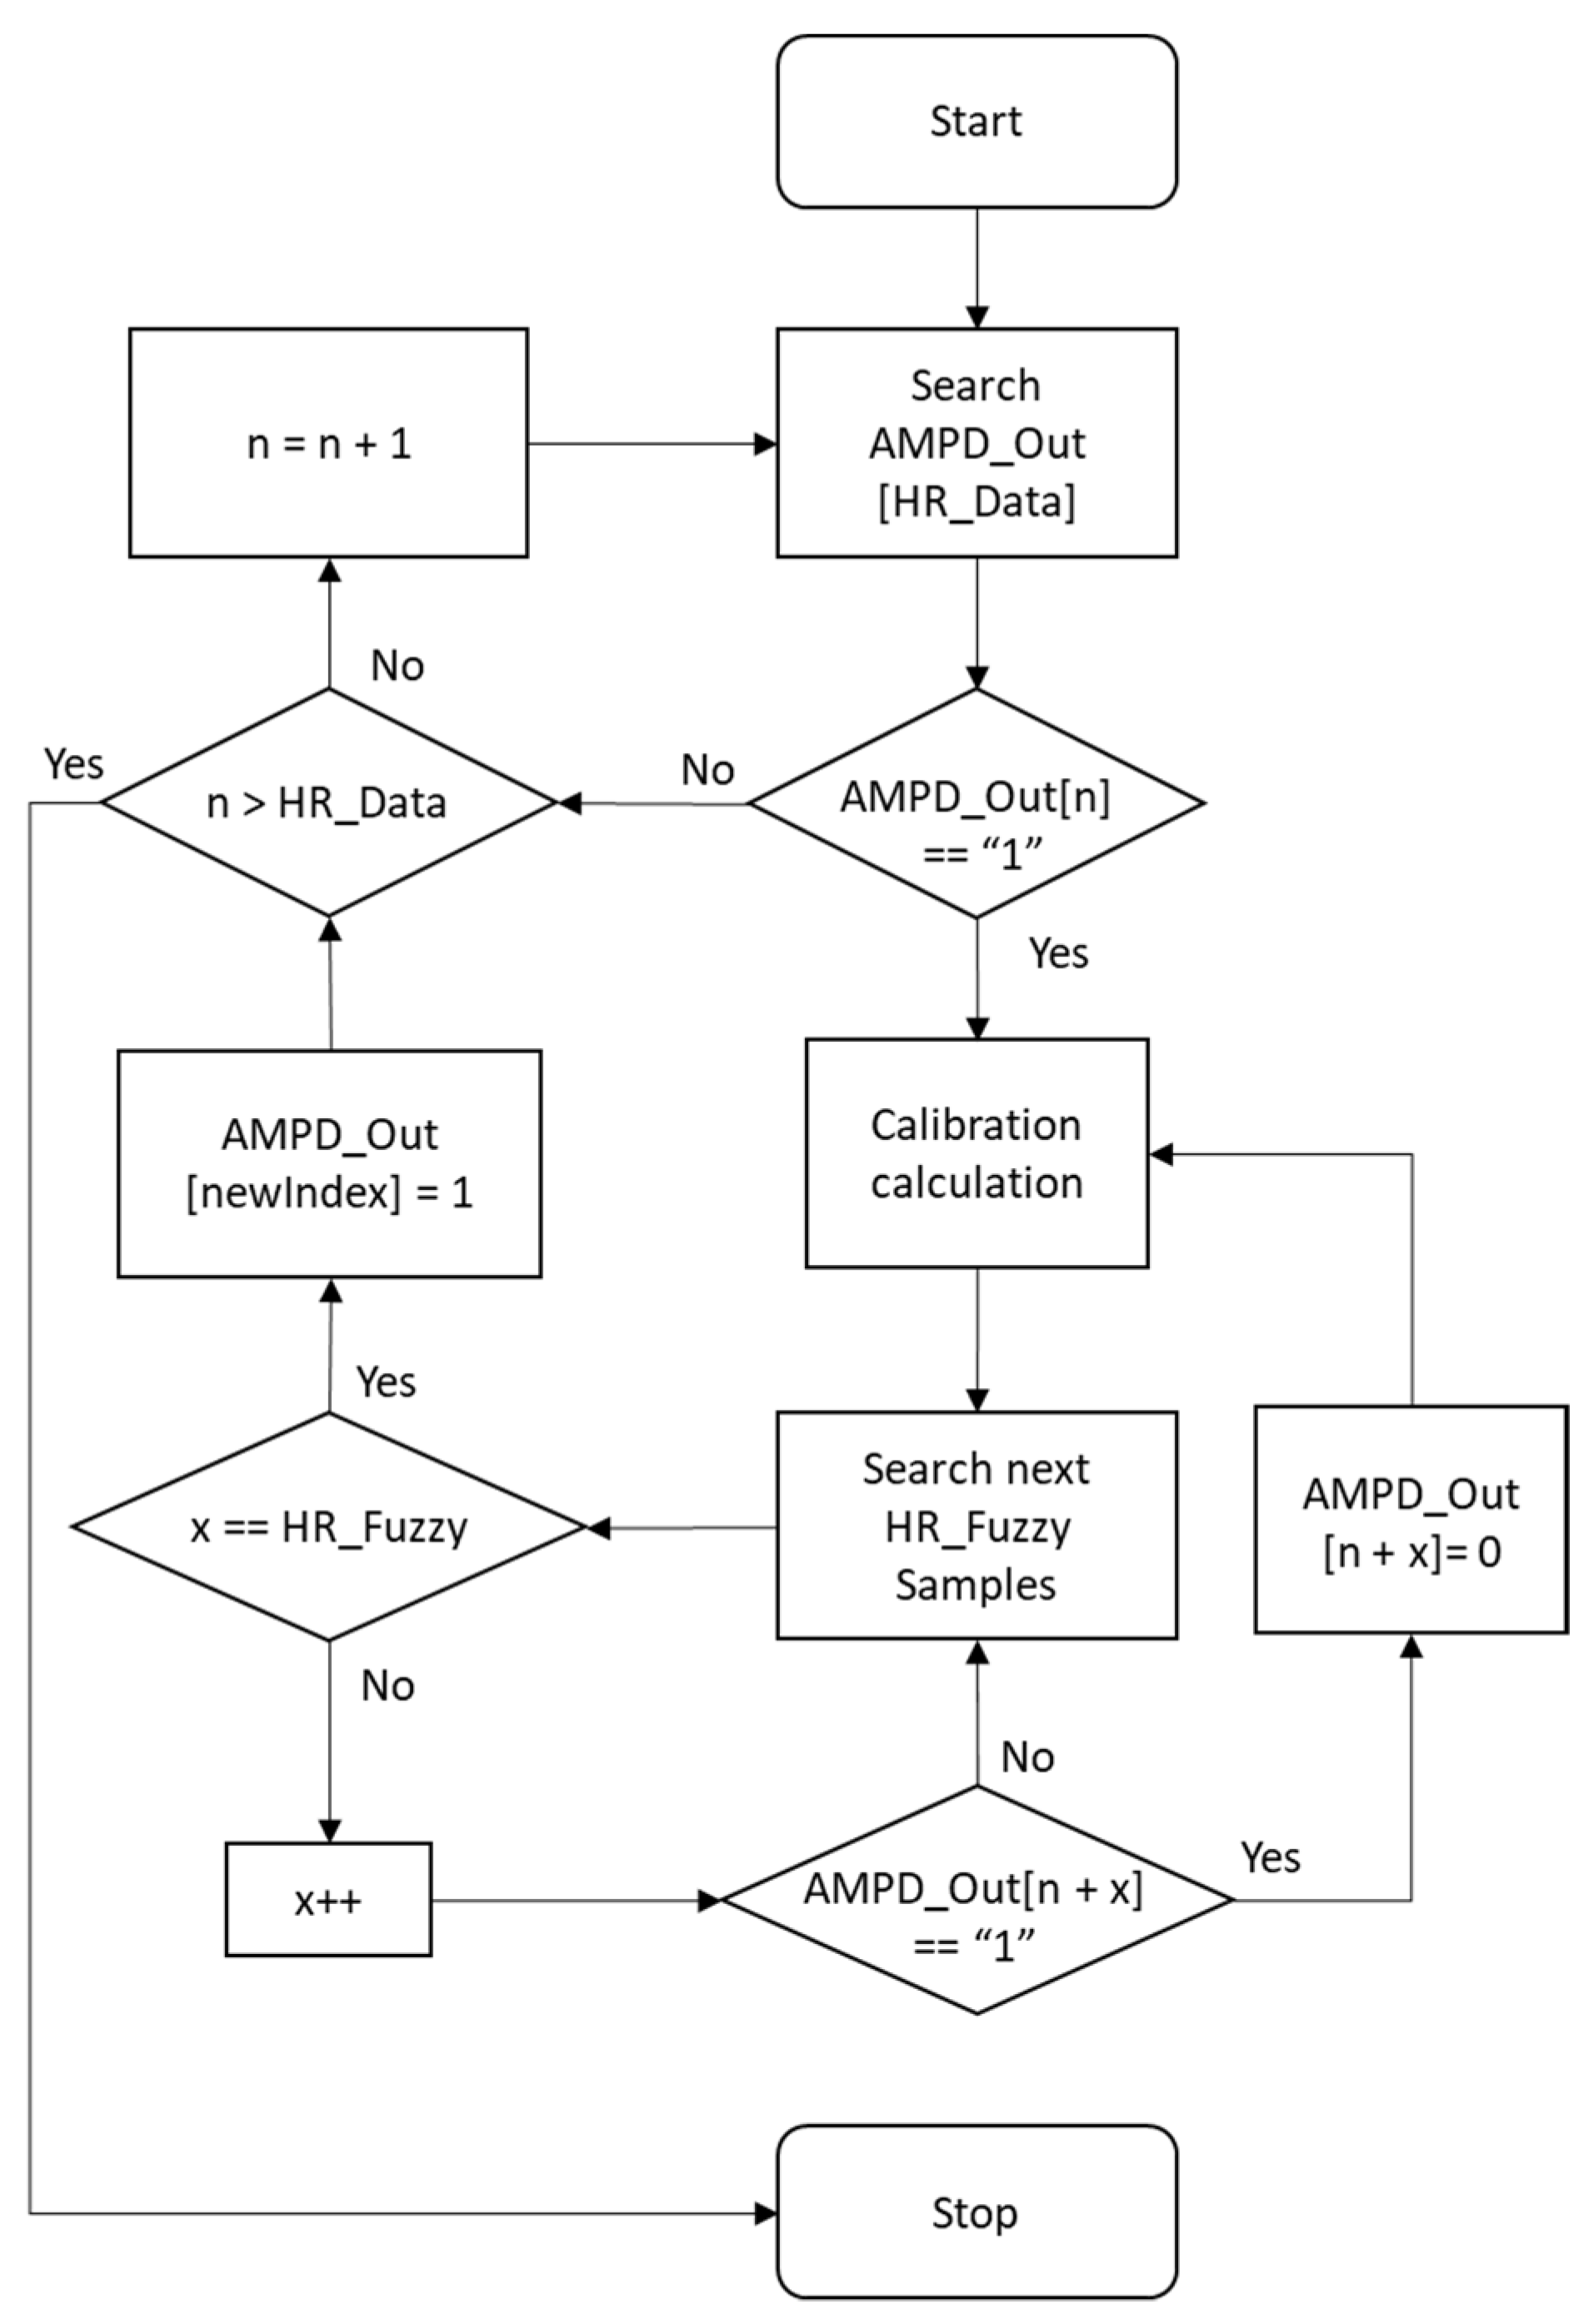
| Algorithm 1. Comparison procedures of the AMPD-Fuzzy. |
|
3.5. Calibration and Detection
| Algorithm 2. Laplacian distribution procedure. |
|
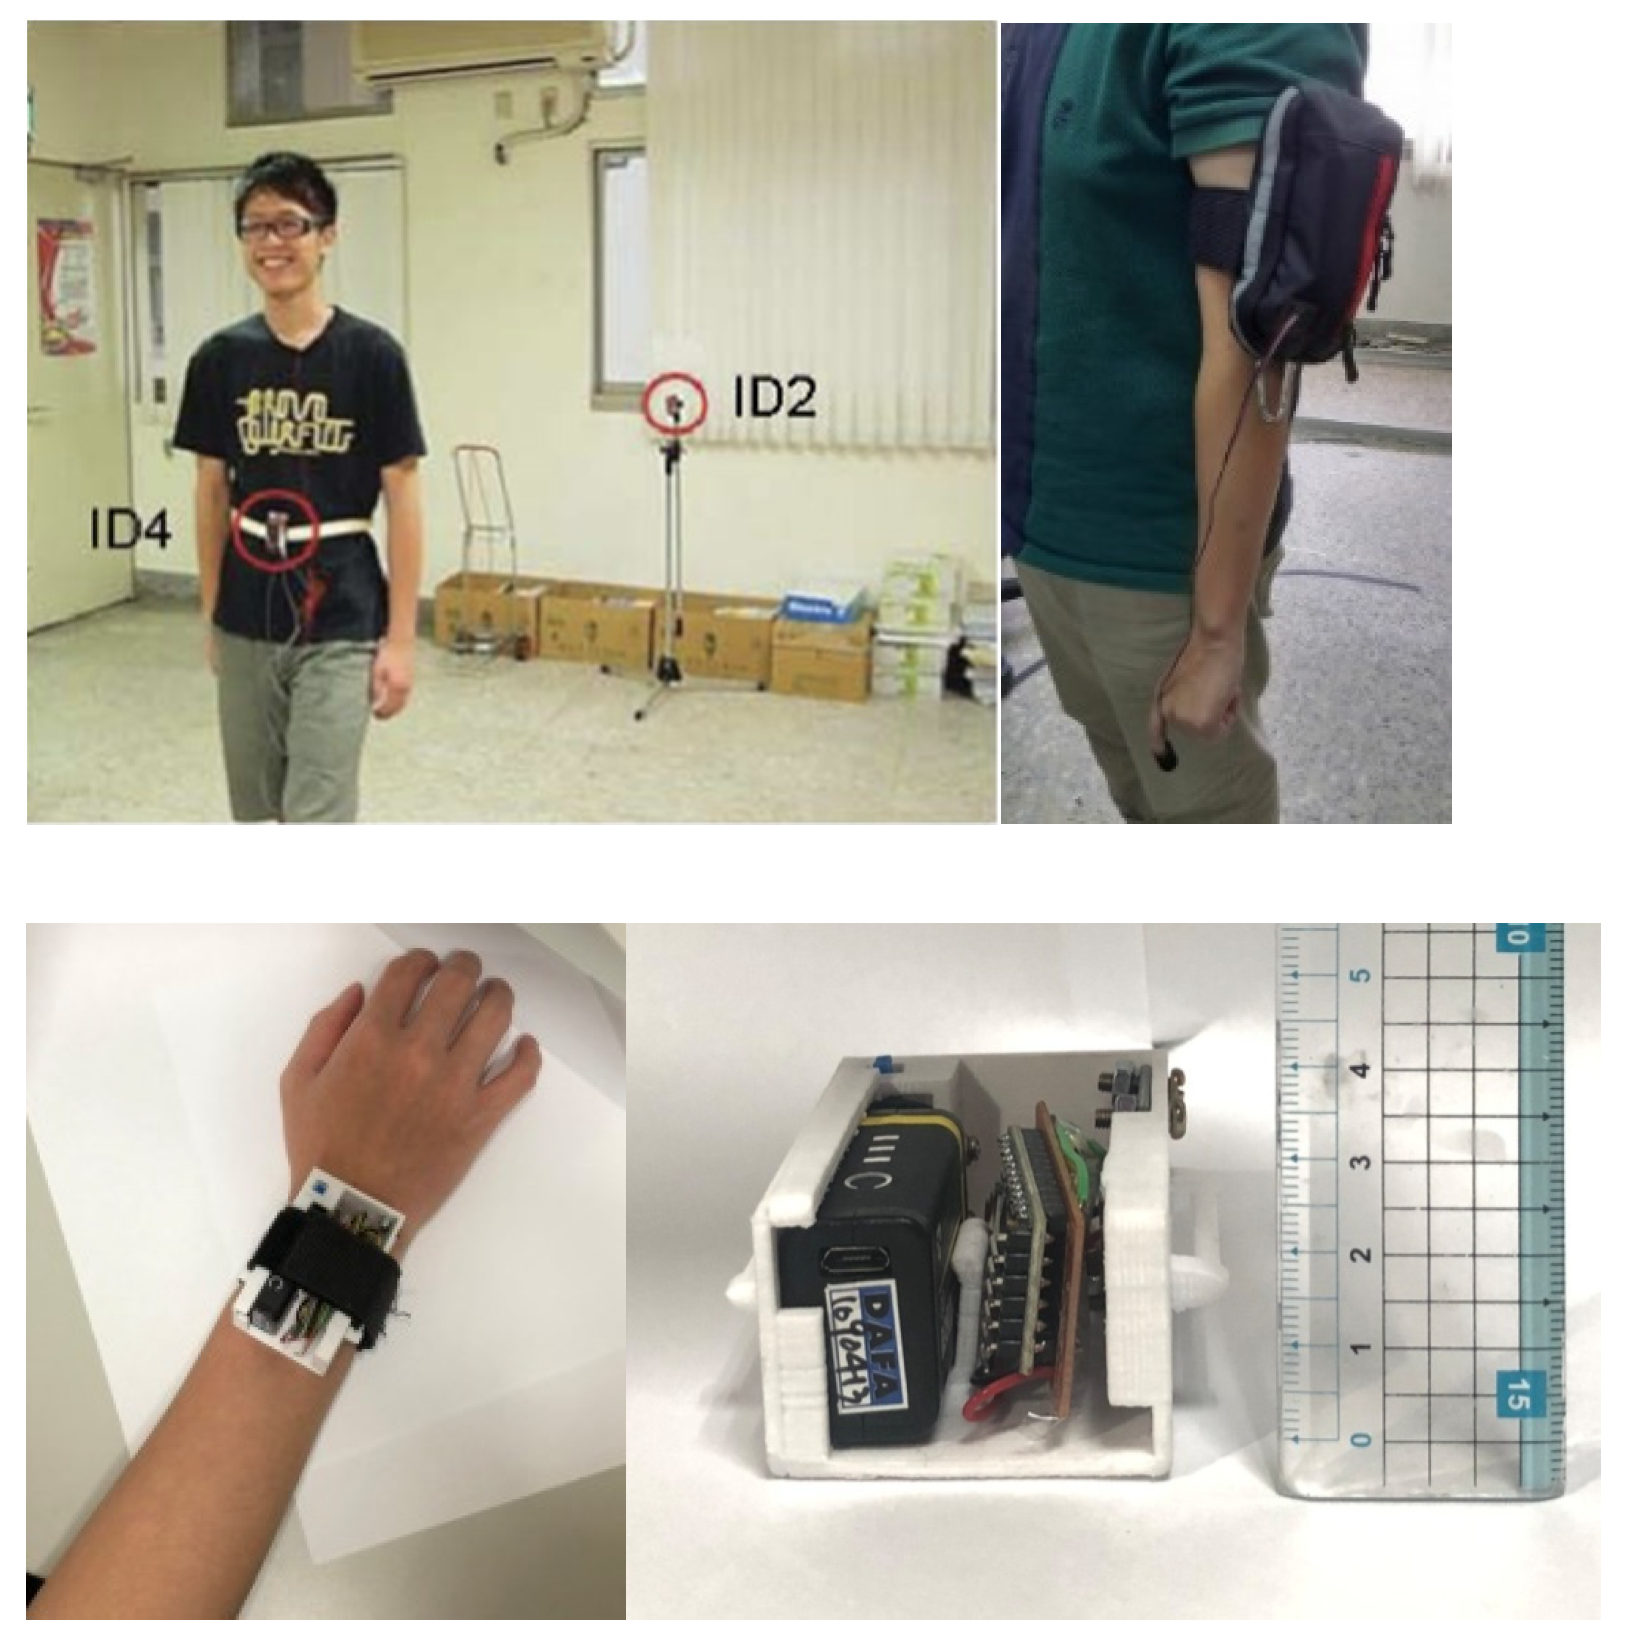
3.6. System Implementation
4. Performance Evaluation
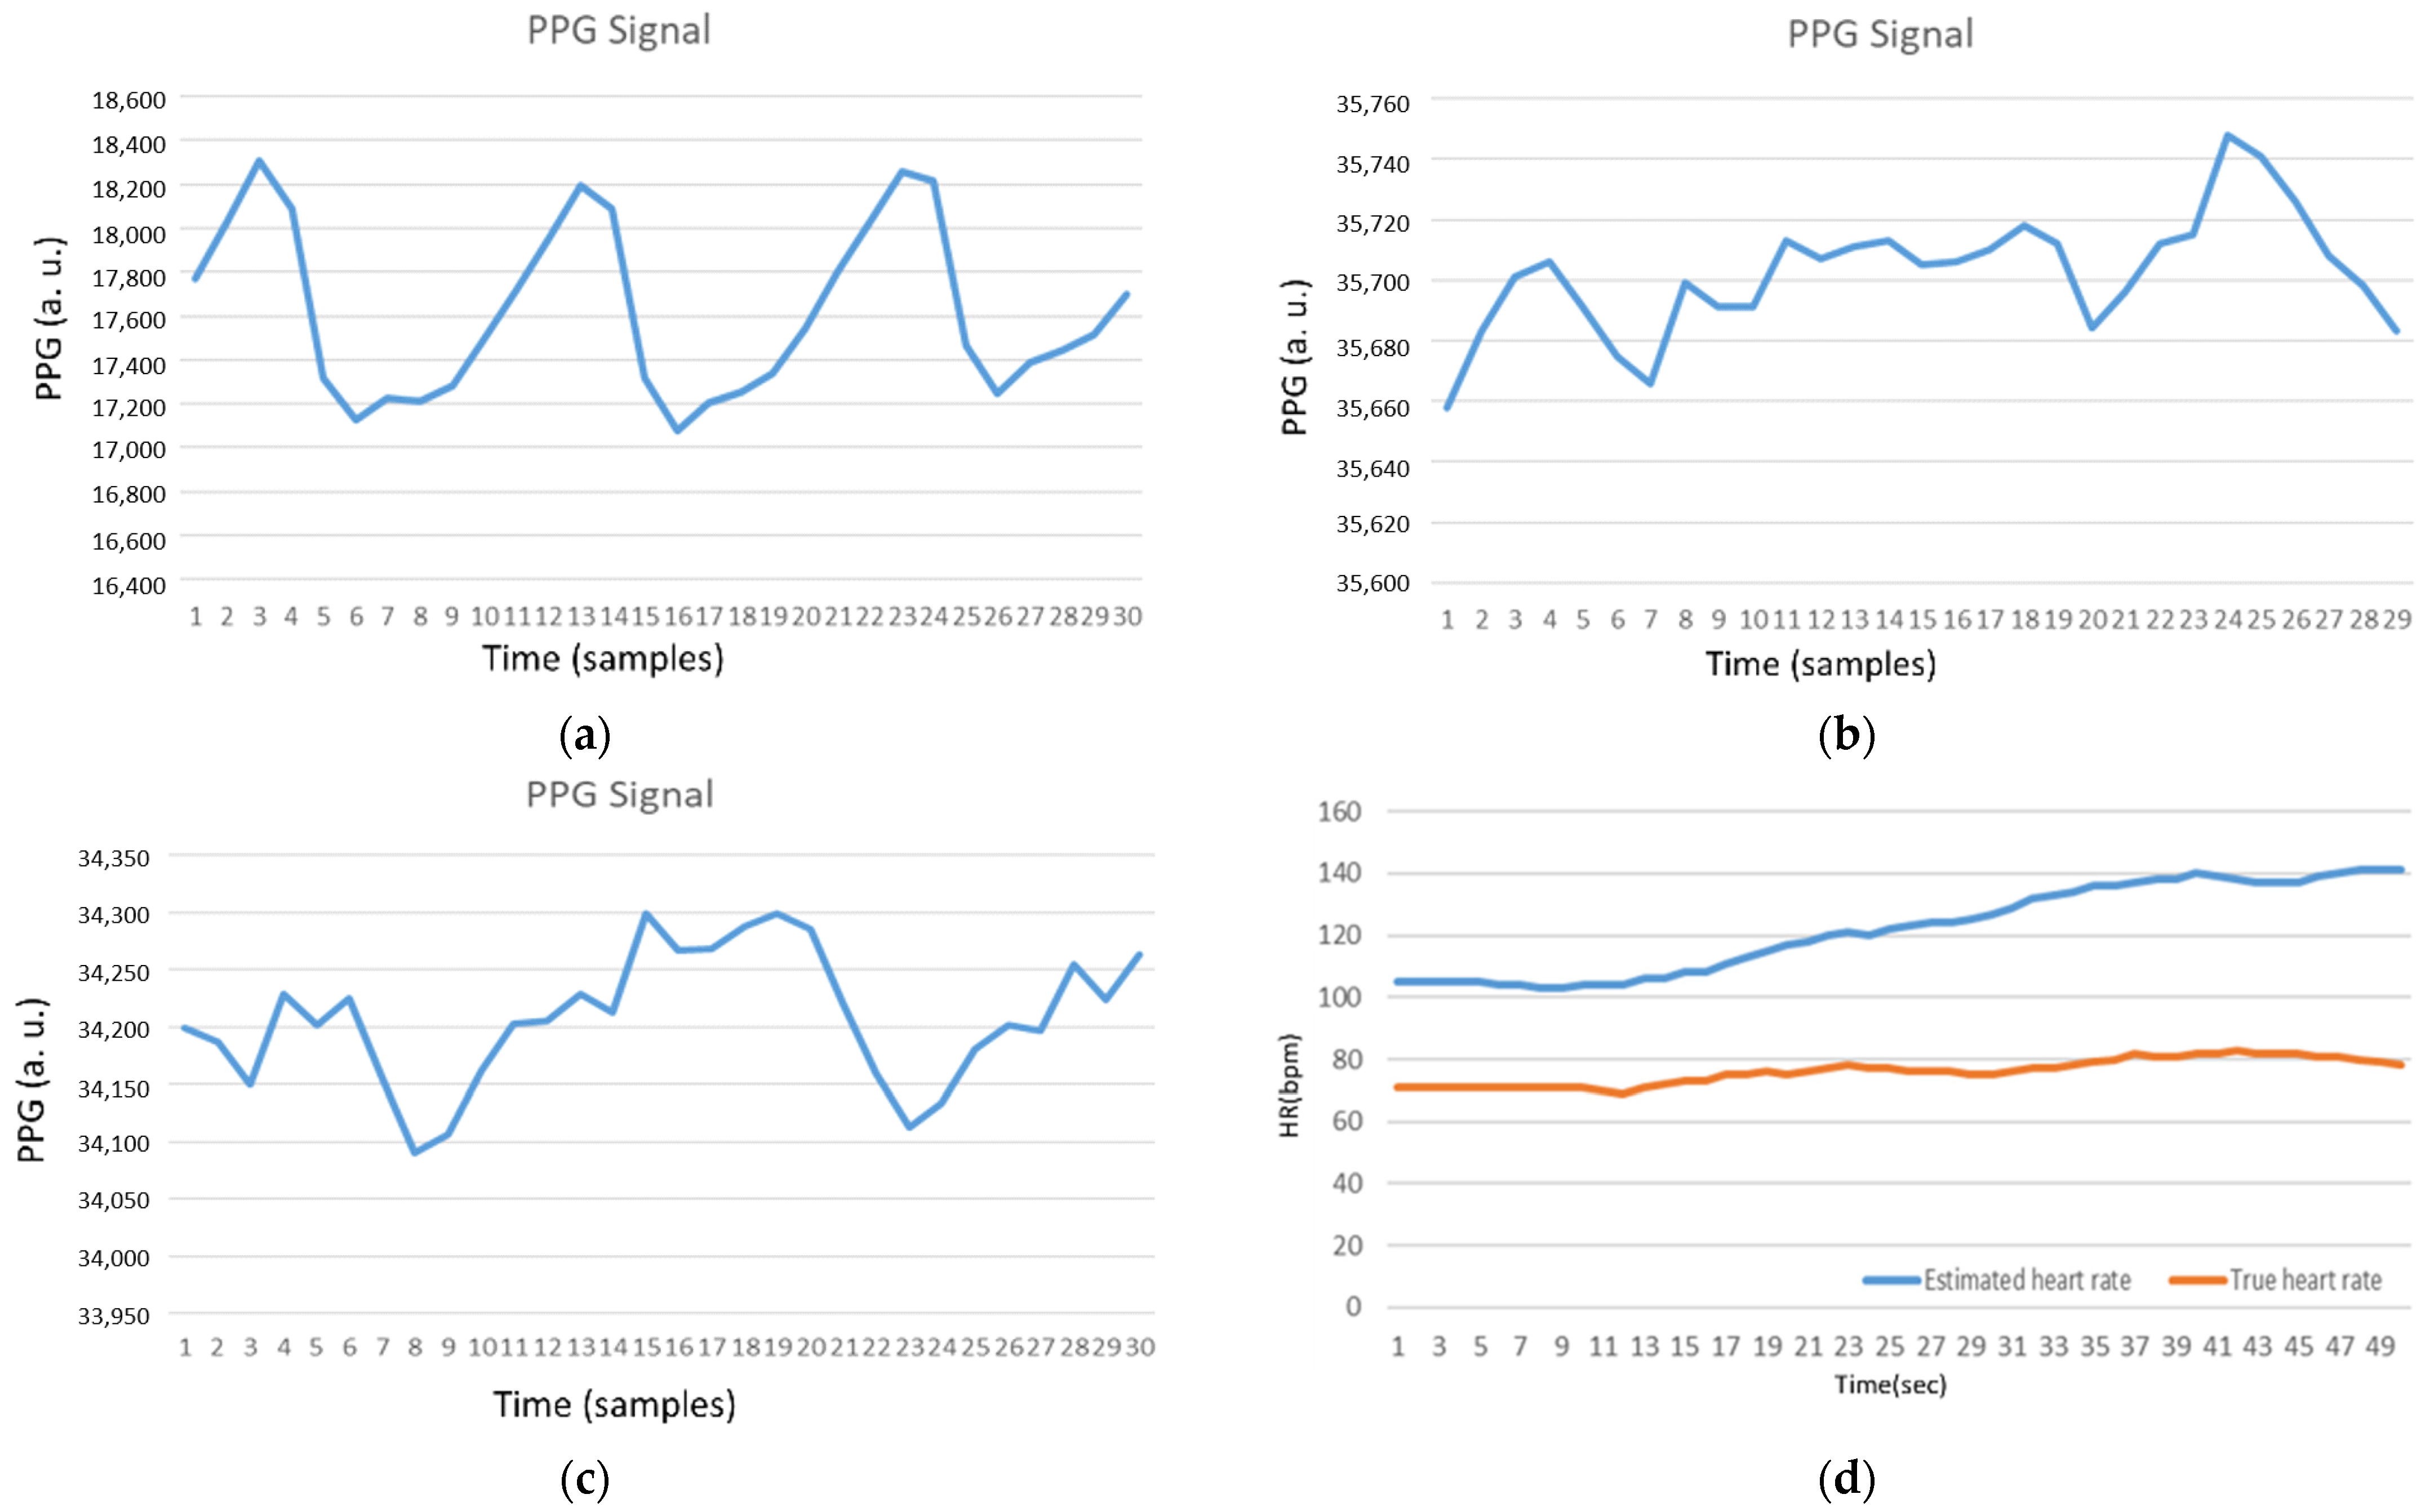
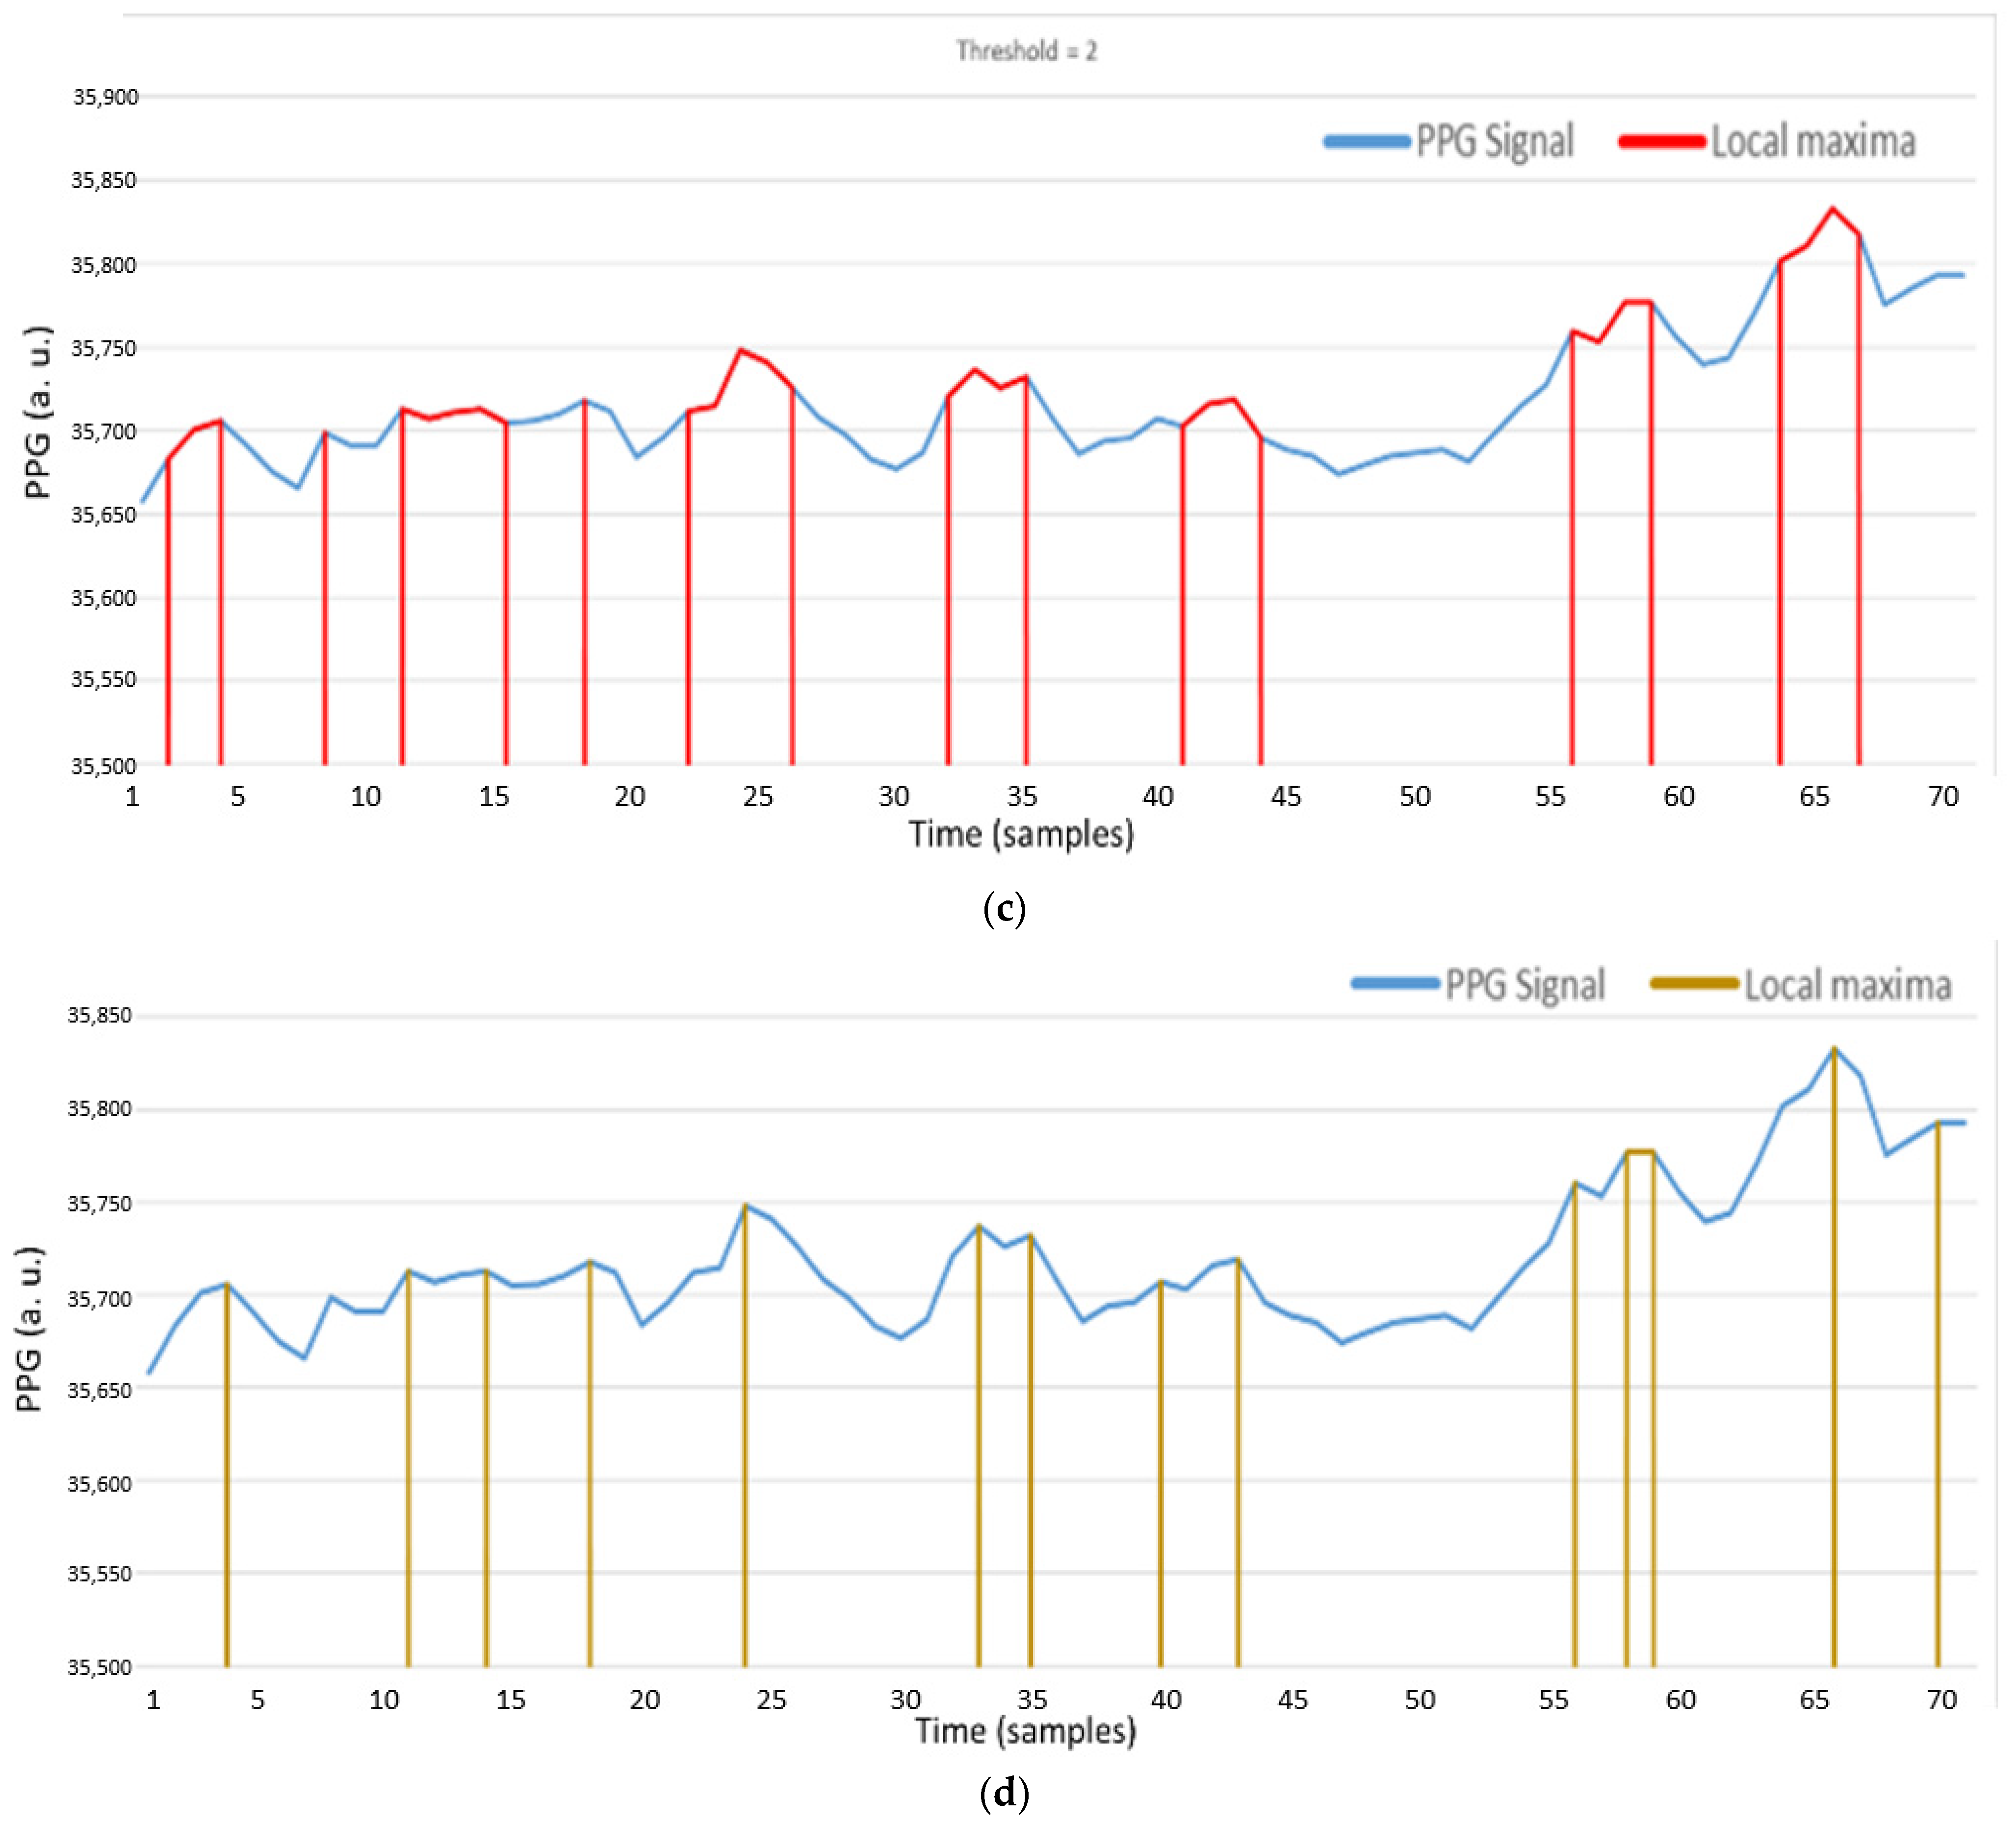
4.1. Experiment 1: Preprocessing
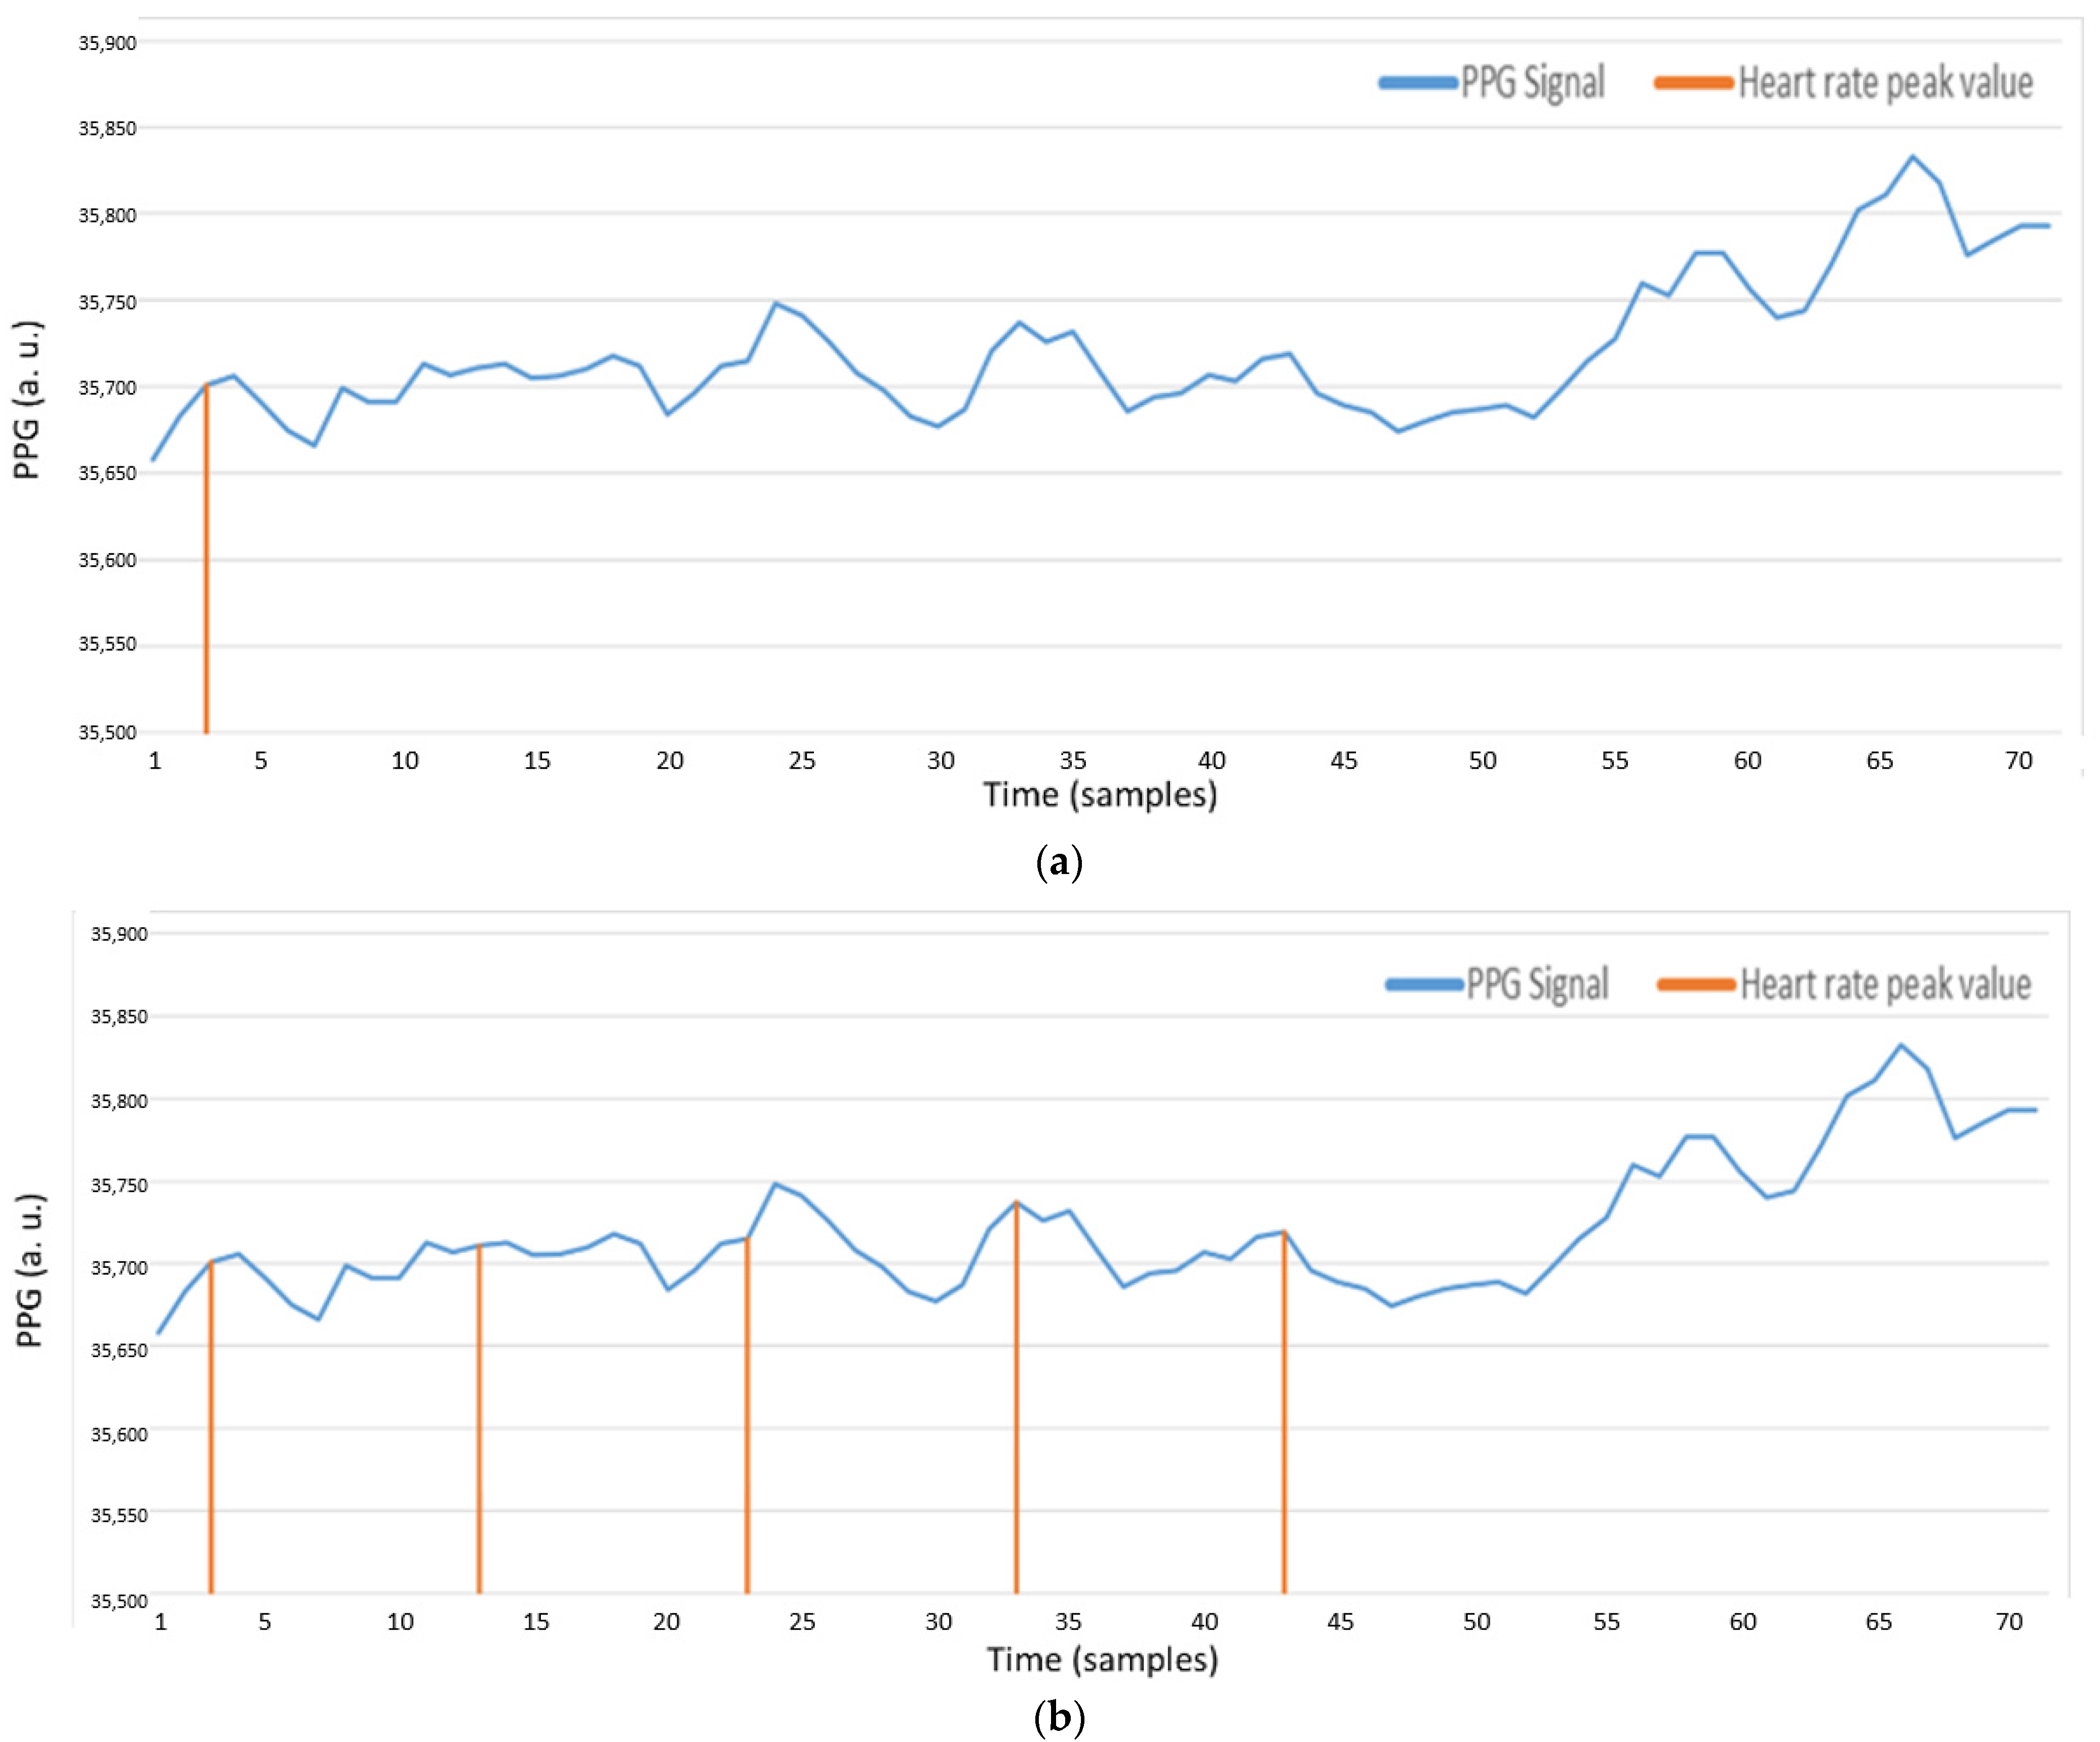
4.2. Experiment 2: AMPD-BL Tracking
4.2.1. Method 1
4.2.2. Method 2
4.2.3. Method 3
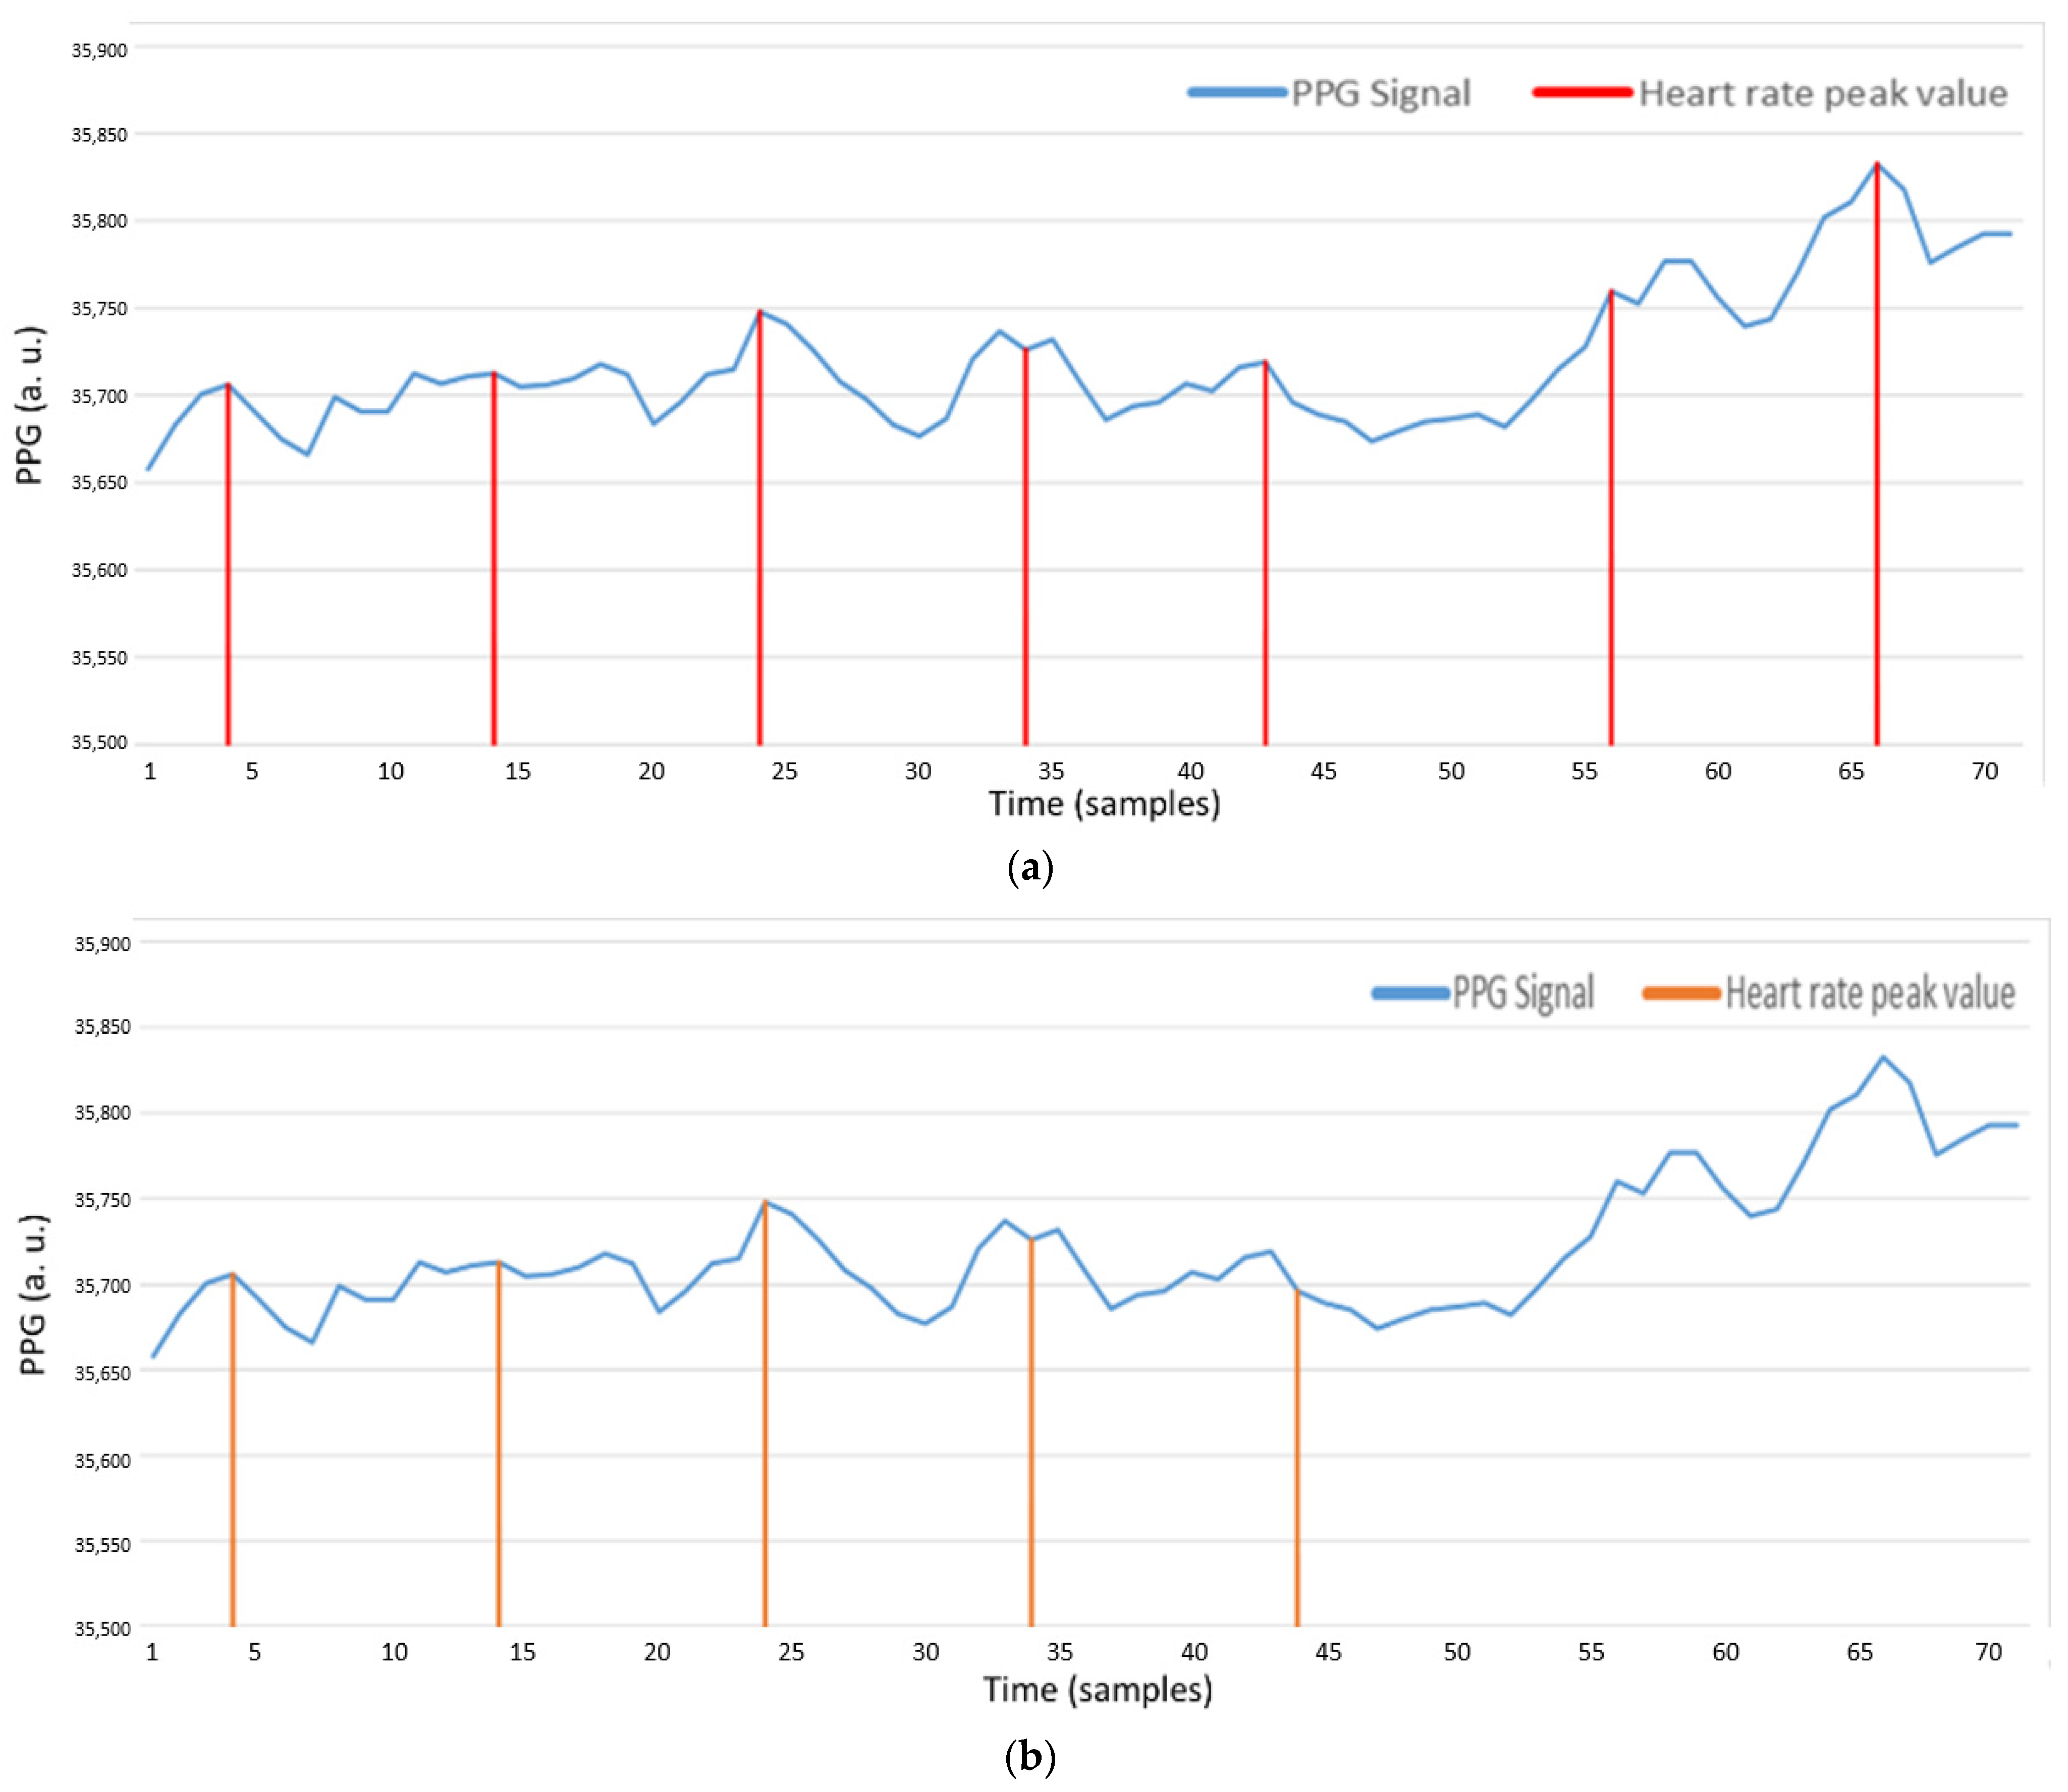
4.3. Experiment 3: AMPD-Fuzzy Tracking
5. Conclusions
Author Contributions
Funding
Data Availability Statement
Acknowledgments
Conflicts of Interest
References
- Rajala, S.; Lindholm, H.; Taipalus, T. Comparison of photoplethysmogram measured from wrist and finger and the effect of measurement location on pulse arrival time. Physiol. Meas. 2018, 39, 075010. [Google Scholar] [CrossRef]
- Esfahani, M.I.M.; Nussbaum, M.A. Preferred Placement and Usability of a Smart Textile System vs. Inertial Measurement Units for Activity Monitoring. Sensors 2018, 18, 2501. [Google Scholar] [CrossRef] [PubMed] [Green Version]
- Wu, M.-F.; Chen, C.-L.; Wen, C.-Y.; Hsu, J.-Y. Design of Pervasive Rehabilitation Monitoring for Chronic Obstructive Pulmonary Disease. IEEE Sens. J. 2013, 13, 4413–4422. [Google Scholar] [CrossRef]
- Wen, T.-M. Using Adaptive Fuzzy Control and Wearable Computing for COPD Rehabilitation. Master’s Thesis, National Chung Hsing University, Taichung, Taiwan, July 2016. [Google Scholar]
- Carlin, B.W. Pulmonary rehabilitation and chronic lung disease: Opportunities for the respiratory therapist. Respir. Care 2009, 54, 1091–1099. [Google Scholar] [PubMed]
- Casaburi, R. A brief history of pulmonary rehabilitation. Respir. Care 2008, 53, 1185–1189. [Google Scholar]
- Lifecare-10 Wearable Multi-Parameter Patient Monitor, North-Vision Tech. Inc. Available online: http://www.north-vision.com/html/front/bin/ptdetail.phtml?Part=pro-01-004&Category=377207 (accessed on 28 August 2021).
- Zhu, P.; Du, H.; Hou, X.; Lu, P.; Wang, L.; Huang, J.; Bai, N.; Wu, Z.; Fang, N.X.; Guo, C.F. Skin-electrode iontronic interface for mechanosensing. Nat. Commun. 2021, 12, 4731. [Google Scholar] [CrossRef]
- Haykin, S. Adaptive Filter Theory; Prentice Hall: Hoboken, NJ, USA, 2002. [Google Scholar]
- Chen, G.; Xie, W.; Zhao, Y. Wavelet-Based Denoising: A Brief Review. In Proceedings of the 2013 Fourth International Conference on Intelligent Control and Information Processing (ICICIP), Beijing, China, 9–11 June 2013; pp. 570–574. [Google Scholar]
- Stone, J.V. Independent Component Analysis: A Tutorial Introduction; MIT Press: Cambridge, MA, USA, 2004; ISBN 978-0-262-69315-8. [Google Scholar]
- Huang, N.E.; Shen, Z.; Long, S.R.; Wu, M.C.; Shih, H.H.; Zheng, Q.; Yen, N.-C.; Tung, C.C.; Liu, H.H. The empirical mode decomposition and the Hilbert spectrum for nonlinear and non-stationary time series analysis. Proc. R. Soc. Lond. 1998, 454, 903–995. [Google Scholar] [CrossRef]
- Civera, M.; Surace, C. A Comparative Analysis of Signal Decomposition Techniques for Structural Health Monitoring on an Experimental Benchmark. Sensors 2021, 21, 1825. [Google Scholar] [CrossRef] [PubMed]
- Chang, X.; Li, G.; Xing, G.; Zhu, K.; Tu, L. DeepHeart: A Deep Learning Approach for Accurate Heart Rate Estimation from PPG Signals. ACM Trans. Sens. Netw. 2021, 17, 14:1–14:18. [Google Scholar] [CrossRef]
- Scholkmann, F.; Boss, J.; Wolf, M. An efficient algorithm for automatic peak detection in noisy periodic and quasi-periodic signals. Algorithms 2012, 5, 588–603. [Google Scholar] [CrossRef] [Green Version]
- Castaneda, D.; Esparza, A.; Ghamari, M.; Soltanpur, C.; Nazeran, H. A review on wearable photoplethysmography sensors and their potential future applications in health care. Int. J. Biosens. Bioelectron. 2018, 4, 195–202. [Google Scholar] [CrossRef] [Green Version]
- Lee, Y.; Shin, H.; Jo, J.; Lee, Y.-K. Development of A Wristwatch-Type PPG Array Sensor Module. In Proceedings of the 2011 IEEE International Conference on Consumer Electronics-Berlin (ICCE-Berlin), Berlin, Germany, 6–8 September 2011; Volume 2011, pp. 168–171. [Google Scholar]
- Thomas, S.S.; Nathan, V.; Zong, C.; Soundarapandian, K.; Shi, X.; Jafari, R. BioWatch: A Noninvasive Wrist-Based Blood Pressure Monitor That Incorporates Training Techniques for Posture and Subject Variability. IEEE J. Biomed. Health Inform. 2015, 20, 1291–1300. [Google Scholar] [CrossRef]
- Ismail, S.; Akram, U.; Siddiqi, I. Heart rate tracking in photoplethysmography signals affected by motion artifacts: A review. EURASIP J. Adv. Signal Process. 2021, 2021, 5. [Google Scholar] [CrossRef]
- Zong, C.; Jafari, R. Robust heart rate estimation using wrist-based PPG signals in the presence of intense physical activities. In Proceedings of the 37th Annual International Conference of the IEEE Engineering in Medicine and Biology Society (EMBC), Milano, Italy, 25–29 August 2015. [Google Scholar] [CrossRef]
- Fine, J.; Branan, K.; Rodriguez, A.; Boonya-Ananta, T.; Ramella-Roman, J.; McShane, M.; Coté, G. Sources of Inaccuracy in Photoplethysmography for Continuous Cardiovascular Monitoring. Biosensors 2021, 11, 126. [Google Scholar] [CrossRef]
- Bent, B.; Goldstein, B.A.; Kibbe, W.A.; Dunn, J.P. Investigating sources of inaccuracy in wearable optical heart rate sensors. NPJ Digit. Med. 2020, 3, 18. [Google Scholar] [CrossRef] [PubMed] [Green Version]
- Biswas, D.; Everson, L.; Liu, M.; Panwar, M.; Verhoef, B.-E.; Patki, S.; Kim, C.H.; Acharyya, A.; Van Hoof, C.; Konijnenburg, M.; et al. CorNET: Deep Learning Framework for PPG-Based Heart Rate Estimation and Biometric Identification in Ambulant Environment. IEEE Trans. Biomed. Circuits Syst. 2019, 13, 282–291. [Google Scholar] [CrossRef]
- Reiss, A.; Indlekofer, I.; Schmidt, P.; Van Laerhoven, K. Deep PPG: Large-Scale Heart Rate Estimation with Convolutional Neural Networks. Sensors 2019, 19, 3079. [Google Scholar] [CrossRef] [PubMed] [Green Version]
- Cicone, A.; Wu, H.-T. How Nonlinear-Type Time-Frequency Analysis Can Help in Sensing Instantaneous Heart Rate and Instantaneous Respiratory Rate from Photoplethysmography in a Reliable Way. Front. Physiol. 2017, 8, 701. [Google Scholar] [CrossRef] [Green Version]
- Masinelli, G.; Dell’Agnola, F.; Valdés, A.; Atienza, D. SPARE: A Spectral Peak Recovery Algorithm for PPG Signals Pulsewave Reconstruction in Multimodal Wearable Devices. Sensors 2021, 21, 2725. [Google Scholar] [CrossRef]
- Temko, A. Accurate Heart Rate Monitoring During Physical Exercises Using PPG. IEEE Trans. Biomed. Eng. 2017, 64, 2016–2024. [Google Scholar] [CrossRef] [Green Version]
- Yang, D.; Cheng, Y.; Zhu, J.; Xue, D.; Abt, G.; Ye, H.; Peng, Y. A Novel Adaptive Spectrum Noise Cancellation Approach for Enhancing Heartbeat Rate Monitoring in a Wearable Device. IEEE Access 2018, 6, 8364–8375. [Google Scholar] [CrossRef]
- Alqaraawi, A.; Alwosheel, A.; Alasaad, A. Heart rate variability estimation in photoplethysmography signals using Bayesian learning approach. Healthc. Technol. Lett. 2016, 3, 136–142. [Google Scholar] [CrossRef] [PubMed] [Green Version]
- Quer, G.; Rao, R.R. A Bayesian model of heart rate to reveal real-time physiological information. In Proceedings of the 2012 IEEE 14th International Conference on e-Health Networking, Applications and Services (Healthcom), Beijing, China, 10–13 October 2012; pp. 223–229. [Google Scholar] [CrossRef]
- PDF of Beta Function. Available online: https://en.wikipedia.org/wiki/Beta_distribution (accessed on 28 August 2021).
- MPU6050 Datasheet. Available online: http://www.haoyuelectronics.com/Attachment/GY-521/mpu6050.pdf (accessed on 28 August 2021).
- SparkFun High-Sensitivity Optical Sensor for Smoke Detection Applications. Available online: https://cdn.sparkfun.com/assets/learn_tutorials/5/7/7/MAX30105_3.pdf (accessed on 28 August 2021).
- Taiwan IOT Studio. Available online: https://www.taiwaniot.com.tw/ (accessed on 28 August 2021).
- Nelson, B.W.; Allen, N.B. Accuracy of Consumer Wearable Heart Rate Measurement during an Ecologically Valid 24-Hour Period: Intraindividual Validation Study. JMIR Mhealth Uhealth 2019, 7, e10828. [Google Scholar] [CrossRef] [PubMed]


| Methods | Features | Limitations |
|---|---|---|
| Masinelli [26] |
|
|
| Temko [27] |
|
|
| Yang [28] |
|
|
| AMPD-BL [29] |
|
|
| Proposed AMPD-Fuzzy | For a low intensity activity, the proposed algorithm achieves:
| For an intensive exercise, a large variation of heart rate prediction is observed |
| Heart Rate Range | Min | Max |
|---|---|---|
| ‘Trapezoid’, [0 0 60 70] | 0 | 65 |
| ‘Triangle’, [60 70 85] | 65 | 77.5 |
| ‘Triangle’, [70 85 100] | 77.5 | 92.5 |
| ‘Triangle’, [85 100 120] | 92.5 | 110 |
| ‘Triangle’, [100 120 150] | 110 | 135 |
| ‘Trapezoid’, [130 150 180 180] | 135 | 180 |
| Peak Interval (the Range of Sample Indices) | Heart Rate (bpm) |
|---|---|
| 10 | 60 |
| 9 | 66.6 |
| 8 | 75 |
| 7 | 85.7 |
| 6 | 100 |
| 5 | 120 |
| 4 | 150 |
| 3 | 200 |
| DR | Down | Maintain | Up | |
|---|---|---|---|---|
| HR | ||||
| Very slow | 9 | 8 | 7 | |
| Slow | 8 | 7 | 6 | |
| General | 7 | 6 | 5 | |
| General fast | 6 | 5 | 4 | |
| Fast | 5 | 4 | 3 | |
| Very Fast | 4 | 3 | 3 | |
| Methods | Avg. MAE (bpm) | Avg. RMSE (bpm) |
|---|---|---|
| AMPD-BL | 3.00 | 3.91 |
| AMPD-Fuzzy | 0.29 | 0.76 |
| Methods | Avg. MAE (bpm) | Avg. RMSE (bpm) |
|---|---|---|
| AMPD-Fuzzy (Finger) | 0.82 | 0.90 |
| AMPD-Fuzzy (Dynamic Wrist) | 6.83 | 8.05 |
Publisher’s Note: MDPI stays neutral with regard to jurisdictional claims in published maps and institutional affiliations. |
© 2021 by the authors. Licensee MDPI, Basel, Switzerland. This article is an open access article distributed under the terms and conditions of the Creative Commons Attribution (CC BY) license (https://creativecommons.org/licenses/by/4.0/).
Share and Cite
Kuo, T.-H.; Teng, C.-M.; Wu, M.-F.; Wen, C.-Y. An Adaptive Heart Rate Monitoring Algorithm for Wearable Healthcare Devices. Electronics 2021, 10, 2092. https://doi.org/10.3390/electronics10172092
Kuo T-H, Teng C-M, Wu M-F, Wen C-Y. An Adaptive Heart Rate Monitoring Algorithm for Wearable Healthcare Devices. Electronics. 2021; 10(17):2092. https://doi.org/10.3390/electronics10172092
Chicago/Turabian StyleKuo, Tz-Hau, Chi-Min Teng, Ming-Feng Wu, and Chih-Yu Wen. 2021. "An Adaptive Heart Rate Monitoring Algorithm for Wearable Healthcare Devices" Electronics 10, no. 17: 2092. https://doi.org/10.3390/electronics10172092
APA StyleKuo, T.-H., Teng, C.-M., Wu, M.-F., & Wen, C.-Y. (2021). An Adaptive Heart Rate Monitoring Algorithm for Wearable Healthcare Devices. Electronics, 10(17), 2092. https://doi.org/10.3390/electronics10172092