Abstract
The wild animal information collection based on the wireless sensor network (WSN) has an enormous number of applications, as demonstrated in the literature. Yet, it has many problems, such as low information density and high energy consumption ratio. The traditional Internet of Things (IoT) system has characteristics of limited resources and task specificity. Therefore, we introduce an improved deep neural network (DNN) structure to solve task specificity. In addition, we determine a programmability idea of software-defined network (SDN) to solve the problems of high energy consumption ratio and low information density brought about by low autonomy of equipment. By introducing some advanced network structures, such as attention mechanism, residuals, depthwise (DW) convolution, pointwise (PW) convolution, spatial pyramid pooling (SPP), and feature pyramid networks (FPN), a lightweight object detection network with a fast response is designed. Meanwhile, the concept of control plane and data plane in SDN is introduced, and nodes are divided into different types to facilitate intelligent wake-up, thereby realizing high-precision detection and high information density of the detection system. The results show that the proposed scheme can improve the detection response speed and reduce the model parameters while ensuring detection accuracy in the software-defined IoT networks.
1. Introduction
Traditional wild animal information collection system is mainly deployed in the form of wireless sensor network (WSN), and the most widely used method is large-scale deployment of infrared cameras [1,2,3]. The method of infrared camera monitoring for information collection has the advantages of simple use and convenient operation [4], but also brings about the problem of insufficient intelligence. Sensor nodes are often highly hardware-dependent, i.e., the deployment and adjustment of equipment is dependent on researchers, and nodes cannot be repetitively programmed to achieve intelligent control. Additionally, in the complex environment of the field, the objects that we want to detect are often known groups. We only need to collect the specified species information [5]. However, due to the complexity of the wild environment and species diversity, false triggering for a variety of other reasons often occurs, causing additional energy consumption by cameras with limited resources, and adding additional workload for subsequent screening of collected information.
For a long time, collecting as helpful information as possible has been the focus of wild animal data collection research [6,7,8]. Traditional data collection researchers optimize from the perspective of node deployment and information routing. They adjust the position, height, deployment density and other influencing factors to make the camera capture as helpful information as possible. At the same time, they adjust the transmit power and receive power from sensor nodes to change the routing of information to reduce the energy consumption ratio [9,10]. These researches focus on information routing and node deployment. The detection method still relies on infrared triggering, and the data processing and data forwarding still depend on the deployment of researchers. The traditional WSN-based collection mode does not effectively resolve the problem of extra energy consumption caused by false triggering.
With artificial intelligence (AI) development, enormous research has begun to be applied and deployed across industries. Therefore, we use the target detection algorithm to collect specific animal information, and the target detection network only responds to the target animal, which can effectively reduce the occurrence of false triggering. At the same time, the deployment of traditional wireless sensor network nodes is often hardware dependent, so the autonomy and the ability of self-organizing network are minimal [11]. We learn from the advanced network structure of SDN to enhance the autonomy and dynamic networking capabilities of nodes, and realize a de-hardware software defined IoT system [12]. The sensors in the data layer summarize the current status information to the control layer for data processing. The control layer makes global decisions and sends instructions to nodes to realize an intelligent programmable wireless sensor network structure.
Figure 1 shows the network structure of the SDN-assisted wild animal information collection system. The data layer is composed of camera nodes, which are responsible for collecting information such as sensors. When the camera detects the presence of target animals, it sends the status information to the control layer. The control layer comprises programmable devices, which can be PC or raspberry PI and other controllers with strong information processing ability. It sends instructions to the camera nodes in the data layer to realize the self-organizing network between sensor nodes. The top application layer implements data summary and visualization so that users can use it conveniently. We focus on building a responsive, lightweight target detection network, transplanted to sensor nodes in the data layer to realize intelligent data collection.
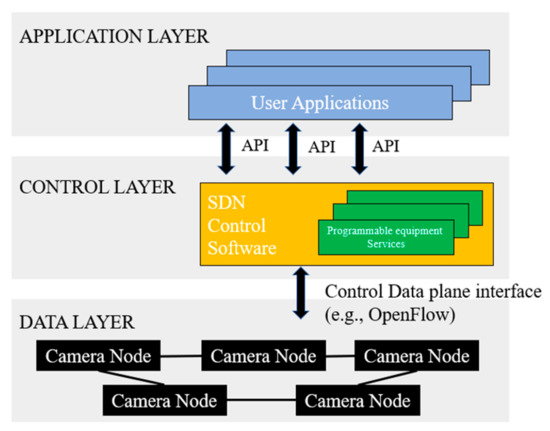
Figure 1.
The structure of SDN-assisted wild animal information collection system.
To achieve AI-driven in wild animal information collection, it is necessary to introduce a suitable DNN algorithm. The first task is to design a lightweight object detection network structure, transplanted to nodes or embedded devices for specified information collection. With the development of semiconductor chips, the computing speed of computers is getting ever faster. Researchers have started to study neural networks in-depth. From ResNet101 [13] to Faster RCNN [14,15,16,17], the network parameters are increasing, and even traditional portable notebooks can no longer run these networks. The development of artificial intelligence is gradually limited to theoretical research in the laboratory. Therefore, it is of great value and research significance to design a lightweight network suitable for transplantation embedded devices or IoT devices [18,19]. In this way, more helpful information can be collected with a lower energy consumption ratio. At the same time, the detection system will adopt a structure that separates data and control, based on SDN [20], so it can achieve intelligent detection and data collection [21,22,23]. Based on this, we designed a fast, lightweight network structure for wild animal information collection to realize AI-driven goals in SDN-assisted IoT systems.
2. Related Works
The neural network’s research in image processing mainly focuses on classification, object detection and instance segmentation. Considering the specific application scenario of animal information collection in the wild environment, we mainly introduce algorithms related to object detection.
Typically, the high-precision algorithms in object detection are based on the two-stage detection process. The classic RCNN algorithm [16] filters out the region of interest (ROI) on the original image through Selective Search [24]. It then scales the obtained ROIs to a specific size, an input to the convolutional neural network (CNN) to extract each proposed region feature. In this way, we can obtain the feature vector of each ROI, and then feed the feature vector to the support vector machine (SVM) to get the classification result [25]. Then, we use Non-Maximum Suppression (NMS) to filter out the appropriate bounding-box, and finally constantly correct the position of the bounding-box to get a more accurate bounding-box. The algorithm based on selective search selects 2000 ROIs for each image, which brings a massive amount of data to the subsequent CNN feature extraction network. In the actual test, it takes forty seconds to detect an image. Applying the RCNN algorithm to embedded devices is challenging, and it is even more impossible to transplant it to IoT devices.
Fast RCNN [15] is an improved version of the RCNN algorithm. It first performs convolution operations on the input image to obtain ROIs, effectively avoiding the problem that every ROI must be input to the convolutional neural network. But it still uses selective search to get ROI, which is a very time-consuming operation. Therefore, Fast RCNN only alleviates too long inference time but does not effectively solve the problem. Faster RCNN has made significant progress in the optimization of inference time. It uses the region proposal network (RPN) structure instead of selective search and introduces the anchor concept. The ROI obtained by RPN is also based on the feature map extracted from the previous CNN backbone, and the detection bases on ROI pooling. In the whole process, the original image only needs to pass through the CNN network once, and all operations are performed based on the feature map of the original image. The RPN network is recommended based on the anchor box. When the image is divided into 38 × 38 grids, each grid will establish nine priori boxes for 12,996 priori boxes. Although the time is improved compared to Fast RCNN, the generation of ROI still consumes a lot of time and resources. The mainstream two-stage network introduced above has high accuracy in the object detection task. Still, the parameter control and response time are not suitable for the actual scenarios of embedded devices. It is more difficult to get practical applications in resource-limited networks.
The one-stage network has the advantage in response time. Unlike the two-stage method, the one-stage idea is to directly predict and classify the candidate frames at each image position without generating some candidate frames in advance. At present, the most mainstream one-stage detection algorithms are YOLO [26] and Single Shot MultiBox Detector (SSD) [27,28]. The detection process of YOLO is divided into the following steps. First, divide the original image into small grids. Each grid generates bounding boxes, gives the predicted () in each bounding box and give the confidence of categories. The output result of an image is a vector of . Since YOLO has meshed the entire image, there is no need for sliding windows or recommended candidate frames, and its response time has been dramatically improved. Still, the accuracy of classification and positioning accuracy has dropped a lot.
Subsequent improvements to the algorithm include introducing other tricks, such as residual structure, batch normalization (BN), and data enhancement. The improved YOLOV3 [29] also introduced the feature pyramid networks structure [30] to achieve higher detection accuracy. Now the one-stage algorithm can also approximately meet the requirements of the task in terms of detection accuracy. Meanwhile, the reasoning time of the model is also significantly reduced, and the detection of dozens of frames can be achieved. However, the model parameters and required memory still have large problems. It is still difficult to get practical applications for embedded facilities in IoT systems and devices with minimal resources.
In recent years, some researchers have begun to deploy lightweight networks on mobile devices. The two most popular lightweight network structures are MobileNet [31,32,33] and ShuffleNet [34,35]. Some researchers have implemented a more lightweight network design in the direction of model compression [36]. The Google team first proposed the MobileNet network based on depthwise convolution in 2017. By analyzing the structure and parameters of the classic network, researchers have found that the parameters of the model are mainly concentrated on the convolution operation. The traditional convolution is shown in Figure 2. When performing feature extraction and dimension changes, the convolution kernel is consistent with the depth information of the feature map of the previous layer, which facilitates the fusion of features of different dimensions, so that the global components extracted by the different convolution kernels of the last layer can be obtained. The ensuing problem is the considerable number of parameters. MobileNet uses depthwise convolution, as shown in Figure 3. When performing feature extraction and dimensional transformation, each convolution kernel only corresponds to a feature map of the specific dimension, so that the depth information of the feature map can be separated. However, only extracting feature information in a single dimension ignores the features of other spatial dimensions and cannot effectively extract global features. To solve this problem, after the DW operation, MobileNet uses the PW convolution with the convolution kernel of 1 × 1 to increase the dimension, and the feature information of a single dimension is integrated through the PW operation. In the improved MobileNetV2 network, the author analysed the feature information to be transmitted in the low-dimensional space and found that information loss and image distortion are prone to occur at this time, so the expansion coefficient is introduced. Before MobileNetV2 performs DW, it first expands the feature dimension to six times to alleviate the distortion of low-dimensional features, and finally uses PW convolution for global feature fusion.
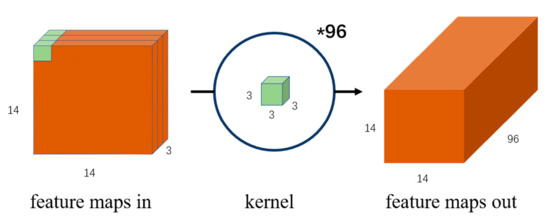
Figure 2.
Standard convolution increases the dimension to 96.
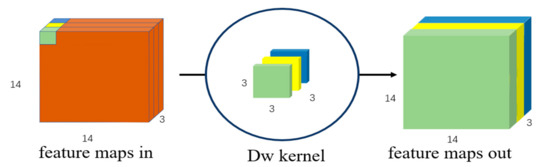
Figure 3.
Depthwise separable convolution.
ShuffleNet also uses a DW convolution operation. It does not use point-by-point PW convolution when acquiring global features. Instead, it uses group convolution, which performs PW convolution in the group through channel shuffling. The approximate global spatial dimension feature is obtained, and the parameters are significantly reduced. In the current mainstream lightweight networks, the depthwise convolution is used as the basic block, and different algorithms use different methods for global feature fusion. The lightweight network based on depthwise convolution solves the problem of excessive parameter amount. As a price, this type of model sacrifices a certain degree of accuracy. This new convolution method makes the deep learning algorithm model possible to be transplanted to embedded devices, thus realizing AI-assisted intelligent information collection.
Starting from the actual wild animal information collection scene, the complexity of the environment is mainly reflected in the severe occlusion between the target animal and the background environment. Secondly, due to the physiological characteristics of animals, their external characteristics, such as hair, shape, size, colour, etc., often have substantial similarities with their living environment. In addition, animals tend to move more quickly, and the time to capture information is relatively short. This paper proposes an optimized network structure based on depthwise separable convolution. We suggest that the network structure is better than the traditional two-stage network in terms of parameters and better than the conventional one-stage fast detection network in detection accuracy. At the same time, the introduction of the SDN control plane will help build a dynamic self-organizing IoT system. The focus of our research is the construction of a lightweight target detection network suitable for sensor nodes. The contributions of this article are summarized as follows:
- We propose a fast-response lightweight network model that can be transplanted to embedded devices, such as ARM series development boards, Raspberry Pi development boards, etc. This network effectively solves the problems of high energy consumption ratio and low information density in traditional wild animal information collection. For the backbone network, we use MobileNetV2 [32]. The block design based on depthwise separable convolution significantly reduces the parameters. In the Neck part, we use the simplified spatial pyramid pooling (SPP) structure of deep separation convolution [17], and the feature fusion module PANET [37] is replaced with an improved FPN structure [30] to achieve another reduction of parameters and effective feature fusion.
- We use the public Oregon Wildlife dataset. The data is collected in the wild natural environment, effectively reflecting the model’s performance in the actual environment. We carefully analysed the dataset and selected five animals that are more difficult to detect for training, including black bears with a single feature, wild ocelot that are very similar to the background environment, fast-moving elk, dangerous and aggressive grey wolves, and the nocturnal raccoons. Experimental results show that our network has a high recall rate, precision rate and high confidence in actual complex scenes.
The organization structure of the article is proceeds as follows: The third part introduces the materials and methods in detail, including the network structure, the composition of the dataset, and the definition of the loss function. The fourth and fifth part outline the results and discussion, in which we compare the proposed network with mainstream one-stage and lightweight networks and present model analysis and display results. In the final section, we summarize the application value and research significance of the network structure proposed in this paper.
3. Materials and Methods
One of the advantages of SDN structure is the programmable network structure. Many researchers have designed many schemes superior to traditional algorithms based on SDN structure [38,39,40]. Specifically, in the animal information collection system, we can pay more attention to the data collection task of the data layer, without too much consideration on how to forward and further process the data collected by sensors. Intelligent routing and self-organizing network of sensor nodes in the data layer can be realized by digital programming in the control layer. When we deploy sensor nodes, there is no need to pre-program the hardware in advance. With the change of the field environment, the status of sensor nodes used to collect information also changed accordingly. When the active node detects the specified animal, the control layer will process the result, and the corresponding surrounding nodes will be activated and enter the HIGH-DEFINITION information recording mode. Unlike WSN networks, the relationships between nodes are pre-set and do not have the capability of intelligent networking. When no target animal appears, the node enters the hibernation mode, and only the active node performs the detection task. With the help of SDN’s control and data separation advantages, we will focus on the construction of the AI algorithm target detection network below.
3.1. Network Structure Design
Figure 4 shows the basic module of the backbone network, which consists of three parts: PW operation that promotes the dimension of feature information, depthwise separable convolution DW, and PW that reduces the dimension of convolution features. At the same time, the short-cut of classic ResNet is retained.
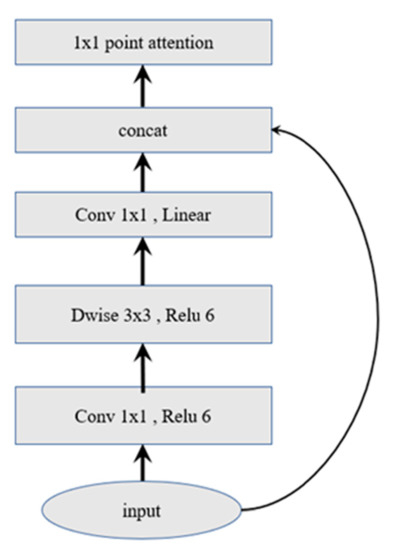
Figure 4.
A block that integrates depthwise separable convolution and attention mechanisms.
The most important part is the target detection network deployed at the data layer nodes. Our proposed network structure designed for information collection of wild animals is named OurNet, shown in Figure 5. The network structure we created is divided into four parts, the backbone network, SPP as the additional module of the neck, FPN as the feature fusion module and the head structure based on YOLOV3 [30]. The backbone network comprises three primary modules: standard convolution modules, separated convolution with stride = 1, and separated convolution with stride = 2. In the original feature extraction layer, we still use the standard convolution structure to preserve the original image’s feature information. Using DW convolution in the first layer of feature extraction will not effectively extract the feature’s spatial information while ignoring the relevance of elements in different dimensions. Then, we send the feature map to the DW module. Before performing the DW convolutions, we first use 1 × 1 convolution to map the feature map to a high-dimensional space, which can alleviate the feature loss problem caused by the Relu function in the depth separation. After the feature map is mapped to the high-dimensional space, we perform depthwise separable convolution, and the convolution kernel size is 3 × 3 in each. The linear combination of the 3 × 3 convolution kernel designs obtains a larger receptive field and obtains better nonlinearity. At the same time, the design of the unified convolution kernel also provides convenience for the hardware threshold circuit design of the algorithm or the design of FPGA [41,42,43]. Then, we perform feature fusion with the use of 1 × 1 convolution again to achieve dimensionality reduction.
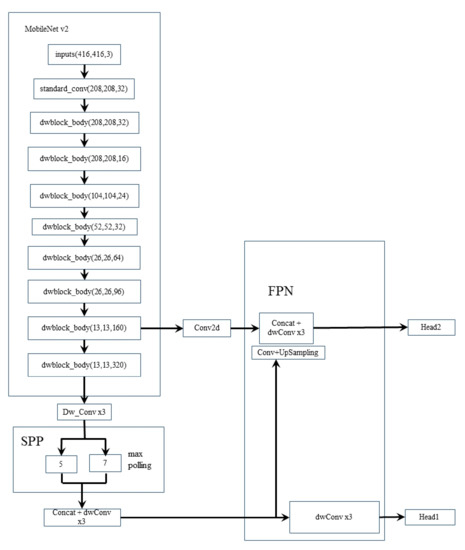
Figure 5.
The network architecture of our wild animal detection system.
After the PW-DW-PW operation, the parameters reduce to 1/8 to 1/9 of the original. Assume that the size of the feature map is , , and the size of the convolution kernel is , . The input feature dimension is , the output feature dimension is , the parameter quantity of the standard convolution is , and the calculation quantity is . If PW-DW-PW convolution is used, the parameters and calculation amount will be reduced to and . The 1 × 1 convolution here is used to alleviate the problem of non-circulation of feature information space dimensions caused by DW convolution. In addition, batch normalization ensures the smooth transmission of gradient information while accelerating convergence [44]. Different from the original MobileNet inverted residuals design, in the comparison network, the network structure we designed is not directly passed to the next layer of convolution after the short cut operation CONCAT. Instead, the point attention mechanism is used to realize the re-enhancement of the features without changing the dimensional information and retaining the original features.
To ensure the accuracy of the target detection network, we need additional feature fusion operations. There are four main methods of feature fusion and enhancement. The traditional image pyramid is shown in Figure 6a. Each size is extracted and predicted separately. It significantly increases the inference time and the number of parameters of the model. The single output feature pyramid, shown in Figure 6b, predicts the feature graph of the last dimension, and after multiple convolutional pooling operations, the information of small targets is ignored. Although the parameters and reasoning time of the model become shorter, the accuracy is lower. Figure 6c performs feature prediction of multiple sizes and uses feature maps instead of input maps to perform feature prediction so that the parameters reduce. Due to the prediction of multiple sizes and outputs, it is possible not to miss too many features. Figure 6d focuses on the correlation between features of different sizes, and achieves higher detection accuracy through multi-size feature fusion. Meanwhile, there will be a slight increase in the number of parameters.
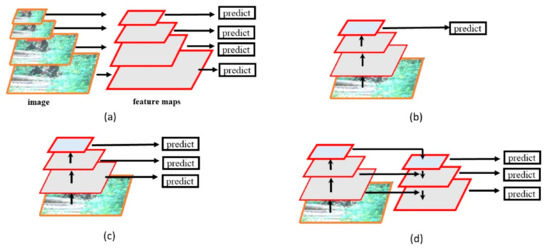
Figure 6.
(a) Featurized image pyramid. (b) Single feature map. (c) Pyramidal feature hierarchy. (d) Feature Pyramid Network.
The original version of YOLO V4 uses PANet based on standard convolution as a feature fusion module [45], YOLO V4 selects 1024-dimensional, 512-dimensional, and 256-dimension feature maps as input. Each operation of high-dimensional features will bring about a large number of increases in parameters. We use convolutional visualization to prune the network structure from the perspective of feature maps. In the wild animal information collection scene, we can obtain good detection results by using 512-dimensional and 256-dimensional features and continue to use PW-DW-PW convolution instead of standard convolution to reduce parameters further. The feature fusion part uses a one-way FPN structure shown in Figure 6d to realize the multiplexing of high-dimensional features and the detection of multiple receptive fields to ensure detection accuracy.
3.2. Dataset Description
All the data in the Oregon Wildlife Dataset is collected in the real environment in the wild and is the primary material for the research of wildlife researchers. The data set has 20 types of animals, including crows, bald eagles flying in the sky, bobcats and mountain raccoons in the snow, red foxes living in the grassland, cougars and other rare animals living in various complex environments, a total of 14,013 images. The data is not labelled. We use professional image labelling tools to convert the original image into a format suitable for the object detection network, and select the five most challenging animal trainings to evaluate the performance of the network structure proposed in this paper. During training, we perform data enhancement processing, random occlusion, size scaling, cropping and stitching to simulate the harsh natural environment to the greatest extent.
3.3. Definition of Loss Function
As is well known, the loss function is very important in deep learning. We can use loss function to calculate the difference between the forward calculation result of each iteration of neural network and the real value, so as to guide the next training in the right direction. The definition of the loss function of the network model proposed in this paper mainly consists of three parts: regression box loss function, confidence loss function and classification loss function, Equation (1). The variable K represents dividing the original image into small grids, and each grid generates M bounding boxes.
The position of the regression box is determined by . The starting coordinates of the box are denoted by x and y, w and h are the width and height of the prediction frame. When calculating the loss function of the regression box, YOLO V3 corrects the position of the regression box generated by the tiny target by adding a weight coefficient [29], and the cross-entropy function calculates the loss function. We use the Ciou loss definition, Equation (2).
When using Intersection over Union (iou) to calculate the loss function, only the case where the prediction box intersects the real box is considered. When there is no intersection between the two, the loss value is zero and no gradient information returns. Secondly, the iou loss only focuses on the size of the intersection area, and ignores the positional relationship between the predicted frame and the real frame. The Ciou loss that we use fully considers the positional correlation and size similarity between the regression box and the label box. We introduce loss, defined as (3).
In the above formula, and , respectively, represent the centre point of the predicted frame and the true frame, and are the width and height of the real frame, and represents the calculation of the Euclidean distance between two centre points. The diagonal distance of the smallest closure area contains the prediction box and the ground truth box is denoted by , the weight function is represented by , and is used to measure the similarity of the aspect ratio in Equation (4).
It provides adequate direction information for the position movement and size adjustment of the prediction box, and the multi-angle constraint can also speed up its convergence speed. The confidence loss in Equation (5) and the classification loss function in Equation (6) are both defined by the binary cross entropy function. The parameter represents whether the j-th anchor box of the i-th grid is responsible for the detection of this object. Its value is 1 or 0, and the same is true for the parameter . The parameter is related to the confidence level. The value is determined by whether the bounding box of the grid cell is responsible for predicting an object. is the classification probability of the objects in the regression box. Add the above three losses to get the global loss function of the network, which is defined as follows:
4. Results
When training the model, we use transfer learning for the part of the network structure that can use the pre-trained model [46,47], and load the pre-trained model of VOC2007 to speed up the convergence of the model. At the same time, the use of transfer learning avoids convergence to an optimal local solution with unsatisfactory effects, at least as much as possible.
We compare the network structure proposed in this article with the advanced lightweight network MobileNet series and one-stage fast response network YOLO V4. The detection accuracy is shown in Figure 7. The figure shows the performance indicators of different models. The bar graph represents the AP value of different wild animal categories, and the line graph represents the map value of the model. Results indicate that the detection accuracy of our proposed network structure is far superior to the traditional lightweight network. Our network structure map is as high as 89.52%, while the map of MobileNet V2 is only 77.9%. Compared with the one-stage network YOLO, our detection accuracy is better than the YOLO V4 Tiny map at 77.33%. We also add an attention mechanism to the baseline network. The results show that an increase of 11.6% in the parameters only obtain an increase of 2% in accuracy. Considering the balance of parameters and accuracy, the attention module we designed is unsuitable for our backbone network.
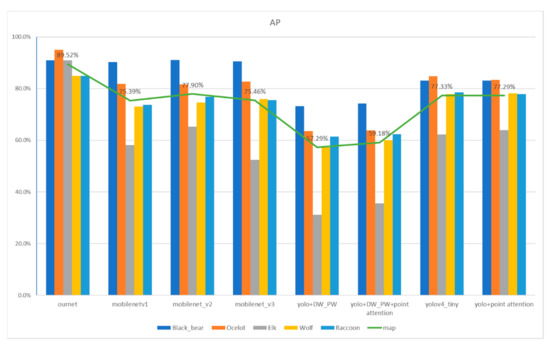
Figure 7.
Performance comparison of different models.
We deliberately selected some photos with detection difficulty, three from each category of animals, to show the excellent detection performance of the network structure proposed in this article. As shown in Figure 8, especially in the actual complex scenes with severe occlusion, blurring caused by high-speed motion, and the target and the background are very similar.
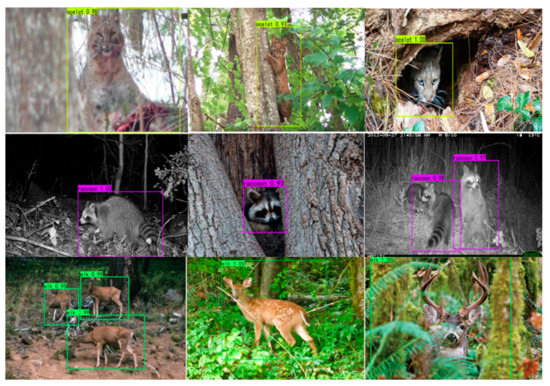
Figure 8.
Detection results and confidence in the real environment in the wild.
The above target animal detection results demonstrate that the proposed network has good detection capabilities. Although our main work is to design a lightweight target detection network suitable for deployment to nodes, considering that the system’s structure refers to SDN, we also carried out a simulation design and presented the result of reducing energy consumption with the aid of SDN.
Figure 9a shows the node working status of traditional WSN based on area coverage. Red notes indicate that the node is in the active working state, blue notes indicate that the node is in a dormant state, and the circle area represents the transmitting power coverage range of the central node. When the target animal moves from node A to node B, the node is awakened.
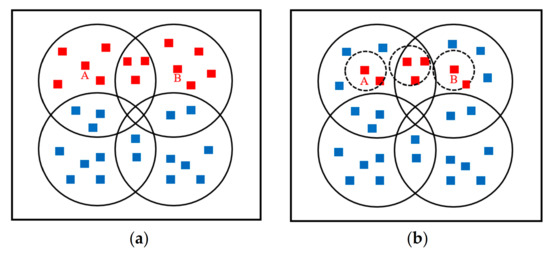
Figure 9.
Node working status in WSN and SDN auxiliary systems: (a) Working status of nodes in the WSN structure. (b) Working status of nodes in SDN auxiliary system.
Figure 9b shows the operational status of nodes in the system assisted by SDN. Nodes in the data layer have self-organizing network capability within the range of 20%, and the circle formed by dashed lines represents the signal coverage range of nodes under the control of SDN. It is apparent that in the SDN-assisted system, fewer redundant nodes are awakened to realize the reduction of energy consumption.
In order to clearly delineate the results, Table 1 shows the simulation results of different deployment modes over one-day. In the simulation design, we use the energy consumption parameters of infrared cameras, which are widely used in the animal monitoring field. The camera has two operating states: the operating current in HD mode is 650 mA, of which 500 mA is the additional current consumption when the infrared LED is on, the operating current in the sleep state is 250 μA, the power to forward information is 300 mW, and the operating voltage is 12 V. In the 2 km × 2 km rectangular area, we deployed 30 nodes to perform information collection. To achieve a multi-angle collection of animals, without the assistance of SDN, the response area of the trigger signal is defined as the pre-defined area 40 m × 40 m and the duration of the video is 10 s. In order to reflect the advantages of SDN, we set self-organizing network areas of different sizes: 20%, 25%, 30% and 35%. The coverage area only affects the deployment method with SDN structure because when using the WSN deployment method, the node’s transmission power is often given in advance, which is hardware-dependent and not programmable. At the same time, 1% random noise is introduced.

Table 1.
Node energy consumption in one day in different deployment modes.
When the nodes do not have the capability of the self-organizing network, they have fixed transmitting power and the situation of node activation is also fixed. Hence, it always has high energy consumption. Additionally in relation to the SDN structure, the adequate trigger energy consumption within a day is reduced by about 15%. Meanwhile, nodes will have more autonomy in a smaller coverage area and are not limited by pre-set regions, and the energy consumption reduction is better.
5. Discussion
The network model parameters are shown in Table 2. It can be found that the parameters of the network proposed in this article are nearly 40% less than that of MobileNet V2, which is close to the parameters of the ultra-lightweight network YOLOv4 Tiny. The main reason is that we use depthwise separable convolution in the backbone network to reduce parameters. At the same time, we fully consider the actual scene to construct SPP using 5 × 5 and 7 × 7 when extracting features, and use a one-way FPN structure to enhance features to retain precious animal spatial feature information.
Table 2.
Parameters, performance indicators, and response time of different models.
The detection time for a single image is shown in Figure 10 (tested on the training machine RTX 2060). In terms of detection time, we have reached the advanced YOLO V4 level. It only takes 5 ms to test the model on the RTX 2060 to complete the backbone network inference. Compared with traditional cameras, even if the network we propose is transplanted to embedded devices such as ARM series development boards, it still has real-time solid detection capabilities.
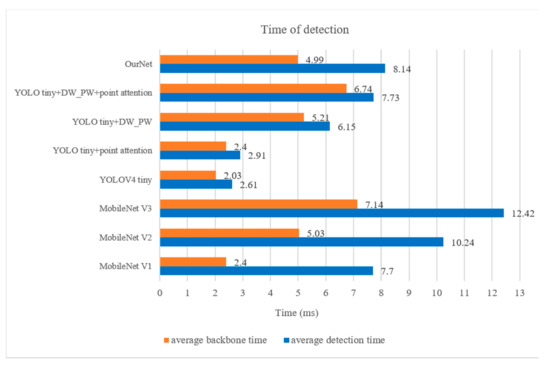
Figure 10.
Response time of backbone network and detection network of different models.
From the point of view of detection time, YOLO V4 tiny has several advantages in the real-time processing of the task, including only requiring 2.5 ms inference time and being able to quickly complete a target detection operation. However, we found that the map accuracy of YOLO V4 tiny is only 77.33%, which is much lower than that of Ournet with 89.52%. Considering the special situation of animal information collection in the wild, the animal information we need to collect is rare and precious. We do not want to miss any information and waste the extra energy consumption caused by the false trigger. YOLO V4 tiny does not perform SPP operation after feature extraction. SPP occurs in the highest dimension of feature extraction. This operation can effectively realize feature information reuse and fusion, but also increase the reasoning time of the model. If there are higher real-time requirements in other scenes, we can simplify our feature extraction network to speed up the reasoning time of the model.
When constructing our detection network OurNet, we used MobileNet V2 as the backbone. In Table 2, we found that the optimized network OurNet detection time is shorter than MobileNet V2. Compared with MobileNet V1, the detection time is slightly longer. It is due to the facxt that the MobileNet V1 network has only 28 layers, 13 of which use deep separable convolutions. The MobileNet V2 network has 54 layers, of which 17 layers of convolution use deep separable convolution. At the same time, we simplified V2 by using 512- and 256-dimension feature information as output, and abandoned 1024-dimension convolution to reduce parameters. Networks with greater depth require more time for model inference.
Therefore, between the accuracy and the inference time of the model, different scenarios need to be weighed differently to achieve better results. In the wild animal information collection scene, the detection time of 5 ms can already meet the needs better, so we used a higher-precision backbone network to achieve better performance.
As for the reduction of energy consumption, we mainly introduced DNN network to achieve the collection of specified animal information and reduce the energy consumption caused by false trigger. Meanwhile, the network programming advantage of SDN can also reduce energy consumption in terms of node activation. As shown in Table 1 and Figure 9 of the Result section, the self-organizing network of nodes can greatly reduce the extra energy consumption caused by the activation of redundant nodes, thus save the total network energy consumption, especially when the coverage is small. In the real wild environments, the placement range of infrared cameras is relatively small, in order to facilitate battery replacement and access to the information of the storage card. Thus, the SDN-assisted system is good for wild animal information collection in the future IoT networks.
6. Conclusions
In conclusion, based on the comprehensive consideration of detection accuracy, model reasoning time and model parameters, the traditional neural network structure cannot be well adapted to the actual application scenario of wild animal information collection. Through the fusion algorithm, the object detection network we propose reduces the model’s reasoning time and the number of parameters while ensuring the detection accuracy. In this paper, we focus on the construction of lightweight target detection networks suitable for migration to sensor nodes. We also introduce SDN into traditional information collection scenarios and briefly analyse the advantages of SDN in energy consumption reduction. The network will effectively avoid redundant node energy consumption and achieve a self-organizing node network while reducing energy consumption. Thus, the proposed scheme can effectively collect wild animal information in software-defined IoT networks with limited resources. On the other hand, since the network structure we propose, which integrates multiple modules, is based on actual application scenarios of wild animal information collection, the generalization ability of the model in other application scenarios cannot be guaranteed. In future work, we will continue to closely integrate other artificial intelligence technology such as reinforcement learning with embedded devices and IoT system to achieve more efficient information collection.
Author Contributions
Conceptualization, Q.C. and L.Y.; methodology, Q.C. and H.Q.; software, Q.C. and H.Q.; validation, Q.C. and L.Y.; formal analysis, Z.W. and S.Z.; investigation, H.Q. and Y.Y.; resources, Q.C. and L.Y.; data curation, H.Q. and Y.Y.; writing—original draft preparation, Q.C. and L.Y.; writing—review and editing, Z.W., Z.K., A.K.; visualization, Q.C. and S.Z.; supervision, L.Y.; project administration, Z.W. and L.Y.; funding acquisition, L.Y. All authors have read and agreed to the published version of the manuscript.
Funding
The research was supported in part by the National Science Foundation of China (NSFC) under Grant 62161024, the State Key Laboratory of Computer Architecture (ICT, CAS) Open Project under Grant CARCHB202019, China Postdoctoral Science Foundation under Grant 2021TQ0136, the Training Program of Innovation and Entrepreneurship for Undergraduates in Nanchang University under Grant 2020CX234 and 2020CX236, and the Student Research Training Program (SRTP) in Nanchang University under Grant 5258 and 5259. The work of Z. Khan is also supported in part by Prince Sultan University, Saudi Arabia.
Data Availability Statement
The data set we used is public, called Oregon Wildlife. There are 14,013 images in the data set containing 20 kinds of animals. The data is widely used by wildlife researchers and can be used for classification or object detection tasks. We select part of the data to be relabelled to make it better to use in the task of object detection. Therefore, you can contact the author (6112118008@email.ncu.edu.cn) to obtain the corresponding labelled data set.
Conflicts of Interest
The authors declare no conflict of interest.
References
- Swann, D.E.; Hass, C.C.; Dalton, D.C.; Wolf, S.A. Infrared-triggered cameras for detecting wildlife: An evaluation and review. Wildl. Soc. Bull. 2004, 32, 357–365. [Google Scholar] [CrossRef]
- Damm, P.E.; Grand, J.B.; Barnett, S.W. Variation in detection among passive infrared triggered-cameras used in wildlife research. Proc. Annu. Conf. Southeast. Assoc. Fish Wildl. Agencies 2010, 64, 125–130. [Google Scholar]
- Zhu, C.; Li, G.; Li, N.; Guo, X.; Wang, W.; Wang, R. An innovative saliency detection framework with an example of image montage. In Proceedings of the ACM Multimedia 2017 Workshop on South African Academic Participation; Association for Computing Machinery: New York, NY, USA, 2017; pp. 27–34. [Google Scholar]
- Trolliet, F.; Vermeulen, C.; Huynen, M.C.; Hambuckers, A. Use of camera traps for wildlife studies: A review. Biotechnol. Agron. Société Environ. 2014, 18, 446–454. [Google Scholar]
- Swanson, A.; Kosmala, M.; Lintott, C.; Simpson, R.; Smith, A.; Packer, C. Snapshot Serengeti, high-frequency annotated camera trap images of 40 mammalian species in an African savanna. Sci. Data 2015, 2, 150026. [Google Scholar] [CrossRef] [PubMed] [Green Version]
- Chen, G.; Han, T.X.; He, Z.; Kays, R.; Forrester, T. Deep convolutional neural network based species recognition for wild animal monitoring. In Proceedings of the 2014 IEEE International Conference on Image Processing (ICIP), Paris, France, 27–30 October 2014; pp. 858–862. [Google Scholar]
- Al Nuaimi, M.; Sallabi, F.; Shuaib, K. A survey of wireless multimedia sensor networks challenges and solutions. In Proceedings of the 2011 International Conference on Innovations in Information Technology, Abu Dhabi, United Arab Emirates, 25–27 April 2011; pp. 191–196. [Google Scholar]
- Almalkawi, I.T.; Guerrero Zapata, M.; Al-Karaki, J.N.; Morillo-Pozo, J. Wireless multimedia sensor networks: Current trends and future directions. Sensors 2010, 10, 6662–6717. [Google Scholar] [CrossRef] [Green Version]
- Yeo, C.Y.; Al-Haddad, S.A.R.; Ng, C.K. Animal voice recognition for identification (ID) detection system. In Proceedings of the 2011 IEEE 7th International Colloquium on Signal Processing and Its Applications, Penang, Malaysia, 4–6 March 2011; pp. 198–201. [Google Scholar]
- Yang, J.; Xiang, Z.; Mou, L.; Liu, S. Multimedia resource allocation strategy of wireless sensor networks using distributed heuristic algorithm in cloud computing environment. Multimed. Tools Appl. 2020, 79, 35353–35367. [Google Scholar] [CrossRef]
- Latif, R.; Mukhtar, H. Hardware-based random number generation in wireless sensor networks (WSNs). In International Conference on Information Security and Assurance; Springer: Berlin/Heidelberg, Germany, 2009. [Google Scholar]
- Nastic, S.; Sehic, S.; Le, D.H.; Truong, H.L.; Dustdar, S. Provisioning software-defined IoT cloud systems. In Proceedings of the 2014 International Conference on Future Internet of Things and Cloud, Barcelona, Spain, 27–29 August 2014. [Google Scholar]
- He, K.; Zhang, X.; Ren, S.; Sun, J. Deep residual learning for image recognition. In Proceedings of the IEEE Conference on Computer Vision and Pattern Recognition, Las Vegas, NV, USA, 27–30 June 2016; pp. 770–778. [Google Scholar]
- Ren, S.; He, K.; Girshick, R.; Sun, J. Faster R-CNN: Towards real-time object detection with region proposal networks. arXiv 2015, arXiv:1506.01497. [Google Scholar] [CrossRef] [PubMed] [Green Version]
- Girshick, R. Fast R-CNN. In Proceedings of the IEEE International Conference on Computer Vision, Santiago, Chile, 13–16 December 2015; pp. 1440–1448. [Google Scholar]
- Girshick, R.; Donahue, J.; Darrell, T.; Malik, J. Rich feature hierarchies for accurate object detection and semantic segmentation. In Proceedings of the IEEE Conference on Computer Vision and Pattern Recognition, Columbus, Ohio, 24–27 June 2014; pp. 580–587. [Google Scholar]
- He, K.; Zhang, X.; Ren, S.; Sun, J. Spatial Pyramid Pooling in Deep Convolutional Networks for Visual Recognition. IEEE Trans. Pattern Anal. Mach. Intell. 2015, 37, 1904–1916. [Google Scholar] [CrossRef] [PubMed] [Green Version]
- Yu, L.; Wu, J.; Fan, P. Energy efficient designs of ultra-dense IoT networks with nonideal optical front-hauls. IEEE Internet Things J. 2019, 6, 7934–7945. [Google Scholar] [CrossRef]
- Yu, L.; Wu, J.; Zhou, A.; Larsson, E.G.; Fan, P. Massively distributed antenna systems with nonideal optical fiber fronthauls: A promising technology for 6G wireless communication systems. IEEE Veh. Technol. Mag. 2020, 15, 43–51. [Google Scholar] [CrossRef]
- Zhang, N.; Zhang, S.; Yang, P.; Alhussein, O.; Zhuang, W.; Shen, X.S. Software defined space-air-ground integrated vehicular networks: Challenges and solutions. IEEE Commun. Mag. 2017, 55, 101–109. [Google Scholar] [CrossRef] [Green Version]
- Ali, I. Data Collection in Sensor Cloud: Recent Advances, Taxonomy, Use Cases and Open Challenges. TechRxiv 2020. [Google Scholar] [CrossRef]
- Ali, I.; Ahmedy, I.; Gani, A.; Talha, M.; Raza, M.A.; Anisi, M.H. Data Collection in Sensor-cloud: A Systematic Literature Review. IEEE Access 2020, 8, 184664–184687. [Google Scholar] [CrossRef]
- Ali, I.; Gani, A.; Ahmedy, I.; Yaqoob, I.; Khan, S.; Anisi, M.H. Data collection in smart communities using sensor cloud: Recent advances, taxonomy, and future research directions. IEEE Commun. Mag. 2018, 56, 192–197. [Google Scholar] [CrossRef] [Green Version]
- Uijlings, J.R.; Van De Sande, K.E.; Gevers, T.; Smeulders, A.W. Selective search for object recognition. Int. J. Comput. Vis. 2013, 104, 154–171. [Google Scholar] [CrossRef] [Green Version]
- Suykens, J.A. Support vector machines: A nonlinear modelling and control perspective. Eur. J. Control 2001, 7, 311–327. [Google Scholar] [CrossRef]
- Redmon, J.; Divvala, S.; Girshick, R.; Farhadi, A. You only look once: Unified, real-time object detection. In Proceedings of the IEEE Conference on Computer Vision and Pattern Recognition, Las Vegas, NV, USA, 27–30 June 2016; pp. 779–788. [Google Scholar]
- Liu, W.; Anguelov, D.; Erhan, D.; Szegedy, C.; Reed, S.; Fu, C.Y.; Berg, A.C. SSD: Single shot multibox detector. In Proceedings of the European Conference on Computer Vision, Amsterdam, The Netherlands, 8–16 October 2016; Springer: Cham, Switzerland, 2016; pp. 21–37. [Google Scholar]
- Peng, H.; Huang, B.; Shao, Y.; Li, Z.; Zhang, C.; Chen, Y.; Xiong, J. General improved SSD model for picking object recognition of multiple fruits in natural environment. Trans. Chin. Soc. Agric. Eng. 2018, 34, 155–162. [Google Scholar]
- Redmon, J.; Farhadi, A. Yolov3: An incremental improvement. arXiv 2018, arXiv:1804.02767. [Google Scholar]
- Lin, T.Y.; Dollár, P.; Girshick, R.; He, K.; Hariharan, B.; Belongie, S. Feature pyramid networks for object detection. In Proceedings of the IEEE Conference on Computer Vision and Pattern Recognition, Honolulu, HI, USA, 21–26 July 2017; pp. 2117–2125. [Google Scholar]
- Howard, A.G.; Zhu, M.; Chen, B.; Kalenichenko, D.; Wang, W.; Weyand, T.; Andreetto, M.; Adam, H. Mobilenets: Efficient convolutional neural networks for mobile vision applications. arXiv 2017, arXiv:1704.04861. [Google Scholar]
- Sandler, M.; Howard, A.; Zhu, M.; Zhmoginov, A.; Chen, L.C. MobileNetV2: Inverted residuals and linear bottlenecks. In Proceedings of the IEEE Conference on Computer Vision and Pattern Recognition, Salt Lake City, UT, USA, 18–23 June 2018; pp. 4510–4520. [Google Scholar]
- Howard, A.; Sandler, M.; Chu, G.; Chen, L.C.; Chen, B.; Tan, M.; Wang, W.; Zhu, Y.; Pang, R.; Vasudevan, V.; et al. Searching for mobilenetv3. In Proceedings of the IEEE/CVF International Conference on Computer Vision, Seoul, Korea, 27 October–3 November 2019; pp. 1314–1324. [Google Scholar]
- Zhang, X.; Zhou, X.; Lin, M.; Sun, J. Shufflenet: An extremely efficient convolutional neural network for mobile devices. In Proceedings of the IEEE Conference on Computer Vision and Pattern Recognition, Salt Lake City, Salt Lake City, UT, USA, 18–23 June 2018; pp. 6848–6856. [Google Scholar]
- Ma, N.; Zhang, X.; Zheng, H.T.; Sun, J. Shufflenet v2: Practical guidelines for efficient CNN architecture design. In Proceedings of the European Conference on Computer Vision (ECCV), Munich, Germany, 8–14 September 2018; pp. 116–131. [Google Scholar]
- Han, S.; Mao, H.; Dally, W.J. Deep compression: Compressing deep neural networks with pruning, trained quantization and huffman coding. arXiv 2015, arXiv:1510.00149. [Google Scholar]
- Liu, S.; Qi, L.; Qin, H.; Shi, J.; Jia, J. Path aggregation network for instance segmentation. In Proceedings of the IEEE Conference on Computer Vision and Pattern Recognition, Salt Lake City, UT, USA, 18–23 June 2018; pp. 8759–8768. [Google Scholar]
- Ali, J.; Roh, B.H. Quality of service improvement with optimal software-defined networking controller and control plane clustering. CMC-Comput. Mater. Continua 2021, 67, 849–875. [Google Scholar] [CrossRef]
- Ali, J.; Roh, B.H. An effective hierarchical control plane for software-defined networks leveraging TOPSIS for end-to-end QoS class-mapping. IEEE Access 2020, 8, 88990–89006. [Google Scholar] [CrossRef]
- Ali, J.; Roh, B.H.; Lee, S. QoS improvement with an optimum controller selection for software-defined networks. PLoS ONE 2019, 14, e0217631. [Google Scholar] [CrossRef] [PubMed]
- Shawahna, A.; Sait, S.M.; El-Maleh, A. FPGA-based accelerators of deep learning networks for learning and classification: A review. IEEE Access 2018, 7, 7823–7859. [Google Scholar] [CrossRef]
- Cong, J.; Xiao, B. Minimizing computation in convolutional neural networks. In Proceedings of the International Conference on Artificial Neural Networks, Hamburg, Germany, 15–19 September 2014; Springer: Cham, Switzerland, 2014; pp. 281–290. [Google Scholar]
- Cadambi, S.; Majumdar, A.; Becchi, M.; Chakradhar, S.; Graf, H.P. A programmable parallel accelerator for learning and classification. In Proceedings of the 2010 19th International Conference on Parallel Architectures and Compilation Techniques (PACT), Vienna, Austria, 11–15 September 2010; pp. 273–283. [Google Scholar]
- Ioffe, S.; Szegedy, C. Batch normalization: Accelerating deep network training by reducing internal covariate shift. In Proceedings of the International Conference on Machine Learning, Lille, France, 6–11 July 2015; pp. 448–456. [Google Scholar]
- Bochkovskiy, A.; Wang, C.Y.; Liao, H.Y.M. YOLOv4: Optimal speed and accuracy of object detection. arXiv 2020, arXiv:2004.10934. [Google Scholar]
- Pan, S.J.; Tsang, I.W.; Kwok, J.T.; Yang, Q. Domain adaptation via transfer component analysis. IEEE Trans. Neural Netw. 2010, 22, 199–210. [Google Scholar] [CrossRef] [PubMed] [Green Version]
- Long, M.; Cao, Y.; Cao, Z.; Wang, J.; Jordan, M.I. Transferable representation learning with deep adaptation networks. IEEE Trans. Pattern Anal. Mach. Intell. 2018, 12, 3071–3085. [Google Scholar] [CrossRef]
Publisher’s Note: MDPI stays neutral with regard to jurisdictional claims in published maps and institutional affiliations. |
© 2021 by the authors. Licensee MDPI, Basel, Switzerland. This article is an open access article distributed under the terms and conditions of the Creative Commons Attribution (CC BY) license (https://creativecommons.org/licenses/by/4.0/).