Abstract
The continuous improvement of new energy penetration reduces the inertia of the system, which leads to the frequency deviation and the rate of change of frequency (RoCoF) being easily exceeded. To improve the frequency stability of sending-end power systems with large-scale renewable energy access via ultra-high voltage direct current (UHVDC), the coordinated frequency control for UHVDC participating in system frequency regulation (FR) including primary FR and system inertial response is presented. Based on the simplified system model, the mechanism of UHVDC participation in system frequency support and its influence on receiving-end system frequency response characteristics are analyzed. Compared with the inertia response and primary FR of traditional synchronous generators, the parameter calculating method of UHVDC coordinated frequency response control is proposed. Based on the system root trajectory analysis, the influence of the frequency response control parameters on the sending-end system’s stability is analyzed, and the constraints of UHVDC participating in the system frequency response control are analyzed. Then, based on the RTDS verification platform containing the Lingshao ±800 kV UHVDC control and protection system, the system frequency response characteristics under different control strategies, operating conditions and control parameters are verified and analyzed. The experimental results show that the UHVDC frequency coordinated control can effectively increase the equivalent inertia of the sending-end system, restrain the RoCoF and the frequency deviation, and increase the FR capability of the UHVDC system.
1. Introduction
Renewable energy, such as wind and solar energy, in China is mainly distributed in the western and northern regions, while the load centers of China’s power grids are mainly located in the eastern and southern regions. Therefore, it is necessary to adopt large-capacity and long-distance transmission technologies to solve the problem of distribution between resources and loads. Because of the fast response, flexibility, controllability, and economical characteristics [1,2], ultra-high voltage direct current (UHVDC) power transmission technology has developed rapidly in China in recent years [2,3,4]. However, after the large-scale integrations of photovoltaic (PV) and wind turbines (WT) to the sending-end power system with grid-connected inverters as the circuit interface, the PV and wind generators usually operate at the maximum power tracking mode [5,6], resulting in the inability of generation units to respond to changes in system frequency and their inability to participate in system frequency regulation (FR) [7]. In addition, WT provide inertial support to the system through rotor kinetic energy, which leads to mechanical fatigue of the rotor, reducing the reliability and service life of the equipment significantly [8,9]. Thus, the frequency response characteristics and FR ability of the renewable energy-based sending-end system are far less than those of the traditional synchronous generator (SG). With the increasing penetration rate of renewable energy power generation in the sending-end power system, the system inertia and FR capability will continue to decrease, and the frequency stability issues will become more and more prominent [10,11].
To improve the frequency stability of the sending-end power system, the virtual inertia control (VIC) [12] and virtual SG control (VSGC) [13] are proposed to equip the renewable energy generation system. Therefore, the renewable energy system can participate in the system FR to a certain extent. However, due to the constraints of uncontrollable factors such as wind speed, light and the limited capacity of a single generating unit, renewable energy generation participant systems with grid FR must use standby control or be equipped with certain energy storage systems [14]. At the same time, it is necessary to consider coordinated control between multiple machines, even between renewable energy and traditional generating units to participate in FR. Therefore, there are major challenges such as limited regulation capacity, high regulation costs and complex coordination processes.
The UHVDC system has the characteristics of large transmission capacity and fast power regulation [15]. Therefore, by introducing the virtual inertia and droop control into the UHVDC system, the DC power delivered by the UHVDC system can be actively adjusted, enabling the UHVDC system to participate in the inertia response process and primary FR control process of the sending-end power system at the same time. As shown in Figure 1, the main strategies of a HVDC system participating in the sending-end system FR include frequency limit control (FLC) [16] and auxiliary frequency control (AFC) [17]. With FLC, the UHVDC system controls the frequency of the sending-end system within a set range (ωn − Fb, ωn + Fb). When AFC is adopted, the UHVDC system participates in the system FR through droop control, and the FR power is mainly determined by the droop coefficient. FLC is mainly used in the sending-end system that is an isolated hydropower or thermal power system. AFC based on droop controller is used in the sending-end system that is a regional power grid. The comparison of characteristics between different FR control is shown in Table 1.

Figure 1.
Typical frequency control strategies. (a) The principle of frequency limit control (FLC). (b) The principle of auxiliary frequency control (AFC).

Table 1.
Comparison of characteristics between different FR controls.
The essence of a UHVDC system participating in the frequency modulation control of the sending-end system is to utilize the fast power regulation characteristics of the converter. The FR of the sending-end system is realized based on the powerful adjustment ability of the receiving-end system. Its FR mechanism, response characteristics, parameter tuning method and limiting factors are quite different from those of wind power and photovoltaic power generation systems [18]. Therefore, there is a need for further research into the principles and methods of FR for UHVDC systems involved in the sending-end system. In Reference [19], a control strategy to engage offshore wind farms through multi-terminal HVDC grids for frequency support is proposed. In Reference [20], an auxiliary frequency control strategy with additional frequency control and automatic generation control for HVDC transmission is proposed. In Reference [21], a novel adaptive droop control strategy is presented to provide power sharing and FR in HVDC systems. In Reference [22], a multi-source cooperative FR strategy for coordination between a UHVDC system and wind farm was proposed. The above research results have played an important role in supporting power system stability, significantly reducing the system frequency deviation indicator. However, there are few literature and engineering attempts to use UHVDC transmission systems to provide inertia support; hence the rate of change of frequency (RoCoF) indicator of the sending-end system frequency indicator is still easily exceeded, causing a series of adverse consequences [23]. To guarantee the frequency stability, the RoCoF-related relays will be triggered when the RoCoF exceeds its pertinent threshold regulated by the grid code in many countries [24]. Typical RoCoF relay settings range from 0.1 Hz/s to 1.0 Hz/s in 50 Hz power systems, and from 0.12 Hz/s to 1.2 Hz/s in 60 Hz power systems [25].
This manuscript addresses the characteristics of UHVDC system participation in the sending-end power system FR and the deficiencies of existing frequency control. Based on the frequency droop control, virtual inertia control is introduced to realize a UHVDC system responding to the inertia and the primary frequency control demand at the same time. In addition, to facilitate the practical application of frequency coordinated control in UHVDC engineering, this paper further analyzes the mechanism of UHVDC participation in sending-end system frequency control and its effect on the frequency response characteristics of the receiving-end system, puts forward a tuning method of UHVDC system frequency coordinated control parameters, and analyzes the influence of frequency coordinated control parameters on the frequency response characteristics of the sending-end system and the limiting factors of the UHVDC system participation in frequency control. Finally, the effectiveness of the proposed frequency control strategy, analysis method and calculating method of parameters and their feasibility in engineering applications are verified through a closed-loop real-time simulation system containing Lingshao ±800 kV UHVDC control and protection system.
2. Frequency Coordinated Control Strategy of UHVDC Systems Considering Inertial Support
Frequency deviation Δf and RoCoF (R) are the two main indicators of power system frequency stability [26]:
where f and fn are the real-time frequency and rating frequency of the power system, respectively. Δω* is the per unit value of system frequency deviation, Δω* = ω* − ωn*, ω* = ω/ωn, ωn* = 1, ω is the angular frequency of the system, and ωn is the rated angular frequency of the system.
This paper focuses on the implementation, response mechanism, operating characteristics, and limitations of the UHVDC system in the fast response to the frequency stabilization requirements of the sending-end power system. As the whole interconnected power system via UHVDC includes both the sending-end and receiving-end system, all physical symbols are distinguished by subscripts 1 and 2 for ease of analyzing the sending-end and receiving-end systems, and by superscript * for per unit value.
In addition, the control logic of the UHVDC system based on the line commutated converter (LCC) is very complex. There are control links such as constant extinction angle control, constant current control, constant voltage control and minimum trigger angle restriction in the normal operation process to match and limit each other [27]. The essence of FR is to adjust the active power delivered by the UHVDC system according to the system frequency response characteristics. Therefore, to facilitate the analysis of FR, this paper equates the UHVDC system with a second-order system [28]:
where the system characteristic roots are p1,2 = −10.03 ± j13.73.
During the debugging of the ±800 kV UHVDC engineering system, the current step test result is shown as the solid blue line in Figure 2. Its overshoot is about 10%, the response time is about 110 ms, and the peak time is about 230 ms, so the second-order system damping ratio ζ = 0.59 and the natural frequency ω0 = 17 can be obtained. The step response curve based on (2) is shown as the red line in Figure 2. Comparing the two curves, it can be seen that the response characteristics are basically consistent.
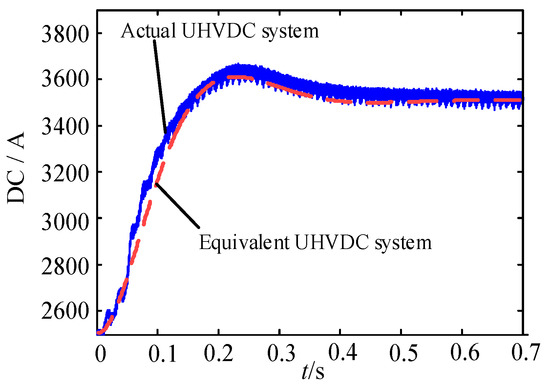
Figure 2.
Comparison of the step response of the equivalent DC system and the actual system.
2.1. Principle of Frequency Coordinated Control
At present, in the high permeability renewable energy grid-connected system, the FR of a renewable energy participating system is easily affected by wind speed and light conditions, which usually requires the cooperation of energy storage system and has high frequency regulation costs. The UHVDC system relies on the receiving power grid and has strong regulation ability, but the existing AFC cannot provide inertia support for the power grid. To make UHVDC participate in the system inertia response and primary FR control at the same time as a conventional synchronous generator, virtual inertia control is introduced based on conventional frequency droop control, and the frequency coordination control strategy of UHVDC system is obtained, as shown in Figure 3.
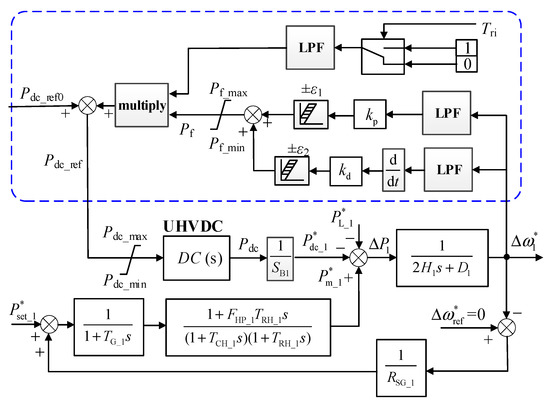
Figure 3.
Frequency coordinated control strategy for UHVDC power transmission system.
The UHVDC frequency coordination control consists of droop and inertia control. The droop control is mainly based on the frequency deviation to participate in the primary FR. The Inertia control is mainly based on the frequency differential to provide inertia support in the sending-end system. Through the coordination of inertia and droop control, the UHVDC system can participate in both the inertia response and the primary FR of the power grid system.
UHVDC frequency coordination control mainly refers to the synergistic effect of inertia and droop control. Inertia control mainly acts at the initial stage of load disturbance, and droop control is mainly effective when the system frequency deviation is large. Through the coordination of inertia and droop control, the RoCoF is further reduced, and more adjustment time is obtained for the primary FR. The fluctuation range of the system frequency is reduced, and the frequency stability is improved.
In Figure 3, Δωref* is the reference value of the system frequency deviation, which is usually 0. The system frequency dynamics is obtained in real time through the advanced PLL algorithm [29] in UHVDC control and protect system. Therefore, when frequency coordinated control is adopted, the auxiliary FR power Pf is:
where kp and kd are the proportional and derivative parameters for frequency control, respectively. ω1* is the frequency of the sending-end system.
In addition, as the UHVDC system has a fast-active regulation capability, the response time usually does not exceed 150 ms when the power step disturbance occurs. As the power system FR process belongs to the electromechanical transient process, its time scale is usually in seconds [30], so the regulation process of the UHVDC system can be neglected. After the introduction of frequency coordinated control, the actual active power Pdc delivered by the UHVDC system can be described as:
where Pdc_ref0 is the power reference value provided by the automatic power control or manual control in the UHVDC system.
To avoid FR due to small fluctuations, dead zone [31] is usually set in frequency coordinated control. For the droop control, the dead zone can be set to either the frequency deviation or the FR auxiliary power value. For the inertia control, the dead zone can be set to RoCoF or FR auxiliary power value. The switching on and off of frequency coordinated control is determined by the input enable signal Tri. To reduce the secondary impact of the frequency coordination control on the system frequency, a low-pass filter is usually used in UHVDC systems to achieve a smooth cast-off, e.g., moving average filter.
2.2. Mechanistic Analysis of Frequency Coordinated Control
To simplify the analysis, the frequency coordination control further ignores the influence of the filtering link, the dead zone link and the power limiting link. The uncertainty of renewable energy generation and the influence of frequency control are not considered, and it is equated to a constant power source. As shown in Figure 4, the frequency response simplified model of the UHVDC grid integrated system can be obtained. Therefore, the dynamic response equation of system frequency is:
where H1 and D1 are the inertia constant and damping coefficient of the sending-end system, respectively; Pm_1* and PL_1* are the mechanical power of prime motors and the system load power in the sending-end system, respectively, and PL_1* contains the renewable energy generation power; Pdc_1* is the per unit value of Pdc in the sending-end system; Pdc_1* = Pdc/SB1, SB1 is the basic power of the sending-end system.
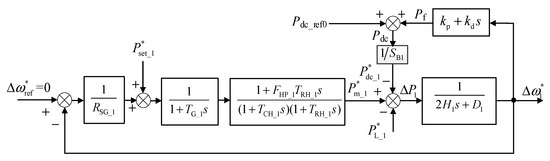
Figure 4.
Simplified frequency response model of UHVDC integrated system.
Combining (4) and (5), the frequency dynamic response with frequency coordinated control can be obtained as:
It can be seen from (6), when the control response time of the UHVDC system is neglected, the inertia constant increases by 0.5 kd/SB1 and the system damping increases by kp/SB1. Frequency coordinated control provides support for the system frequency from both the inertia and damping.
Combined with the FR principle of SG, the system frequency dynamic equation is:
where Pset_1* is the load reference power; RSG_1 is the equivalent droop coefficient of the sending-end system; TCH_1, TRH_1 and FHP_1 are the time constants of the reheat steam turbine main inlet volume and gas chamber, the time constant of the reheater and the power of the high-pressure stage, respectively.
It is assumed that the system frequency is in the rated state before the load disturbance. The RoCoF reaches the maximum value at the initial stage of the load disturbance, while the system frequency has not yet had time to change, i.e., Δω1* = 0, and Pm_1* remains unchanged. Assuming that the change of the non-frequency-sensitive load is ΔPL_1*, the maximum value of the RoCoF can be obtained from (7) as:
where ΔPL_1* = PL_1* − PL0_1*, PL0_1* is the initial value of the system load.
The initial value of auxiliary power for frequency coordinated control is:
After the primary FR process is finished, the speed control system of SG reaches steady state. At this time, based on (7), the system frequency deviation in steady state can be obtained as:
2.3. Parameter Calculating Method of Frequency Coordinated Control
Frequency coordinated control is introduced with the expectation that the UHVDC system can participate in FR in a manner similar to a traditional SG. Therefore, this section will give the calculating method of parameters for frequency coordinated control by analogy with the inertia response and primary FR principle of traditional SG.
The UHVDC system can quickly regulate its active power output and detect the RoCoF and frequency deviation in real time. The virtual inertia and droop control are introduced into the UHVDC system, so that the UHVDC system can regulate the active power delivered according to the frequency deviation and RoCoF, reducing the frequency deviation and RoCoF of the sending-end system. Under the same disturbance, the reduction in RoCoF is equivalent to the increase in the equivalent inertia of the AC system, and the decrease in steady-state frequency deviation is equivalent to the improvement in the system’s primary FR capability. Therefore, through frequency coordination control, UHVDC system can participate in the inertia response and primary FR control of the sending-end system at the same time.
In frequency coordinated control, Pf can be decomposed into two components, Pf_p and Pf_d, which simulate the primary FR characteristics and the inertia response characteristics of traditional SG, respectively. Among them, the frequency droop control of the auxiliary FR power is:
The auxiliary FR power for frequency inertia control is:
When calculating the parameters, the UHVDC system can be regarded as a virtual equivalent SG. The SG has the same capacity as the rated capacity of the original UHVDC system, and its mechanical speed ωvir and system frequency ω1 are completely coupled, i.e., ωvir = ω1/p0e, where p0e is the number of pole pairs of the equivalent SG. The concrete parameters of the UHVDC system and its equivalent SG are as follows: its rated capacity is Pdcn, its rated speed is ωdcn; its droop coefficient of equivalent SG is Rvir, its rotational inertia is Jvir, its inertia constant is Hvir; its rated rotating speed is ωvirn = ωn/p0e, and its rated power is Pvirn, and Pvirn = Pdcn.
The primary FR capability and inertial response capability of equivalent SG are related to Rvir and Hvir, respectively, so the calculating methods of kp and kd are as follows.
2.3.1. Calculating Method of Proportional Coefficient
The UHVDC system is involved in FR by increasing the delivered power when the system frequency increases, and its power regulation is in the opposite direction of SG, such that:
Combining (11) and (13), and considering Pvirn = Pdcn, we can obtain:
It can be seen from (14) that kp is proportional to the rated capacity Pdcn and inversely proportional to the droop coefficient Rvir.
2.3.2. Calculating Method of Differential Coefficient
When a disturbance occurs in the system, the SG releases the kinetic energy of the rotor to damp the system frequency change and reduce the system RoCoF.
The rotational kinetic energy of the equivalent SG is:
As the UHVDC system participates in FR by increasing the transmission power when the system frequency increases, its power regulation is in the opposite direction of SG:
Since SG usually operate around the rated speed, there are , considering Pvirn = Pdcn and , yielding:
Combining (12) and (17) yields:
From (18), kd is proportional to the inertia constant Hvir.
Compared with the actual SG, Hvir is larger than actual SG, as the UHVDC system exhibits an inertia in the grid determined by the amount of power it delivers. That is, the UHVDC system can exhibit a much larger equivalent inertia than an equivalent capacity SG by the proposed method.
2.4. Influencing Factors of Frequency Coordinated Control Performance
The UHVDC system mainly participates in the system FR process by adjusting the active power transmitted by the UHVDC system. Its FR characteristics and capacity are not only influenced by the frequency control parameters, but also by the control mode and operating conditions of the UHVDC system. Therefore, it is necessary to conduct further analysis.
2.4.1. Influence of Control Parameters
As shown in Figure 3, with the UHVDC frequency coordinated control, in addition to kp and kd, the low-pass filter parameters, the dead zone size and the FR auxiliary power limiting will also affect Pf.
When the first-order low pass filter is used, the larger the filter time constant, the greater the frequency response delay of the UHVDC system. The dead zone size determines the frequency response range, which needs to be matched and selected according to the strength of the AC system. In addition, UHVDC participation in the system FR process, when the FR power is large, will cause large fluctuations in the reactive power of the converter station, and then cause frequent switching of the AC filter.
2.4.2. Operating Mode and Operating Conditions
The operation mode and working condition of the UHVDC system mainly affect the on/off enable and FR margin of frequency coordinated control. UHVDC system operation modes mainly include joint/independent control, bipolar power/unipolar control, power/unipolar current control, power forward/reverse feed control and full/down voltage control, etc.
Normally, frequency control in the UHVDC control system is only allowed to be put in during the joint control mode, power forward transmission and power control mode, and the input operation is only allowed at the main control station. The UHVDC system will actively withdraw from frequency control when the UHVDC system exits the power control mode or joint control is withdrawn due to a station-to-station communication fault.
The UHVDC system’s full-voltage/down-voltage control mode and operating power level have an impact on the FR, mainly in terms of the FR margin. In the operation process of the UHVDC system, the range of DC power delivered is (Pdc_min, Pdc _max), where Pdc_min is the minimum operating power limit of DC and is usually 0.1 p.u., and Pdc _max is the maximum operating power limit. This value is related to the current overload capacity, and is usually between 1.0 p.u. and 1.3 p.u.
When the sending-end system frequency rises due to large capacity loads going off-grid, the UHVDC system participates in the system FR by increasing the DC power transmitted. Its FR margin ∆PINC is:
When the frequency of the sending-end system drops due to the high-capacity generator going off-grid, the UHVDC system participates in the system FR by reducing the DC power transmitted. Its FR margin ∆PDEC is:
3. The Influence of Frequency Control on Interconnected Power Systems via UHVDC
The UHVDC system will bring new power disturbances to the receiving-end system while participating in the FR, thus affecting the receiving-end system’s frequency index. Therefore, it is necessary to further analyze the influence of frequency coordination control on the frequency index. In addition, frequency coordinated control can effectively improve the frequency response characteristics. Due to the differential link introduced by virtual inertia control, further analysis of the stability of the whole interconnected power system via UHVDC is necessary.
3.1. Impact on Frequency Indicators of The Receiving-End System
Similar to the sending-end system, when the UHVDC system is connected, the dynamic equation for the receiving-end system is:
where ω2* is the frequency of the receiving-end system; H2 and D2 are the inertia constant and damping coefficient of the receiving-end system, respectively; Pm_2* and PL_2* are the mechanical power and load power of the receiving-end system, respectively; Pdc_2* is the per unit value of Pdc in the receiving-end system; and Pdc_2* = Pdc/SB2, SB2 is the basic power of receiving-end system.
To simplify the analysis, (21) ignores the power losses in the UHVDC system. When the frequency of sending-end system changes, the power change of the receiving-end system due to UHVDC system is:
At the initial time when the sending-end system is disturbed, the frequency of the sending-end system and the receiving-end system have not changed in time, i.e., Δω1* = 0, Δω2* = 0, Pm_1* and Pm_2* remain unchanged. At this point, combining (18), (21) and (22), we have:
From (23), the ratio of RoCoF of the receiving-end system to sending-end system is approximately equal to the ratio of equivalent rotational kinetic energy of the UHVDC system to the receiving-end system at the initial moment when the sending-end system is disturbed.
According to (14), (21) and (22), after the primary FR of the sending-end system is finished, the ratio of steady-state frequency deviation of each system due to the change of DC power is:
where RSG_2 is the droop coefficient of the receiving-end system.
3.2. Impact on the Stability of Interconnected Power Systems
If the primary FR control of the sending-end system is not considered, and only the FR control of the UHVDC system is considered, the transfer function block diagram of the system is shown in Figure 5. The UHVDC system adopts the second-order equivalent model with damping ratio ζ = 0.59 and natural frequency ω0 = 17.

Figure 5.
Diagram of UHVDC integrated system.
Based on Figure 5, the system closed-loop characteristic equation can be obtained as:
From (25), we can obtain:
where:
As shown in Figure 6, based on (26) and (27), root trajectories with kp/SB1 and kd/SB1 as variables can be obtained, respectively, where the system is in critical steady state when kp/SB1 is 213. Combined with (14), the maximum value of 1/Rvir can exceed 213, which shows that the droop coefficient to keep the system stable takes a wide range of values. As shown in Figure 6b, the value of kd hardly affects the system stability.
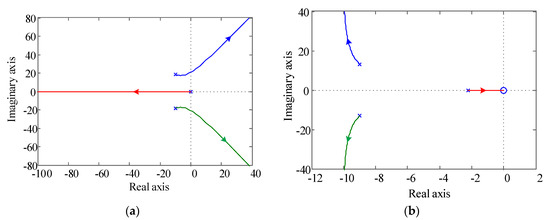
Figure 6.
System root trajectory diagram. (a) kp/SB1 as the variable (Hvir = 3.5 s); (b) kd/SB1 as the variable (Rvir = 0.04).
In (25), the other parameters are kept constant, and when kd = 0 (equivalent to no inertia control introduced), the system is in critical steady state when kp/SB1 is 142 in the root trajectory with kp/SB1 as the variable. As can be seen, the introduction of inertia control increases the range of values of kp to some extent. The introduction of inertia control in (25) is equivalent to the introduction of an open-loop zero point, which further improves the system stability.
When both the primary FR and the UHVDC system frequency control are considered, the interconnected power system in Figure 3 can be further simplified to avoid root trajectory analysis of higher order systems. As shown in Figure 7, firstly, since the ratio of the poles’ real part in (2) to D1/2H1 is close to 50, the power control dynamics of the UHVDC system are ignored, i.e., D(s) = 1. Furthermore, considering that both TG_1 and TCH_1 are much smaller than TRH_1, (1 + sTG_1)(1 + sTCH_1) is simplified to 1 + (TG_1 + TCH_1)s.
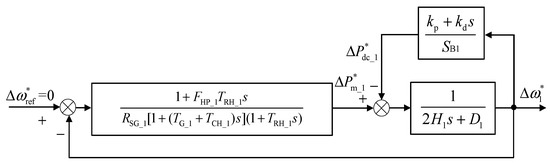
Figure 7.
Block diagram of interconnected power system via UHVDC.
According to Figure 7, the closed-loop characteristic equation for the interconnected power system via UHVDC can be obtained as:
It can be transformed from (28) to obtain:
where:
As shown in Figure 8, based on (29) and (30), root trajectories with kp/SB1 and kd/SB1 as variables can be obtained, respectively. Reasonable values of kp and kd hardly affect the stability of the system, obviously.
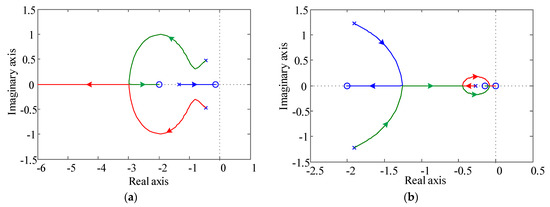
Figure 8.
System root locus. (a) kp/SB1 as the variable (Hvir = 3.5 s); (b) kd/SB1 as the variable (Rvir = 0.04).
From the point of view of system stability performance, kp and kd have a wide range of values after the introduction of frequency coordination control, so kp and kd in frequency coordinated control are mainly determined by the demands of the sending-end system and the affordability of the receiving-end system.
4. Experimental Validation
4.1. The Experimental Platform
To verify the effectiveness of the proposed coordinated control, we outline an analysis method and control calculating method of parameters. An experimental verification is carried out based on the RTDS closed-loop real-time simulation system containing the actual UHVDC control protection system and the RTDS real-time simulator. The structure of the experimental platform is shown in Figure 9a, containing the UHVDC model and the equivalent grid model. The UHVDC control and protection system (see Figure 9b) are identical to the Lingshao ±800 kV UHVDC engineering control and protection system structure, where PCP, PPR, CCP and CPR are pole control, pole protection, converter control and converter protection hosts, respectively. The control and protection host program are obtained by modifying some interface contents based on the actual engineering program.
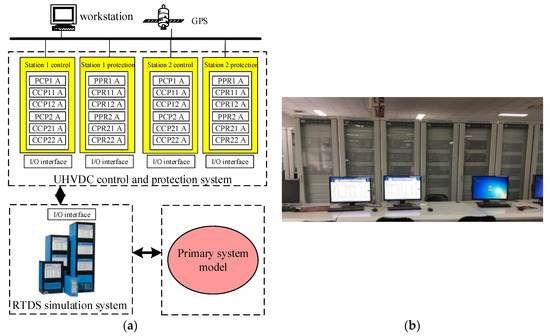
Figure 9.
RTDS closed-loop real-time simulation system. (a) Principles of closed-loop real-time simulation system; (b) UHVDC control and protection system.
The principal structure of the experimental system is shown in Figure 10. The sending-end system is equated with the equivalent SG power supply containing the speed regulation of the turbine generator, and its speed regulation principle is shown in Figure 3, where RSG_1 = 0.05, H1 = 3.5 s, D1 = 0, TG_1 = 0.2 s, TCH_1 = 0.3 s, TRH_1 = 7.0 s, FHP_1 = 0.3. All parameters of FR in the receiving-end system are the same as in the sending-end system. In addition, the renewable energy generation system is equated with a constant power source to maintain the same maximum power tracking control characteristics as the currently operating renewable energy field station. In the experiments, the UHVDC system is tested and verified based on pole 1, which has the rated power of 4000 MW and the rated DC voltage of 800 kV. The UHVDC system has steady-state power Pdc of 2000 MW, the renewable energy generation power is 2000 MW and the load active PL0 is 2000 MW.
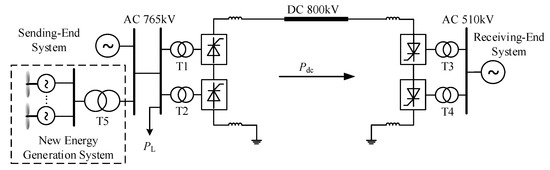
Figure 10.
Principle structure of experiment system.
4.2. Analysis of Experimental Results
4.2.1. Comparison of the System Response Characteristics under Different Strategies
To analyze the effects of different controls, four typical control strategies are selected in the experiment.
Case1: neither droop control nor inertia control is engaged.
Case2: inertia control only.
Case3: frequency droop control only.
Case4: using frequency coordinated control.
The experimental results under sudden increase and decrease in load at 800 MW operating conditions are shown in Figure 11 and Figure 12, respectively. f1 and f2 are the frequencies of the sending-end system and receiving-end system, respectively. RoCoF_1 and RoCoF_2 are the RoCoF of the sending-end and receiving-end system, respectively. Pdc is the actual power transmitted by the UHVDC. The minimum/maximum value, steady-state values, and their relative improvement values of system frequency in two cases are shown in Table 2 and Table 3, respectively.

Figure 11.
System frequency under different control modes (sudden load increase). (a) The frequencies of the sending-end system; (b) the RoCoF of the sending-end system; (c) the actual power transmitted by the UHVDC; (d) the frequencies of the receiving-end system; (e) the RoCoF of the receiving-end system.
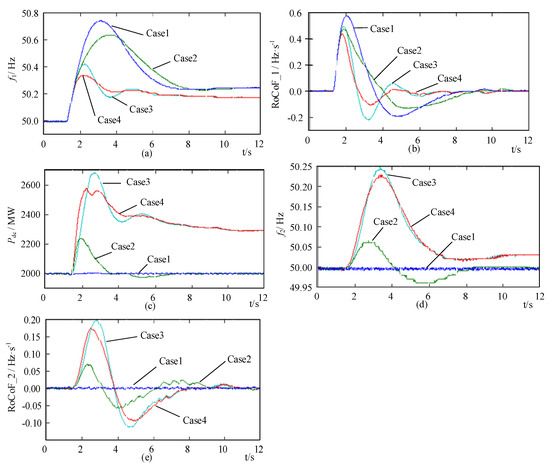
Figure 12.
System frequency under different control modes (sudden load decrease). (a) the frequencies of the sending-end system; (b) the RoCoF of the sending-end system; (c) the actual power transmitted by the UHVDC; (d) the frequencies of the receiving-end system; (e) the RoCoF of the receiving-end system.
Table 2.
Results under different frequency control modes (sudden increase in load).
Table 3.
Results under different frequency control modes (sudden decrease in load).
In frequency coordinated control, Rvir = 0.04 and Hvir = 3.5 s. The droop control dead zone ε1 = 50 MW, inertia control dead zone ε2 = 50 MW, droop control low-pass filter time constant T1 = 0.5 s, and inertia control low-pass filter time constant T2 = 0.4 s.
The comparison results show that when both droop and inertia control are not used (Case1), the UHVDC system does not respond to the frequency change and the transmission power remains unchanged. At this time, the frequency response characteristics of the sending-end system are the worst. When inertia control is adopted (Case2), the maximum frequency deviation of sending-end system frequency is improved, but the steady-state frequency value of the system is not improved. With frequency coordinated control (Case4), the absolute value of the maximum RoCoF and maximum frequency deviation of the sending-end system greatly improved, which are 0.16 Hz·s−1 and 0.39 Hz for sudden load increases and 0.15 Hz·s−1 and 0.41 Hz for sudden load decreases, respectively. Compared to the droop control only (Case3), the coordinated frequency control not only reduces the RoCoF of the sending-end system and wins time for the traditional SG regulation, but also reduces the maximum frequency deviation of the sending-end system and the regulation of the DC power, thus equivalently increasing the regulation capability and range of the FR control. For the receiving-end system, the RoCoF and the maximum frequency deviation are also reduced in Case4 due to the reduction in the DC power regulation amplitude by the frequency coordination control compared to Case3.
4.2.2. Analysis of the Influence of Control Parameters on the System Frequency
The system frequency response characteristics were compared under frequency coordinated control with a sudden load increase of 800 MW, under different Rvir, Hvir, ε1 and ε2 conditions, respectively. The influence principle of control parameters on the system frequency response characteristics is analyzed. For the comparison analysis, the default Rvir = 0.04, Hvir = 3.5 s, ε1 = 50 MW and ε2 = 50 MW, the droop control low-pass filter time constant is T1 = 0.5 s and the inertia control low-pass filter time constant is T2 = 0.4 s.
Figure 13 shows the comparison of the frequency response characteristics when Rvir is 0.08, 0.06, 0.04 and 0.02, respectively. Table 4 shows the comparison between the experimental results and the theoretical calculation of the frequency steady-state value. It can be seen from Figure 13 that, when other parameters are kept constant, as Rvir decreases, the frequency nadir and steady-state value of the sending-end system are constantly increasing, and the frequency recovery speed is also constantly improving, while the frequency nadir and steady-state values of the receiving-end system decrease and the frequency recovery speed decreases. It can be seen from Table 4 that the experimental results of the sending-end system are almost the same as the theoretical calculation, and the experimental results are basically the same as the theoretical calculation results for the ratio of the steady-state frequency deviation of the power system. Therefore, the frequency droop control of the UHVDC system can effectively simulate the system frequency primary frequency control, and the physical meaning of droop coefficient of the UHVDC system is the same as that of SG.
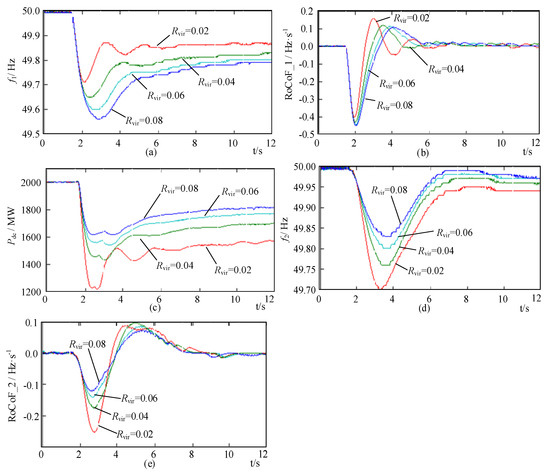
Figure 13.
Response with different droop coefficients. (a) The frequencies of the sending-end system; (b) the RoCoF of the sending-end system; (c) the actual power transmitted by the UHVDC; (d) the frequencies of the receiving-end system; (e) the RoCoF of the receiving-end system.
Table 4.
Calculated and simulation results under different control modes (load increase).
In Figure 14 are shown the comparative results of system frequency response characteristics with Hvir of 2.5 s, 3.5 s, 4.5 s and 5.5 s, respectively. Figure 14 shows that when other parameters are kept constant, as Hvir continues to increase, the decreasing rate of the sending-end system frequency decreases, the frequency nadir of the sending-end system increases, and the time to reach the minimum value of the frequency increases. Therefore, the inertia control of the UHVDC system can effectively increase the equivalent inertia of the sending-end system, and the physical meaning of the inertia constant of the UHVDC system is the same as that of SG.
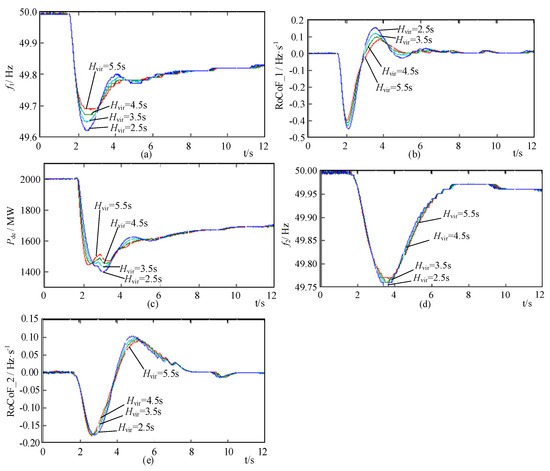
Figure 14.
Response characteristics with different inertia constant. (a) The frequencies of the sending-end system; (b) the RoCoF of the sending-end system; (c) the actual power transmitted by the UHVDC; (d) the frequencies of the receiving-end system; (e) the RoCoF of the receiving-end system.
Figure 15 is a comparison of system frequency response characteristics when the dead zone ε1 of droop control in frequency coordinated control is 100 MW, 75 MW, 50 MW and 25 MW, respectively. The minimum and steady-state values of the sending-end system frequency increase as ε1 decreases while other parameters remain constant.
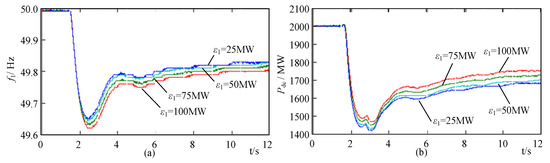
Figure 15.
Response characteristics with droop control dead zone changes. (a) The frequencies of the sending-end system; (b) the actual power transmitted by the UHVDC.
The system frequency response characteristics comparison results when the dead zone ε2 is 100 MW, 75 MW, 50 MW and 25 MW, respectively, are shown in Figure 16. As shown in Figure 16, when the other parameters remain unchanged, with the decrease in ε2, the falling rate of the sending-end system frequency decreases and the frequency nadir increases.
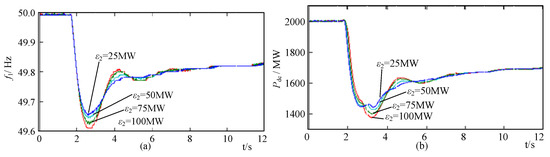
Figure 16.
Response characteristics when inertia control dead zone changes. (a) The frequencies of the sending-end system; (b) the actual power transmitted by the UHVDC.
4.2.3. The Influence of UHVDC Operating Power on System Frequency
Figure 17 shows the frequency response characteristics of the UHVDC system under different operating power conditions for a sudden increase in system load of 800 MW with the control parameters held constant. When the DC operating power is close to the minimum power operating point of 400 MW, the DC participation in FR is limited by the minimum power value, resulting in the actual FR power of the UHVDC system being smaller than the frequency controller output value, thus limiting the FR capability of the UHVDC system.
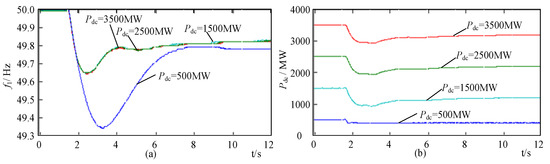
Figure 17.
Response characteristics with different DC power. (a) The frequencies of the sending-end system; (b) the actual power transmitted by the UHVDC.
5. Conclusions
In this paper, a coordinated frequency control for UHVDC participating in system FR is presented. The response characteristics of frequency coordinated control are analyzed. The effectiveness of the proposed control method, parameter calculating method and analysis method are verified.
Compared to traditional frequency control of UHVDC (e.g., AFC), the proposed control strategy can participate in both the inertial response of the sending-end system and the primary FR process. The proposed control strategy shares the FR pressure of traditional SGs mainly by changing the active power delivered by the UHVDC. Its FR effect is mainly reflected in the increased inertia and damping of the system.
The essence of UHVDC participating in FR is to let the receiving power grid provide frequency support for the sending power grid. Therefore, compared with the traditional renewable energy power generation system participating in system FR, the regulating ability of UHVDC participating in system FR is mainly determined by the strength of the receiving-end system and the UHVDC frequency modulation margin, which can provide considerable FR power without increasing energy storage and other equipment; therefore, it has good economy.
In frequency coordinated control, the droop coefficient and droop control dead zone mainly affect the maximum frequency deviation of the system frequency and the primary FR steady state value, the inertia constant and inertia control dead zone mainly affect the RoCoF and maximum frequency deviation, and the operating mode and power of the UHVDC system mainly affect the switching enable and FR margin of frequency coordinated control.
UHVDC participates in the FR of the sending-end system through frequency coordination control. The maximum RoCoF and steady-state frequency deviation of the receiving-end system are mainly determined by the ratio of the rated capacity of UHVDC system to the receiving-end system. The smaller the ratio, the smaller the influence on receiving-end system frequency.
Author Contributions
Conceptualization, Q.S. and Q.Z. (Qiang Zou); Data curation, Q.S. and K.L.; Formal analysis, Q.S. and H.L. (Hongqing Liu); Funding acquisition, Q.S.; Investigation, Q.S., K.L. and Y.W.; Methodology, Q.S. and H.L. (Hongqing Liu); Project administration, Q.S., Y.W. and Q.Z. (Qingwu Zhang); Resources, Q.S. and Q.Z. (Qingwu Zhang); Software, Q.S., Y.L. and H.L. (Haiying Li); Supervision, Q.S. and Y.L.; Validation, Q.S., H.L. (Haiying Li) and Q.Z. (Qiang Zou); Visualization, Q.S.; Writing—original draft, Q.S. and H.L. (Hongqing Liu); Writing—review and editing, Q.S. and H.L. (Hongqing Liu). All authors have read and agreed to the published version of the manuscript.
Funding
This work was supported by the National Key R&D Program of China (2016YFB0900600) and Science and Technology Projects of State Grid Corporation of China (5102-201956300A-0-0-00).
Data Availability Statement
Data is contained within the article.
Conflicts of Interest
The authors declare no conflict of interest.
Nomenclature
| D1 | Damping coefficient of the sending-end system |
| f | Real-time frequency (Hz) |
| fn | Rating frequency (Hz) |
| fmin_1 | Frequency nadir in the sending- end system (Hz) |
| fmax_1 | Maximum frequency in the sending- end system (Hz) |
| ∆fmin_1 | Improved value of frequency nadir in the sending- end system (Hz) |
| ∆fmax_1 | Improved maximum frequency in the sending- end system (Hz) |
| fsteady_1 | Steady-state frequency in the sending- end system (Hz) |
| fsteady_cal_1 | Calculated result of the fsteady_1 in the sending-end system (Hz) |
| fsteady_sim_1 | Experimental result of the fsteady_1 in the sending-end system (Hz) |
| ∆fsteady_1 | Improved value of steady-state frequency in the sending-end system (Hz) |
| fsteady_cal_1 | Calculated result of the steady-state frequency in the sending-end system (Hz) |
| fsteady_sim_1 | Experimental result of the steady-state frequency in the sending-end system (Hz) |
| fmin_2 | Frequency nadir in the receiving-end system (Hz) |
| fmax_2 | Maximum frequency in the receiving-end system (Hz) |
| fsteady_2 | Steady-state frequency in the receiving-end system (Hz) |
| fsteady_sim_2 | Experimental result of the steady-state frequency in the receiving-end system (Hz) |
| H1 | Inertia constant coefficient of the sending-end system (s) |
| FHP_1 | Power of the high-pressure stage (p.u.) |
| Fb | Regulation dead zone value (p.u.) |
| Hvir | Inertial coefficient of equivalent SG (s) |
| kp | Proportional parameters for frequency control |
| kd | Derivative parameters for frequency control |
| Pf | Auxiliary frequency regulation power (Watt) |
| Pdc | Actual active power of the UHVDC system (Watt) |
| Pdcn | Rated capacity of the UHVDC system (Watt) |
| Pdc_ref0 | Power reference value provided by the manual control (Watt) |
| Pdc_min | Minimum operating power limit of the UHVDC system (Watt) |
| Pdc _max | Maximum operating power limit of the UHVDC system (Watt) |
| Pm_1* | Mechanical power in the sending-end system (p.u.) |
| PL_1* | System load power in the sending-end system (p.u.) |
| Pdc_1* | Per unit value of Pdc in the sending-end system (p.u.) |
| Pm_2* | Mechanical power in the receiving-end system (p.u.) |
| PL_2* | Load power of the receiving-end system (p.u.) |
| Pdc_2* | Per unit value of Pdc in the receiving-end system (p.u.) |
| Pvirn | Rated active power of the virtual equivalent SG (Watt) |
| Pset_1* | Load reference power (p.u.) |
| ΔPL_1* | Non-frequency-sensitive load (p.u.) |
| PL0_1* | Initial value of the system load (p.u.) |
| Pf_p | Auxiliary FR power for primary frequency regulation (Watt) |
| Pf_d | Auxiliary FR power for frequency inertia control (Watt) |
| p0e | Number of pole pairs |
| RSG_1 | Equivalent droop coefficient of the sending-end system |
| Rvir | Droop coefficient of equivalent SG |
| SB1 | Basic power of sending-end system (Watt) |
| SB2 | Basic power of receiving-end system (Watt) |
| Tri | Input enable signal |
| TCH_1 | Time constant of the reheat steam turbine main inlet volume and gas chamber (s) |
| TRH_1 | Time constant of the reheater (s) |
| ω | Angular frequency (rad/s) |
| ωn | Rated angular frequency (rad/s) |
| ω0 | Natural frequency |
| ω1* | Frequency of the sending-end system (p.u.) |
| ωvir | Mechanical speed (rad/s) |
| Δω* | Per unit value of system frequency deviation (p.u.) |
| Δωref* | Reference value of the system frequency deviation (p.u.) |
| ε1, ε2 | Dead zone value |
| ζ | Second-order system damping ratio |
| p.u. | per-unit value |
| * | per-unit value (superscript) |
References
- Xiong, L.; Liu, X.; Liu, Y.; Zhuo, F. Modeling and stability issues of voltage-source converter dominated power systems: A review. CSEE J. Power Energy Syst. 2020, 1–18. [Google Scholar] [CrossRef]
- Arcia-Garibaldi, G.; Cruz-Romero, P.; Gómez-Expósito, A. Future power transmission: Visions, technologies and challenges. Renew. Sustain. Energy Rev. 2018, 94, 285–301. [Google Scholar] [CrossRef]
- Lugovoy, O.; Gao, S.; Gao, J.; Jiang, K. Feasibility study of China’s electric power sector transition to zero emissions by 2050. Energy Econ. 2021, 96, 105176. [Google Scholar] [CrossRef]
- Humpert, C. Long distance transmission systems for the future electricity supply–Analysis of possibilities and restrictions. Energy 2012, 48, 278–283. [Google Scholar] [CrossRef]
- Krpan, M.; Kuzle, I. Dynamic characteristics of virtual inertial response provision by DFIG-based wind turbines. Electr. Power Syst. Res. 2020, 178, 106005. [Google Scholar] [CrossRef]
- Xiong, L.; Li, Y.; Zhu, Y.; Yang, P.; Xu, Z. Coordinated Control Schemes of Super-Capacitor and Kinetic Energy of DFIG for System Frequency Support. Energies 2018, 11, 103. [Google Scholar] [CrossRef] [Green Version]
- Ratnam, K.; Palanisamy, K.; Yang, G. Future low-inertia power systems: Requirements, issues, and solutions-A review. Renew. Sustain. Energy Rev. 2020, 124, 109773. [Google Scholar] [CrossRef]
- Hafiz, F.; Abdennour, A. Optimal use of kinetic energy for the inertial support from variable speed wind turbines. Renew. Energy 2015, 80, 629–643. [Google Scholar] [CrossRef]
- Du, L.; Li, M.; Tang, Z.; Xiong, L.; Ma, X.; Tang, G. A Fast Positive Sequence Components Extraction Method with Noise Immunity in Unbalanced Grids. IEEE Trans. Power Electron. 2020, 35, 6682–6685. [Google Scholar] [CrossRef]
- Xiong, L.; Liu, X.; Zhang, D.; Liu, Y. Rapid Power Compensation-Based Frequency Response Strategy for Low-Inertia Power Systems. IEEE J. Emerg. Sel. Top. Power Electron. 2021, 9, 4500–4513. [Google Scholar] [CrossRef]
- Dreidy, M.; Mokhlis, H.; Mekhilef, S. Inertia response and frequency control techniques for renewable energy sources: A review. Renew. Sustain. Energy Rev. 2017, 69, 144–155. [Google Scholar] [CrossRef]
- Morren, J.; Pierik, J.; De-Haan, S.W.H. Inertial response of variable speed wind turbines. Electr. Power Syst. Res. 2006, 76, 980–987. [Google Scholar] [CrossRef]
- Terazono, D.; Liu, J.; Miura, Y.; Sakabe, S.; Bevrani, H.; Ise, T. Grid Frequency Regulation Support From Back-to-Back Motor Drive System With Virtual-Synchronous-Generator-Based Coordinated Control. IEEE Trans. Power Electron. 2021, 36, 2901–2913. [Google Scholar] [CrossRef]
- Vidyanandan, K.V.; Senroy, N. Primary frequency regulation by deloaded wind turbines using variable droop. IEEE Trans. Power Syst. 2013, 28, 837–846. [Google Scholar] [CrossRef]
- Aamir, A.; North China Electric Power University; Qiao, L.; Guo, C.; Rehman, A.U.; Yang, Z.; Global Energy Interconnection Research Institute Co. Ltd. Impact of synchronous condenser on the dynamic behavior of LCC based UHVDC system hierarchically connected to AC system. CSEE J. Power Energy Syst. 2019, 5, 190–198. [Google Scholar] [CrossRef]
- Huang, J.; Chen, Y.; Gao, Q.; Zhang, Y.; Yang, R.; Yang, R.; Diao, H. Research on HVDC frequency limit control to improve frequency restoration in muti-HVDC asynchronous system. In Proceedings of the 8th Renewable Power Generation Conference (RPG 2019), Shanghai, China, 24–25 October 2019; pp. 1–6. [Google Scholar] [CrossRef]
- Hu, J.; Zhao, C. Auxiliary frequency control of HVDC systems for wind power integration. In Proceedings of the 2010 5th International Conference on Critical Infrastructure (CRIS), Beijing, China, 20–22 September 2010; pp. 1–5. [Google Scholar] [CrossRef]
- Rao, H.; Wu, W.; Mao, T.; Zhou, B.; Hong, C.; Liu, Y.; Wu, X. Frequency control at the power sending side for HVDC asynchronous interconnections between yunnan power grid and the rest of CSG. CSEE J. Power Energy Syst. 2021, 7, 105–113. [Google Scholar]
- Mehrabankhomartash, M.; Saeedifard, M.; Yazdani, A. Adjustable Wind Farm Frequency Support Through Multi-Terminal HVDC Grids. IEEE Trans. Sustain. Energy 2021, 12, 1461–1472. [Google Scholar] [CrossRef]
- Prakash, A.; Murali, S.; Shankar, R.; Bhushan, R. HVDC tie-link modeling for restructured AGC using a novel fractional order cascade controller. Electr. Power Syst. Res. 2019, 170, 244–258. [Google Scholar] [CrossRef]
- Ambia, M.N.; Meng, K.; Xiao, W.; Al-Durra, A.; Dong, Z.Y. Adaptive Droop Control of Multi-Terminal HVDC Network for Frequency Regulation and Power Sharing. IEEE Trans. Power Syst. 2021, 36, 566–578. [Google Scholar] [CrossRef]
- Qing, A.; Liu, T.; Yue, Y.; Qing, J.; Yan, T. Multi-source coordinated frequency regulation strategy for HVDC sending system with large-scale wind power. Electr. Power Autom. Equip. 2020, 40, 56–63. [Google Scholar] [CrossRef]
- Mark, N.; Hans, V.; Emil, L.; Craig, D.; Susana, B.; Chloe, L.; Vu, V. European Network of Transmission System Operators for Electricity. 2014. Available online: https://www.entsoe.eu/publications/position-papers/entso-e-policy-recommendations/Pages/default.aspx (accessed on 4 July 2021).
- Power Systems Relaying Committee. IEEE Guide for the Application of Protective Relays Used for Abnormal Frequency Load Shedding and Restoration; IEEE Standard C37.117-2007; IEEE: Piscataway, NJ, USA, 2007; pp. 1–55. [Google Scholar] [CrossRef]
- Freitas, W.; Xu, W.; Affonso, C.M.; Huang, Z. Comparative Analysis between ROCOF and Vector Surge Relays for Distributed Generation Applications. IEEE Trans. Power Deliv. 2005, 20, 1315–1324. [Google Scholar] [CrossRef]
- Xiong, L.; Liu, L.; Liu, X.; Liu, Y. Frequency Trajectory Planning Based Strategy for Improving Frequency Stability of Droop-Controlled Inverter Based Standalone Power Systems. IEEE J. Emerg. Sel. Top. Circuits Syst. 2021, 11, 176–187. [Google Scholar] [CrossRef]
- Miao, Y.; Cheng, H. An Optimal Reactive Power Control Strategy for UHVAC/DC Hybrid System in East China Grid. IEEE Trans. Smart Grid 2014, 7, 392–399. [Google Scholar] [CrossRef]
- Wang, H.; Han, M.; Lei, X.; Lin, S.; Li, X.; Li, Z.; Tao, X. Frequency Control Analysis and System Commissioning for Thermal Generation with HVDC Islanded Operation. Proc. CSEE 2017, 37, 139–148. [Google Scholar] [CrossRef]
- Xiong, L.; Zhuo, F.; Liu, X.; Zhu, M.; Yi, H.; Wang, F. A Novel Fast Open-loop Phase Locking Scheme Based on Synchronous Reference Frame for Three-phase Non-ideal Power Grids. J. Power Electron. 2016, 16, 1513–1525. [Google Scholar] [CrossRef] [Green Version]
- Attya, A.B.; Dominguez-Garcia, J.L.; Anaya-Lara, O. A review on frequency support provision by wind power plants: Current and future challenges. Renew. Sustain. Energy Rev. 2018, 81, 2071–2087. [Google Scholar] [CrossRef] [Green Version]
- Sanz, I.M.; Judge, P.D.; Spallarossa, C.E.; Chaudhuri, B.; Green, T.C. Dynamic Overload Capability of VSC HVDC Interconnections for Frequency Support. IEEE Trans. Energy Convers. 2017, 32, 1544–1553. [Google Scholar] [CrossRef] [Green Version]
Publisher’s Note: MDPI stays neutral with regard to jurisdictional claims in published maps and institutional affiliations. |
© 2021 by the authors. Licensee MDPI, Basel, Switzerland. This article is an open access article distributed under the terms and conditions of the Creative Commons Attribution (CC BY) license (https://creativecommons.org/licenses/by/4.0/).