Article

On the Utilization of Modified Red Mud in Dimethyl Disulfide and Methyl Mercaptan Emission Abatement

by
Sanna Päivärinta-Antikainen
1,*,
Satu Ojala
1,
Satu Pitkäaho
1,
Lenka Matějová
2,3 and
Riitta L. Keiski
1
1
Environmental and Chemical Engineering, Faculty of Technology, University of Oulu, P.O. Box 4300, FI-90014 Oulu, Finland
2
Institute of Environmental Technology, CEET, VŠB-Technical University of Ostrava, 17. Listopadu 15/2172, Poruba, 708 00 Ostrava, Czech Republic
3
Institute of Chemical Process Fundamentals of the Czech Academy of Sciences, v.v.i., Rozvojová 135, Suchdol, 165 02 Praha, Czech Republic
*
Author to whom correspondence should be addressed.
Resources 2023, 12(1), 9; https://doi.org/10.3390/resources12010009
Submission received: 31 October 2022 / Revised: 29 November 2022 / Accepted: 12 December 2022 / Published: 3 January 2023
(This article belongs to the Special Issue Women's Special Issue Series: Sustainable Resource Management)

Abstract

:
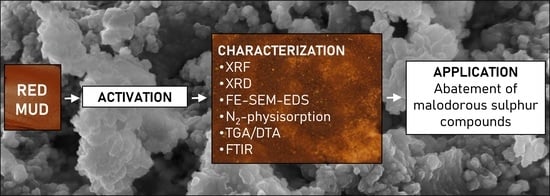
In this paper, a novel application of industrial waste, namely red mud (RM), in the abatement of two malodorous and harmful sulfur compounds, dimethyl disulfide (DMDS) and methyl mercaptan (MM), is presented. The effects of calcination and activations with hydrochloric acid or a mixture of hydrochloric and orthophosphoric acid on the properties and performance of RM are compared using laboratory-scale experiments. The RM-based materials were characterized by XRF, XRD, FE-SEM, N2-physisorption, TGA/DTA, and FTIR analyses. RM exhibits very promising catalytic properties in the abatement of both DMDS and MM. The hydrochloric acid-activated RM was the most active in both cases, which was explained by its rather high specific surface area (144 m2 g−1), higher contents of Fe2O3 and TiO2, as well as lower content of phosphorus. For both DMDS and MM, the main oxidation products were sulfur dioxide, carbon monoxide, and carbon dioxide. DMDS was observed as a reaction intermediate in MM oxidation. While the final conversions of DMDS and MM were high, the oxidation was not complete, indicated by the formation of carbon monoxide. Nevertheless, the modified RM appears as a very interesting alternative to the existing DMDS and MM abatement catalysts.

Graphical Abstract

1. Introduction

Red mud (RM) is a waste formed during aluminum oxide production from bauxite ore. RM contains mainly Fe, Al, Ti, and Si in oxide- and hydroxide forms and has a pH in the range of 10–12.5. RM is not a homogenous material, and the characteristics of RM depend on the quality of bauxite ore and the setting parameters of the Bayer process [1]. When producing one ton of aluminum oxide, one to two tons (dry weight) of bauxite residues is formed [2]. The global annual production rate of RM is over 120 million tons [3]. Due to the high production rate leading to massive stockpiling and potentially serious environmental hazards [4], it is necessary to find new ways to use RM. On the other hand, the catalysts contain several elements and compounds that are included in the EU critical raw materials list [5]. Therefore, finding alternative raw materials for catalysts and potential new catalytic materials is of utmost importance.
The utilization of RM has been studied in several types of applications. The potential applications include the use of RM in building materials, metal recovery, pigments and paints, ceramic production, soil amendment, catalysts and catalyst supports, and as adsorbents in environmental applications [2,6]. RM has been used, for example, as a catalyst or catalyst support in the oxidation of methane [7], propane [8], toluene [9], carbon monoxide [10], and phenol [11] in addition to hydrogenation [12,13], hydrodechlorination of tetrachloroethylene [14] and biodiesel production [15].
RM could be utilized in several environmental remediation applications, and regarding waste gas and typical air pollutants, RM has been studied in the removal of VOCs, SO2, CO, and NO2 [16,17]. Among sulfur compounds, RM has been studied in the removal of hydrogen sulfide (H2S) [18]. In that application, RM was used as a suspension in distilled water, and H2S gas was removed as FeS2, FeS, S, and sulfide minerals [18].
When secondary materials and wastes, such as RM, are used as a starting material for adsorbents or catalysts, pretreatment and activation treatments are required. Activation with acid is known to increase the specific surface area of RM [12,13,19]. For example, in the study of Pratt and Christoverson [13], activation of RM with HCl increased the specific surface area and decreased the amounts of Na and Ca in RM. Higher surface areas and larger pore volumes are beneficial in both adsorption and catalysis.
In this study, RM modified in four different ways was studied in the abatement of sulfur-containing emissions using dimethyl disulfide (DMDS) and methyl mercaptan (MM) as the model compounds. The abatement of sulfur-containing emissions can be realized, for example, by catalytic oxidation and adsorption [20,21]. From the environmental point of view, the utilization of industrial wastes and side-streams as adsorption materials and catalysts forms an interesting research area supporting the circular economy approach. These materials, such as RM, have the potential to be used either directly as catalysts or as compound sources in catalyst preparation, and they give the advantage of replacing pristine natural resources and therefore offer both environmental and economic benefits [22]. Based on the literature, it is expected that RM could have both adsorptive and catalytic properties [2,23].
DMDS and MM are malodorous, and they originate, for example, from pulp mills [24] and wastewater treatment plants [25]. DMDS can be classified as a sulfur-containing volatile organic compound (S-VOC). VOCs, in general, form a significant group of air pollutants. They contribute to global warming, stratospheric ozone depletion, and photochemical ozone formation at the ground level. Some VOCs, such as benzene, formaldehyde, and furans, have human health effects due to their toxicity or carcinogenicity [26].
DMDS (boiling point 110 °C) and MM (boiling point 6 °C) have negative health effects on humans [27,28]. They are a nuisance to people even at very low concentrations due to their low odor thresholds [24], which are at ppb-level [29], the threshold limit of MM being lower than that of DMDS. The effects of short-term exposure to higher concentrations of DMDS include irritation of the eyes and respiratory tract, mild skin irritation, and possible effects on the central nervous system [27]. The effects of short-term exposure to higher concentrations of MM may be more severe, leading even to respiratory depression. High exposure levels of MM may cause unconsciousness and death [28].
The occupational exposure limit (OEL) for both DMDS and MM is 0.5 ppm [27,28]. In addition to the OEL, in Finland, for example, there are guideline values for air quality defined in the decision made by the Council of State [30]. These guidelines are meant to be used already at the planning stage of the infrastructure to prevent adverse health effects. The limit value for total reduced sulfur compounds (TRS) in Finland is 10 µg m−3, measured as the second highest daily value of the month and reported as sulfur at 20 °C and 1 atm [30]. In addition to these limit values, companies can naturally have their own emission limit values set by the environmental authorities. All these lead to the outcome that TRS emissions need to be prevented or treated.
The aims of the current work were to discover the possibility of utilizing modified RM in the abatement of MM and DMDS. The RM was modified in four different ways, and the abatement efficiencies of the modified materials were evaluated in the gas-phase abatement of MM and DMDS. The used materials were characterized using several physico-chemical methods.

2. Materials and Methods

2.1. Pretreatment and Activation of Red Mud

RM originally received in a sludge form (pH around 11–13), was filtered and washed with distilled water, followed by drying at 110 °C in a heated cabinet overnight. The dried RM was divided into four (4) fractions that were each pretreated and activated in different ways (Table 1).
The pretreatments of the RM were the following: (1) The first fraction, washed red mud (WRM), was separated and crushed to be used as it was after washing and filtration. (2) The second fraction, called the calcined red mud (CRM), was further calcined in a muffle furnace at 500 °C for 2 h. (3) The third fraction, HCl-activated red mud (ARM), was treated according to a dissolution/precipitation process introduced by Pratt and Christoverson [13,31]. The RM was mixed with distilled water to reach a 5 wt-% RM mixture. After stirring, 8 wt-% of hydrochloric acid (HCl, 36–38 wt-% BAKER ANALYZED, J.T.Baker) was added, and the mixture was boiled for ~20 min under stirring. Distilled water was then added until the mixture reached the total volume of 1.3 L. Ammonium hydroxide (NH4OH, 25% BAKER ANALYZED, J.T. Baker) was used to adjust the pH to the value of 8.3. The suspension was kept at ~50 °C for 10 min. The mixture was then filtered and washed 3 times with distilled water. ARM was also dried at 110 °C overnight and then calcined at 500 °C for 2 h, identical to CRM. (4) The fourth fraction, HCl + H3PO4 -activated red mud (PARM), was prepared according to the method introduced by Álvarez et al. [12]. This activation method was originally based on the method of Pratt & Christoverson [13], but in addition to HCl, orthophosphoric acid (H3PO4, 85%, Merck Millipore, Burlington, MA, USA) was used. Phosphorus (P) has previously been shown to increase the stability, acidity, specific surface area, and pore volume of the Al2O3 catalyst [32]. The pretreatment of PARM was similar to that of ARM, except that the acid treatment was conducted with a mixture of HCl and H3PO4 with the ratio aiming for 4 wt-% of P in the calcined material. Each RM fraction was also crushed into a finer particle size.

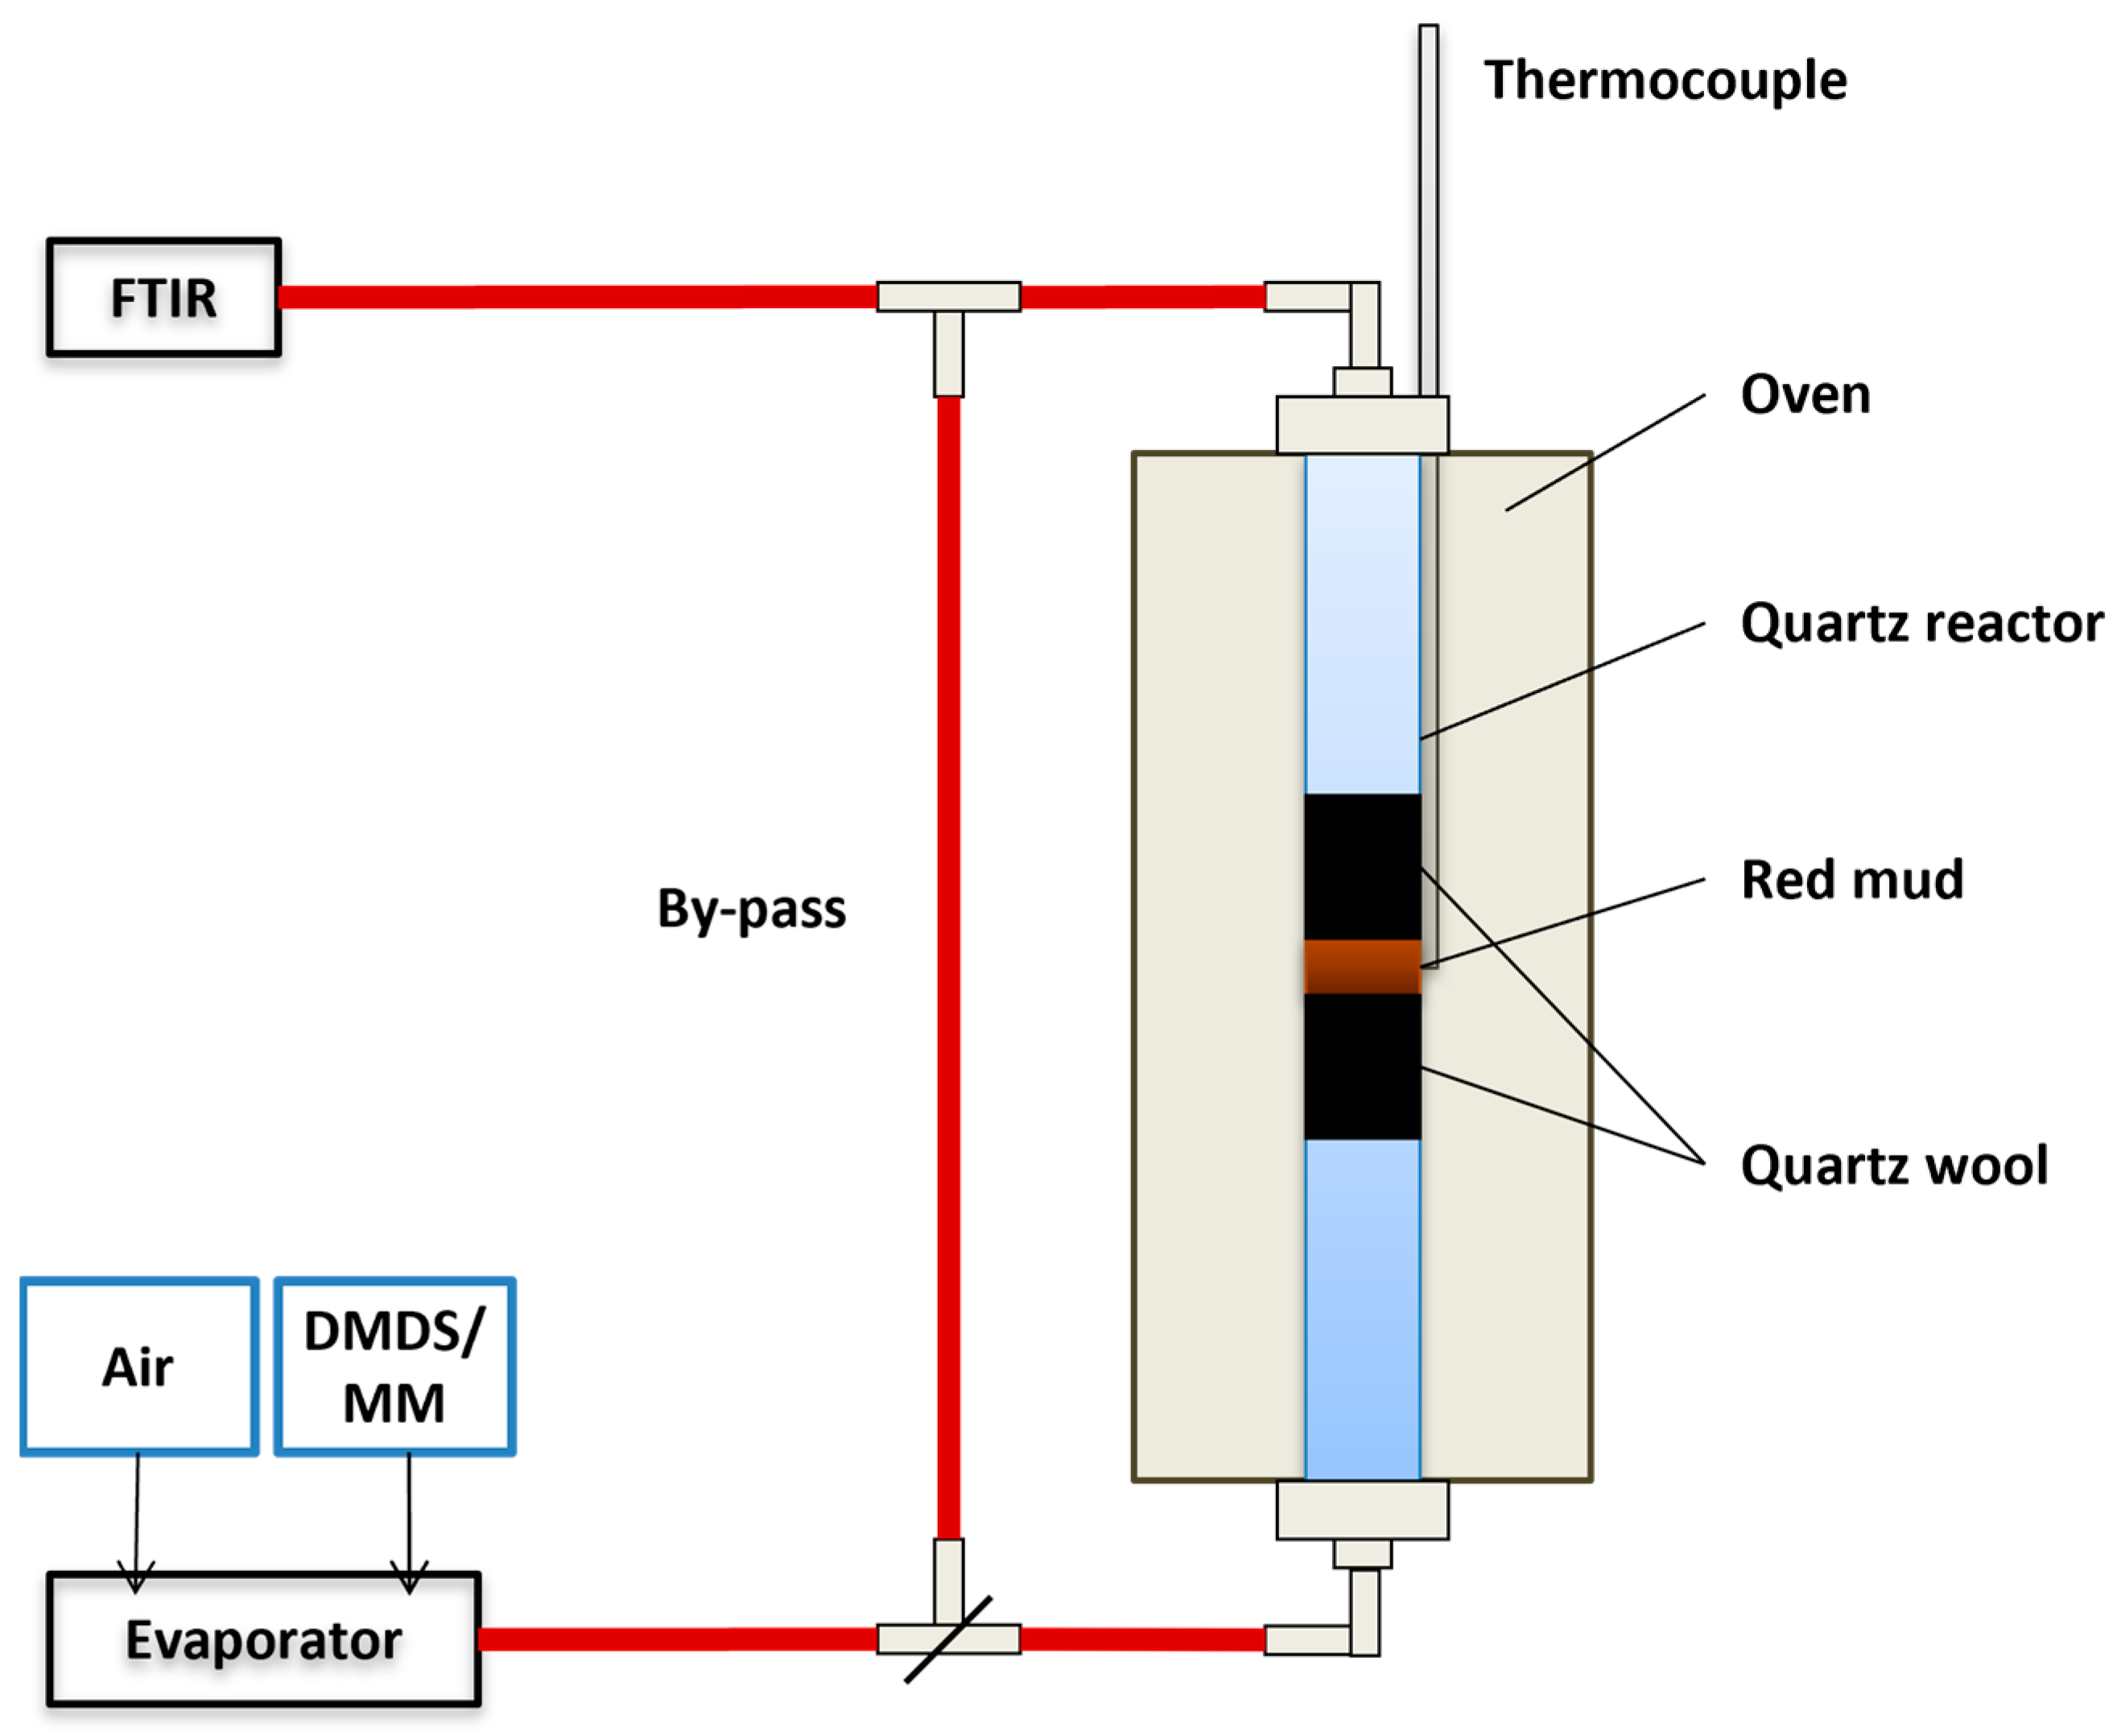
2.2. Abatement of DMDS and MM

Catalytic and adsorptive properties of different RM fractions were explored separately with DMDS (>99%, Merck, Rahway, NJ, USA) and MM (2000 ± 2 mol-ppm, AGA) in the air. The experimental set-up (Figure 1) consisted of an evaporator through which DMDS or MM, and air were fed and a tubular quartz reactor inside a vertically aligned furnace. The temperature was measured outside the reactor and corrected to correspond to the inside temperatures using equations generated based on the temperature calibration. The parts of the set-up were connected with heated Teflon lines, and the gases were analyzed with an FTIR gas analyzer (Gasmet CR-2000, resolution 8 cm−1, wavenumber range 600–4200 cm−1). Gas analysis was conducted every 30 s. Compounds included in the analysis were water vapor (H2O), carbon dioxide (CO2), carbon monoxide (CO), nitrogen monoxide (NO), nitrogen dioxide (NO2), nitrous oxide (N2O), sulfur dioxide (SO2), methane (CH4), sulfur trioxide (SO3), methyl mercaptan (CH4S), dimethyl sulfide (C2H6S), dimethyl disulfide (C2H6S2), and methanol (CH4O). Compressed air used in the experiments contained some CO2 (ca. 400 ppm). The FTIR analysis used in the activity experiments has a detection limit of 2 ppm.
RM was packed in the reactor between two wads of quartz wool. The total gas flow through the RM bed was 1 L min−1 in all the experiments performed. The amounts of RM, the initial feeds of DMDS, and the WHSV (weight hourly space velocity) values in the DMDS experiments are presented in Table 2. In the MM experiments, 0.15 g of WRM, CRM, ARM, or PARM was used, the MM feed was 120 ppm, and WHSV was 400 L h−1 g−1. In each experiment, the heating rate was 5 °C min−1, starting from 30 °C and going up to about 500 °C or to the temperature of 100% conversion. Each experiment was repeated at least twice to verify the results. Before the actual experiments, reference experiments were conducted with both an empty reactor and a reactor packed with quartz wool in order to study the thermal oxidation of DMDS and MM.

2.3. Characterization of Red Mud

The major elements and their relative amounts in the RM fractions were determined with an XRF Spectrometer (PANalytical AXIOSmAX 4 kW PW2450 equipped with Omnian software (SuperQ software Ver. 5.3C, Omnian Standardless method for analysing concentrations.)) (Produced by Malvern Panalytical B.V.—Amelo, The Netherlands). Analysis was made using the loose powder method. The crystalline phase compositions of all the RM fractions were analyzed by XRD (Siemens, Karlsruhe, Germany) using a Siemens D5000 diffractometer equipped with a Cu (λCu = 1.542 Å) anode X-ray tube and a secondary monochromator (graphite). The database used in the interpretation of the results was ICDD (International Center of Diffraction Data) PDF-2 release 2006. The crystallite size of hematite (Fe2O3) in each RM fraction was calculated using the Scherrer equation. The relative amounts of phases were evaluated using the Semi-Quantitative RIR (Reference Intensity Ratio) method. The method is based on the relative intensities of the reference phase and aluminum oxide. A differential scanning calorimeter with a thermogravimetric analyzer (TGA/DTA, NETZSCH STA 409 PC/PG) equipped with a mass spectrometer (Netzsch QMS 403 C Aëolos) was used for analyzing the non-calcined RM fraction, i.e., WRM (washed red mud). The analysis was conducted under synthetic air (80% N2, 20% O2), and the temperature was increased from 30 °C to 1000 °C at a rate of 20 °C min−1.
Nitrogen physisorption measurements at −196 °C were performed on an automated volumetric apparatus ASAP2020 Micromeritics after degassing the samples at 150 °C under 1 Pa vacuum for 2 h. The specific surface area, SBET, was evaluated from the nitrogen adsorption isotherm in the range of relative pressure p/p0 = 0.05–0.25 using the standard Brunauer–Emmett–Teller (BET) procedure [33,34]. The mesopore surface area, Sm, and the micropore volume, Vµ, were determined by the t-plot method [35,36]. The net pore volume, Vnet, was calculated for p/p0 = 0.988. The pore-size distribution (pore radius 100–102 nm) was evaluated from the adsorption branch of the nitrogen adsorption-desorption isotherm by the Barrett–Joyner–Halenda (BJH) method via the Roberts algorithm, using the assumption of a cylindrical-pore geometry [37,38]. The Lecloux-Pirard standard isotherm [39] was employed for the t-plot as well as for the pore-size distribution evaluation. The uncertainty of textural properties determined based on physisorption analyses is less than 5%.
The calculations of the optimal arrangements of DMDS and MM molecules were performed with the Gaussian 03 program package [40]. The equilibrium geometries were optimized with the hybrid density functional B3LYP in combination with the 6 − 31 + G(d,p) basis set. The molecular dimensions of the optimized molecules of DMDS and MM were evaluated using the Avogadro advanced molecule editor and visualizer.
High-resolution images of the surfaces of the RM fractions were gained with a Field Emission Scanning Electron Microscope (FE-SEM; Zeiss SIGMA, Jena, Germany) using an accelerating voltage of 5.0 kV.
An FTIR (Bruker Vertex 80v, optical resolution 4 cm−1, scanning speed 10 kHz) spectrometer equipped with a diffuse reflectance cell (Harrick The Praying Mantis) was used to study the composition of the RM fractions before and after the experiments and to examine the sulfur compounds possibly adsorbed on the RM surface during the tests. The actual measurements were conducted using fresh material as the background. The resulting difference spectrum was then used in the identification of the compounds on the surface. The difference spectrum was measured using a fresh sample as the background.
A Field Emission Scanning Electron Microscope (FE-SEM; Zeiss SIGMA) equipped with an Energy-Dispersive X-ray Spectroscopy (EDS; EDAX, Apollo X) elemental analyzer was applied for studying possible sulfur adsorption on the RM surface after the experiments. The accelerating voltage used was 15.0 kV.
The nature of RM is one of the limitations of this study. The used RM in this study is an individual sample from one industrial site. Moreover, the particular sample received for this study was not completely homogenous. WRM, CRM, ARM, and PARM were crushed into a finer particle size, but they were not sieved systematically into a certain grain size. Some error in the results comes from the gas analysis, e.g., in our earlier experiments, we estimated that in the laboratory scale experiments, the analysis error is ±2 ppm [41].

3. Results and Discussion

3.1. Characterization of Red Mud

3.1.1. X-ray Fluorescence Spectroscopy (XRF)

According to the XRF analysis (Table 3), the major metals of the red mud (RM) were iron (Fe) and aluminum (Al), as expected. The measured phosphorous (P) content of the HCl + H3PO4 -activated PARM was 4.3 wt-%, which is slightly higher than the target value of 4 wt-% due to the initial P content of RM. The acid treatments removed Na efficiently, while the Ca removal was not complete. In addition to the elements mentioned in Table 3, also K, V, Ni, Cu, Zn, Ga, Sr, Y, Zr, La, Ce, and Pb were found in the XRF analysis in proportions lower than 0.2%.

3.1.2. X-ray Diffraction (XRD)

In the X-ray diffraction (XRD) analysis (Table 4, Figure S1), the main phases identified in WRM were hematite (Fe2O3, ICDD 01–087–1164 for WRM and 01–089–8104 for CRM, ARM, and PARM), anatase (TiO2, ICDD 01–089–4921), rutile (TiO2, ICDD 01–089–4920), gibbsite (Al(OH)3, ICDD 01–074–1775), boehmite (AlO(OH), ICDD 01–083–1505), goethite (FeO(OH), ICDD 01–081–0464) and calcite (CaCO3, ICDD 01–071–3699). In calcination (500 °C, 2 h), the Al(OH)3 and FeO(OH) phases were removed, which can be observed from the XRD results of CRM. Al(OH)3 transforms into AlO(OH) at 300 °C [32], and AlO(OH) is known to change into high surface area γ-Al2O3 when the temperature is around 500 °C [42]. Characteristic peaks of γ-Al2O3 were not observed due to their lower intensity compared to some other peaks in the same 2θ-range. The presence of γ-Al2O3 in the RM calcined at 500 °C has been observed earlier by Lamonier et al. [9].
After acid treatments, the CaCO3 phase was removed since ARM and PARM only showed the presence of most stabile oxides, i.e., hematite (Fe2O3) as well as both anatase and rutile (TiO2). According to the XRD analysis, the crystallite size of Fe2O3 was ~300 Å for WRM and ~200 Å for CRM, ARM, and PARM. With ARM, the percentage of Fe2O3 was the highest, and its crystallite size was the smallest (Table 4).
In addition to the main crystalline phases, a peak at 2θ value 14° was observed for WRM and CRM. This may indicate the presence of sodium aluminum silicate hydroxide hydrate (Na8(AlSiO4)6(OH)2·4H2O, ICDD 00–041–0009). In WRM and CRM, the presence of a phase containing both sodium (Na) and silicon (Si) is possibly based on the elemental analysis. All RM fractions contained Si, and since other compounds of Si were not visible in the XRD analysis, it can be concluded that Si was present in ARM and PARM in a non-crystalline form.

3.1.3. Thermogravimetric Analysis

About a 10% mass loss took place during the calcination of CRM (500 °C for 2 h). This is consistent with the thermogravimetric analysis (TGA, Figure S2) of the washed WRM, where a 10.7% mass loss took place up to 500 °C. The weight losses and the corresponding temperature ranges in the analysis of WRM were 2.9% (30–250 °C), 6.3% (250–360 °C), and 4.4% (360–1 020 °C), resulting in the total mass loss of 13.6%. The weight losses were connected to the releases of H2O and CO2, and a similar behavior has been verified by other studies [18,43].
The differential thermal analysis (DTA, Figure S1) curve showed a small endothermic peak at around 100 °C that was related to the release of the surface water. The next weight loss up to ~300 °C in TGA was a result of the release of water existing deeper in the structure of WRM. A significant H2O release was observed up to 400 °C, and a second minor release of H2O was observed at around 520 °C. The decomposition of gibbsite (Al(OH)3) into Al2O3 and H2O takes place at 300–550 °C [44].
Calcite in RM has been reported to decompose into CaO and CO2 at 600–800 °C [44]. This is in accordance with the release of CO2 in our study. The decomposition of gibbsite and calcite was confirmed by the XRD analysis (Table 4). A smaller release of CO2 at around 200–400 °C could be explained by the oxidation of some residual carbonaceous matter.

3.1.4. Nitrogen Physisorption

The specific surface area (SBET) was evaluated for the raw RM to examine the effect of washing on the surface area. The sample was prepared by drying it overnight at 110 °C and crushing it. The SBET of raw RM was ~15 m2 g−1. All treatments increased the specific surface area of RM (Table 5). The SBET of washed WRM was 2.7 times that of the raw RM. A similar observation was made by Muhammad et al. [45] as they saw that removing impurities from RM by washing it with ultrapure water slightly increased the surface area by enhancing the porosity. Calcination increased the surface area by 44% (CRM versus WRM). Acid treatment increased the surface area even more. Activation with HCl increased the specific surface area more than activation with a mixture of HCl and H3PO4. The specific surface area of the HCl-activated ARM was 144 m2 g−1 which is 9.6 times that of the raw RM and clearly the highest of all the specific surface areas determined. The highest proportion and smallest crystallite size of hematite had a positive effect on the surface area of ARM. According to Klose et al. [46], a catalyst prepared from waste material and containing mainly iron oxide as the active compound should have a specific surface higher than 100 m2 g−1, while typical adsorbents may possess surface areas of even up to 3000 m2 g−1 [47]. The criterion of Klose et al. [46] was met by ARM and PARM.
The results of the XRF analysis (Table 3) correlate well with the observed specific surface areas. The amounts of sodium (Na) and calcium (Ca) decreased markedly in the acid treatments (ARM and PARM), and the decrease in the amount of Ca was more significant in the case of ARM, which might have resulted in a better-developed porous structure comprising of smaller mesopores and thus showing higher specific surface area. These results are supported by the earlier studies discussing the correlation between the HCl treatment and acid-soluble salts [19,48] and the amounts of Na and Ca [13] in RM; fractions containing less Na and Ca have higher surface areas.
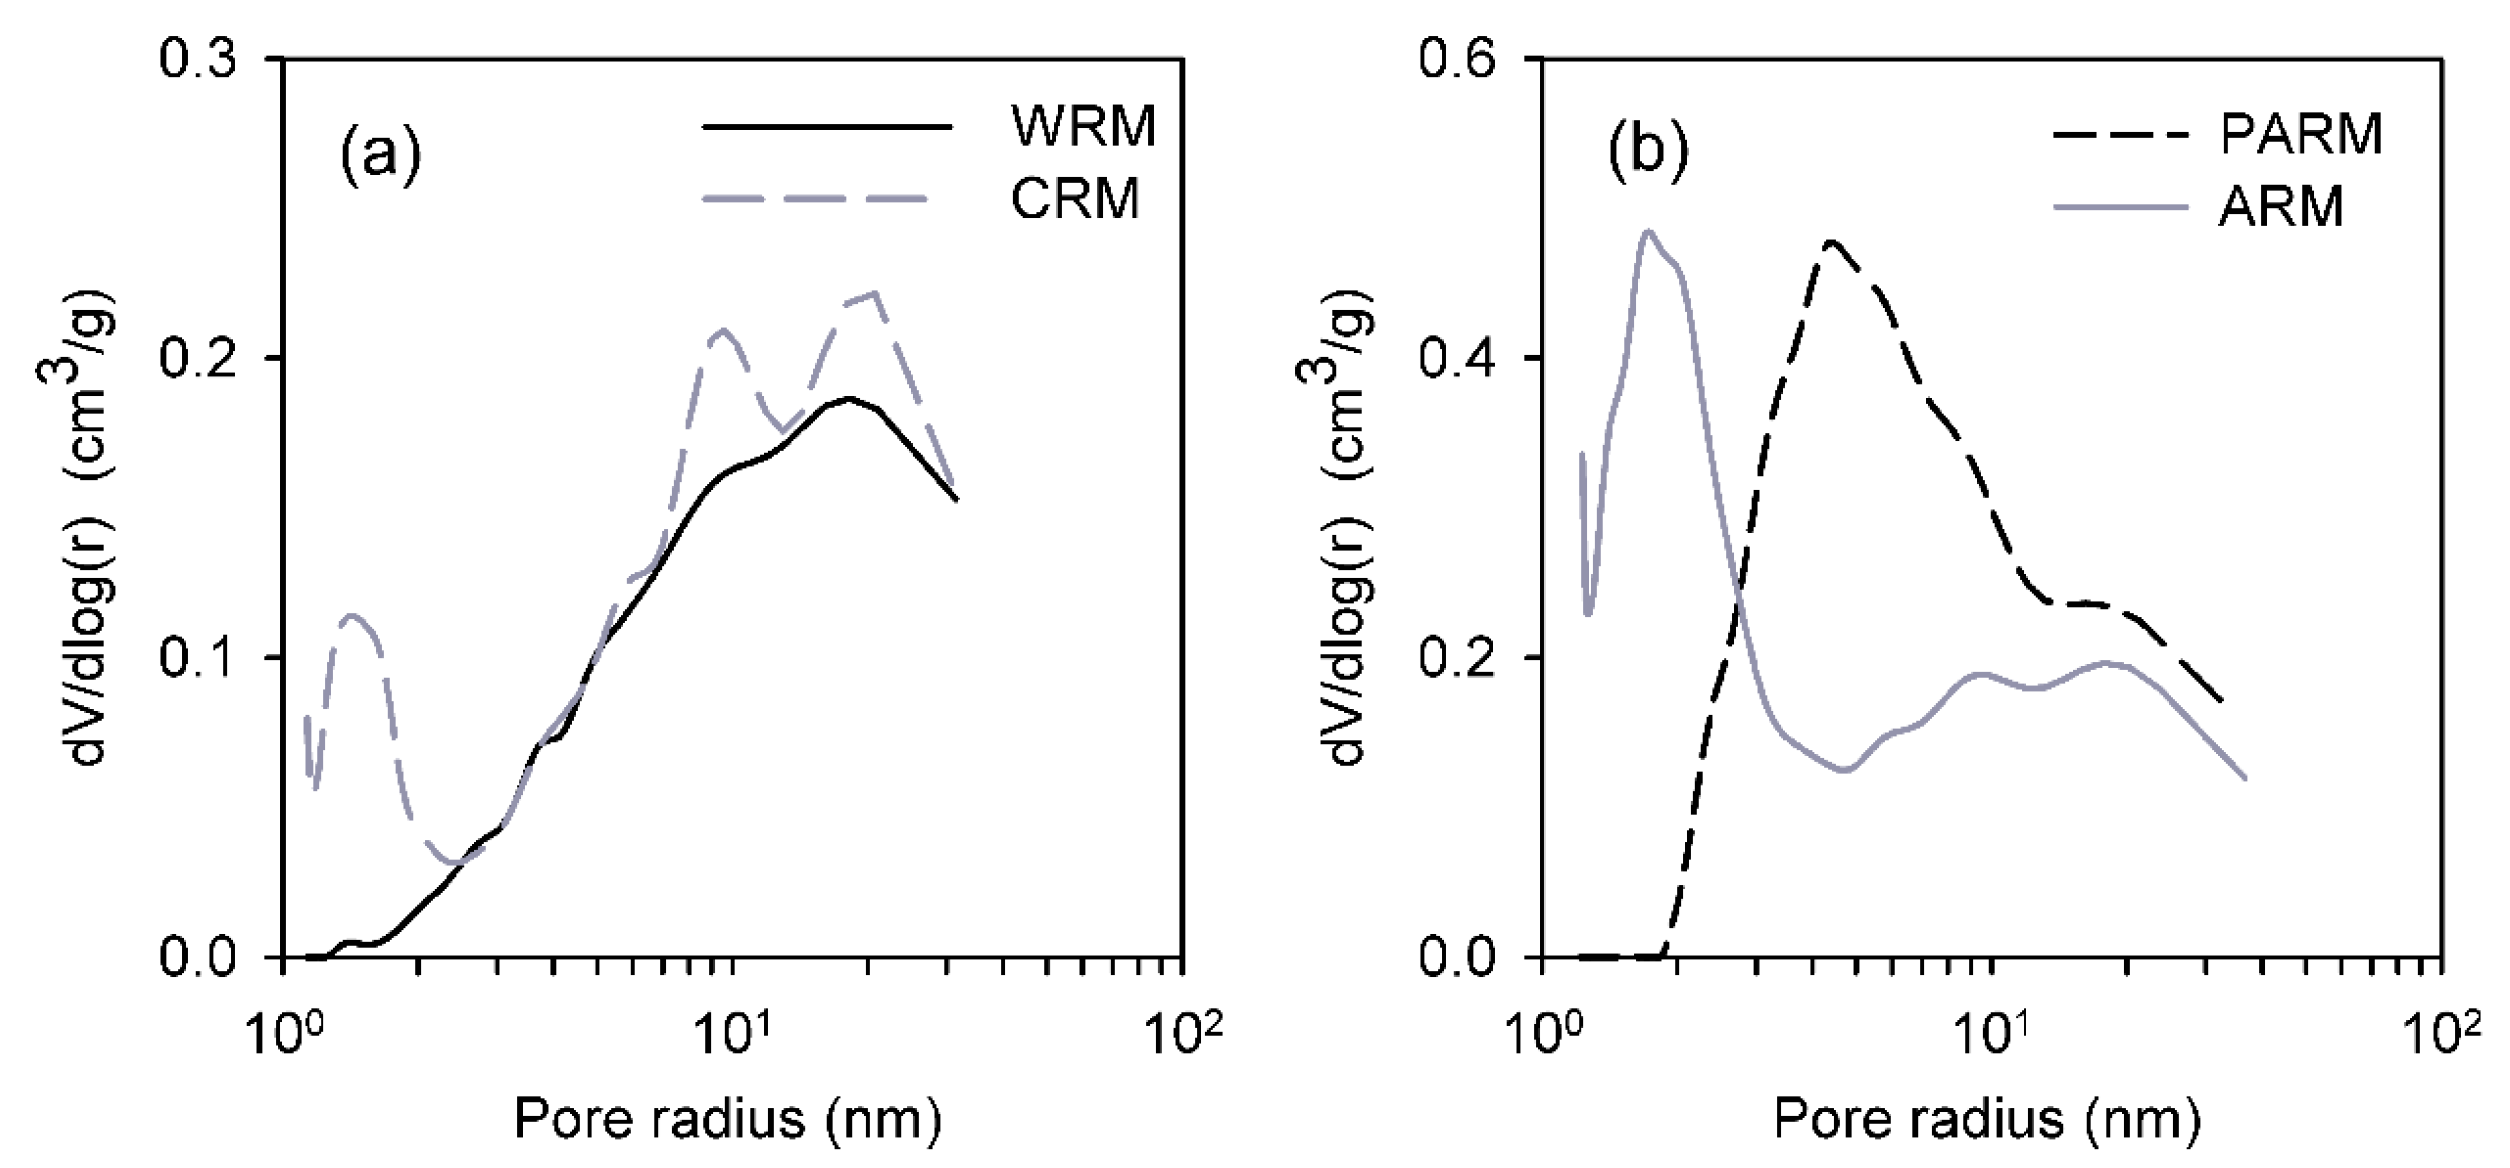
The shapes of all adsorption-desorption isotherms (Figure 2a,b) correspond to the combination of Type IV and I isotherms according to the IUPAC classification [34]. This, in general, confirms the mesoporous character of all the RM samples with a minimum contribution of micropores. However, differences exist in the pore structure morphology between the individual fractions (Table 5). All RM fractions included some micropores (10–34 mm3liq g−1), even if they were dominantly mesoporous, showing wide and well-accessible mesopores with pore diameters above 2 nm. When considering PARM and ARM, the RM fractions possessing the highest surface areas, PARM mainly showed larger mesopores with a radius of 2–10 nm, contrary to ARM, which had dominantly smaller mesopores with a radius of 1.5–5 nm.
A similar feature of washed WRM and HCl + H3PO4 -activated PARM is that both fractions showed the adsorption-desorption isotherms with a relatively narrow hysteresis loop at higher relative pressures (above p/p0 ~ 0.7 and 0.55, respectively). This corresponds well to monodisperse mesopore-size distributions with a maximum pore radius of 18 nm for WRM and 4.5 nm for PARM (Figure 3a,b). The existence of smaller mesopores in PARM correlates to the higher mesopore surface area and the higher net pore volume of this sample.
The CRM and ARM showed the adsorption-desorption isotherms with a broad hysteresis loop (Figure 2a,b). The shape of hysteresis loops of CRM and ARM corresponds to the possible presence of non-rigid aggregates of plate-like particles in both RM fractions. From Figure 3a,b, it is evident that the two materials had both smaller and larger mesopores. From the comparison of pore-size distributions of CRM and ARM, it is also evident that the ratio of smaller mesopores in CRM was lower than in ARM. This feature corresponds to a smaller mesopore surface area and a lower net pore volume of CRM.
Due to the presence of additional smaller mesopores, ARM showed a higher specific surface area than PARM. The net pore volume of PARM was the highest of all the RM fractions, and the major difference in the composition of PARM compared to the other fractions was the higher phosphorus (P) content (4.3%).
Based on the Gaussian advanced molecule optimizer and the Avogadro advanced molecule editor and visualizer modeling, both DMDS and MM molecules show dimensions below ~5.8 Å (i.e., below 0.58 nm) (Figure 4). Concerning the dimensions of both molecules and the determined textural properties and pore-size distributions of RM samples, it can be stated that both compounds can penetrate well into the pores of all RM fractions, and thus their surface can be effectively used for oxidation reactions or adsorption. Since the pores in both ARM and PARM are large enough for DMDS and MM, the pore size distribution is not likely to be the decisive parameter explaining the difference in the abatement of these compounds between ARM and PARM.

3.1.5. Field Emission Scanning Electron Microscopy

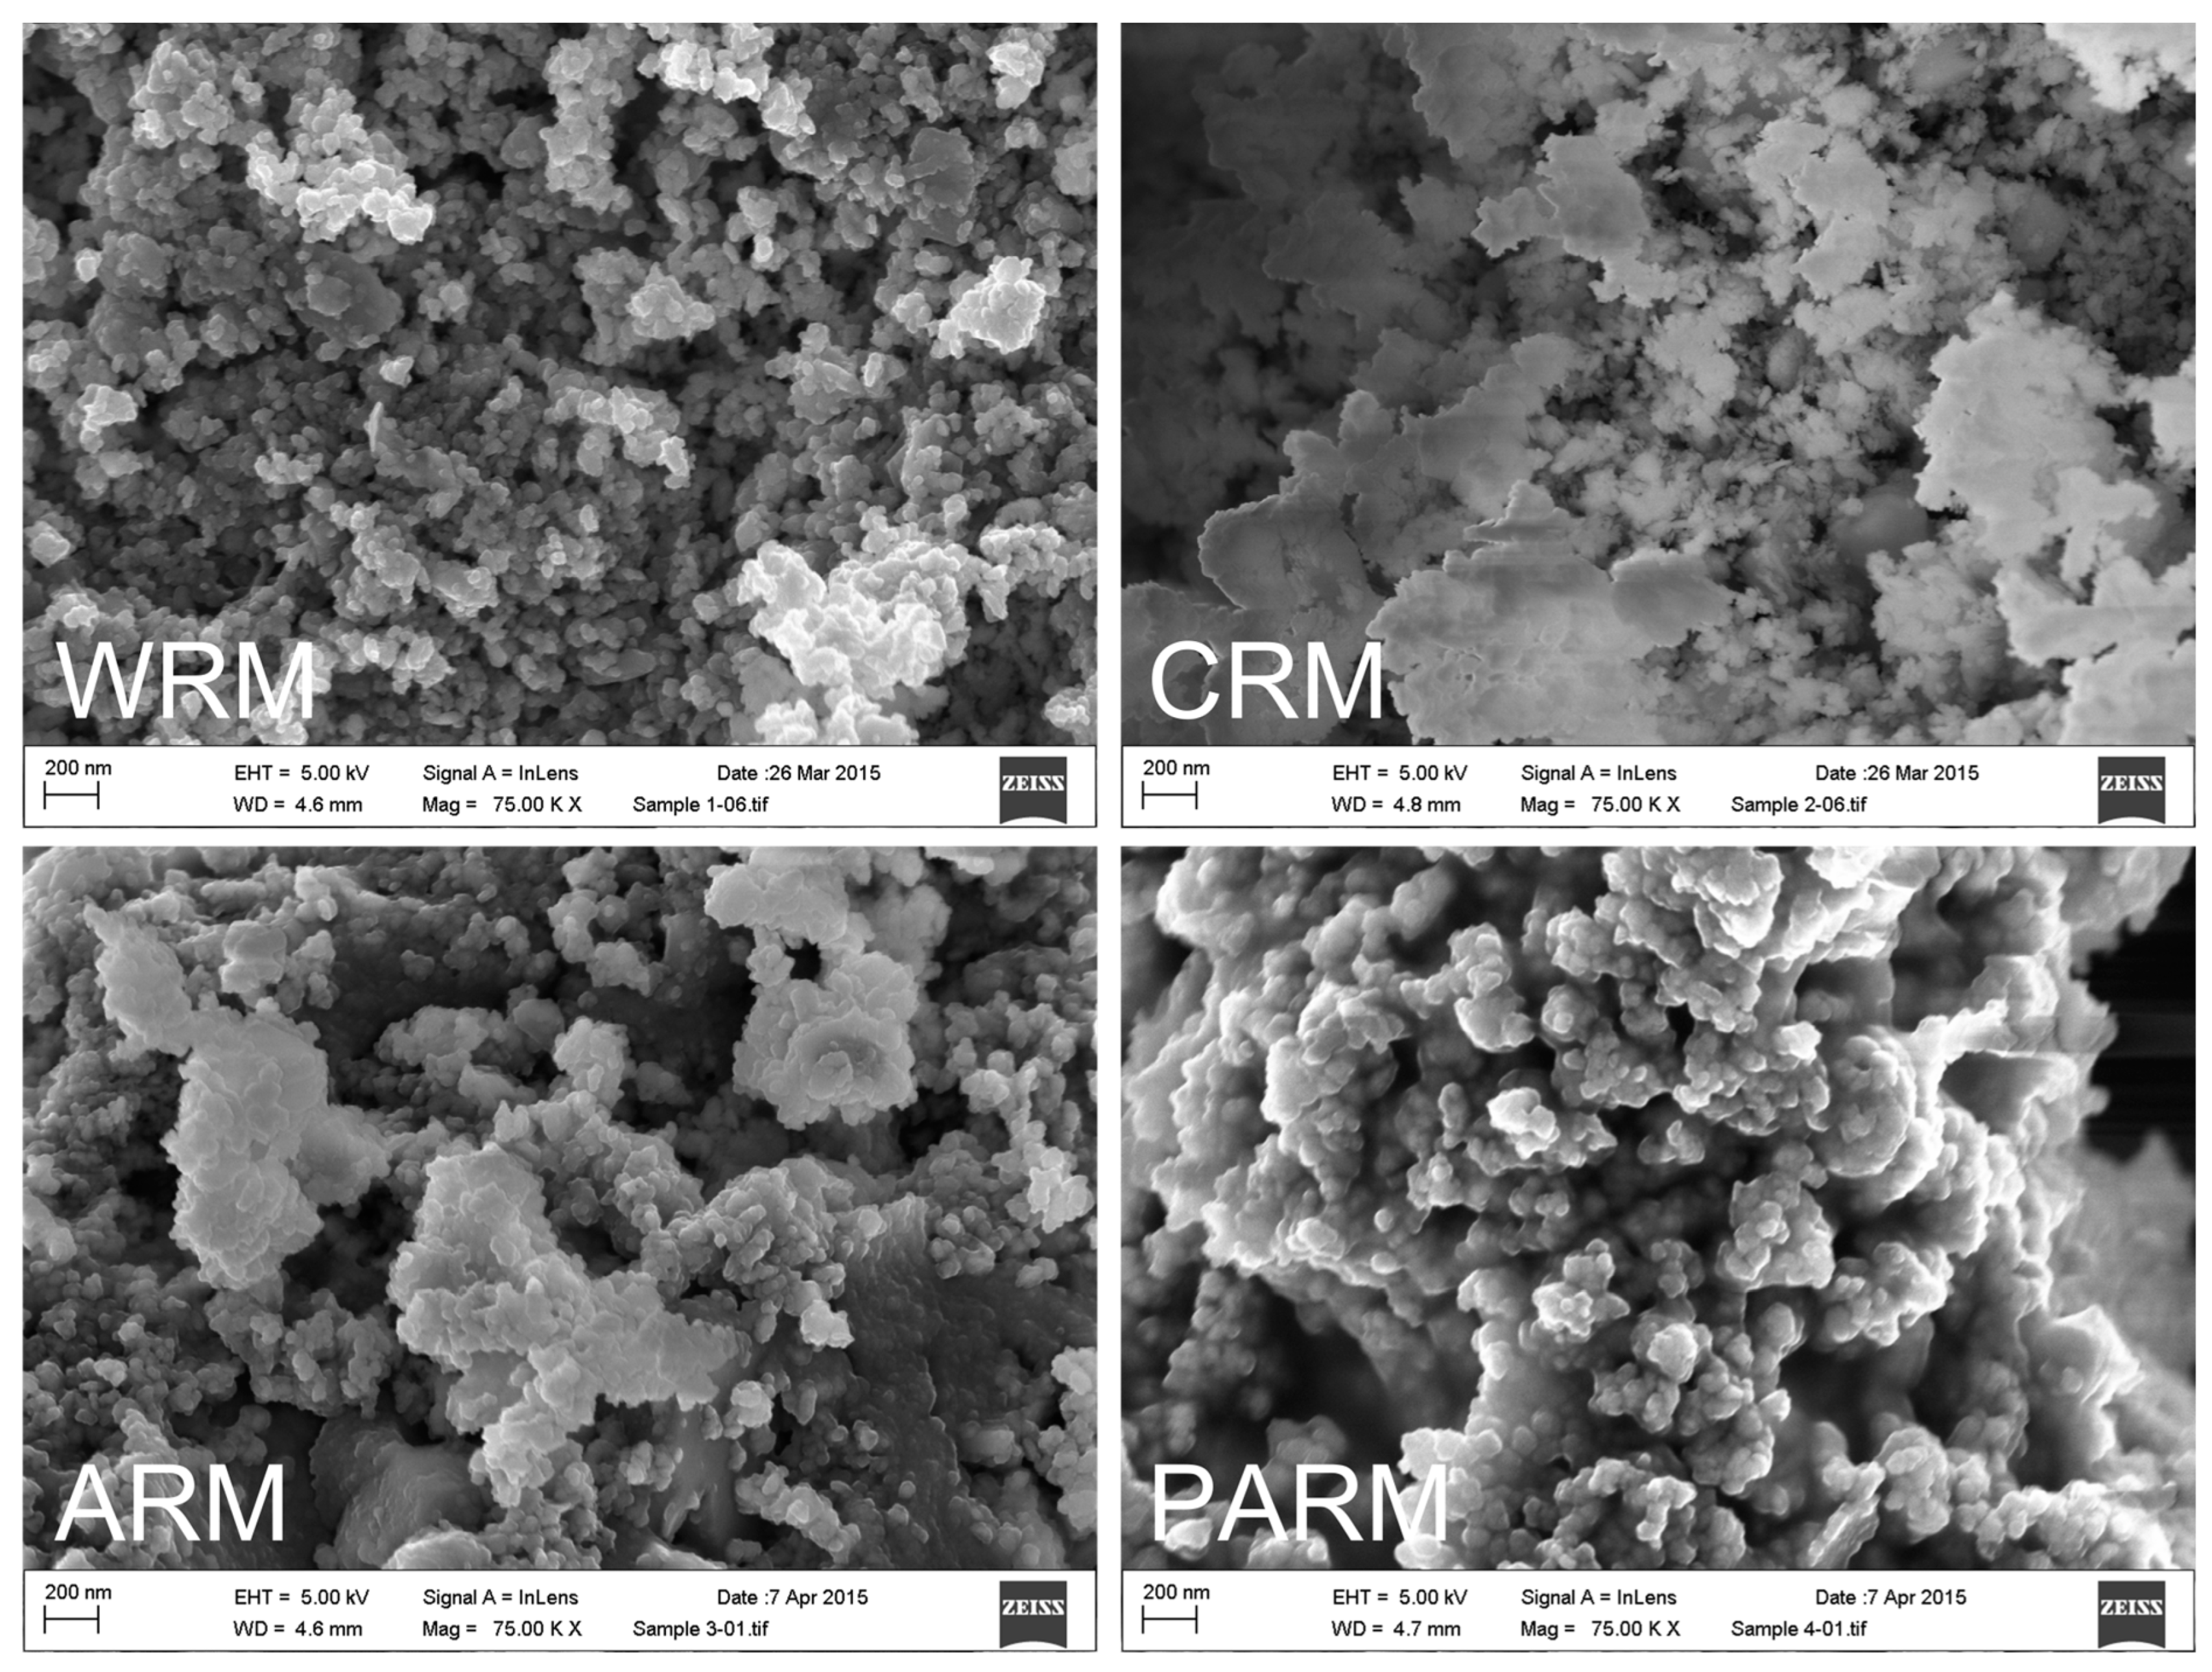
The Field Emission Scanning Electron Microscopy (FE-SEM) images of the red mud (RM) fractions are shown in Figure 5. While WRM and PARM were composed of granular-shaped aggregates, CRM and ARM seemed to be mixtures of plate-like and granular-like particle aggregates. This is consistent with the physisorption results, where the shapes of hysteresis loops of CRM and ARM (Figure 2a,b) indicate the existence of plate-like particles and the polydisperse porous character of these fractions.

3.2. Abatement of DMDS and MM

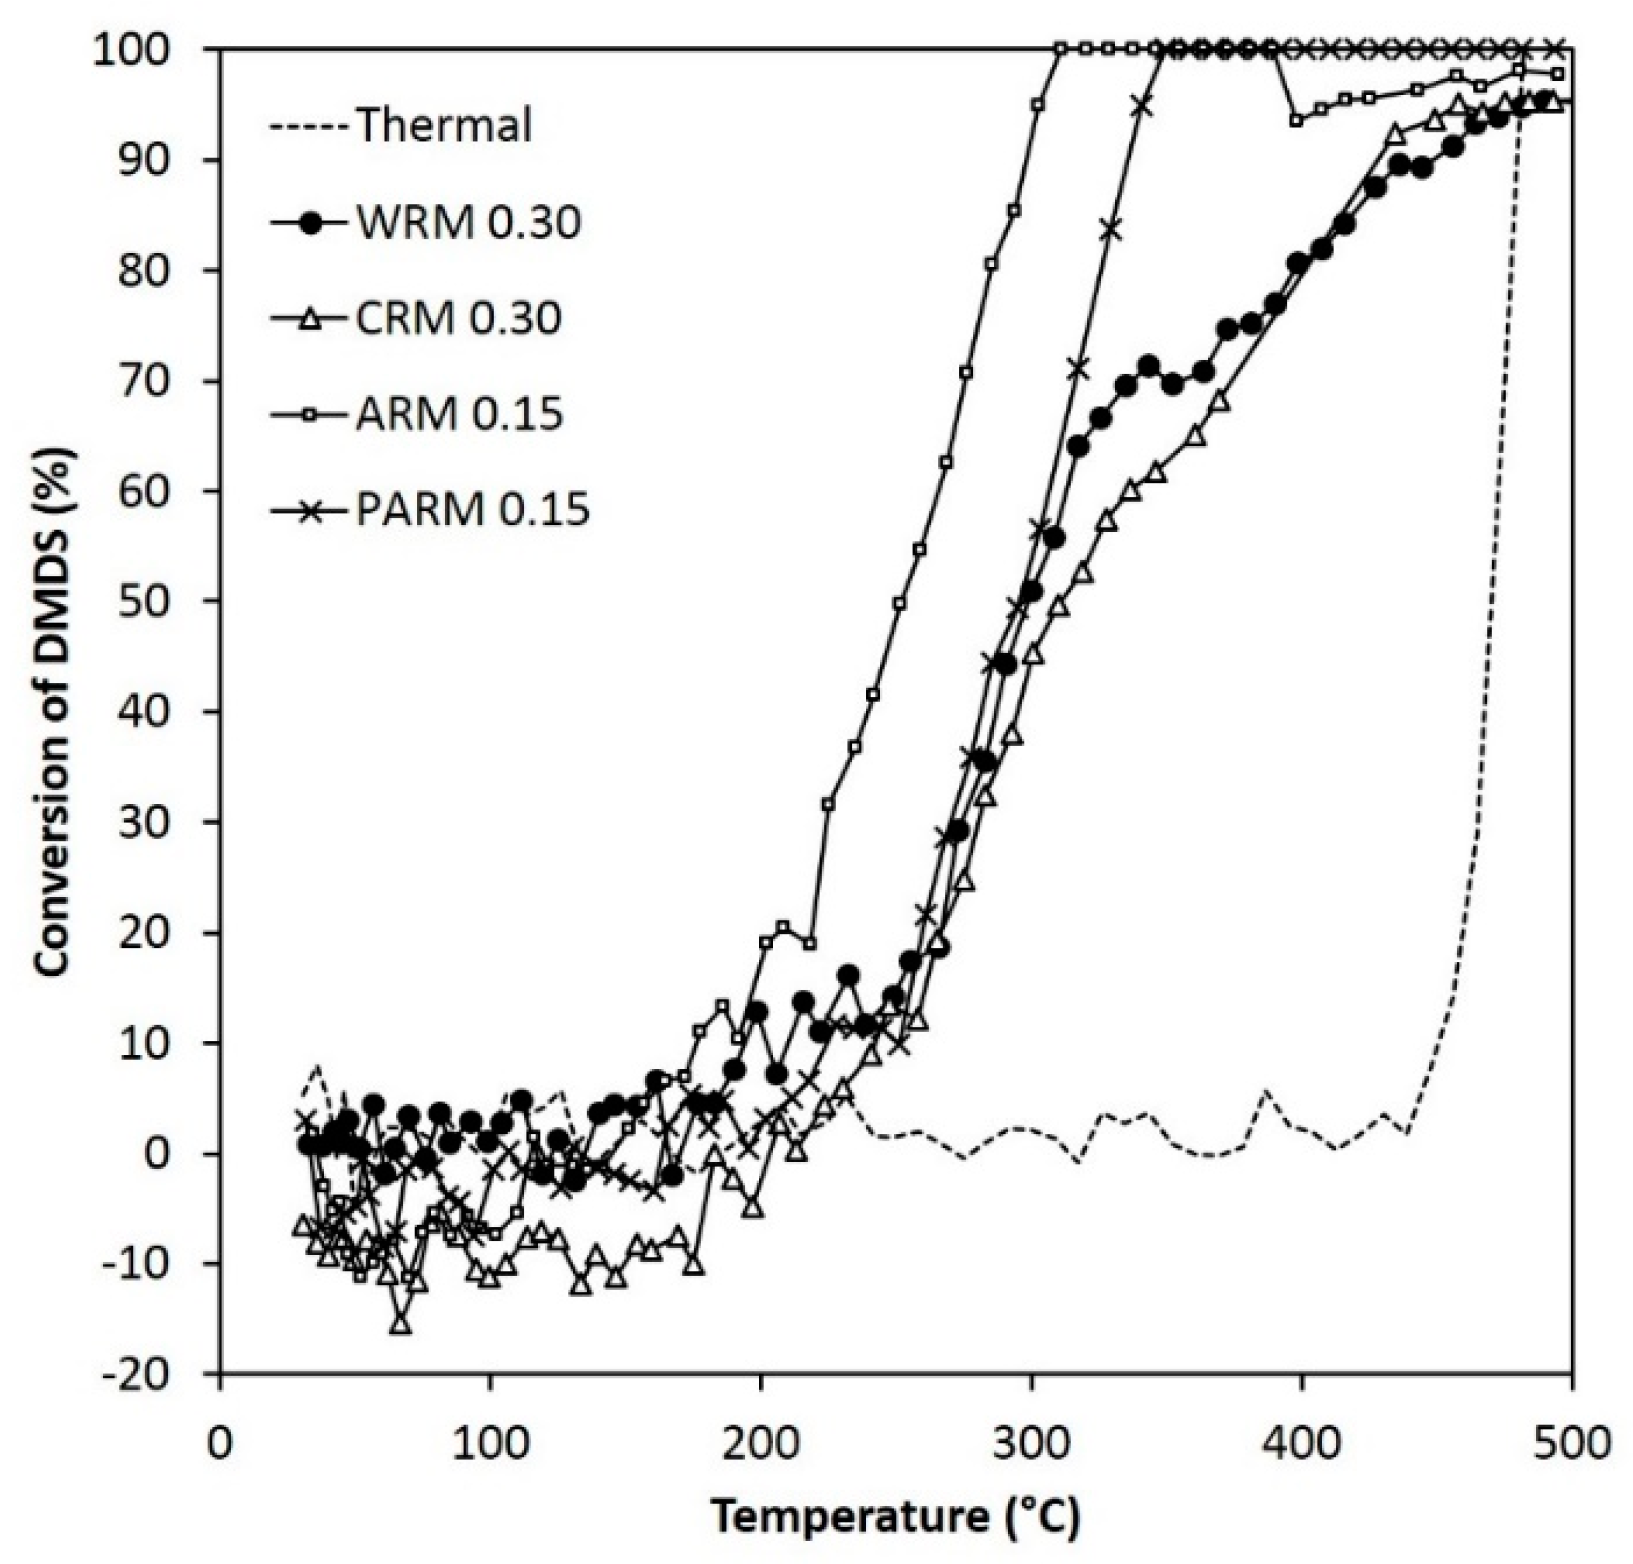
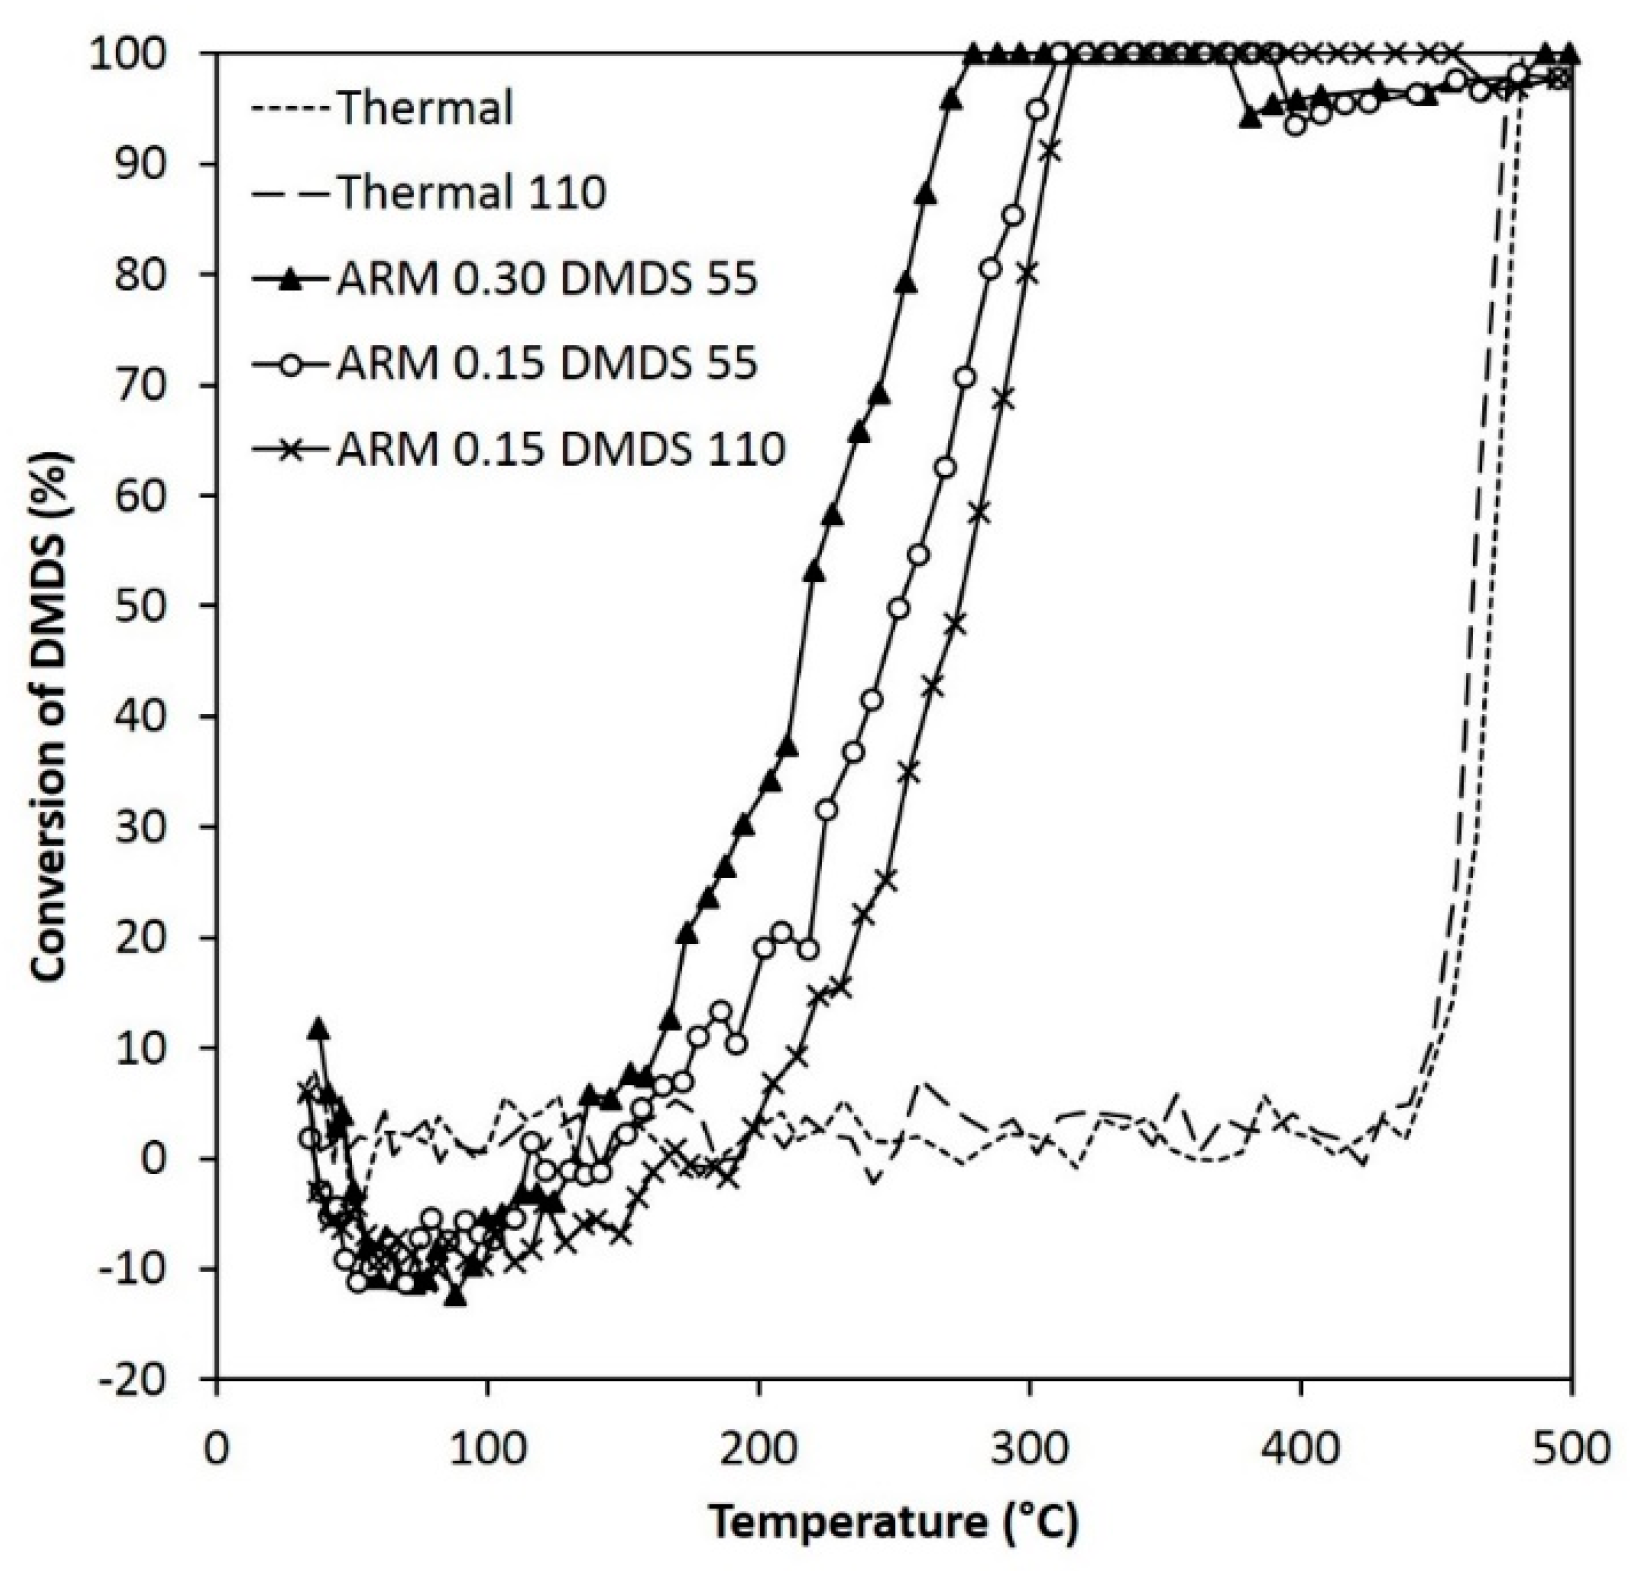
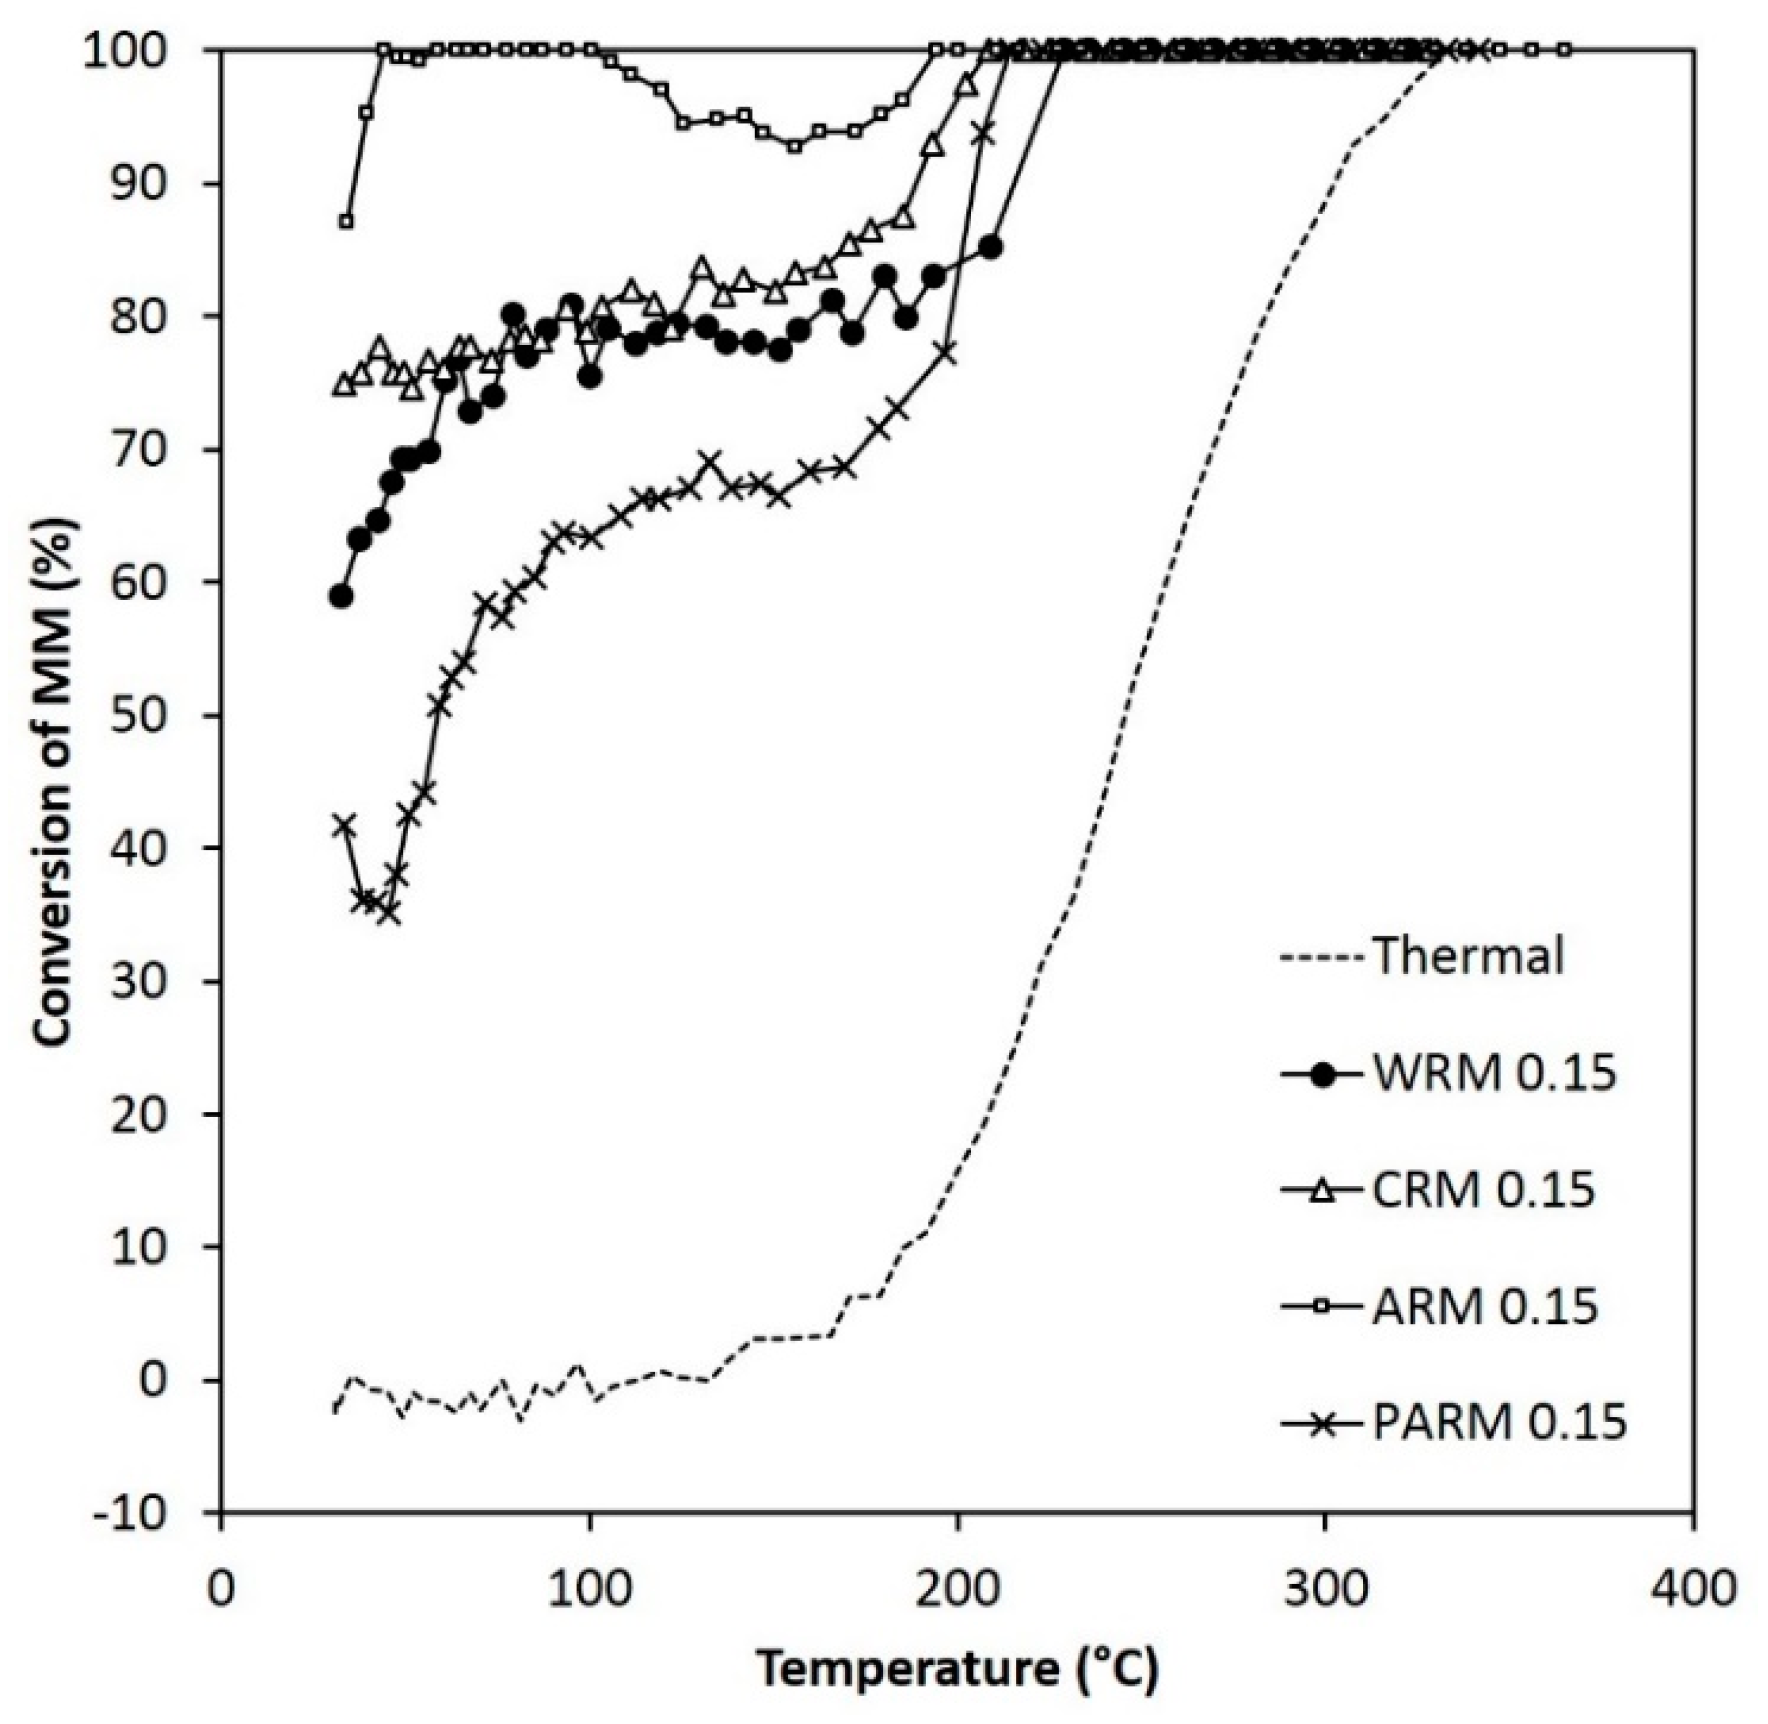
The performance of different RM fractions in the DMDS and MM abatement is expressed as the conversion vs. temperature graphs for DMDS (Figure 6 and Figure 7) and MM (Figure 8). The results of the experiments with quartz wool did not differ significantly from the results of the experiments conducted with an empty reactor (Thermal, dashed lines in the figures).
The results show the clear enhancing effect of RM on the conversions of DMDS and MM. ARM evidently improved the removal of both compounds, which can be observed with the lowest temperature of the 50% and 100% conversion or the temperature of the maximum conversion, indicated as T50, T100, and Tmax, respectively (Table 6 and Table 7). The performance of PARM appeared to be weaker than that of WRM and CRM in the case of MM oxidation. The situation was the opposite in the case of DMDS.
The amount of ARM and PARM used in the DMDS experiments presented in Figure 6 (0.15 g) was half the amount of WRM and CRM (0.30 g), which means that the enhancement in the conversion gained by ARM and PARM was even more pronounced than what is visible from the figure. The results of the DMDS experiments show that both the amount of ARM and the concentration of DMDS influenced the abatement results (Figure 7). Over ARM, there was a decrease of around 250 °C in T50 and a decrease of 200 °C in T100 when compared to the thermal oxidation results.
The 100% conversion of DMDS was reached over ARM and PARM below 350 °C (Figure 6 and Figure 7, Table 6). Over PARM, the T100 was higher than over ARM. Over WRM and CRM, the maximum DMDS conversions reached at 500 °C were less than 100%, even though in the reference experiment with an empty reactor T100 was 480 °C. The improvement was seen in the T50 values of WRM and CRM (300 °C and 310 °C, respectively), which were significantly lower than in the thermal experiment (470 °C). The conversion curve of thermal oxidation of DMDS is very steep, and T100 was quickly reached after reaching the light-off temperature of oxidation (Figure 6). In the presence of activated RM, after the initial fast reaction, the conversion curves appear more gradual, demonstrating a lower reaction rate at the higher reaction temperatures. This may indicate some mass transfer limitations. The final increase in the conversions of MM and DMDS seems to appear at the temperature range where thermal oxidation reactions are already initiated (Figure 6 and Figure 7).
MM is oxidized both thermally and over the modified RMs at lower temperatures than DMDS (Figure 8). The lowest T100 (190 °C) was achieved with ARM. Over WRM, CRM, and ARM, MM conversions higher than 50% were reached at the very beginning of the experiment (30 °C) and over PARM at ~60 °C. MM was no longer detected in the outlet gas flow when the reaction temperature reached 190–230 °C. In the MM experiments, T100 was thus decreased by 100–140 °C when compared to thermal oxidation, and the decrease in the T50 was even more significant.

3.3. Selectivity

In addition to the conversion of the reactants, the formation of the oxidation products (Figure 9, Figure 10, Figure 11, Figure 12 and Figure 13) must also be considered when evaluating the potential efficiency of RM in the oxidative abatement of DMDS and MM. The desired products in the total oxidation of DMDS and MM are SO2, CO2, and H2O. The evaluation of the total oxidation is thus based on the formation of SO2 and CO2.

3.3.1. Evaluation of Total Oxidation Potential

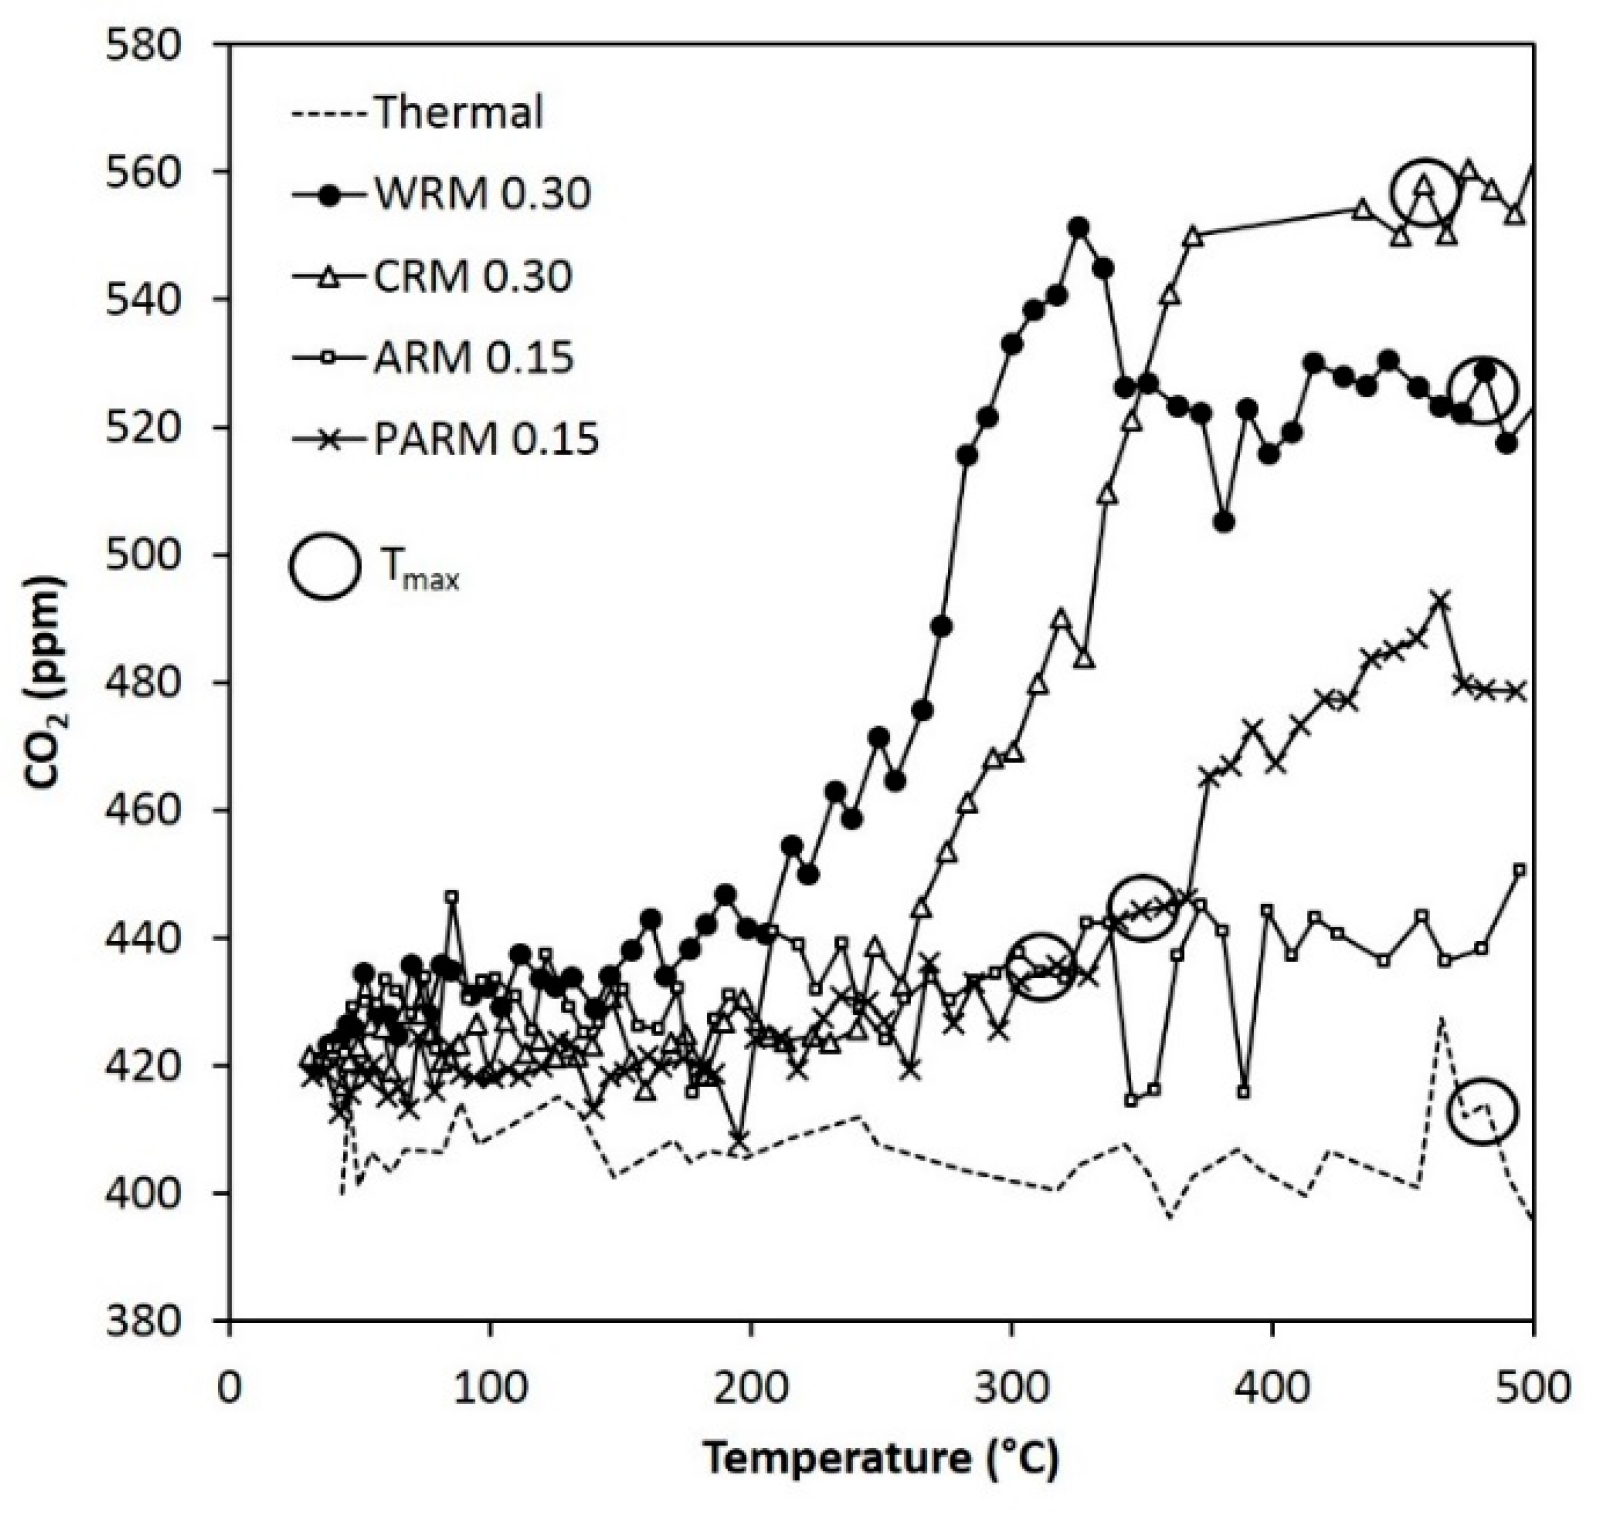
In the thermal DMDS experiments at Tmax, the formation of CO2 was only minor, and thus the oxidation was not complete. The SO2 yields with 55 ppm and 110 ppm of DMDS were 45% and 65%, respectively. CO formation at Tmax was higher with higher DMDS concentration (Table 6). This information can be used as the reference situation when evaluating the total oxidation of DMDS over the modified RMs.
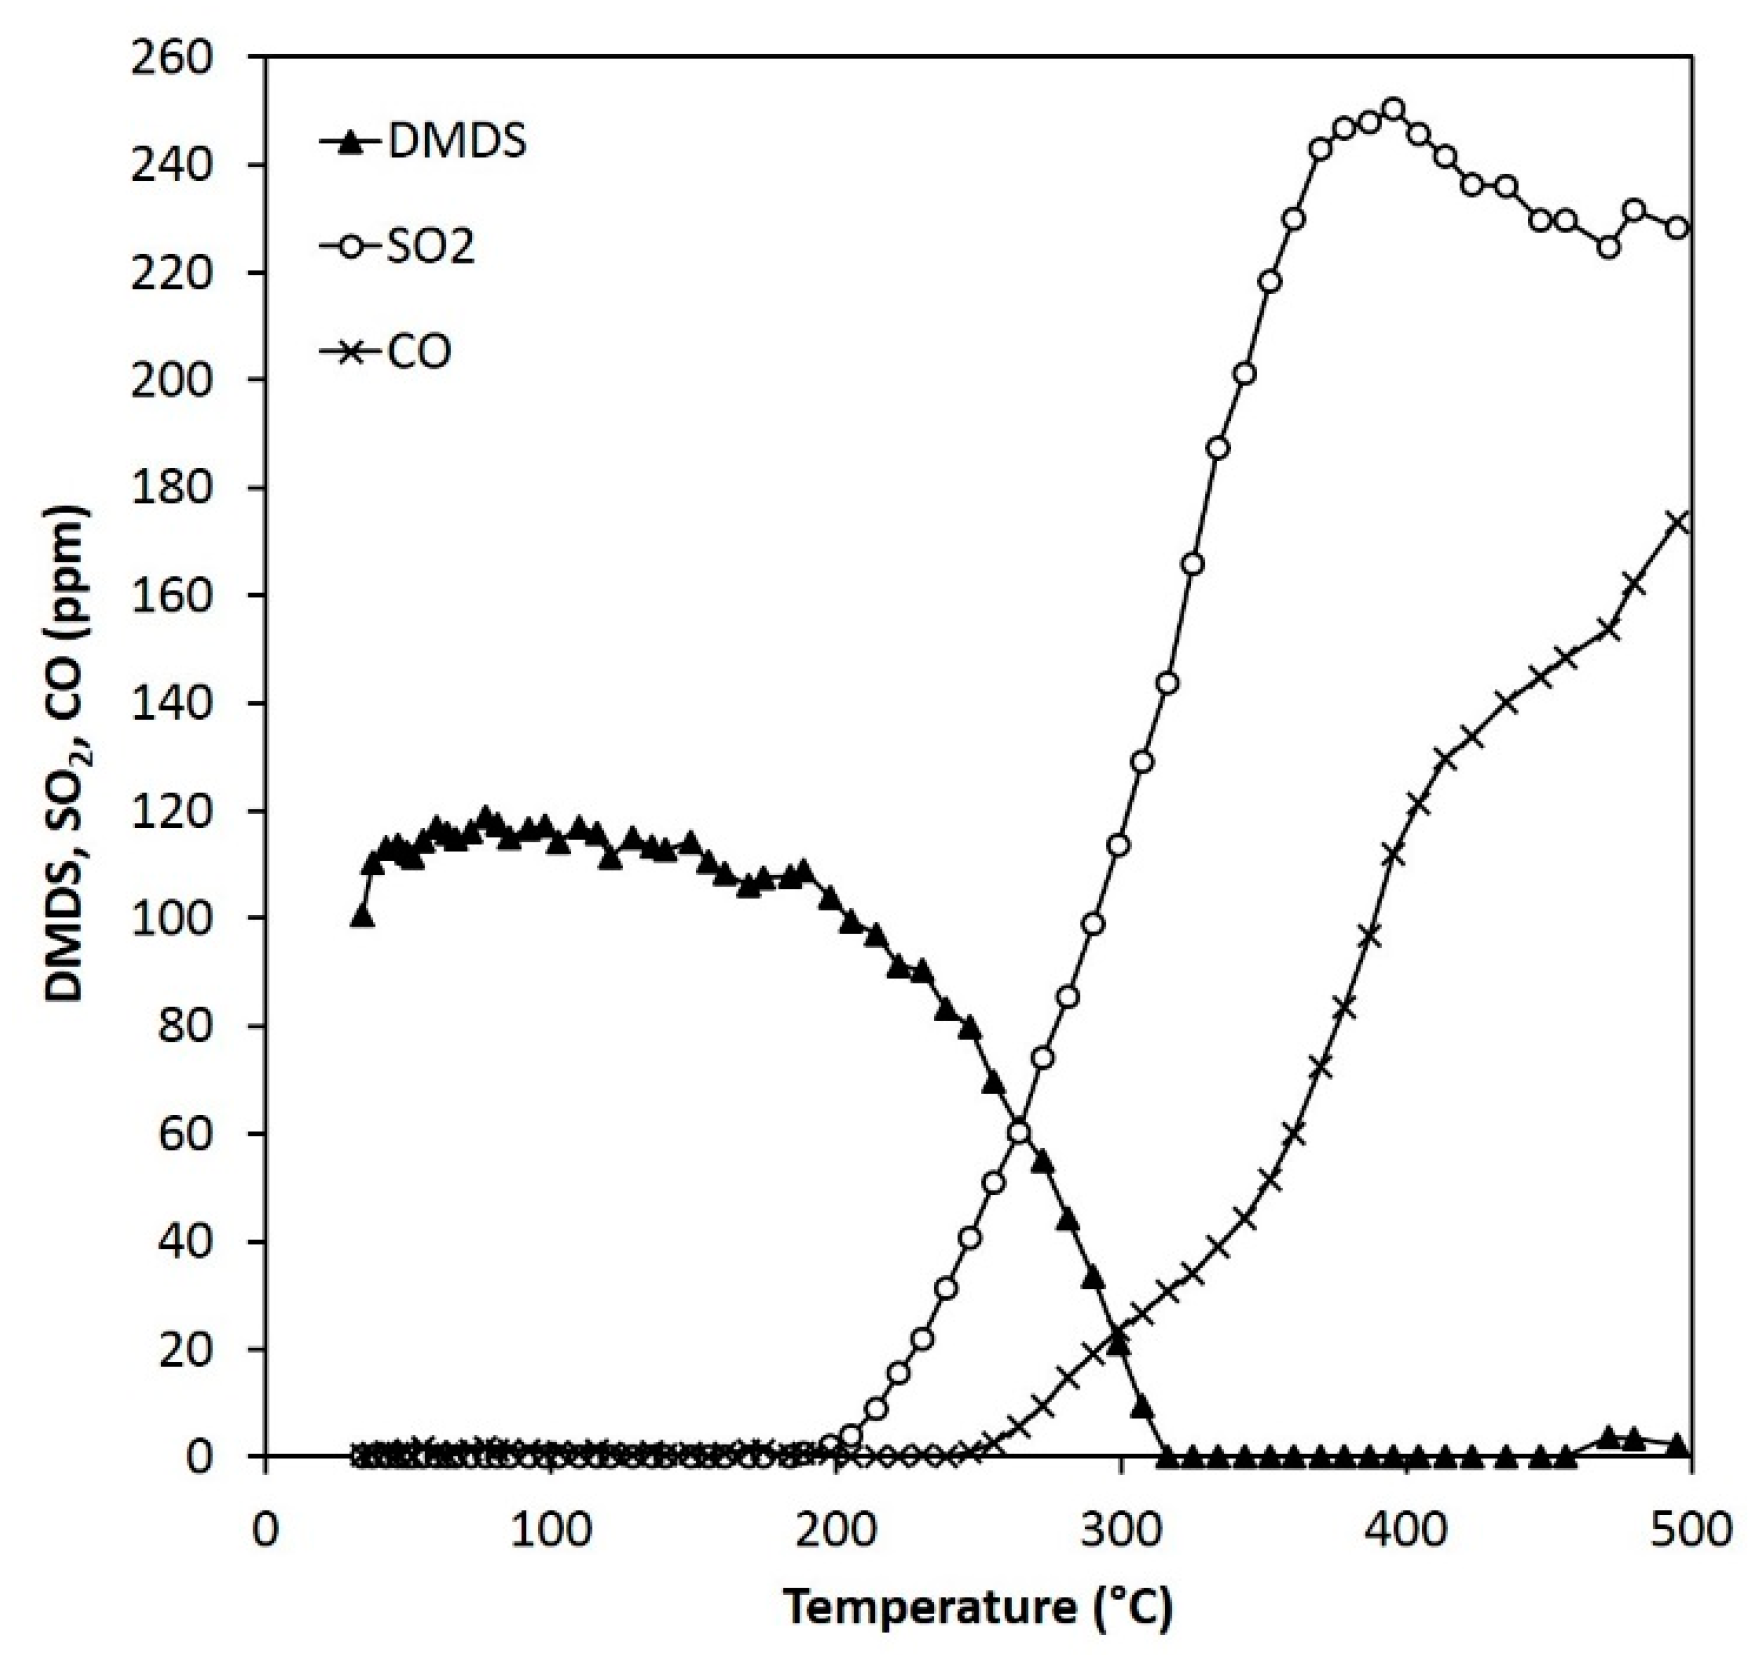
ARM showed the lowest T50 and T100 values in DMDS oxidation. However, DMDS oxidation over ARM was not complete, which can be seen from the relatively high amount of formed CO and low amount of CO2 (Table 6 and Figure 9). In the DMDS experiments, significant CO2 formation at Tmax was observed only with WRM and CRM (Figure 9). With ARM and PARM, the formation of CO2 was only slightly higher than in the thermal experiments. Over PARM at Tmax, the formation of CO2 was less than over WRM and CRM. However, over WRM and CRM, the 100% conversion was not reached at the temperature range of the experiments. The amounts of WRM and CRM used in the experiments were higher than the masses of ARM and PARM, which may affect the results. Lower WHSV resulting from higher mass of the material increases the residence time of reactants in the test material bed (Table 2). In the thermal DMDS experiment, the CO2 concentration at Tmax was lower than in the experiments over WRM and CRM. In the TGA/DTA analysis conducted with WRM, a minor release of CO2 occurred at 200–400 °C. CO2 detected in the activity experiments with WRM and CRM might not have been an oxidation product but may have originated from carbonaceous residue or calcite present in WRM and CRM. The result implies that WRM and CRM were not stable in the experimental conditions.
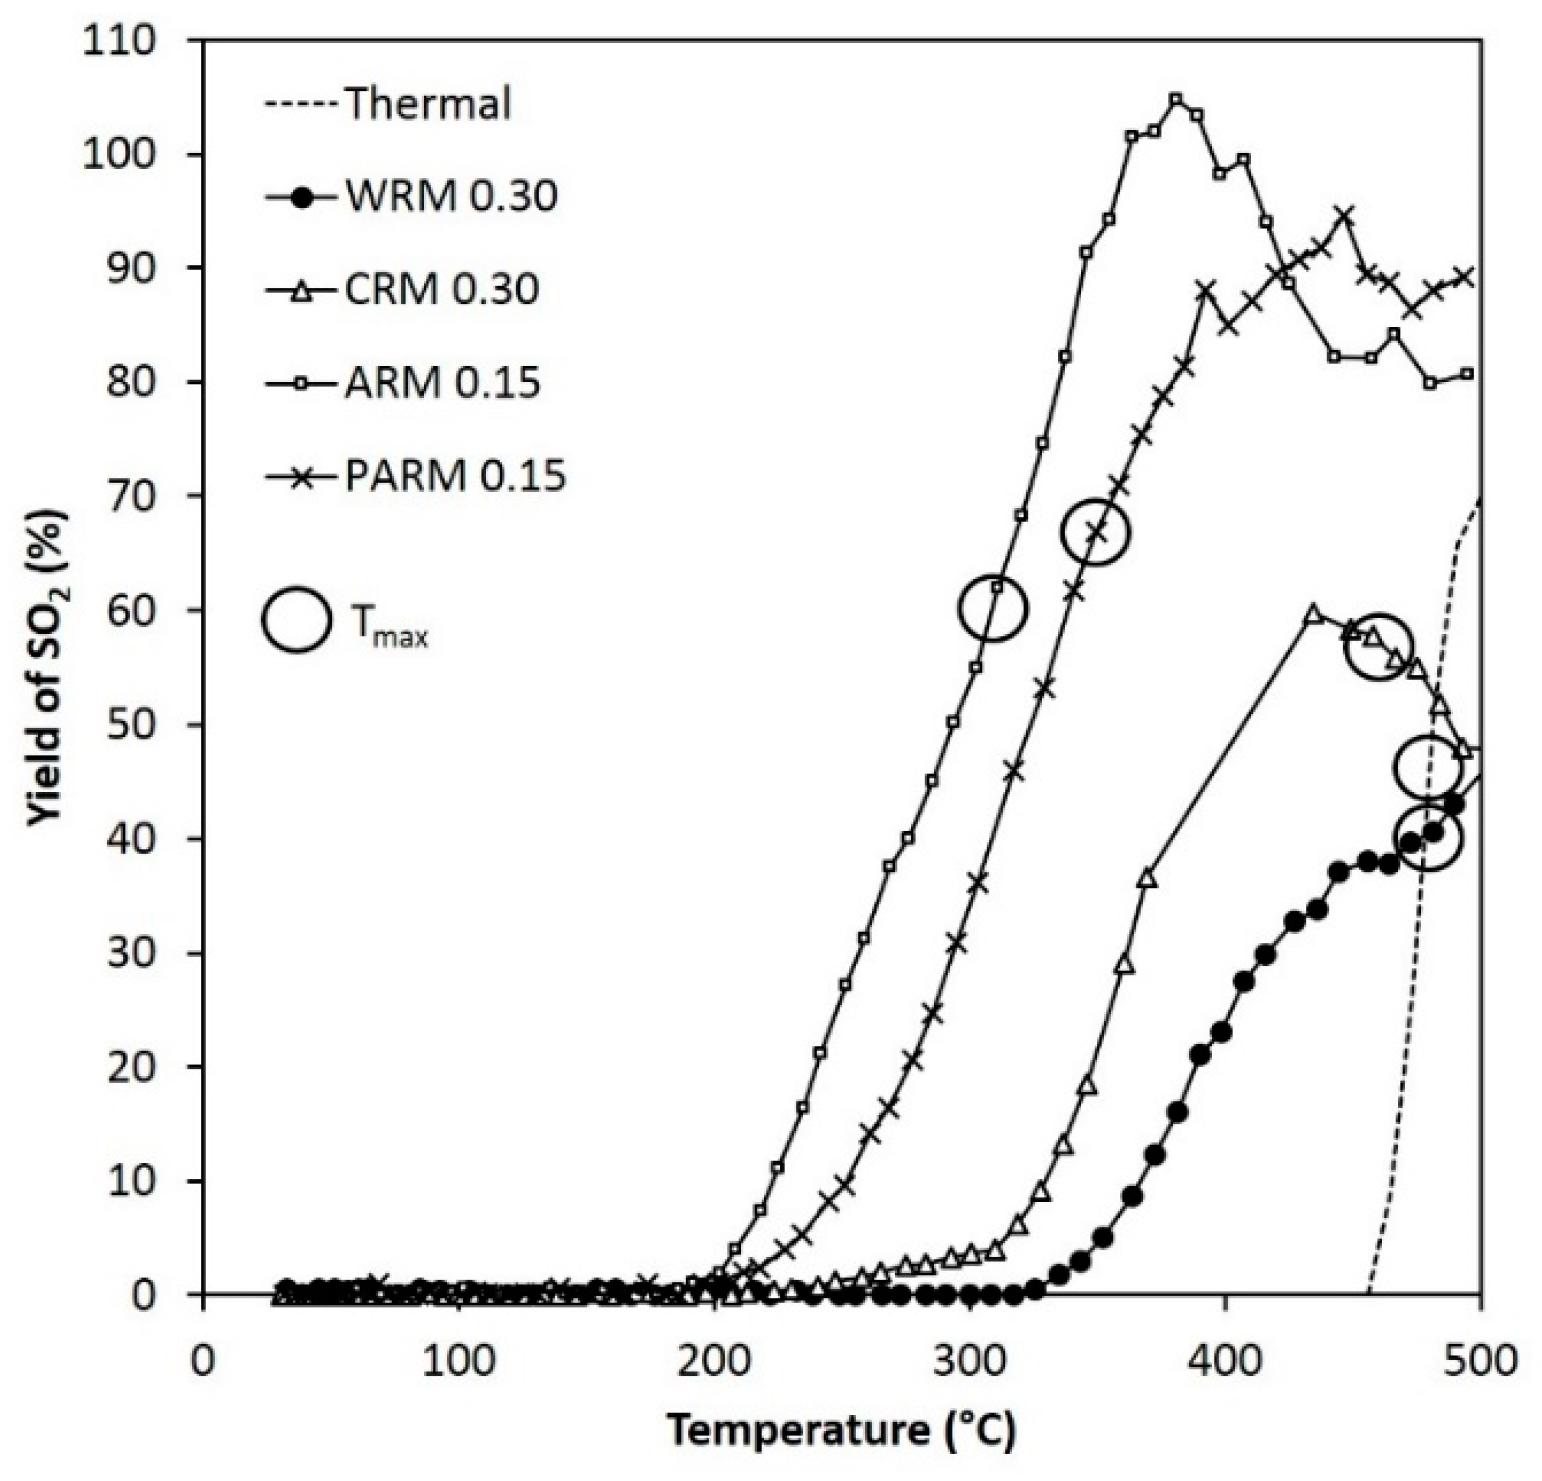
The yield of SO2 during the DMDS oxidation varied with different RM fractions (Figure 10). The highest SO2 yield at Tmax was reached over 0.15 g of ARM with 110 ppm of DMDS (Table 6). The formation of SO2 was also promoted by PARM. Both formations of SO2 and CO were slightly higher with RM compared to the thermal experiments (Table 6).
In the thermal MM experiment, at Tmax, the intermediate DMDS concentration was 65 ppm, and CO2 was not detected. With WRM and CRM at Tmax, the intermediate DMDS concentration was 55 ppm, and the formation of CO2 was observed. With ARM and PARM at Tmax, the intermediate DMDS concentration was 50 ppm, and CO2 was not detected. WRM and CRM seem to promote the total oxidation of both DMDS and MM better than the more active materials, i.e., ARM and PARM, based on the CO2 formation. However, CO2 produced due to changes in the composition of WRM and CRM is also possible based on TGA analysis.
In the MM experiments, the SO2 formation was detected only over PARM at T100, indicating the absence of total oxidation. Later, when the temperature was increased, SO2 formation was observed due to the further oxidation of reaction intermediates. With ARM, SO2 started to form only after 100% conversion of MM was reached.

3.3.2. Formation of Reaction Intermediates

In addition to CO, CO2, and SO2, minor amounts of, e.g., dimethyl sulfide and methanol were detected in some experiments as intermediates during the DMDS oxidation. The concentrations of these products at temperatures up to the Tmax were less than 10 ppm.
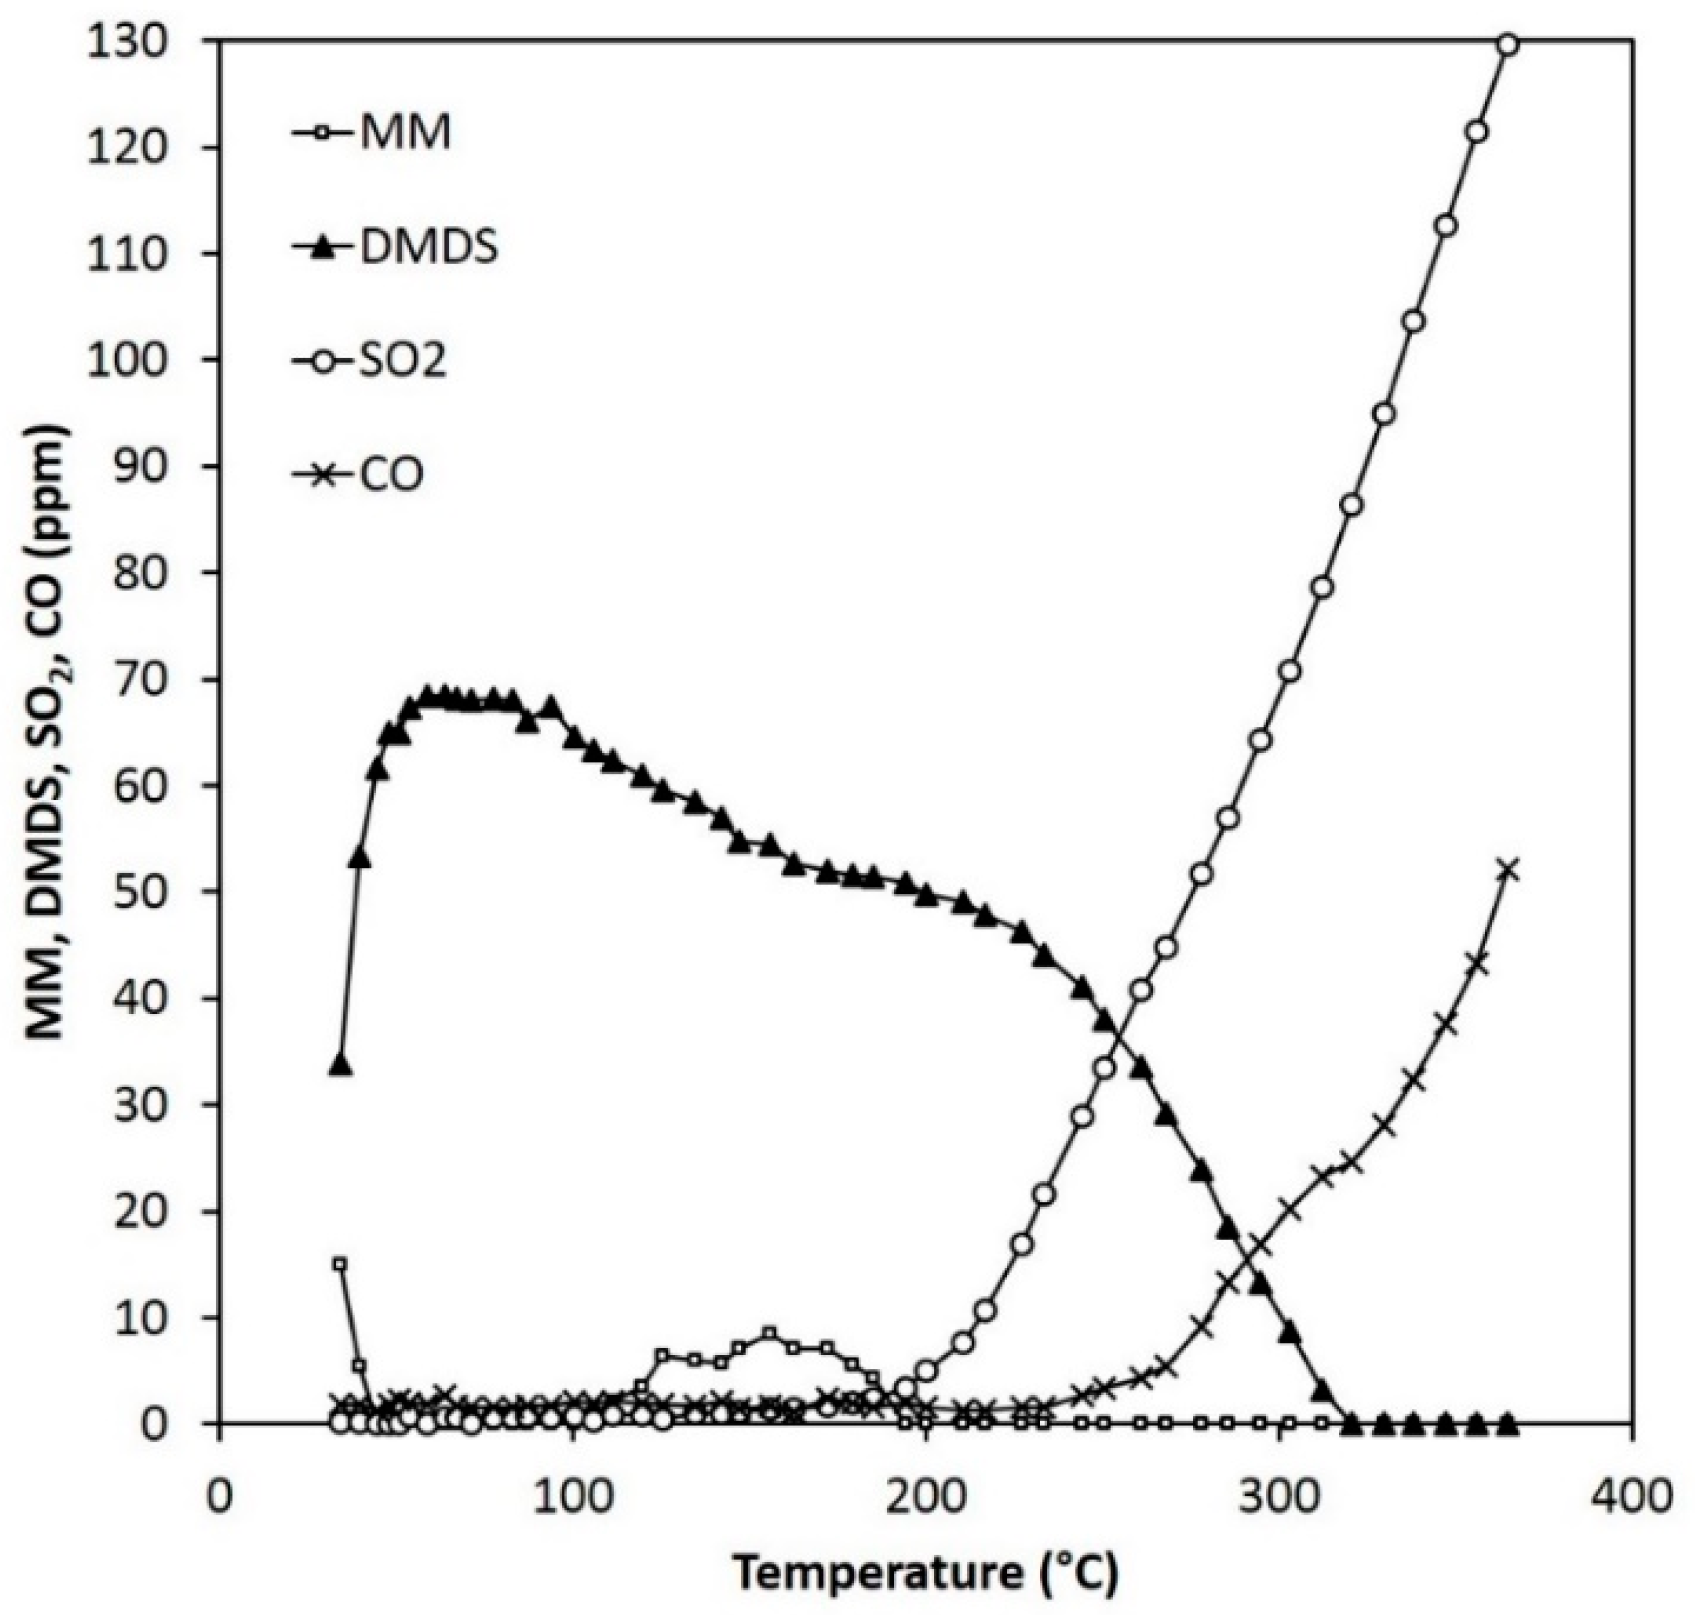
In the case of MM oxidation (Figure 11 and Figure 12), DMDS is formed as a reaction intermediate before the formation of the total oxidation products. It is known that the partial oxidation of MM, for example, on activated carbon goes via the following reactions [49]:
2CH3SH + 0.5O2 → (CH3)2S2 + H2O
(CH3)2S2 + 3.5O2 → 3H2O + 2CO2 + (2/n)Sn
S + O2 → SO2
The temperature required for the formation of DMDS from MM is rather low since it was already observed at the beginning of the experiments. The presence of DMDS was potentially caused by the thermal reaction in the heated lines of the reactor set-up, but it might also appear as an impurity in the MM gas cylinder. At the beginning of the experiment, when feed amounts of the reactants were verified via the by-pass line, the amount of DMDS observed was at a level of 10–20 ppm, and the amounts higher than that are only considered when evaluating the results.
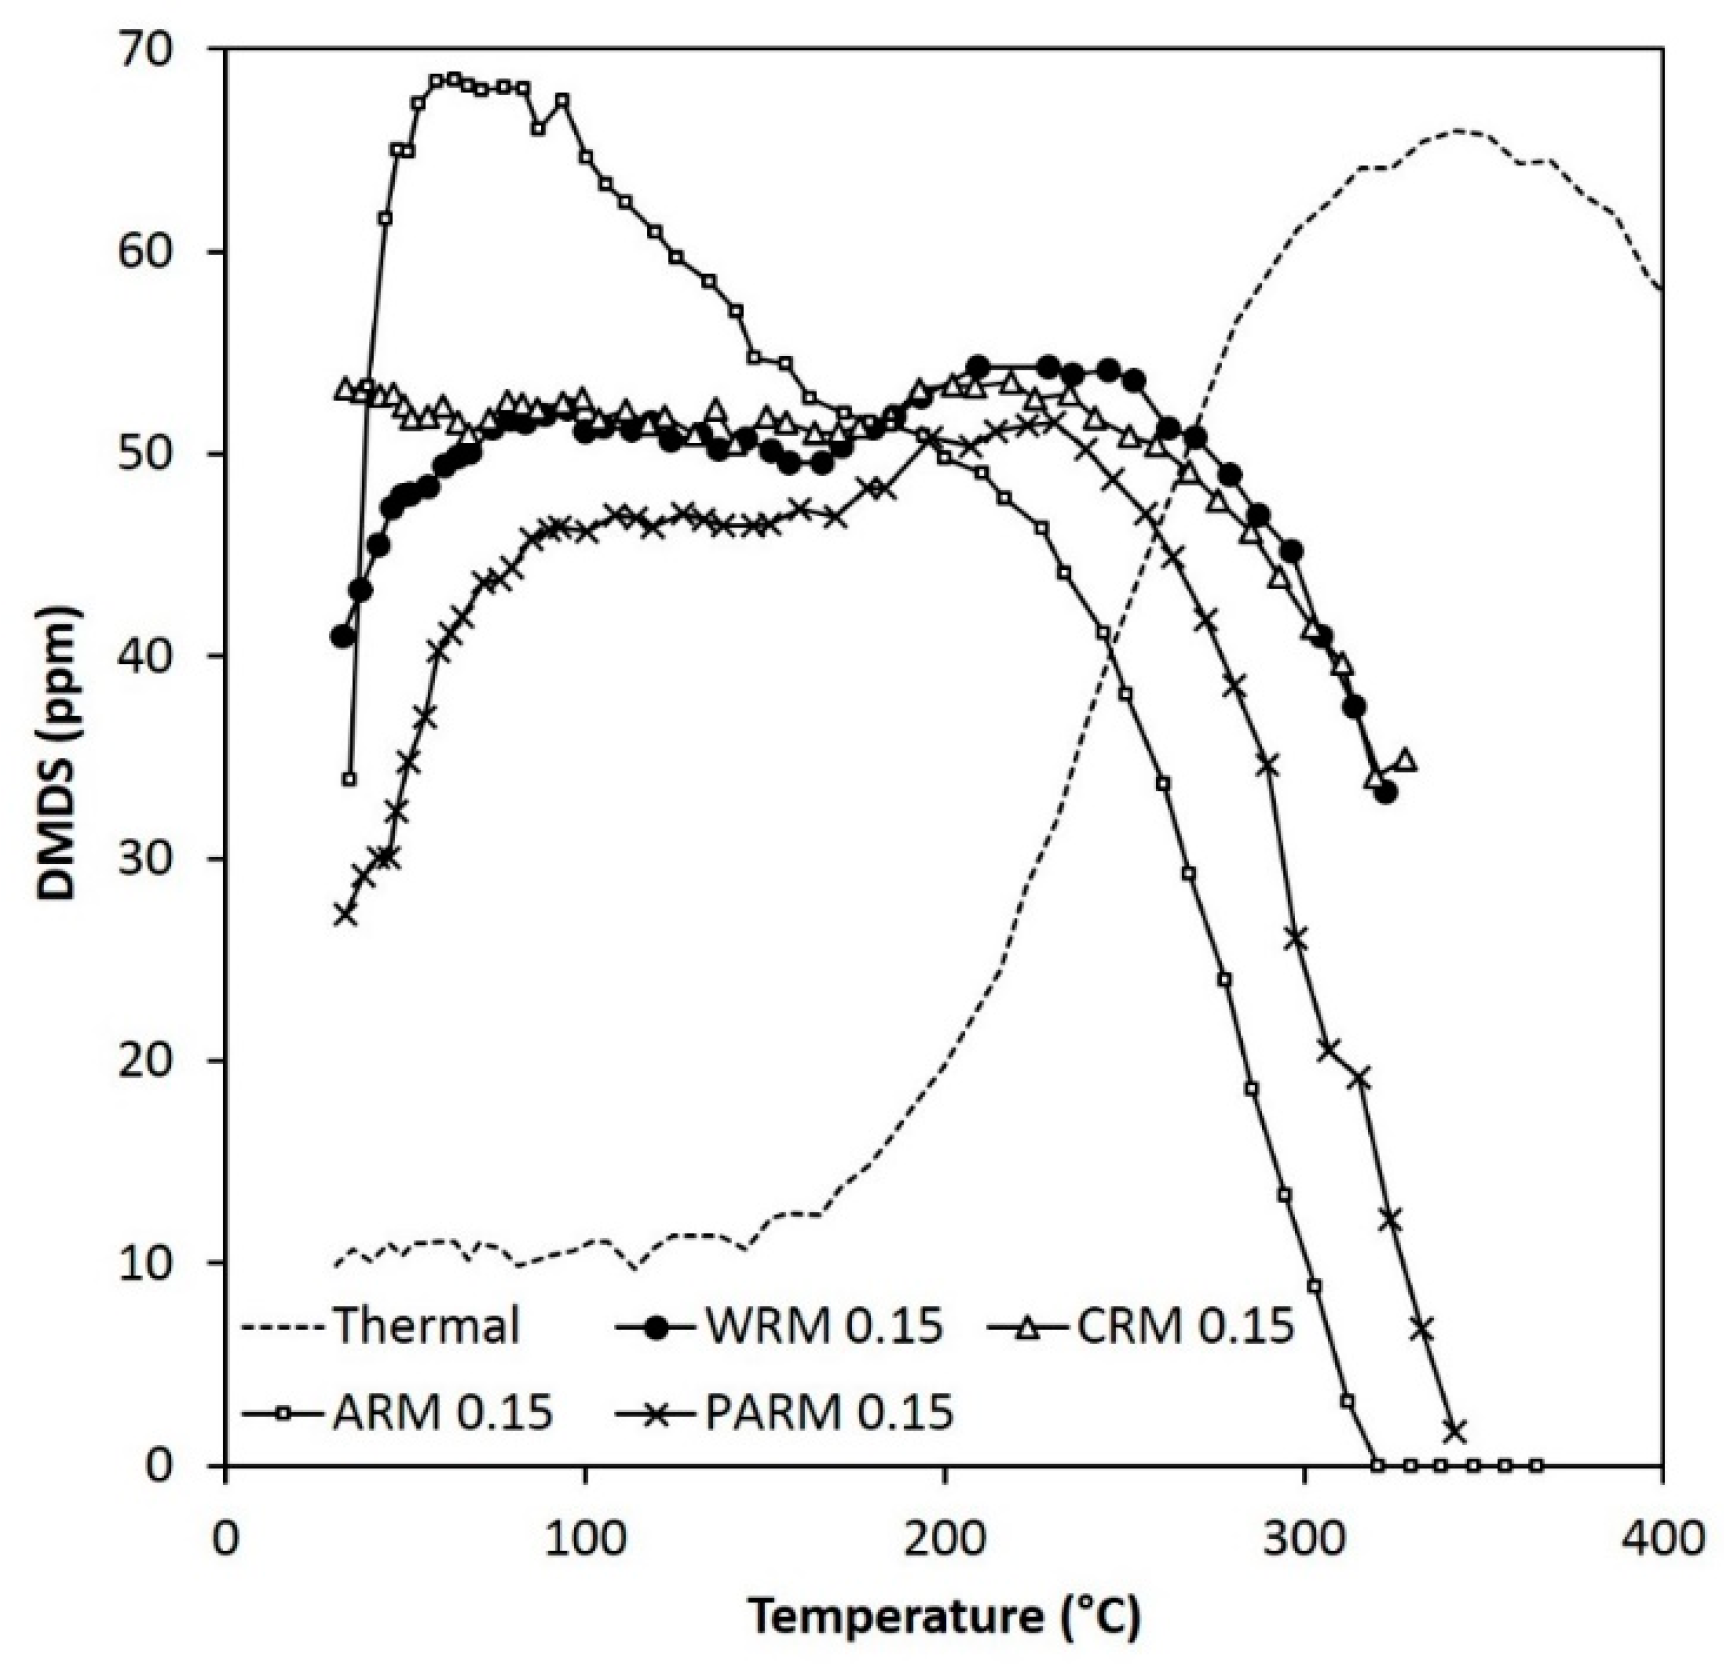
In the experiments with MM over WRM, CRM, and PARM, the concentration of DMDS increased to a rather steady value (~50 ppm over WRM and CRM, ~45 ppm over PARM) at temperatures lower than 100 °C, reaching the maximum value (~55 ppm over WRM and CRM, ~50 ppm over PARM) at ~200 °C and then started to oxidize further (Figure 12). ARM, which performed best in both DMDS and MM oxidation, differed significantly regarding this phenomenon. Over ARM, the maximum concentration of DMDS (~70 ppm) was already reached at ~60 °C, after which DMDS started to oxidize further. It can be concluded that, at low temperatures, DMDS is effectively formed from MM in the presence of RM. SO2, CO, and CO2 are formed later after further oxidation of DMDS.
The behavior of DMDS during the MM experiments is in accordance with the results of DMDS oxidation experiments. Oxidation of DMDS formed as an intermediate in the MM experiments over ARM took place at approximately the same temperature as in the experiments conducted with DMDS as the reactant (Figure 7 and Figure 11). The MM oxidation mechanism via the formation of DMDS has also been reported before [21,49,50].
Paredes et al. [7] were the first to study a red-mud-based catalyst in an oxidation reaction. They also studied the effect of P as a promoter when comparing RM, ARM, and PARM with hematite and a commercial Cu-Cr-Ti catalyst in the catalytic combustion of methane. In their study, ARM was more active in the total combustion of methane than PARM. ARM also had better resistance to deactivation. These results are in accordance with the activity results gained in this study for MM and DMDS oxidation, where it seems that the P content has a negative impact on the performance of PARM.
Chu et al. [51] have studied earlier a MnO/Fe2O3 catalyst in DMDS oxidation. A cylindrical catalyst with a mass of ~0.37 g was used. The T50 values observed for the 50 and 100 ppm experiments were 260 °C and 280 °C, respectively, and T100 was 370 °C for both concentrations. In our case, ARM seems to be equivalent or even better since over 0.30 g of ARM and 55 ppm of DMDS, the T50 and T100 values were 220 °C and 280 °C, respectively, and since a higher WHSV value (200 L h−1 g−1 compared to 25 L h−1 g−1) and a lower mass of ARM was used in the RM experiments. However, the shapes of the materials used were different. In our case, total oxidation was not reached. In the study of Chu et al. [51], selectivity and total oxidation were not discussed.
Wang & Weng [52] studied γ-Al2O3-supported single-metal and mixed-metal oxides in DMDS oxidation. 0.5 g of catalyst and 84 ppm of DMDS were used. Among the catalysts studied, there was one with 5% Fe2O3 on Al2O3. With the Fe2O3/Al2O3 catalyst at a reaction temperature of 260 °C, the DMDS conversion reached 21%, and the yields of SO2 and COx were 12% and 8%, respectively. In our study, over 0.30 g of ARM at 260 °C, the conversion of DMDS (feed 55 ppm) was ~85%, and the SO2 yield was ~45%. WHSV was higher in our experiments (200 L h−1 g−1 compared to 40.8 L h−1 g−1), but the DMDS concentration was higher in the study of Wang & Weng [52]. The better result received in the case of ARM may be due to the significantly higher amount of Fe2O3 in the material.
These comparisons clearly show the very good potential of RM, an industrial waste material, to be used as a raw material for an S-VOC treatment catalyst. As the next step in the research, the addition of active phases on the ARM could be considered to improve total oxidation performance.

3.4. Post-Characterization of the Modified RMs

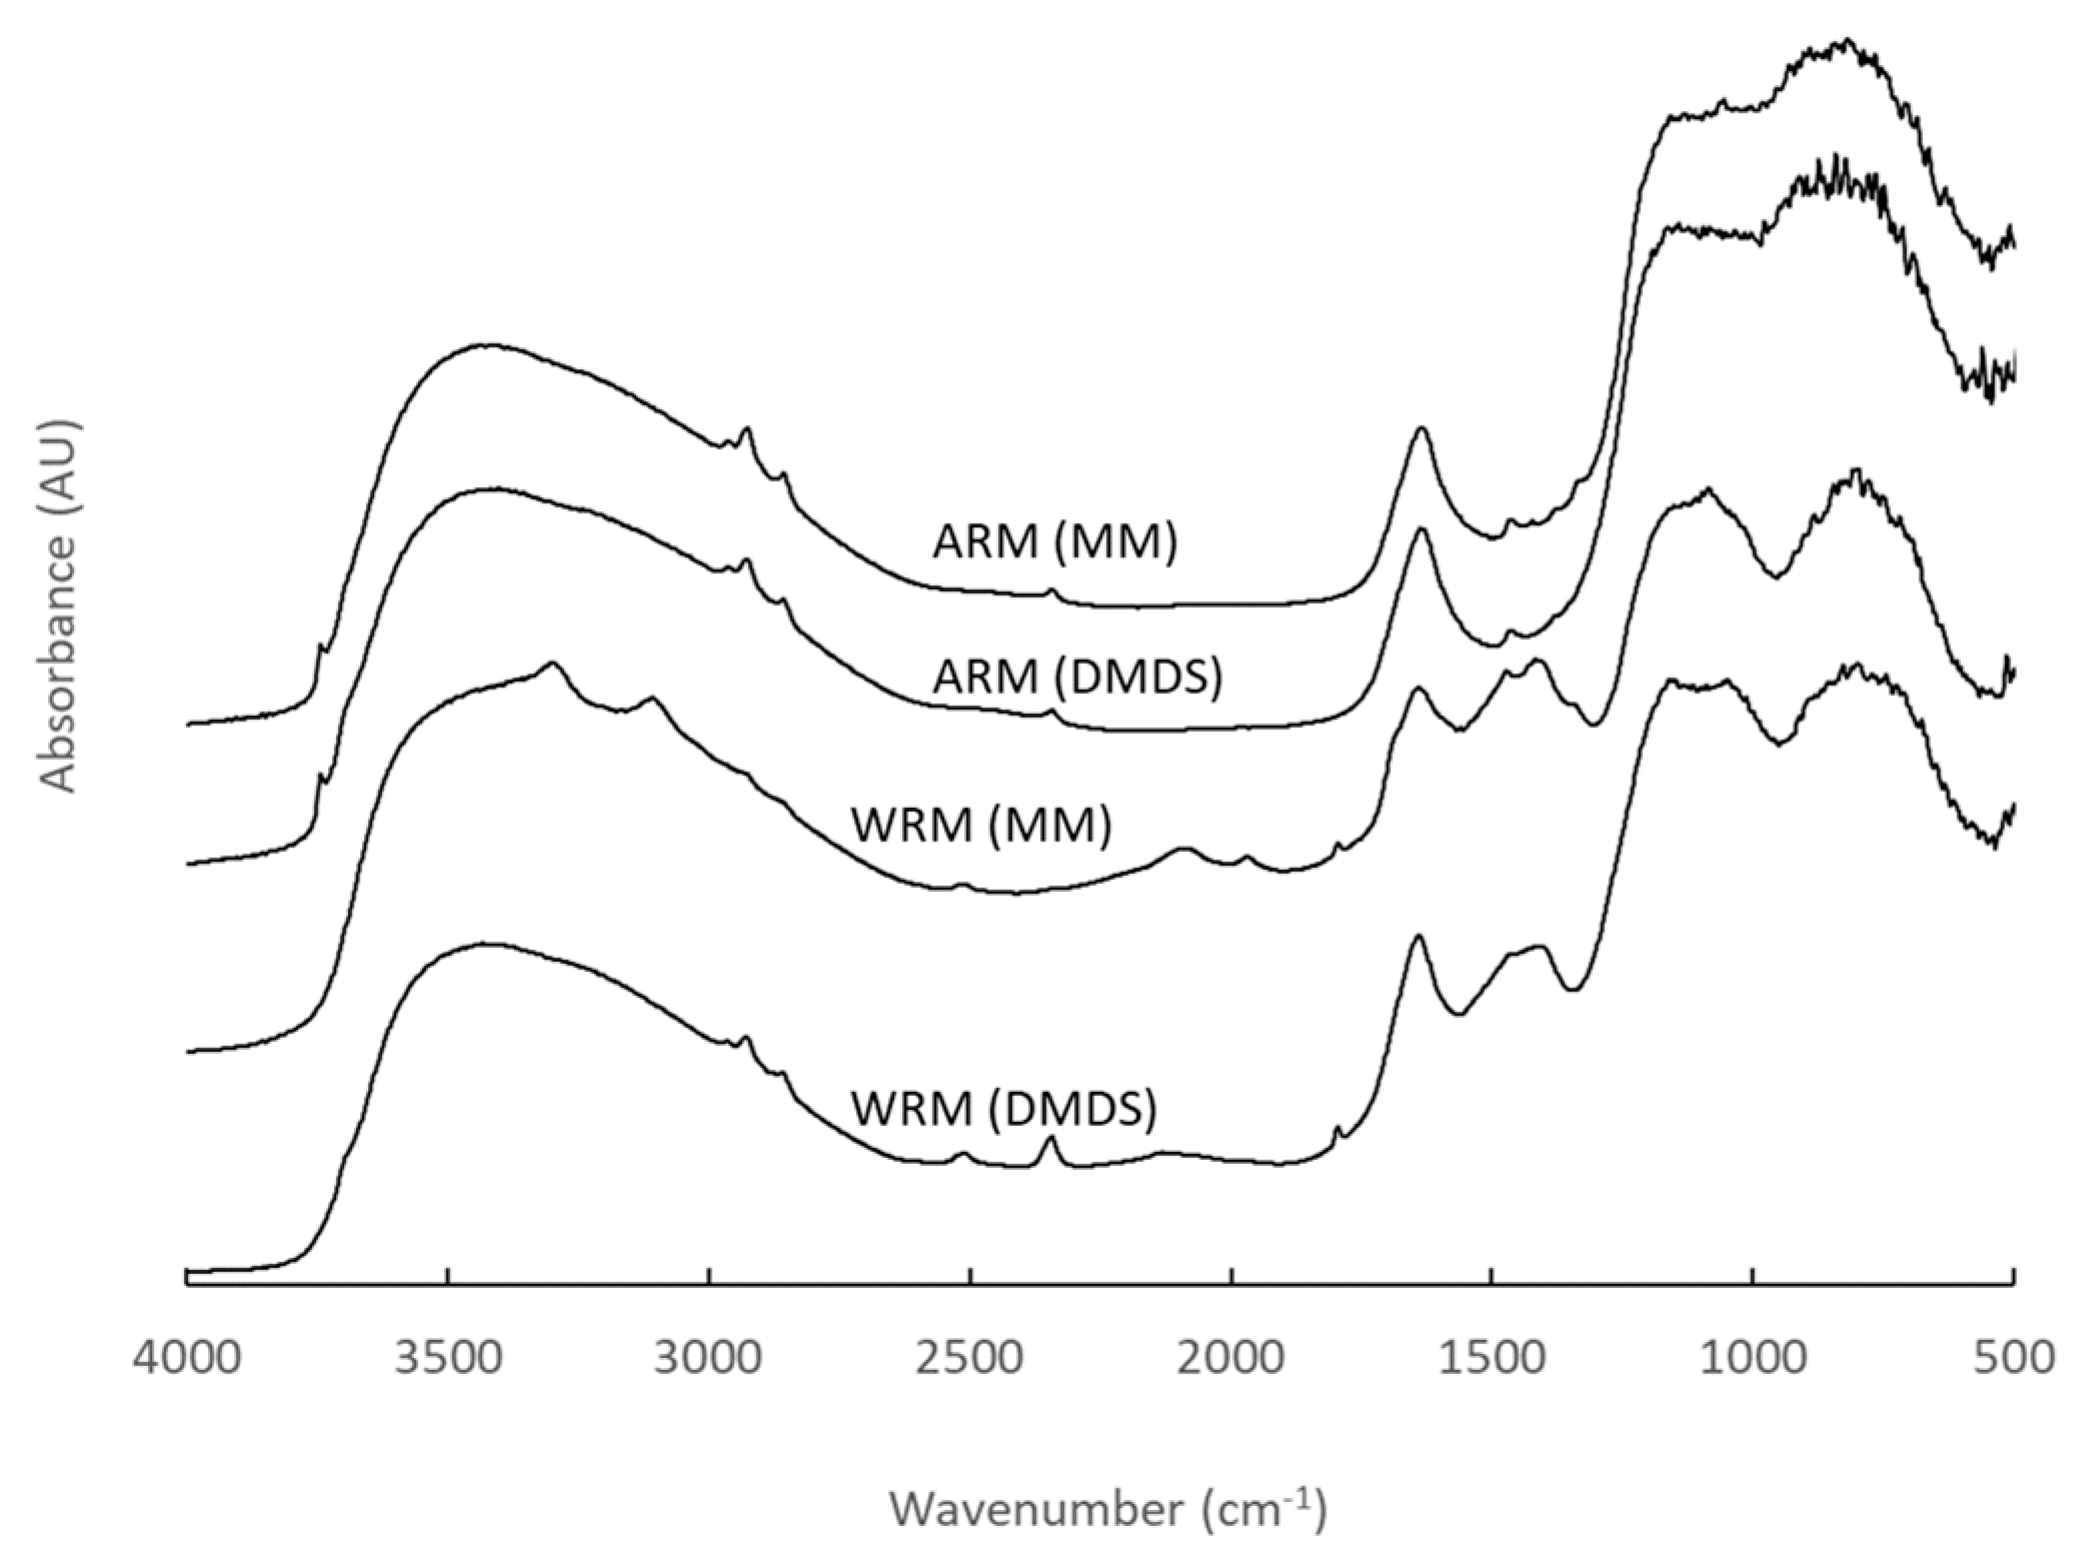
In order to find out more information on the surface characteristics of the modified RMs, the DRIFT spectra of the fresh and used materials were recorded. All the DRIFT spectra (Figure 14 and Figure 15: fresh and used materials, Figures S3–S11: The DRIFT spectra for all DMDS and MM experiments) showed the presence of a significant amount of moisture visible from the wide absorption feature of surface hydroxyl groups observed between ~2600–3800 cm−1. In addition, the fresh WRM showed small sharp peaks at 3620 cm−1 and 3523 cm−1 that represent either metal–OH vibrations or the spectral features of kaolinite (Al2Si2O5(OH)4) [53]. The other materials showed similar smaller peaks at around 3737 cm−1. These might be related to surface Ti–OH groups since all the materials included anatase and rutile [54]. All the materials (fresh and used) also showed peaks at around 1630 cm−1, indicating the presence of molecularly adsorbed water [55]. These peaks were better resolved for ARM and PARM. The WRM and CRM spectra were very similar to each other. The difference is observed with ARM and PARM, where peaks at 1411 cm−1 and 1469 cm−1 disappear. These are related to ʋ3 vibrations of calcite. This result is supported by XRD analysis where calcite was observed for WRM and CRM, and it was removed during acid treatments to prepare ARM and PARM [56].
When the DRIFT spectra of the fresh materials are compared with the spectra of the materials used in DMDS and MM abatement, it can be observed that, after DMDS abatement, a new spectral feature appears at around 1207 cm−1 for WRM and CRM. A similar peak is observed at a slightly higher wavenumber for ARM and PARM at around 1230–1250 cm−1. The difference spectrum shows that the peak is less pronounced for ARM and PARM. The peak appearing at around 1207–1250 cm−1 is most likely the stretching vibration of the S–O bond of sulfate groups, which changes the position due to the change in the material composition after different types of treatments [57,58].
Very similar observations can be made in the case after the MM abatement concerning the peaks appearing in the range 1200–1250 cm−1 for the used materials. Comparison of the spectra also allows the observation that there are fewer sulfates present in ARM and PARM. In addition to a slightly larger OH–vibration at around 1630 cm−1, the materials also showed a new peak appearing at 1683 cm−1. This peak was weaker in the case of ARM and PARM, and it was also related to OH stretching vibration [59]. In all the cases, for the used materials, new peaks also appeared at 2920 cm−1 and 2854 cm−1. These were related to the C–H stretching of most probably methoxy species due to the dissociative adsorption of MM and DMDS on the materials [60].
FE-SEM/EDS showed that the amount of sulfur on the surface of the RM samples used in the DMDS and MM abatement varied between 0.2–1.0 wt-%. The highest values were observed on the surfaces of WRM and CRM and the lowest were with ARM and PARM. This is consistent with the FTIR studies. Sulfur was found to be uniformly distributed on the surface of the analyzed samples, except in the case of the sample used in the DMDS experiment over 0.30 g of CRM. There were some indications of S and Ca being found in the same locations on the RM surface. Ca was observed to be in the form of CaCO3 in the WRM and CRM. Earlier studies show that calcite can adsorb compounds such as MM and DMDS [61], and it seems to have an influence on adsorption in this case as well. Moreover, ARM and PARM had the lowest amount of Ca in their elemental composition, and the lowest amount of S detected on their surface. These results give indications that ARM and PARM are less prone to deactivation caused by sulfur than WRM and CRM, which contain more Ca. Therefore, ARM and PARM are also more interesting materials for further studies.

4. Conclusions

Industrial waste, red mud (RM), modified in four different ways, was studied in the abatement of dimethyl disulfide (DMDS) and methyl mercaptan (MM). RM enhanced the oxidation of both DMDS and MM compared to thermal experiments and was found to be a highly potential raw material for the development of alternative catalysts for the abatement of these compounds. Activation with a dissolution/precipitation method applying HCl greatly improved the oxidation properties of RM (ARM). ARM performed best in the abatement of both DMDS and MM. HCl + H3PO4-activated PARM, which was efficient in the DMDS conversion, was not equally good in MM abatement at lower temperatures. The reasons for the performance improvement were the increase in the specific surface area and changes in the RM composition due to the activation. Moreover, calcination had a positive effect on the properties of RM. ARM had the highest specific surface area of the materials.
Catalytically active metals and metal oxides such as hematite (Fe2O3), anatase (TiO2), and rutile (TiO2) were found in all the materials. The contents of these compounds were the highest for ARM and PARM. The higher activity of these RM-based materials in the DMDS and MM oxidation, compared to thermal oxidation, is most likely due to the presence of these compounds. The lower content of Ca seems to improve the durability of the material since the used ARM and PARM had lower sulfur contents on their surfaces after the experiments compared to the two other materials. The results show the very interesting performances of the modified RMs, but suitable catalytically active compounds could be added to RM to enhance the total oxidation reactions further.

Supplementary Materials

The following supporting information can be downloaded at: https://www.mdpi.com/article/10.3390/resources12010009/s1, Figure S1: XRD patterns of WRM (washed RM), CRM (calcined RM), ARM (HCl-activated RM) and PARM (HCl + H3PO4 -activated RM). Hematite HE, anatase AN, rutile RU, gibbsite GI, boehmite BO, goethite GO, calcite CA and sodium aluminum silicate hydroxide hydrate SO are presented in the figure; Figure S2: Thermogravimetric analysis (TGA) and differential thermal analysis (DTA) of WRM (washed RM) and formation of H2O and CO2 during the analysis measured with mass spectrometry; Figures S3–S11. The DRIFT spectra for all DMDS and MM experiments are presented below. For each experiment, spectra for fresh and used RM samples are presented, in addition to the difference spectrum representing the adsorption on the material during the experiment (WRM: washed RM, CRM: calcined RM, ARM: HCl-activated RM, PARM: HCl + H3PO4 -activated RM).

Author Contributions

Conceptualization, S.P.-A. and S.O.; Methodology, S.O.; Validation, S.P.-A., S.O. and S.P.; Formal Analysis, S.P.-A., S.O. and L.M.; Investigation, S.P.-A. and S.O.; Resources, S.O. and R.L.K.; Data Curation, S.P.-A.; Writing—Original Draft Preparation, S.P.-A., S.O. and L.M.; Writing—Review & Editing, S.P.-A., S.O., S.P., L.M. and R.L.K.; Visualization, S.P.-A. and L.M.; Supervision, S.O. and R.L.K.; Project Administration, S.O. and R.L.K.; Funding Acquisition, S.P.-A. and R.L.K. All authors have read and agreed to the published version of the manuscript.

Funding

This research was funded by the Graduate School in Chemical Engineering (Academy of Finland), Emil Aaltonen Foundation, the North Ostrobothnia Regional Fund of the Finnish Cultural Foundation, and the Council of Oulu Region from the European Regional Development Fund (A32164). Lenka Matějová acknowledges the projects “COOPERATION” (No. CZ.02.1.01./0.0/0.0/17_049/0008419) and “Institute of Environmental Technology—Excellent Research” (No. CZ.02.1.01/0.0/0.0/16_019/0000853) supported from ERDF.

Data Availability Statement

The data will be made available on request.

Acknowledgments

Part of this work was carried out with the support of the Centre for Material Analysis, University of Oulu, Finland. Kirsi Ahtinen, Bouchra Darif, Zouhair El Assal, Christian Hirschmann, Tommi Kokkonen, Tuomas Nevanperä, Jorma Penttinen, Markus Riihimäki, Sami Saukko and Saku Varpenius are acknowledged for their contribution to the experimental work. Special thanks to Riina Salmimies.

Conflicts of Interest

The authors declare no conflict of interest.

References

  1. Dentoni, V.; Grosso, B.; Massacci, G.; Dentoni, V.; Grosso, B.; Massacci, G. Environmental Sustainability of the Alumina Industry in Western Europe. Sustainability 2014, 6, 9477–9493. [Google Scholar] [CrossRef] [Green Version]
  2. Wang, S.; Ang, H.M.; Tadé, M.O. Novel Applications of Red Mud as Coagulant, Adsorbent and Catalyst for Environmentally Benign Processes. Chemosphere 2008, 72, 1621–1635. [Google Scholar] [CrossRef]
  3. Sahu, M.K.; Patel, R.K. Methods for Utilization of Red Mud and Its Management. In Environmental Materials and Waste; Academic Press: Cambridge, MA, USA, 2016; pp. 485–524. [Google Scholar] [CrossRef]
  4. Liu, X.; Han, Y.; He, F.; Gao, P.; Yuan, S. Characteristic, Hazard and Iron Recovery Technology of Red Mud—A Critical Review. J. Hazard. Mater. 2021, 420, 126542. [Google Scholar] [CrossRef]
  5. European Commission. Critical Raw Materials. Available online: https://single-market-economy.ec.europa.eu/sectors/raw-materials/areas-specific-interest/critical-raw-materials_en (accessed on 29 November 2022).
  6. Khairul, M.A.; Zanganeh, J.; Moghtaderi, B. The Composition, Recycling and Utilisation of Bayer Red Mud. Resour. Conserv. Recycl. 2018, 141, 483–498. [Google Scholar] [CrossRef]
  7. Paredes, J.R.; Ordóñez, S.; Vega, A.; Díez, F.V. Catalytic Combustion of Methane over Red Mud-Based Catalysts. Appl. Catal. B Environ. 2004, 47, 37–45. [Google Scholar] [CrossRef]
  8. Sushil, S.; Scholz, P.; Pollok, K.; Ondruschka, B.; Batra, V.S. Application of Industrial Waste Based Catalysts for Total Oxidation of Propane. Chem. Eng. J. 2011, 166, 568–578. [Google Scholar] [CrossRef]
  9. Lamonier, J.F.; Wyrwalski, F.; Leclercq, G.; Aboukaïs, A. Recyclage d’un Déchet, Une Boue Rouge, Comme Catalyseur Pour l’élimination Des Composés Organiques Volatils. Can. J. Chem. Eng. 2008, 83, 737–741. [Google Scholar] [CrossRef]
  10. Sushil, S.; Batra, V.S. Modification of Red Mud by Acid Treatment and Its Application for CO Removal. J. Hazard. Mater. 2012, 203–204, 264–273. [Google Scholar] [CrossRef]
  11. Saputra, E.; Muhammad, S.; Sun, H.; Ang, H.M.; Tadé, M.O.; Wang, S. Red Mud and Fly Ash Supported Co Catalysts for Phenol Oxidation. Catal. Today 2012, 190, 68–72. [Google Scholar] [CrossRef]
  12. Álvarez, J.; Ordóñez, S.; Rosal, R.; Sastre, H.; Díez, F.V. A New Method for Enhancing the Performance of Red Mud as a Hydrogenation Catalyst. Appl. Catal. A Gen. 1999, 180, 399–409. [Google Scholar] [CrossRef]
  13. Pratt, K.C.; Christoverson, V. Hydrogenation of a Model Hydrogen-Donor System Using Activated Red Mud Catalyst. Fuel 1982, 61, 460–462. [Google Scholar] [CrossRef]
  14. Ordóñez, S.; Sastre, H.; Díez, F.V. Catalytic Hydrodechlorination of Tetrachloroethylene over Red Mud. J. Hazard. Mater. 2001, 81, 103–114. [Google Scholar] [CrossRef]
  15. Liu, Q.; Xin, R.; Li, C.; Xu, C.; Yang, J. Application of Red Mud as a Basic Catalyst for Biodiesel Production. J. Environ. Sci. 2013, 25, 823–829. [Google Scholar] [CrossRef]
  16. Wang, M.; Liu, X. Applications of Red Mud as an Environmental Remediation Material: A Review. J. Hazard. Mater. 2021, 408, 124420. [Google Scholar] [CrossRef]
  17. Chen, J.; Wang, Y.; Liu, Z. Red Mud-Based Catalysts for the Catalytic Removal of Typical Air Pollutants: A Review. J. Environ. Sci. 2023, 127, 628–640. [Google Scholar] [CrossRef]
  18. Sahu, R.C.; Patel, R.; Ray, B.C. Removal of Hydrogen Sulfide Using Red Mud at Ambient Conditions. Fuel Process. Technol. 2011, 92, 1587–1592. [Google Scholar] [CrossRef]
  19. Huang, W.; Wang, S.; Zhu, Z.; Li, L.; Yao, X.; Rudolph, V.; Haghseresht, F. Phosphate Removal from Wastewater Using Red Mud. J. Hazard. Mater. 2008, 158, 35–42. [Google Scholar] [CrossRef]
  20. Vega, E.; Lemus, J.; Anfruns, A.; Gonzalez-Olmos, R.; Palomar, J.; Martin, M.J. Adsorption of Volatile Sulphur Compounds onto Modified Activated Carbons: Effect of Oxygen Functional Groups. J. Hazard. Mater. 2013, 258–259, 77–83. [Google Scholar] [CrossRef]
  21. Ojala, S.; Lassi, U.; Ylönen, R.; Keiski, R.; Laakso, I.; Maunula, T.; Silvonen, R. Abatement of Malodorous Pulp Mill Emissions by Catalytic Oxidation—Pilot Experiments in Stora Enso Pulp Mill Oulu, Finland. Tappi J. 2005, 4, 9–14. [Google Scholar]
  22. Balakrishnan, M.; Batra, V.S.; Hargreaves, J.S.J.; Pulford, I.D. Waste Materials—Catalytic Opportunities: An Overview of the Application of Large Scale Waste Materials as Resources for Catalytic Applications. Green Chem. 2011, 13, 16. [Google Scholar] [CrossRef]
  23. Sushil, S.; Batra, V.S. Catalytic Applications of Red Mud, an Aluminium Industry Waste: A Review. Appl. Catal. B Environ. 2008, 81, 64–77. [Google Scholar] [CrossRef]
  24. Yoon, S.-H.; Chai, X.-S.; Zhu, J.Y.; Li, J.; Malcolm, E.W. In-Digester Reduction of Organic Sulfur Compounds in Kraft Pulping. Adv. Environ. Res. 2001, 5, 91–98. [Google Scholar] [CrossRef]
  25. Easter, C.; Quigley, C.; Burrowes, P.; Witherspoon, J.; Apgar, D. Odor and Air Emissions Control Using Biotechnology for Both Collection and Wastewater Treatment Systems. Chem. Eng. J. 2005, 113, 93–104. [Google Scholar] [CrossRef]
  26. Derwent, R.G. Sources, Distributions, and Fates of VOCs in the Atmosphere. In Volatile Organic Compounds in the Atmosphere; Hester, R.E., Harrison, R.M., Eds.; Royal Society of Chemistry: Cambridge, UK, 1995; pp. 1–15. [Google Scholar]
  27. The International Chemical Safety Card (ICSC) of Dimethyl Disulfide, ICSC 1586. Available online: http://www.ilo.org/dyn/icsc/showcard.display?p_lang=en&p_card_id=1586 (accessed on 28 January 2015).
  28. The International Chemical Safety Card (ICSC) of Methyl Mercaptan, ICSC 0299. Available online: http://www.ilo.org/dyn/icsc/showcard.display?p_lang=en&p_card_id=0299 (accessed on 28 January 2015).
  29. Wilby, F.V. Variation in Recognition Odor Threshold of a Panel. J. Air Pollut. Control Assoc. 1969, 19, 96–100. [Google Scholar] [CrossRef]
  30. Valtioneuvoston Päätös (480/1996) Ilmanlaadun Ohjearvoista Ja Rikkilaskeuman Tavoitearvoista (In Finnish). Available online: https://www.finlex.fi/fi/laki/alkup/1996/19960480 (accessed on 20 March 2004).
  31. Shiao, S.-J. Method of Activation of Red Mud. U.S. Patent US4017425A, 1997. Available online: https://patents.google.com/patent/US4017425 (accessed on 31 October 2022).
  32. Chen, S.; Zhang, Y.; Wu, M.; Fang, W.; Yang, Y. Study on Methanethiol Synthesis from H2S and Dimethyl Sulfide over Al2O3 Catalysts Promoted with Phosphorus. Appl. Catal. A Gen. 2012, 431–432, 151–156. [Google Scholar] [CrossRef]
  33. Brunauer, S.; Emmett, P.H.; Teller, E. Adsorption of Gases in Multimolecular Layers. J. Am. Chem. Soc. 1938, 60, 309–319. [Google Scholar] [CrossRef]
  34. Gregg, S.J.; Sing, K.S. Adsorption, Surface Area and Porosity, 2nd ed.; Academic Press Inc.: London, UK, 1982. [Google Scholar]
  35. de Boer, J.H.; Lippens, B.C.; Linsen, B.G.; Broekhoff, J.C.P.; van den Heuvel, A.; Osinga, T.J. Thet-Curve of Multimolecular N2-Adsorption. J. Colloid Interface Sci. 1966, 21, 405–414. [Google Scholar] [CrossRef]
  36. Schneider, P. Adsorption Isotherms of Microporous-Mesoporous Solids Revisited. Appl. Catal. A Gen. 1995, 129, 157–165. [Google Scholar] [CrossRef]
  37. Barrett, E.P.; Joyner, L.G.; Halenda, P.P. The Determination of Pore Volume and Area Distributions in Porous Substances. I. Computations from Nitrogen Isotherms. J. Am. Chem. Soc. 1951, 73, 373–380. [Google Scholar] [CrossRef]
  38. Roberts, B. A Procedure for Estimating Pore Volume and Area Distributions from Sorption Isotherms. J. Colloid Interface Sci. 1967, 23, 266–273. [Google Scholar] [CrossRef]
  39. Lecloux, A.; Pirard, J.P. The Importance of Standard Isotherms in the Analysis of Adsorption Isotherms for Determining the Porous Texture of Solids. J. Colloid Interface Sci. 1979, 70, 265–281. [Google Scholar] [CrossRef]
  40. Frisch, M.J.; Trucks, G.W.; Schlegel, H.B.; Scuseria, G.E.; Robb, M.A.; Cheeseman, J.R.; Montgomery, J.J.A.; Vreven, T.; Kudin, K.N.; Burant, J.C.; et al. Gaussian 03, revision B.04 ed.; Gaussian, Inc.: Wallingford, CT, USA, 2004. [Google Scholar]
  41. Pitkäaho, S.; Ojala, S.; Kinnunen, T.; Silvonen, R.; Keiski, R.L. Catalytic Oxidation of Dichloromethane and Perchloroethylene: Laboratory and Industrial Scale Studies. Top. Catal. 2011, 54, 1257. [Google Scholar] [CrossRef]
  42. Hayes, R.E.; Kolaczkowski, S.T. Introduction to Catalytic Combustion; Gordon and Breach Science Publishers: Amsterdam, The Netherlands, 1997. [Google Scholar]
  43. Liu, Y.; Lin, C.; Wu, Y. Characterization of Red Mud Derived from a Combined Bayer Process and Bauxite Calcination Method. J. Hazard. Mater. 2007, 146, 255–261. [Google Scholar] [CrossRef]
  44. Wu, C.; Liu, D. Mineral Phase and Physical Properties of Red Mud Calcined at Different Temperatures. J. Nanomater. 2012, 2012, 628592. [Google Scholar] [CrossRef]
  45. Muhammad, S.; Saputra, E.; Sun, H.; Ang, H.-M.; Tadé, M.O.; Wang, S. Heterogeneous Catalytic Oxidation of Aqueous Phenol on Red Mud-Supported Cobalt Catalysts. Ind. Eng. Chem. Res. 2012, 51, 15351–15359. [Google Scholar] [CrossRef]
  46. Klose, F.; Scholz, P.; Kreisel, G.; Ondruschka, B.; Kneise, R.; Knopf, U. Catalysts from Waste Materials. Appl. Catal. B Environ. 2000, 28, 209–221. [Google Scholar] [CrossRef]
  47. Albright, L. Albright’s Chemical Engineering Handbook; CRC Press: Boca Raton, FL, USA, 2008; Volume 20, ISBN 0824753623. [Google Scholar]
  48. Santona, L.; Castaldi, P.; Melis, P. Evaluation of the Interaction Mechanisms between Red Muds and Heavy Metals. J. Hazard. Mater. 2006, 136, 324–329. [Google Scholar] [CrossRef]
  49. Dalai, A.K.; Tollefson, E.L.; Yang, A.; Sasaoka, E. Oxidation of Methyl Mercaptan over an Activated Carbon in a Fixed-Bed Reactor. Ind. Eng. Chem. Res. 1997, 36, 4726–4733. [Google Scholar] [CrossRef]
  50. Kastner, J.R.; Das, K.C.; Buquoi, Q.; Melear, N.D. Low Temperature Catalytic Oxidation of Hydrogen Sulfide and Methanethiol Using Wood and Coal Fly Ash. Environ. Sci. Technol. 2003, 37, 2568–2574. [Google Scholar] [CrossRef]
  51. Chu, H.; Hao, G.H.; Tseng, T.K. Laboratory Study of Poisoning of a MnO/Fe2O3 Catalyst by Dimethyl Sulfide and Dimethyl Disulfide. J. Hazard. Mater. 2003, 100, 301–316. [Google Scholar] [CrossRef]
  52. Wang, C.-H.; Weng, H.-S. Al2O3-Supported Mixed-Metal Oxides for Destructive Oxidation of (CH3)2S2. Ind. Eng. Chem. Res. 1997, 36, 2537–2542. [Google Scholar] [CrossRef]
  53. Amer, M.; Khalili, F.; Awwad, A. Adsorption of Lead, Zinc and Cadmium Ions on Polyphosphate-Modified Kaolinite Clay. J. Environ. Chem. Ecotoxicol. 2010, 2, 001–008. [Google Scholar]
  54. Kandori, K.; Oketani, M.; Sakita, Y.; Wakamura, M. FTIR Studies on Photocatalytic Activity of Ti(IV)-Doped Calcium Hydroxyapatite Particles. J. Mol. Catal. A Chem. 2012, 360, 54–60. [Google Scholar] [CrossRef]
  55. McIntosh, I.M.; Nichols, A.R.L.; Tani, K.; Llewellin, E.W. Accounting for the Species-Dependence of the 3500 cm−1 H2Ot Infrared Molar Absorptivity Coefficient: Implications for Hydrated Volcanic Glasses. Am. Mineral. J. Earth Planet. Mater. 2017, 102, 1677–1689. [Google Scholar] [CrossRef] [Green Version]
  56. Toffolo, M.B.; Regev, L.; Dubernet, S.; Lefrais, Y.; Boaretto, E. FTIR-Based Crystallinity Assessment of Aragonite–Calcite Mixtures in Archaeological Lime Binders Altered by Diagenesis. Minerals 2019, 9, 121. [Google Scholar] [CrossRef] [Green Version]
  57. Mahamallik, P.; Pal, A. Photo-Fenton Process in a Co(Ii)-Adsorbed Micellar Soft-Template on an Alumina Support for Rapid Methylene Blue Degradation. RSC Adv. 2016, 6, 100876–100890. [Google Scholar] [CrossRef]
  58. Chen, G.; Zhang, B.; Zhao, J. Dispersion Process and Effect of Oleic Acid on Properties of Cellulose Sulfate-Oleic Acid Composite Film. Materials 2015, 8, 2346–2360. [Google Scholar] [CrossRef] [Green Version]
  59. Yadav, V.K.; Saxena, P.; Lal, C.; Gnanamoorthy, G.; Choudhary, N.; Singh, B.; Tavker, N.; Kalasariya, H.; Kumar, P. Synthesis and Characterization of Mullites From Silicoaluminous Fly Ash Waste. Int. J. Appl. Nanotechnol. Res. 2020, 5, 10–25. [Google Scholar] [CrossRef]
  60. Koivikko, N.; Ojala, S.; Laitinen, T.; Lopes da Silva, F.; Hautala, L.; El Assal, Z.; Honkanen, M.; Vippola, M.; Huuhtanen, M.; Huttula, M.; et al. Activity and in Situ DRIFT Studies on Vanadia Catalysts during Oxidative Dehydrogenation of Sulfur-Contaminated Methanol. Appl. Catal. B Environ. 2022, 318, 121803. [Google Scholar] [CrossRef]
  61. Ataman, E.; Andersson, M.P.; Ceccato, M.; Bovet, N.; Stipp, S.L.S. Functional Group Adsorption on Calcite: II. Nitrogen and Sulfur Containing Organic Molecules. J. Phys. Chem. C 2016, 120, 16597–16607. [Google Scholar] [CrossRef]
Figure 1. Illustration of the experimental set-up used in the activity tests (DMDS: dimethyl disulfide, MM: methyl mercaptan).
Resources 12 00009 g001
Figure 2. Nitrogen adsorption-desorption isotherms of (a) WRM (washed RM, solid black line) and CRM (calcined RM, grey dashed line) and (b) ARM (HCl-activated RM, solid grey line) and PARM (HCl + H3PO4 -activated RM, black dashed line).
Resources 12 00009 g002
Figure 3. Pore-size distributions of (a) WRM (washed RM, solid black line) and CRM (calcined RM, grey dashed line) and (b) ARM (HCl-activated RM, solid grey line) and PARM (HCl + H3PO4 -activated RM, black dashed line).
Resources 12 00009 g003
Figure 4. Molecules of dimethyl disulfide, DMDS (left), and methyl mercaptan, MM (right) and their evaluated dimensions.
Resources 12 00009 g004
Figure 5. FE-SEM images showing the particle morphology of WRM (washed RM), CRM (calcined RM), ARM (HCl-activated RM), and PARM (HCl + H3PO4 -activated RM).
Resources 12 00009 g005
Figure 6. The activity of WRM, CRM, ARM, and PARM in the DMDS abatement (DMDS 55 ppm, amounts of WRM and CRM 0.30 g, amounts of ARM and PARM 0.15 g) (WRM: washed RM, CRM: calcined RM, ARM: HCl-activated RM, PARM: HCl + H3PO4 -activated RM).
Resources 12 00009 g006
Figure 7. Conversion of DMDS when using different amounts of ARM (HCl-activated RM, 0.30 g or 0.15 g) and different concentrations of DMDS (55 ppm or 110 ppm).
Resources 12 00009 g007
Figure 8. The activity of WRM, CRM, ARM, and PARM in the MM abatement (MM 120 ppm) (WRM: washed RM, CRM: calcined RM, ARM: HCl-activated RM, PARM: HCl + H3PO4 -activated RM).
Resources 12 00009 g008
Figure 9. The concentration of CO2 during the DMDS experiments (the same conditions as in Figure 6). Tmax points are marked with circles (WRM: washed RM, CRM: calcined RM, ARM: HCl-activated RM, PARM: HCl + H3PO4 -activated RM).
Resources 12 00009 g009
Figure 10. The yield of SO2 during the DMDS experiments (the same conditions as in Figure 6). Tmax points are marked with circles (WRM: washed RM, CRM: calcined RM, ARM: HCl-activated RM, PARM: HCl + H3PO4 -activated RM).
Resources 12 00009 g010
Figure 11. Reactant and product concentrations during the MM experiments (120 ppm) over 0.15 g of ARM (HCl-activated RM).
Resources 12 00009 g011
Figure 12. The concentration of DMDS during the MM experiments (MM feed 120 ppm) (WRM: washed RM, CRM: calcined RM, ARM: HCl-activated RM, PARM: HCl + H3PO4 -activated RM).
Resources 12 00009 g012
Figure 13. Reactant and product concentrations during the DMDS experiments (110 ppm) over 0.15 g of ARM (HCl-activated RM).
Resources 12 00009 g013
Figure 14. The DRIFT spectra of the fresh RM samples (WRM: washed RM, CRM: calcined RM, ARM: HCl-activated RM, PARM: HCl + H3PO4 -activated RM).
Resources 12 00009 g014
Figure 15. The DRIFT spectra of the used WRM (washed RM) and ARM (HCl-activated RM) samples after DMDS and MM experiments.
Resources 12 00009 g015
Table 1. Summary of the pretreatment and activation of red mud (RM).
Pretreatment
Filtration, Washing, DryingAcid Treatment HClAcid Treatment HCl + H3PO4CalcinationCrushing
WRMWashed RMx x
CRMCalcined RMx xx
ARMHCl-activated RMxx xx
PARMHCl + H3PO4 -activated RMx xxx
Table 2. Amounts of RM, the feed concentrations, and weight hourly space velocities (WHSV) in the DMDS experiments (WRM: washed RM, CRM: calcined RM, ARM: HCl-activated RM, PARM: HCl + H3PO4 -activated RM).
ExperimentAmount of RMDMDS FeedWHSV
(g)(ppm)(L h−1 g−1)
Thermal-55-
Thermal 110-110-
WRM 0.300.3055200
CRM 0.300.3055200
ARM 0.300.3055200
ARM 0.150.1555400
ARM 0.15 DMDS 1100.15110400
PARM 0.150.1555400
Table 3. Elemental composition (wt-%) of the RM fractions (WRM: washed RM, CRM: calcined RM, ARM: HCl-activated RM, PARM: HCl + H3PO4 -activated RM).
Major Elements (wt-%)
WRMCRMARMPARM
Fe40404337
O35353638
Al9.99.91111
Ti4.14.14.33.8
Ca2.92.90.41.5
Na2.83.1<0.1<0.1
Si2.52.42.42.5
P0.80.80.84.3
Mn0.80.80.80.7
Cr0.20.20.20.2
Mg0.10.10.10.1
S0.10.10.10.0
Cl0.10.10.30.1
Table 4. Evaluation of the proportions of different compounds in the RM fractions according to the XRD analysis (Reference Intensity Ratio method, RIR) and the crystallite size of hematite in each fraction calculated with the Scherrer equation (WRM: washed RM, CRM: calcined RM, ARM: HCl-activated RM, PARM: HCl + H3PO4 -activated RM).
Evaluated Percentages in Fractions (%)
WRMCRMARMPARM
HematiteFe2O330598683
AnataseTiO245910
RutileTiO23257
GibbsiteAl(OH)310
BoehmiteAlO(OH)8
GoethiteFeO(OH)27
Sodium Aluminum Silicate Hydroxide HydrateNa8(AlSiO4)6(OH)2·4H2O1330
Magnesium Titanium Oxide(Mg0.3Ti2.7)O54
CalciteCaCO345
Crystallite size of hematite Å (Scherrer)312222204214
Table 5. Textural properties of the samples determined by nitrogen physisorption at −196 °C. SBET = specific surface area, Sm = Mesopore surface area, Vµ = Micropore volume, and Vnet = Net pore volume (for p/p0 = 0.988) (WRM: washed RM, CRM: calcined RM, ARM: HCl-activated RM, PARM: HCl + H3PO4 -activated RM).
SampleSBETSmVµVnet
(m2 g−1)(m2 g−1)(mm3liq g−1)(mm3liq g−1)
WRM412510178
CRM593814211
ARM1449134293
PARM1087023358
Table 6. T50 and Tmax values and SO2 yields and CO concentrations at Tmax in the DMDS experiments (WRM: washed RM, CRM: calcined RM, ARM: HCl-activated RM, PARM: HCl + H3PO4 -activated RM).
ExperimentT50 Tmax SO2 CO
(°C)(°C)(%)(ppm)
Thermal470480 145<10
Thermal 110460480 16520
WRM 0.30300480 240<10
CRM 0.30310460 25540
ARM 0.30220280 15515
ARM 0.15250310 16020
ARM 0.15 DMDS 110270320 17030
PARM 0.15300350 16515
1 Maximum conversion 100%; 2 Maximum conversion ~100% (see Figure 6).
Table 7. T50 and T100 values and DMDS concentrations at T100 in the MM experiments (WRM: washed RM, CRM: calcined RM, ARM: HCl-activated RM, PARM: HCl + H3PO4 -activated RM).
ExperimentT50 T100 DMDS
(°C)(°C)(ppm)
Thermal25033065
WRM 0.1530 123055
CRM 0.1530 121055
ARM 0.1530 119050
PARM 0.156021050
1 T50 already reached at the beginning of the experiment.
Disclaimer/Publisher’s Note: The statements, opinions and data contained in all publications are solely those of the individual author(s) and contributor(s) and not of MDPI and/or the editor(s). MDPI and/or the editor(s) disclaim responsibility for any injury to people or property resulting from any ideas, methods, instructions or products referred to in the content.