1. Introduction
With the increase of population, urbanization, and economic development, the demand for fresh water increases in urban areas of Europe. At the same time, the availability of water for city inhabitants is also influenced by climate change and the level of its pollution. Freshwater resources are widely recognized as the main source of water intended for human consumption as well as being an essential element of any ecosystem [
1,
2,
3]. Sustainable development and skillful use of water resources has become an increasing challenge for water companies in recent years due to the growing demand for water and the changing climate from year to year. According to the Intergovernmental Panel on Climate Change (IPCC), the effects of global warming and the emerging extreme weather phenomena will be perceived primarily as changes in the hydrological cycle [
3,
4,
5]. The consequences of climate change will have different effects in different regions of the world, but it is predicted that the deficiency of freshwater intended to supply water to people around the world will increase. Water deficiency directly affects the safety of access to drinking water, the health and hygiene of citizens, and the general state of the environment [
6,
7,
8].
According to the findings of the European Environment Agency (EEA), prolonged periods of low rainfall and drought, as well as the misuse of water resources, have placed the balance between water demand and water availability at a critical level in many European countries [
1,
2]. About 248,000 million m
3 of water is collected in Europe to meet the needs of European economies, including the needs resulting from the right to water [
1,
2]. It is estimated that more than three-quarters of European citizens live in urban areas and depend on access to clean water. About one fifth of the total freshwater abstracted in Europe is supplied to water systems operated by water companies [
1,
2].
Water companies are required to supply the right amount of water, under the correct pressure and quality. It should be remembered that the water supply system supplies water not only to households (on average about 64%), but also to other industries, e.g., industrial, service, and production plants. According to the EEA estimates from 2017 in Europe, the daily supply of water to households was at the level of 147 dm
3/I·d. As 50 dm
3/I·d is considered the daily minimum [
9], the determined European average significantly exceeds this threshold. The successive modernization of water supply systems and the constantly growing public awareness of the rational use of tap water resulted in a decrease in water consumption by about 18%, while the population in Europe increased by about 10% over two decades [
2].
In light of these considerations, one should also take into account the problem of water losses, which is an inseparable element of the functioning of water systems, both in Poland and in the rest of the world. It is well known that actual water losses are mainly caused by leaks due to failure of water pipes and fittings. It should be clearly stated that water losses cannot be completely eliminated [
10,
11]. The International Water Association (IWA) plays an important role in implementing the principles of sustainable development in broadly understood water management, as well as in reducing water losses. IWA guidelines on determining, analyzing, and assessing the amount of losses in water balance systems make it possible to compare the operation of water networks to various water supply companies [
12,
13]. Considering the need for rational management of water resources, constant monitoring of the amount of water losses should become a priority for every operator of water systems as well as the basis for assessing the operation of the water network [
11].
Evaluation of water resources in quantitative terms for individual agglomerations have been the subject of few studies. For example, paper [
14] presents a risk assessment model of water shortage based on information diffusion technology and its application in analyzing carrying capacity of water resources in the city of Jinhua in Zhejiang Province, China. This model simulates the dynamic changing process of carrying capacity of water resources under the condition of enforcement of the future policy in the city using the model of system dynamics. The results of the work indicate the direction of the city’s development, where the requirement for water supply will not be satisfied under the balanced considerations of economy and environment if the present amount of water supply is constantly maintained in the near future. Paper [
15] presents the use of satellite images to assess water resources in relation to the hydrographic basin of river Barzava in Romania in terms of water bodies in the area. The results present the maps of the region considered to be dry or wet depending on the hydrological situation in the studied region.
In the literature, one can find many studies in the field of estimating water losses in water supply systems [
16,
17,
18,
19,
20,
21,
22,
23,
24,
25,
26,
27] or assessing the diversification of water intakes [
28,
29,
30,
31,
32], but no studies combining these two elements have been found. The paper presents a new tool for managing the operation of a collective water supply system (CWSS), using the existing tools to assess water losses in water networks or to assess the diversification of water intakes.
The main aim of this study was to present a method for assessing the possibilities for the development of urban agglomerations conditioned by the availability of water resources and the possibility of supplying people with water. The paper presents indicators of limitation of agglomeration development related to the availability of water resources and the production capacity of water treatment plants, a method of assessing the diversification of water resources using the Pielou index, with a proposal for their categorization. In addition, a water loss balance was prepared on the basis of international IWA standards in order to determine the amount of water losses in the analyzed CWSS. A large group of scientists from all over the world continue to use and develop new methods based on the logical water balance according to IWA [
24,
25,
26,
27]. Appropriate indicators are needed to effectively manage water supply systems [
33]. The obtained results constitute a tool for controlling the amount of water in water systems. Determination of indicators of limitation of agglomeration development, assessment of the degree of diversification of water resources, and estimation of the amount of water losses were carried out for five selected urban agglomerations located in south-eastern Poland. The secondary purpose of the conducted research and analysis can be the possibility of using the research results as a tool for planning the budget of the water supply company for the next operational year. It can supplement the water supply system management process in the context of effective planning of renovation and repair works of the water supply network, determining the production capacity of water treatment plants, which in turn will reduce the costs of electricity and gas consumption.
2. Materials and Methods
2.1. Research Object
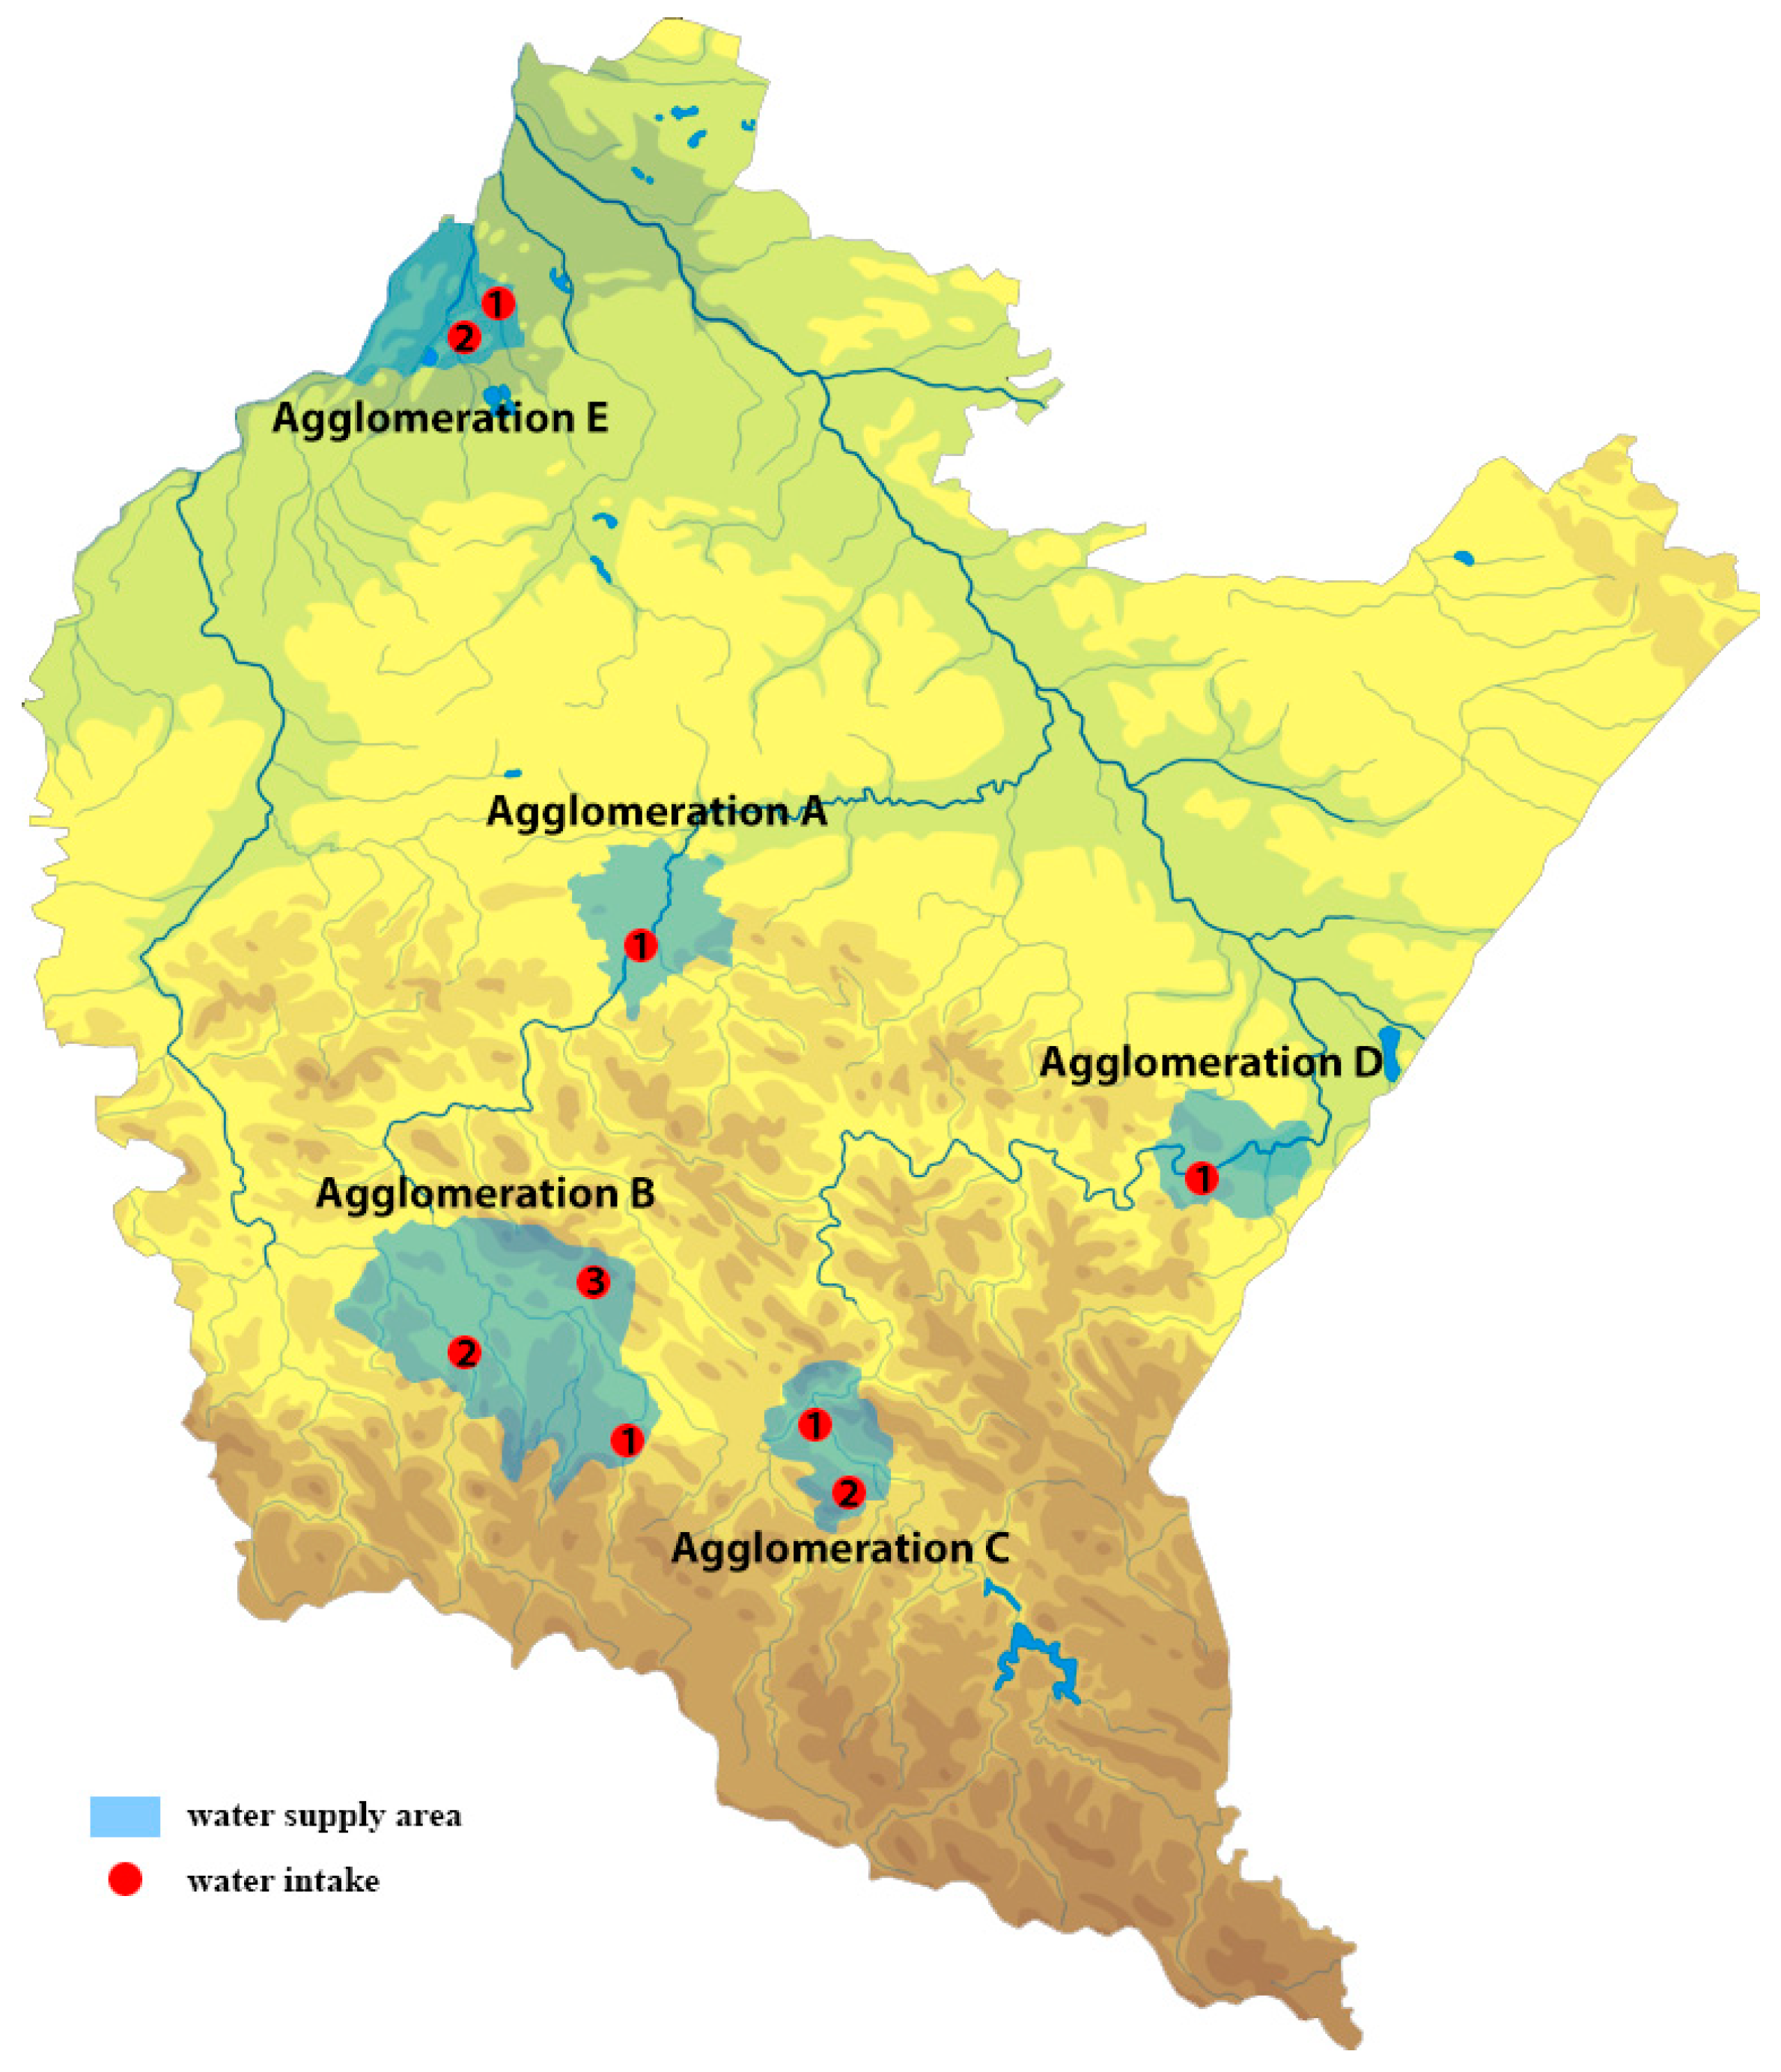
The analysis was carried out for 5 urban areas in the region of South-Eastern Poland in the Podkarpackie Voivodeship. Their location is shown in
Figure 1. Four of the areas use surface water to water supply purposes, while one of them uses groundwater.
Table 1 presents the characteristics of the studied agglomerations.
The first stage of the research was to obtain operational data from water companies in five analyzed urban agglomerations (agglomeration A–E). These data included: the number of water intakes, the amounts limiting the water intake from water usage permissions, the actual amounts of water intake, the production capacity of water treatment plants, and the characteristic volumes of water needed to calculate a simplified balance of water losses in the water supply network.
The analysis covered data for the previous operational period (year 2021). Some of the data that could not be measured or made available by water companies was estimated on the basis of the literature and the experience of the authors of this study. The obtained data were used to create the balance of water losses according to IWA, the calculation of the water supply possibilities balance and the water intake diversification index (Pielou index). On the basis of the obtained results of the calculation, it was possible to assess the state of water resources and the possibilities of water supply to the population as key elements in the constrains of agglomerations development.
2.2. Water Supply Possibilities Balance
In Poland, water supply companies are required to have a water usage permission for the intake of groundwater or surface water, its treatment, and distribution [
34]. The water usage permission is issued by the Państwowe Gospodarstwo Wodne—Wody Polskie, which is the governmental body of water administration in Poland. The water permission for special water use, i.e., water intake for the purpose of supplying people with water, specifies the limit values for the amount of water intake from a well (in the case of groundwater) or from a river or lake (in the case of surface waters):
- -
Q PER avg d, m3/d—the average daily value of water intake from the source,
- -
Q PER max h, m3/h—maximum hourly value of water intake from the source,
- -
Q PER max y, m3/year—the maximum annual value of water intake from the source.
In the case of surface waters, these values are defined in relation to the so-called inviolable flow- Q
INV [
34]. This flow can be defined as the amount of water that should flow as a minimum in a given cross-section of a watercourse for biological and social reasons, i.e., preservation of biological life in flowing waters, fishing requirements, nature protection, sport and water tourism requirements, and the preservation of the beauty of the landscape [
35]. There are several methods of determining the inviolable flow, e.g., the multi-criteria method of Kostrzewa [
35], hydrological methods, or statistical methods [
36]. For underground waters, the values in the water usage permission are determined in relation to the exploitation resources of the wells—Q
WS, approved by hydrogeological research [
34].
In order to determine the water reserve that can be supplied to the inhabitants of the agglomeration under the current conditions specified in the water usage permission, it is necessary to know the difference between the amount of water that can be taken in while maintaining an inviolable flow and the maximum daily amount of water intake during the year. It is described by the formula:
where
- -
QR1—the water reserve that can be supplied to the inhabitants of the agglomeration under the current conditions specified in the water usage permission, m3/d,
- -
Q PER avg d—the average daily value of water intake from the source determined in the water usage permission, m3/d,
- -
Q INTAKE max d—maximum daily value of water intake, m3/d.
The amount of water reserve that can be supplied to the inhabitants of the agglomeration is also indirectly influenced by the amount of water losses for the analyzed CWSS. The amount of water loss
is included in the amount of water intake
, therefore, by reducing the amount of water losses, it is possible to increase the reserve of water that can be taken in in accordance with the conditions of the water permit. It is described by the formula:
where
- -
QR2—the water reserve that can be supplied to the inhabitants of the agglomeration under the current conditions specified in the water usage permission and due to reduction of the water loss amount, m3/d,
- -
Q LOSS avg d—average daily value of water losses in the water supply network, which can be limited, m3/d.
The amount of daily water intake can be increased by an amount of QR1 or QR2 up to the level specified in the water usage permission Q PER avg d.
It is often observed that the production capacities of water treatment plants significantly exceed the limits for water intake from the source specified in the water usage permission. This leads to a situation where the production capacities of the plants are not fully used due to the inability to take in enough water. The amount of water (Q
P) that could be additionally supplied to the agglomeration, due to the production capacity of the water treatment plant can be determined by the formula:
where
- -
QP—the amount of water that could be additionally supplied to the agglomeration, due to the production capacity, m3/d,
- -
Q PROD max d—maximum water production capacity of the water treatment plant, m3/d,
- -
Q PER avg d—the average daily value of water intake from the source determined in the water usage permission, m3/d.
In order to determine water losses in water supply systems of the analyzed urban agglomerations, the balance method proposed by IWA [
12] was used. It assumes that the total amount of water in the water supply system is divided into two categories: water consumed by recipients, determined by measurement and the method of its settlement in a given system, and water losses, among which we distinguish apparent losses (resulting from illegal water intake from the network and errors related to the inaccuracy of measuring devices) and actual losses, which include water losses related to uncontrolled leakages and failures, water losses in water tanks, and water losses in water connections to households. The simplified balance should be performed according to the following steps [
12]:
- -
determination of the volume of water pumped into the network—based on the measurement of the main water meter—VPUMP,
- -
calculation of the amount of water sold—VSOLD, as the sum of the volume of invoiced water sold based on measurements (VSOLDI) and the volume of invoiced water sold based on lump sum settlements (VSOLDS),
- -
volume of unsold water used for the water company’s own purposes VOP, is defined as the sum of the volume of water consumed by the water company measured—VOPM and the volume of water consumed by the water company unmeasured—VOPU,
- -
calculation of the authorized consumption water volume VAC, as the sum of the volume of water sold VSOLD and the volume of water used for the water company’s own purposes VOP,
- -
volume of water losses VLOSS, is defined as the difference between the volume of water pumped into the water supply network VPUMP, and the volume of authorized consumption of water VAC.
For further calculations, the average daily value of water losses will be used, determined by the formula:
where
VLOSS—the volume of water losses, m3/year.
To compare the losses between individual CWSS, the unit value of water losses in the water supply network was used, determined by the formula:
where
QLOSS u—the unit value of water losses in the water supply network, m3/I⸱d,
I—the number of inhabitants, inhabitant.
2.3. Indicators of the Agglomeration Development Constraints
Based on the value of Q
Ri and Q
P, it is possible to determine the potential increase in the number of inhabitants with the current availability and use of water resources and production capacity of the water treatment plant according to the formula:
where
- -
QRi—the reserve amount of water that can be supplied to the agglomeration under the conditions of the water usage permission (QR1) and with the reduction of the water losses volume (QR2), m3/d,
- -
QP—the potential amount of water that could be supplied to an agglomeration using the water treatment plant production capacity, m3/d,
- -
qu—unit demand for water (for all purposes, per 1 inhabitant), m3/I⸱d.
In order to determine the time for the development of an agglomeration until the available water resources run out or the maximum water production capacity is reached, the population growth rate should be determined on the basis of statistical data from the last 10 years, establishing the average value of the percentage increase in the number of inhabitants according to the formula:
where
- -
I i—the number of inhabitants in the i-th year;
- -
I i+1—the number of inhabitants in the (i + 1)-th year.
The time for the development of agglomeration was determined by the formulae:
This time can be determined only in the case of an increase in the number of inhabitants (the value of the population growth indicator PG > 0).
where
- -
∆PRi—the indicator of the potential increase in the number of inhabitants due to the available water resources reserve (∆PR1) and due to the reduction of the water losses volume (∆PR2), inhabitant,
- -
∆PP—the indicator of the potential increase in the number of inhabitants due to the production capacity of the water treatment plant, inhabitant,
- -
PG—average population growth rate, %/year,
- -
IL—number of inhabitants in the last analyzed year, inhabitants.
2.4. Diversification of Water Intakes
The water intake diversification index can be used to assess the possibilities of agglomeration development by taking into account the number of water intakes. The bigger it is, the more water resources the agglomeration can use in accordance with the limitations of water usage permission and the total production capacity of water treatment plants increases. In the study, the Pielou index was used to assess the diversification of water intakes. It is described by the formula [
28,
29]:
where
- -
ui—share of the i-th intake water production in the total water production of all water intakes in the CWSS,
- -
m—number of water intakes.
The obtained values of the diversification indexes were compared to the classification presented in
Table 2.
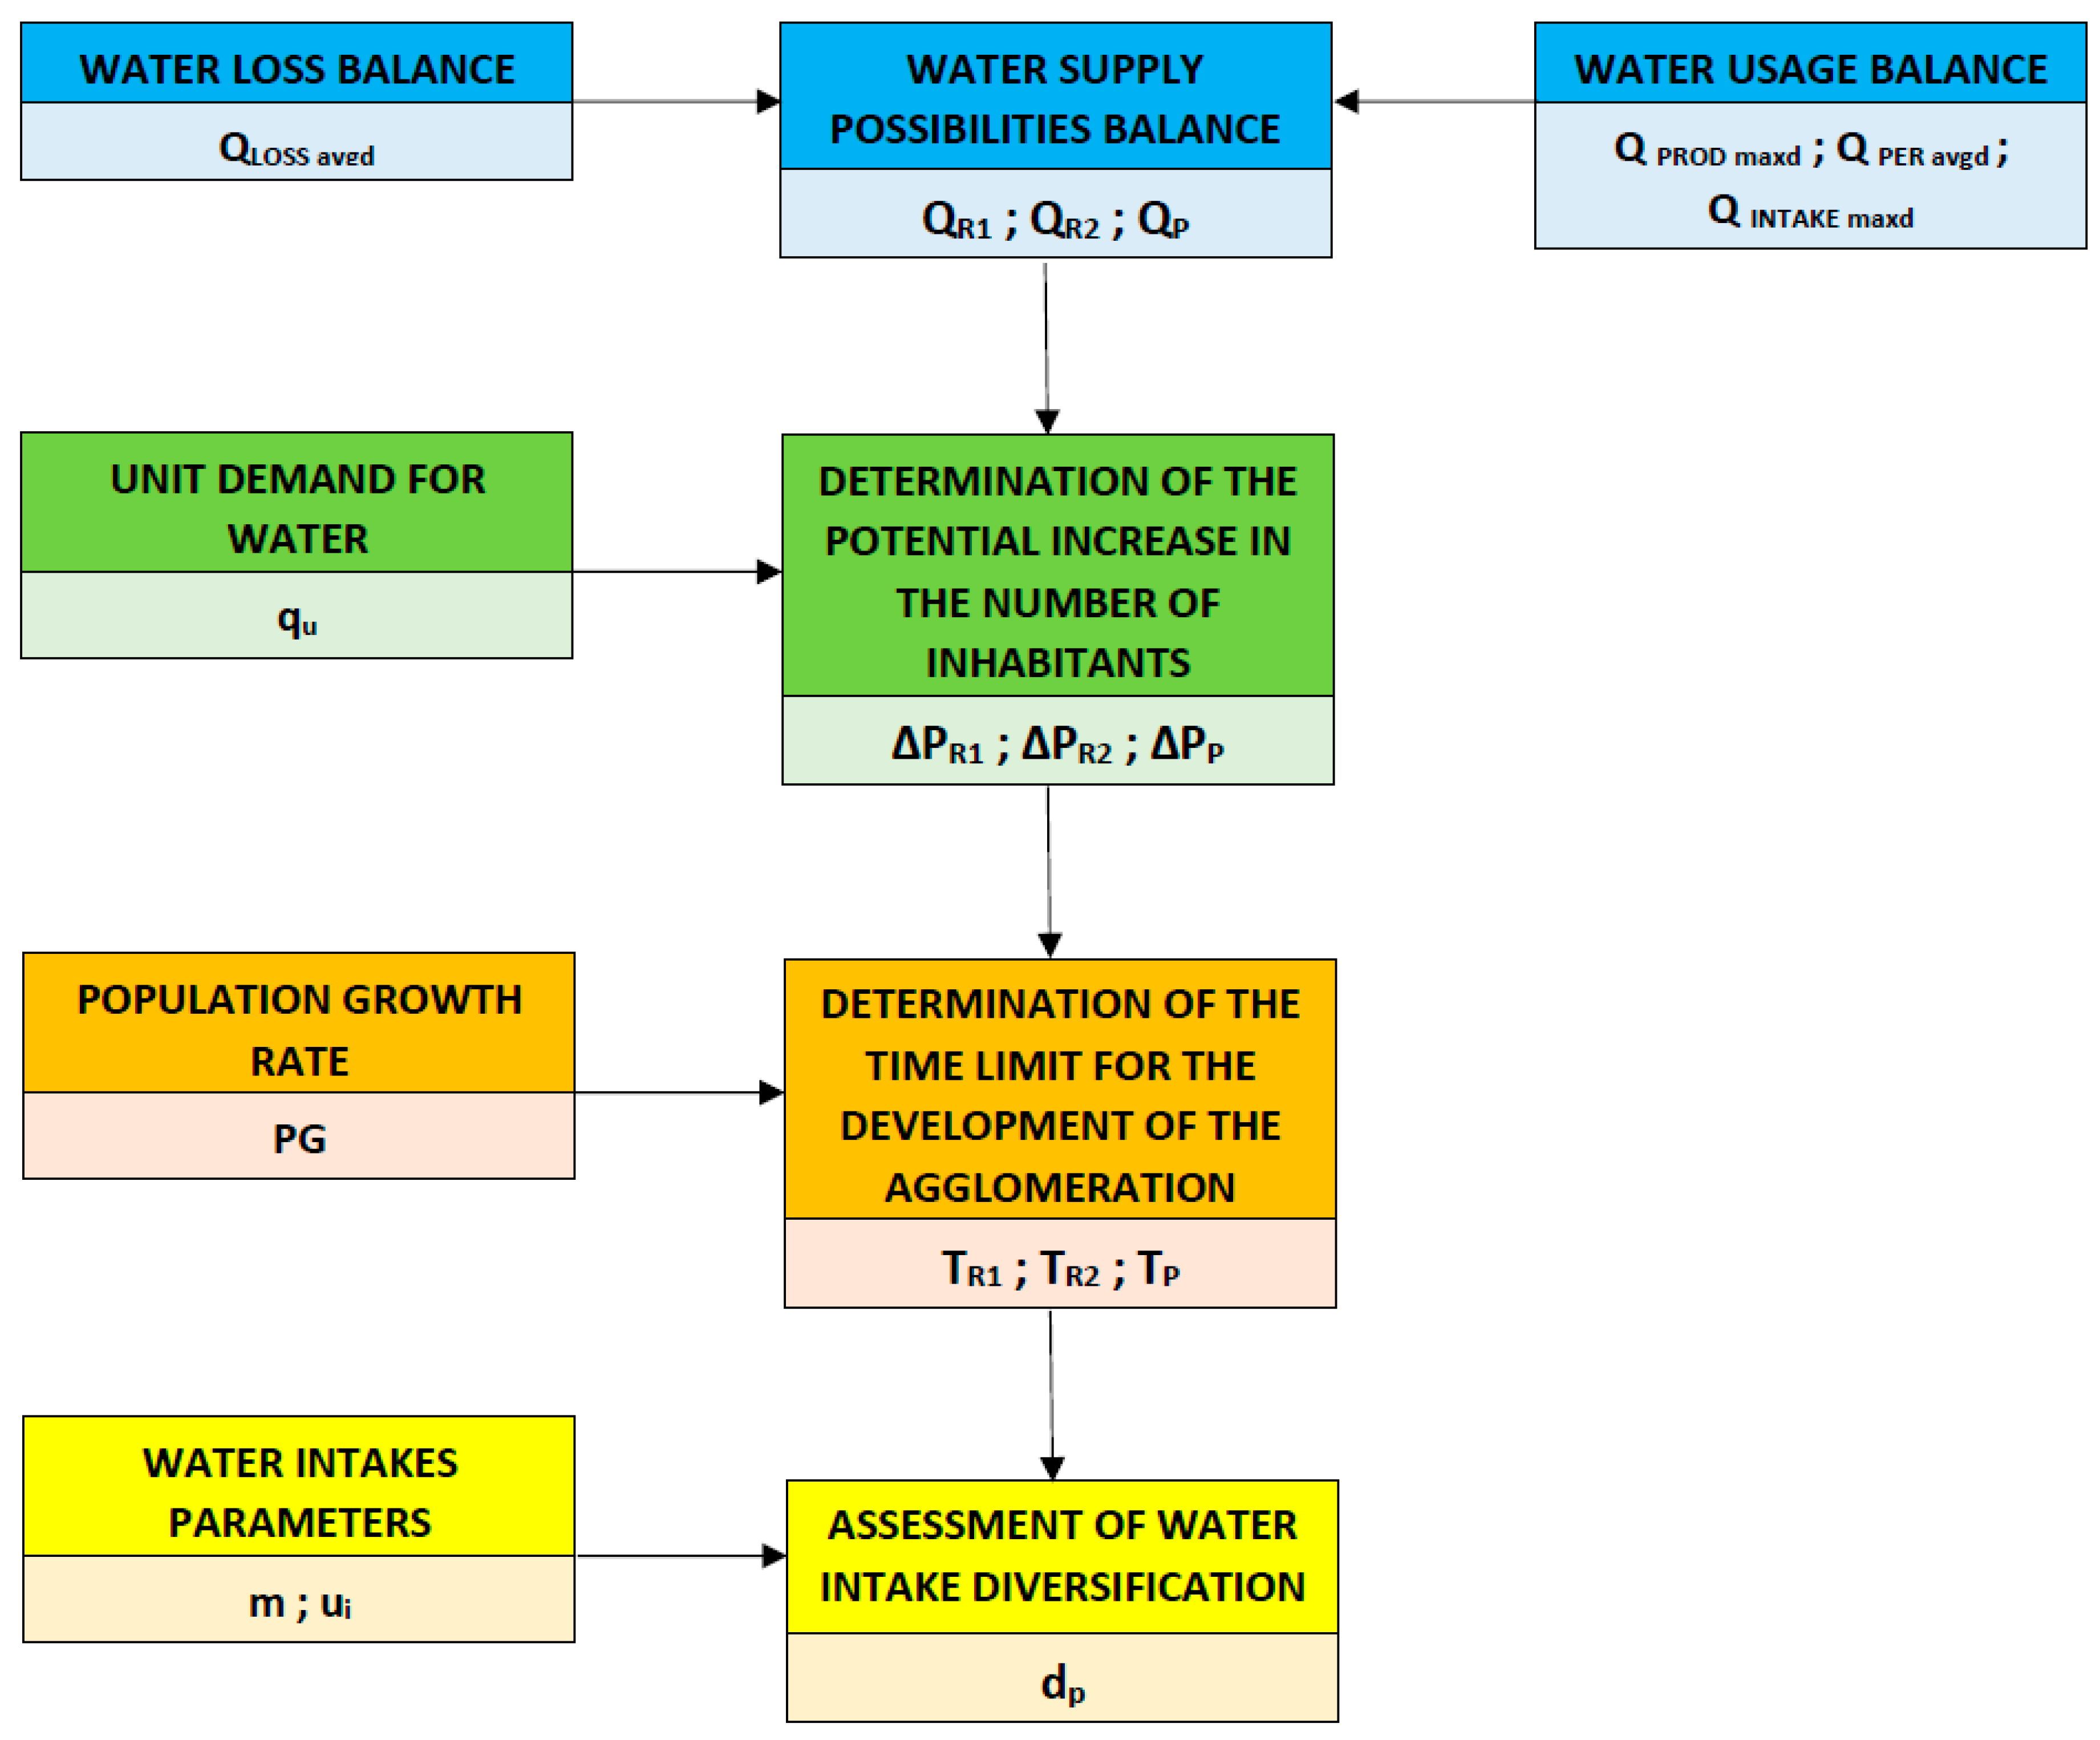
Figure 2 presents the flow chart of the methodology.
3. Results
In the first step, the amount of water losses in the analyzed CWSS was determined on the basis of the IWA balance method. The results of the water loss calculations are presented in
Table 3.
Then, on the basis of operational data provided by water companies, the value of Q
R1, was calculated, i.e., the reserve amount of water that could be supplied to the agglomeration due to the limitation of the water usage permission, Q
R2—the reserve amount of water that could be supplied to the agglomeration with additional reduction of water losses in the water supply network and Q
P i.e., the potential amount of water that can be supplied to the agglomeration using the full production capacity of water treatment plants. These values define the prospects for the development of the agglomeration due to the possibilities of supplying people with water. The balance of the possibilities of supplying the agglomeration with water is presented in
Table 4.
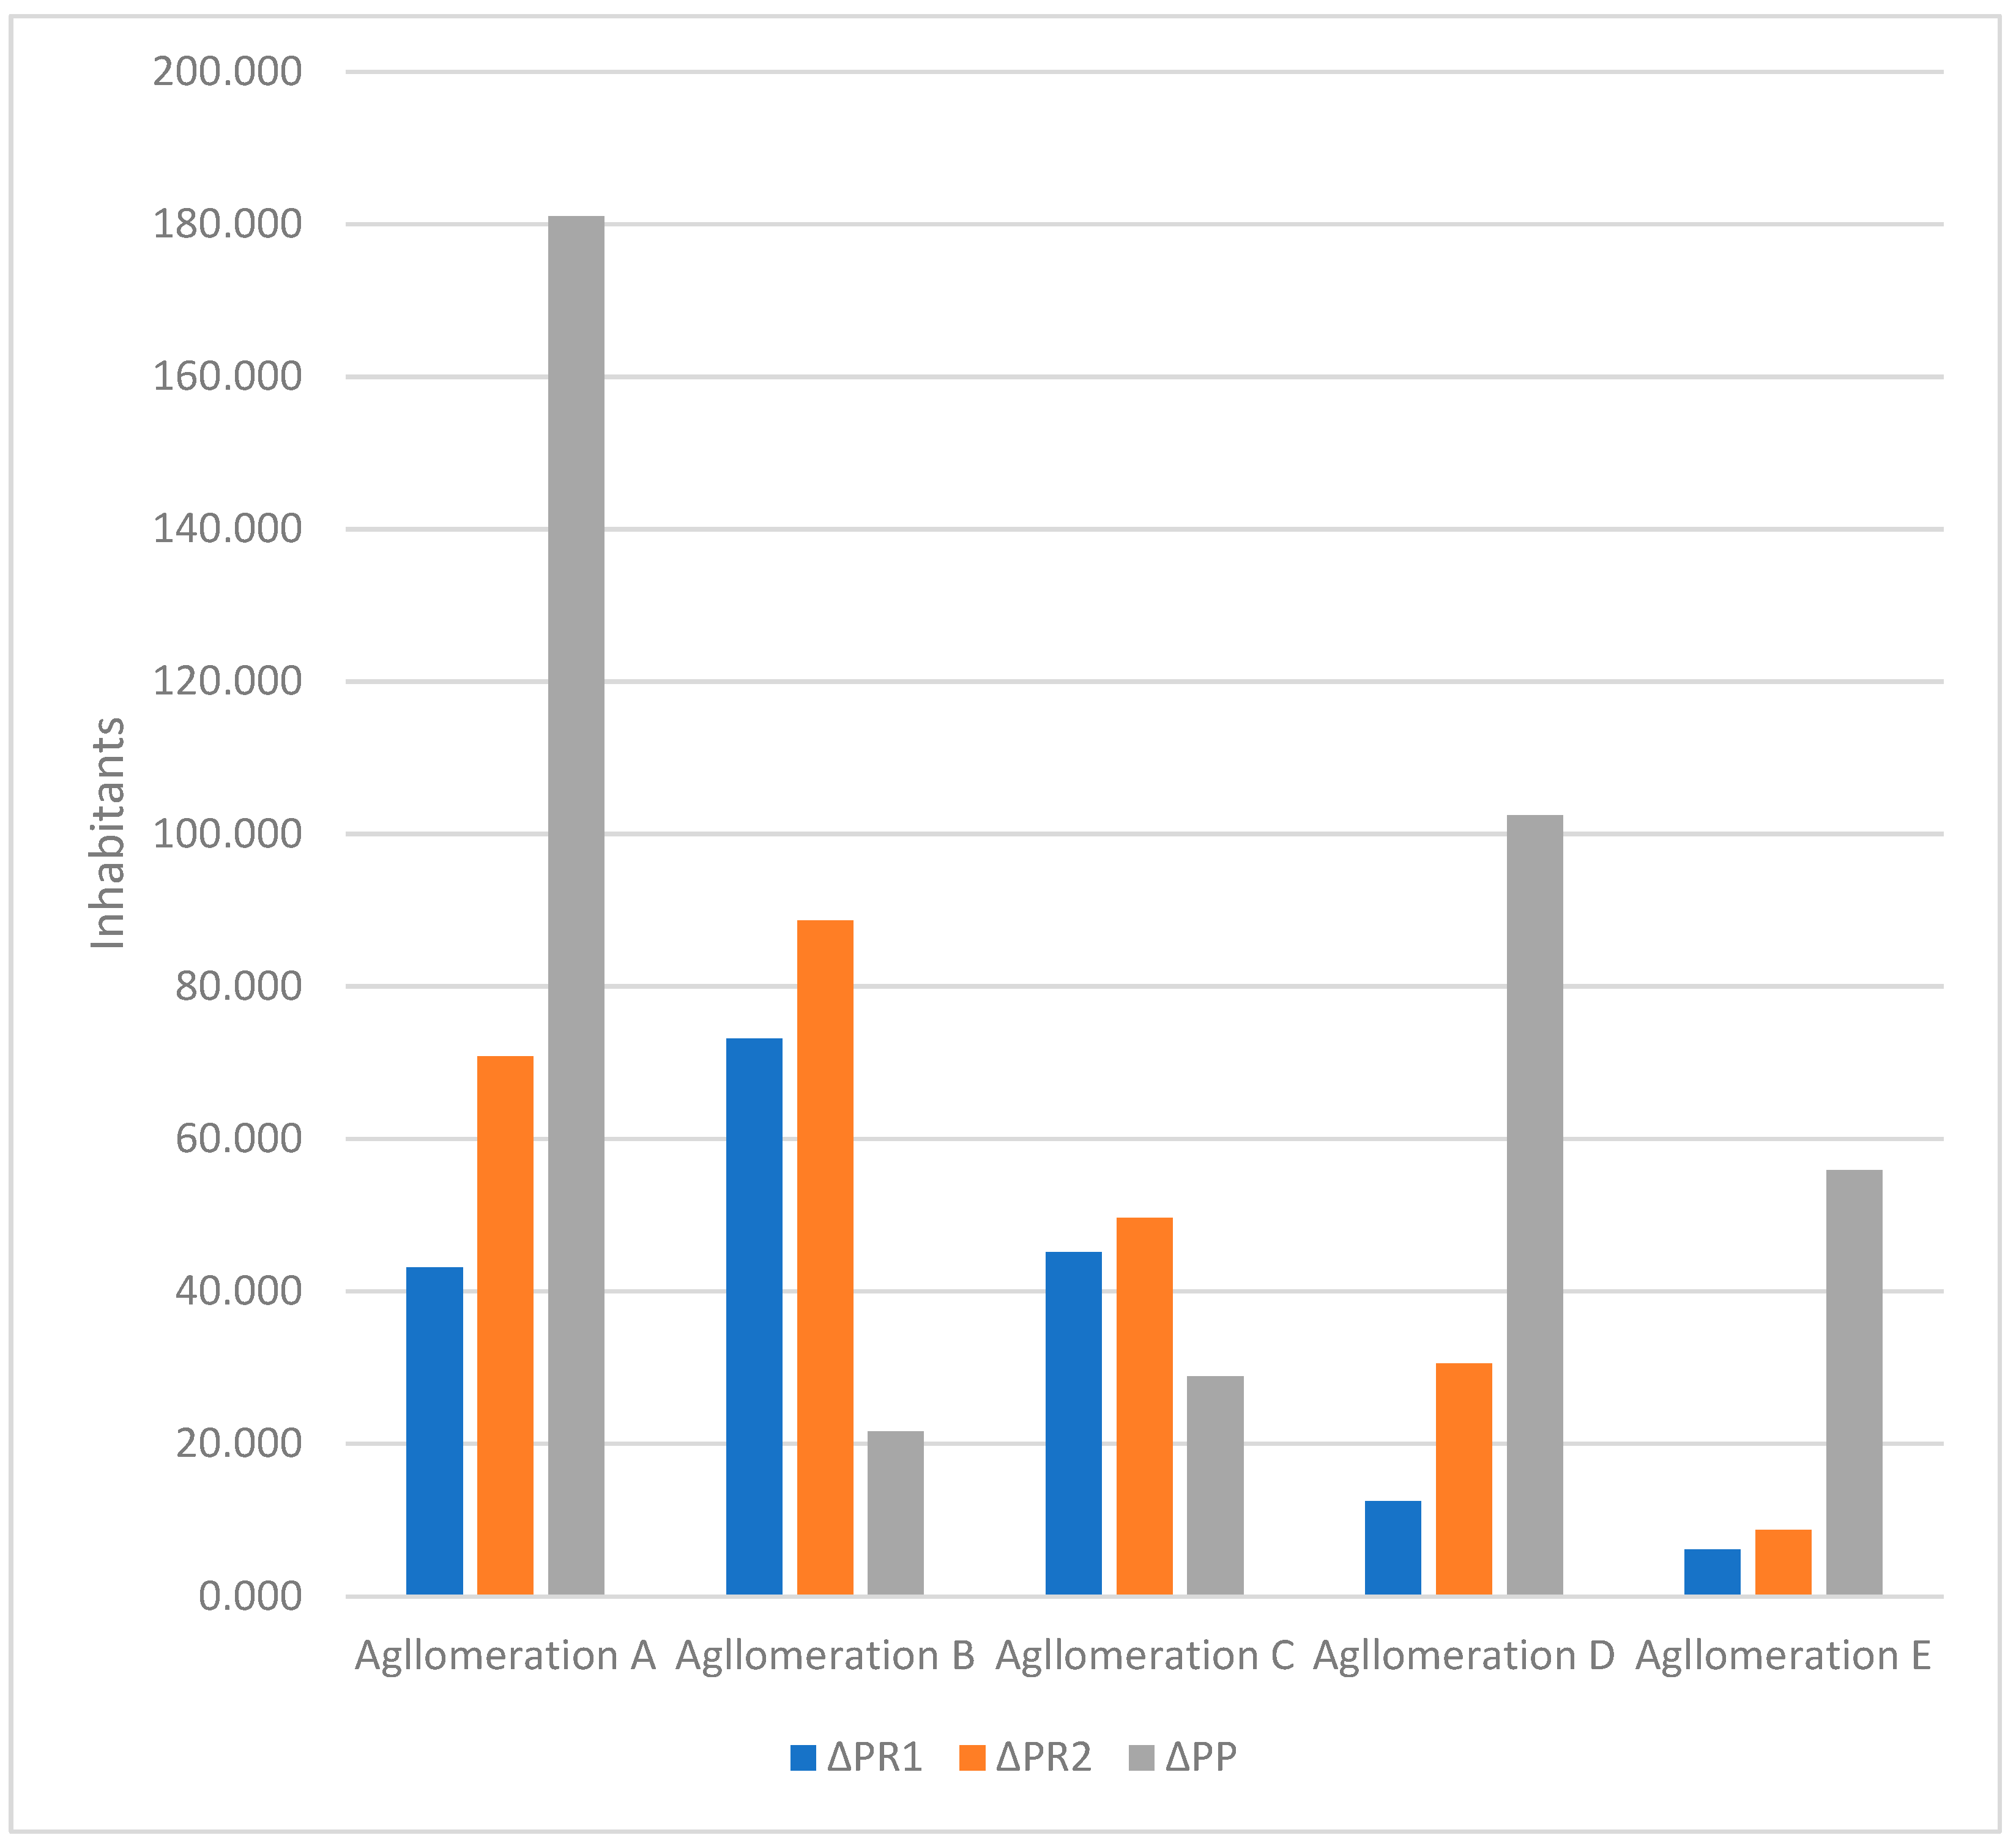
Based on the calculated values of Q
R1, Q
R2, and Q
P the indicators of the potential increase in the number of inhabitants of the analyzed agglomerations limited by the possibility of water supply were calculated in accordance with Equations (6) and (7). The unit demand for water value was adopted as q
u = 0.164 m
3/I∙d as the average value for the analyzed systems. The results of the calculations are presented in
Table 5, and
Figure 3 shows their graphical interpretation.
In the next step, the pace of population growth was determined in accordance with Equation (8) on the basis of statistical data provided by the Polish Central Statistical Office. Then, the time for the development of the agglomeration was calculated, due to maintaining the current conditions of water usage permission, due to additional reduction of water losses in the water supply network, and due to using the full production capacity of water treatment plants in the case of finding alternative water sources to supply the population. The calculations and results are presented in
Table 6.
Table 7 presents the calculations of the Pielou index, on the basis of which the diversification of water intakes of the analyzed agglomerations should be assessed, according to the adopted criteria.
4. Discussion
The obtained results indicate that based on the current conditions of water permits, it should be stated that the possibilities of increasing water abstraction in intake E are running out, and it is possible to supply only about 6000 inhabitants. This intake works close to the set maximum water intake. Agglomeration A, characterized by a constant influx of inhabitants, can accommodate about 43,000 people without the need to build a new intake. This is due to the necessity to maintain the current conditions of the water permit. The production capacity of the intake is much greater, however, due to the need to maintain an intact flow, they cannot be used, as in the case of Agglomerations D and E. The largest reserve of water that can be supplied to the agglomeration, without expanding the infrastructure, is in agglomeration B, which has 3 water intakes. It is found that Agglomerations B and C have an adequate reserve amount of water that can be supplied for the agglomeration under the conditions of the water permit. These agglomerations are also characterized by the lowest potential values of the water reserve that can be supplied with the full production capacity of water treatment plants. In the foreseeable future, Agglomerations B and C should have no problems with water abstraction for water supply purposes. In Agglomeration D, the water reserve can be supplied to residents, while maintaining the water permits’ conditions is approaching the limit value; however, it can be increased more than twofold while reducing water losses in the water supply network, which in this agglomeration, are the largest among those studied.
In Poland, one of the two dominant types of internal migration is migration from villages and small towns to the agglomeration [
37]. This results in a decrease in the population of poviat towns at the expense of voivodeship capital cities. Migration to large cities mainly concerns young people who go to study or work. One of the barriers limiting the admission of new people to the city is the possibility of increasing water production to cover the increased water demand. The analysis shows that it is necessary to create appropriate training and employment opportunities for young people in smaller cities, in order to stop their migration to the largest cities, which have limited possibilities in terms of water supply, as Agglomeration A—which is the main urban center in the region. The lack of an idea to stop the migration to the metropolis in the near future will cause limitations in access to drinking water.
The water loss balance carried out according to IWA [
12,
13] allowed for the determination of unit water losses. The highest unit water losses were calculated for the Agglomeration D, it was 0.037 m
3/M·d. The networks with the lowest loss value were in agglomeration C and E, it was 0.012 m
3/M·d. For all of the studied agglomerations, limiting water losses increases the water reserve that can be supplied to inhabitants. Reducing water losses and its rational use is currently one of the most important tasks of water supply companies. Poland belongs to the group of countries with limited water resources. Especially in Agglomeration D, the most urgent task is to reduce water losses. The water intake in Agglomeration D works close to the set maximum water intake and cannot lose such significant amounts of water. From the point of view of the safety of water supply, losses should be limited to the minimum economically acceptable level, i.e., about 10% [
23,
24]. As shown by previous studies from other cities, such a solution is possible only with an extensive monitoring system of hydraulic parameters and remote reading of water meters [
17,
18]. Actions based on active leakage control should be carried out until the water loss is reduced to an economically satisfactory level [
19,
20,
24]. To achieve this, investments and the purchase of appropriate equipment are necessary.
The issue of estimating the degree of diversification of water resources is crucial in determining the safety of water supply to the city. In two CWSS (agglomerations A and D), there was no diversification of water resources. This situation is very disadvantageous from a safety point of view. The failure of the only intake causes the suspension of water supply to the city. In such a situation, it is necessary to store large amounts of water in water reservoirs and to maintain emergency water sources. For agglomeration A, the value of time limit for the development TR1 = 17 years was also determined, after which, while maintaining the current dynamic pace of the city’s development, the possibilities of water abstraction from this intake will be gone. In the perspective of the next decade, the inclusion of an alternative, surface source of water supply (e.g., transfer of water from the San River) should be considered. The currently operated water intake from the Wisłok River will constitute a barrier to the development of Agglomeration A. Other values of time limit for the development for agglomeration A indicate that with the reduction of water losses in the system, this time may be extended to TR2 = 28 years, while full use of production capacity for the existing infrastructure would allow for the development of the agglomeration for TP = 72 years. A small diversification of water resources characterizes Agglomeration E due to the large difference in the production capacity of the water intakes. Agglomeration B and Agglomeration C have been classified into the category of satisfactory diversification. The long-term strategy for the development of the city’s CWSS should be focused on the possibility to supply water from at least two (and optimally from the point of view of the safety of water supply) or three water intakes, with evenly distributed production capacities.
5. Conclusions
The paper presents the original calculation methods based on the water balance in order to determine the possibilities for the development of urban agglomerations. The production capacity of surface water intakes often significantly exceeds the current water demand. This does not mean, that future, increased demand for water will also be covered from currently exploited sources. The developed method allows to determine the maximum number of inhabitants that can be supplied from the existing water intakes and to determine the time limit for the development of the agglomeration related to the availability of water resources.
Another problem presented in the work was water loss. The IWA water balance approach seems to be optimal from the point of view of developing the concept of water supply and ensuring socio-economic development. Based on the results of the assessment, for five Polish Agglomerations, quantitative restrictions (threats) to the continuity of water supply were defined and the need to look for new water sources was indicated.
Appropriate diversification of water resources significantly improves the safety of water supply. The water supply diversification index is the most favorable when the structure of the water supply is balanced, e.g., shares from two sources are 50% each. The degree of diversification with a smaller number of independent but balanced water intakes may be greater than a greater number of water intakes, but with very diversified shares.
The analysis shown that currently CWSS for Agglomeration A-E fulfill their tasks in the field of water supply. Agglomerations A and D must consider the possibility of supplying water to the city from the second (alternative) water intake in the next few years—studies should begin. Additionally, for agglomeration E, it is recommended to look for another water source.
In conclusion, the presented tools in the form of the potential increase in the number of inhabitants indicators (∆PR, ∆PP) and the time for the development of agglomeration indicators (TR, TP) indicated the directions of water policy development for the analyzed agglomerations, specifying the main problems related to reducing the amount of water losses, appropriate management of the migration policy of the population and the necessity to look for alternative sources of water.
The presented method meets the recommendations of the new Directive of the European Parliament and of the Council (EU) 2020/2184 [
38] in the context of ensuring the safety of water supply to the consumer and reducing water losses in the face of climate change. It can be adapted and used for any water supply system, as well as other systems, e.g., gas, energy, in the context of resource diversification assessment [
39,
40,
41,
42,
43].
Author Contributions
Conceptualization, J.Ż., D.S. and I.P.; methodology, J.Ż., D.S. and I.P.; validation, J.Ż., D.S., I.P., K.B., K.P.-U., B.T.-C. and J.R.; investigation, J.Ż.; resources, J.Ż.; data curation, J.Ż.; writing—original draft preparation, J.Ż, D.S. and I.P.; writing—review and editing, B.T.-C., K.P.-U., K.B. and J.R.; supervision, B.T.-C. and J.R. All authors have read and agreed to the published version of the manuscript.
Funding
This research received no external funding.
Data Availability Statement
The data presented in this study are available on request from the corresponding author.
Conflicts of Interest
The authors declare no conflict of interest.
References
- European Environment Agency (EEA). Water Use in Europe. Available online: https://www.eea.europa.eu/signals/signals-2018-content-list/articles/water-use-in-europe-2014 (accessed on 26 June 2022).
- European Environment Agency (EEA). Use of Freshwater Resources. Available online: https://www.eea.europa.eu/data-and-maps/indicators/use-of-freshwater-resources-2/assessment-3/ (accessed on 26 June 2022).
- Oki, T.; Kanae, S. Global hydrological cycles and world water resources. Science 2006, 313, 1068–1072. [Google Scholar] [CrossRef] [PubMed]
- The Intergovernmental Panel on Climate Change (IPCC). Climate change 2013: The physical science basis. In Contribution of Working Group I to the 5th Assessment Report of the Intergovernmental Panel on Climate Change; Cambridge University Press: Cambridge, UK, 2013. [Google Scholar]
- Xu, H.; Wu, M. Water Availability Indices—A Literature Review; Energy Systems Division, Argonne National Laboratory: Chicago, IL, USA, 2017. [Google Scholar]
- Alcamo, J.; Henrichs, T.; Rösch, T. World Water in 2025. In Global Modeling and Scenario Analysis for the World Commission on Water for the 21st Century; Kassel World Water Series; Center for Environmental Systems Research; University of Kassel: Kassel, Germany, 2000; Volume 2, p. 47. [Google Scholar]
- European Space Agency (ESA). GMES. Available online: https://www.esa.int/About_Us/Ministerial_Council_2012/Global_Monitoring_for_Environment_and_Security_GMES (accessed on 26 June 2022).
- Legal Act: Regulation (EU) No 377/2014 of the European Parliament and of The Council of 3 April 2014 Establishing the Copernicus Programme and Repealing Regulation (EU) No 911/2010. Available online: https://eur-lex.europa.eu/legal-content/EN/TXT/?uri=CELEX%3A32014R0377 (accessed on 1 November 2022).
- Brown, A.; Matlock, M.D. A Review of Water Scarcity Indices and Methodologies; Sustainability Consortium, University of Arkansas: Fayetteville, AR, USA, 2011. [Google Scholar]
- Kunkel, G. Water Loss Control Committee report: Applying worldwide BMPs in water loss control. J. Am. Water Work. Assoc. 2003, 95, 65–79. [Google Scholar]
- McNamee, A. Water audits of public water systems: Maryland’s experience. In Technical Session on Promoting Progressive Approaches for Water Loss Control, Proceedings of the Distribution & Plant Operations Conference, Nashville, TN, USA, 7–10 September 2002; American Water Works Association (AWWA): Denver, CO, USA, 2002. [Google Scholar]
- Lambert, A.; Hirner, W. The Blue Pages. The IWA information source on drinking water issues. In Losses from Water Supply Systems: Standard Terminology and Recommended Performance Measures; IWA: London, UK, 2000. [Google Scholar]
- Alegre, H.; Hirner, W.; Baptista, J.; Parena, R. Performance Indicators for Water Supply Services. Manual of Best Practice Series; IWA Publishing: London, UK, 2000. [Google Scholar]
- Feng, L.H.; Huang, C.F. A Risk Assessment Model of Water Shortage Based on Information Diffusion Technology and its Application in Analyzing Carrying Capacity of Water Resources. Water Resour. Manag. 2008, 22, 621–633. [Google Scholar] [CrossRef]
- Badaluta-Minda, C.; Herbei, M.V. Assesment of water resources using landsat satellite imagery. Environ. Eng. Manag. J. 2021, 20, 301–308. [Google Scholar]
- Oberascher, M.; Moderl, M.; Sitzenfrei, R. Water loss management in small municipalities: The situation in Tyrol. Water 2020, 12, 3446. [Google Scholar] [CrossRef]
- Ahopelto, S.; Vahala, R. Cost-Benefit analysis of leakage reduction methods in water supply networks. Water 2020, 12, 195. [Google Scholar] [CrossRef]
- Mathye, R.P.; Scholz, M.; Nyende-Byakika, S. Appraisal of socio-technical water loss control strategies using cost-benefit analysis in a water supply network. Water 2022, 14, 1789. [Google Scholar] [CrossRef]
- Mosetlhe, T.C.; Hamam, Y.; Du, S.; Monacelli, E. Appraising the impact pressure control on leakage flow in water distribution networks. Water 2021, 13, 2617. [Google Scholar] [CrossRef]
- Choi, S.H.; Shin, B.; Shin, E. Managing apparent loss and real loss from the nexus perspective using system dynamics. Water 2022, 14, 231. [Google Scholar] [CrossRef]
- Lepeska, T.; Wojkowski, J.; Wałęga, A.; Młyński, D.; Radecki-Pawlik, A. Urbanization—Its hidden impact on water losses: Prądnik River basin, Lesser Poland. Water 2020, 12, 1958. [Google Scholar] [CrossRef]
- Buie, L.M. Accounting for lost water. J. Am. Water Work. Assoc. 2000, 92, 67–71. [Google Scholar] [CrossRef]
- Żywiec, J.; Tchórzewska-Cieslak, B. Water loss analysis as an element of operation management of water supply system. J. Konbin 2019, 49, 55–77. [Google Scholar] [CrossRef]
- Serafeim, A.V.; Kokosalakis, G.; Deidda, R.; Karathanasi, I.; Langousis, A. Probabilistic Minimum Night Flow Estimation in Water Distribution Networks and Comparison with the Water Balance Approach: Large-Scale Application to the City Center of Patras in Western Greece. Water 2022, 14, 98. [Google Scholar] [CrossRef]
- Shushu, U.P.; Komakech, H.C.; Dodoo-Arhin, D.; Ferras, D.; Lal Kansal, M. Managing non-revenue water in Mwanza, Tanzania: A fast-growing sub-Saharan African city. Sci. Afr. 2021, 12, e00830. [Google Scholar] [CrossRef]
- Monteiro, L.; Cristina, R.; Covas, D. Water and energy efficiency assessment in urban green spaces. Energies 2021, 14, 5490. [Google Scholar] [CrossRef]
- AL-Washali, T.; Sharma, S.; Lupoja, R.; AL-Nozaily, F.; Haidera, M.; Kennedy, M. Assessment of water losses in distribution networks: Methods, applications, uncertainties, and implications in intermittent supply. Resour. Conserv. Recycl. 2020, 152, 104515. [Google Scholar] [CrossRef]
- Boryczko, K.; Rak, J. Bezpieczeństwo Systemów Wodociągowych. Dywersyfikacja Zasobów Wody; Oficyna Wydawnicza Politechniki Rzeszowskiej: Rzeszów, Poland, 2017. (In Polish) [Google Scholar]
- Boryczko, K.; Rak, J. Method for Assessment of Water Supply Diversification. Resources 2020, 9, 87. [Google Scholar] [CrossRef]
- Rak, J.; Boryczko, K. Diversification of water supply. In Proceedings of the 2nd International Conference on Science and Technology Current Issues in Water Distribution and Treatment, CIWT 2017, Brenna, Poland, 31 May–2 June 2017. [Google Scholar]
- Rak, J.; Boryczko, K. Assessment of water supply diversification using the Pielou index. In Environmental Engineering V, Proceedings of the 5th National Congress of Environmental Engineering, Lublin, Poland, 29 May–1 June 2016; CRC Press: Boca Raton, FL, USA, 2017. [Google Scholar]
- Rak, J.; Włoch, A. Models of level diversification assessment of water supply subsystem. Undergr. Infrastruct. Urban Areas 2014, 3, 237–2441. [Google Scholar]
- Jensen, O.; Wu, H. Urban water security indicators: Development and pilot. Environ. Sci. Policy 2018, 83, 33–45. [Google Scholar] [CrossRef]
- Legal Act: Ustawa z Dnia 20 Lipca 2017 r.-Prawo Wodne (Dz.U. 2017 poz. 1566). (In Polish). Available online: https://isap.sejm.gov.pl/isap.nsf/DocDetails.xsp?id=WDU20170001566URL (accessed on 1 November 2022).
- Kostrzewa, H. Weryfikacja Kryteriów i Wielkości Przepływu Nienaruszalnego dla Rzek Polski; Materiały Badawcze, Seria: Gospodarka Wodna i Ochrona Wód; IMGW: Warszawa, Poland, 1977. (In Polish) [Google Scholar]
- Operacz, A. Wyznaczenie wartości przepływu nienaruszalnego w inwestycjach związanych z wodami powierzchniowymi według metody Kostrzewy. Ekon. Sr. 2015, 52, 100–109. (In Polish) [Google Scholar]
- Polish Government Migration Services. Available online: www.migracje.gov.pl (accessed on 1 November 2022).
- Legal Act: Directive (EU) 2020/2184 of The European Parliament and of The Council of 16 December 2020 on the Quality of Water Intended for Human Consumption. Available online: https://eur-lex.europa.eu/eli/dir/2020/2184/oj (accessed on 1 November 2022).
- Nabavi-Pelesaraei, A.; Mohammadkashi, N.; Naderloo, L.; Abbasi, M.; Chau, K.W. Principal of environmental life cycle assessment for medical waste during COVID-19 outbreak to support sustainable development goals. Sci. Total Environ. 2022, 827, 154416. [Google Scholar] [CrossRef]
- Mostashari-Rad, F.; Ghasemi-Mobtaker, H.; Taki, M.; Ghahderijani, M.; Saber, Z.; Chau, K.W.; Nabavi-Pelesaraei, A. Data supporting midpoint-weighting life cycle assessment and energy forms of cumulative exergy demand for horticultural crops. Data Brief 2020, 33, 106490. [Google Scholar] [CrossRef] [PubMed]
- Khanali, M.; Ghasemi-Mobtaker, H.; Varmazyar, H.; Mohammadkashi, N.; Chau, K.; Nabavi-Pelesaraei, A. Applying novel eco-exergoenvironmental toxicity index to select the best irrigation system of sunflower production. Energy 2022, 250, 123822. [Google Scholar] [CrossRef]
- Nabavi-Pelesaraei, A.; Rafiee, S.; Hosseini-Fashami, F.; Chau, K.-W. Artificial neural networks and adaptive neuro-fuzzy inference system in energy modeling of agricultural products. In Predictive Modelling for Energy Management and Power Systems Engineering; Elsevier: Amsterdam, The Netherlands, 2020; pp. 299–334. [Google Scholar] [CrossRef]
- Nabavi-Pelesaraei, A.; Rafiee, S.; Mohammadkashi, N.; Chau, K.-W.; Mostashari-Rad, F. Principle of Life Cycle Assessment and Cumulative Exergy Demand for Biodiesel Production: Farm-To-Combustion Approach. Green Energy Technol. 2022, 127–169. [Google Scholar] [CrossRef]
| Disclaimer/Publisher’s Note: The statements, opinions and data contained in all publications are solely those of the individual author(s) and contributor(s) and not of MDPI and/or the editor(s). MDPI and/or the editor(s) disclaim responsibility for any injury to people or property resulting from any ideas, methods, instructions or products referred to in the content. |
© 2023 by the authors. Licensee MDPI, Basel, Switzerland. This article is an open access article distributed under the terms and conditions of the Creative Commons Attribution (CC BY) license (https://creativecommons.org/licenses/by/4.0/).


 ,
, 


