Abstract
This paper presents the application of a Multi-Criteria Decision Making (MCDM) method for the ranking of smart cities. During the construction of the MCDM techniques, the importance of the decision-making approach for the linear ordering of 66 Polish cities with powiat status was presented. The Technique for Order of Preference by Similarity to Ideal Solution (TOPSIS) was used for evaluation. The method has been verified by applying it to measure urban smartness. The TOPSIS method allowed compilation for a final ranking, taking into account publicly available indicators of the smart cities concept. The work uses data from the Local Data Bank Polish Central Statistical Office (LDB). The author conducted a literature review of research papers related to smart cities and MCDM methods dated from 2010 to 2020. Based on calculations using the TOPSIS method, the results obtained that the city of Krakow has the highest value to become a smart city.
1. Introduction
Becoming a smart city is an important task in the transition path and urban strategy of many cities. Local governments constantly introduce innovation to cities by encouraging international enterprises to deploy renewable energy projects, green energy services and products in the municipalities. Urban leaders need the knowledge of how to attract the enterprises implies. Public managers understand the multi-criteria decision problem that the enterprises face when deciding about location in this city or another. Considering how important the energy sector is for sustainable smart cities, this paper focuses on identification the significant location for energy enterprises when making the choice for new places to offer the services.
The development of smart cities is monitored from an international comparative perspective. There is a lot of cyclical rankings surveying cities in different aspects and located on all continents. It is used a lot of various indicators measuring the primary areas selected by its creators, according to the assumed theoretical concept. Rankings of smart cities serve to support the development of urbanized areas by indicating the areas which require some intervention and by comparing with other cities in order to search for good practices. There are a lot of smart city rankings [1,2,3,4,5,6]. The most popular is the Smart City Index of Institute for Management Development World Competitiveness Centre [7].
The work analyzed the s66 Polish cities with powiat status in terms of the urban smartness indicators. The goal manuscript is to present a ranking of smart cities based on the MCDM method using 21 indicators. Smart cities are currently one of the most important models of development. Firstly, the manuscript identified publications on the topic of smart cities and MCDM based on a literature review. Secondly, the article attempts to organize the methods and main indicators in the field of smart cities and MCDM. The papers available on the Web of Science, Springer, Scopus, IEEE and Elsevier databases have been reviewed. The inductive thinking in the theoretical part, as well as the TOPSIS technique in the empirical part, were used in the paper. The manuscript is an attempt to answer the research questions: how can we measure urban smartness and which variables can we use, which cities have the highest level of urban smartness, how does classification of cities present in terms of smart cities? The selected MCDM technique allowed to indicated the smartness and least smart cities with respect to six main Giffinger [8] dimensions: economy, environment, transport, social capital, quality of life and public management. Finally, 21 smart city indicators that are available in public statistics were proposed in the context of a diagnosis of Polish cities.
2. Literature Review
The first study concerning the issue of the smart city concept is dated 1992. It was “The Technopolis Phenomenon: Smart Cities, Fast Systems, Global Networks” by David V. Gibsona, George Kozmetsky, Raymond W. Smilor [9]. Overall, bibliometrics is a powerful tool for analyzing knowledge domains and revealing their cognitive-epistemological structure. Furthermore, a lot of scientists analyzed the trends for academic debate and research. Mora et al. [10] revealed the five emerging development path of smart cities that each thematic cluster represents and the strategic principles such as: experimental (smart cities as testbeds for IoT solutions), ubiquitous (the Korean experience of ubiquitous cities), corporate (IBM and the corporate smart city model), European (smart city for a low-carbon economy) and holistic (digital, intelligent, smart). Additionally, Perez et al. [11] explored the important research topics in the top journals, e.g., intelligent cities, sustainable cities, e-Government, digital transformation, knowledge-based city, ubiquitous city. Based on the co-keyword network analysis, Guo et al. [12] distinguished the main research areas in the domain of smart cities: smart development, telecommunications and computer science, a smart strategy for sustainable development as well as public administration.
Over the last three decades, a lot of manuscripts that deal with smart cities in the Web of Science, Scopus and Elsevier databases (more than 52,000) have been prepared. Figure 1 shows the number of papers on the topic of smart cities selected by the Web of Science, Scopus and Elsevier databases from 2000 to 2020 (Table A1). The trend line presents a steady increase from 2012. Additionally, there is a significantly increasing trend of growth each year. There are more than eighteen thousand publications on the topic of smart cities in the Scopus database from 2018.
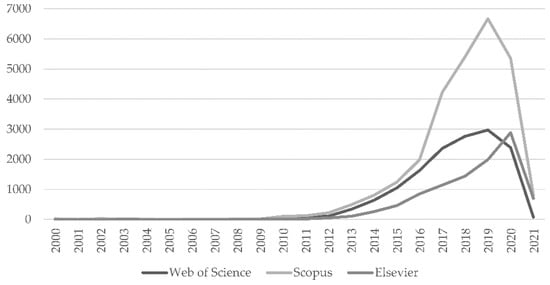
Figure 1.
The publications on the topic smart city between 2000 and 2020 (status: 1 February 2021) (Note: author’s elaboration.).
The field of operations research develops procedures and optimization approach to help the business sector analyze and solve complex problems in the multiple and opposite criteria or objectives. Decision-making is a common human practice that requires choosing the best alternative among many. MCDM techniques are considered the modern part of operations research with a multi-objective optimization problem. One of the first publications on MCDM was performed by Benjamin Franklin in his work on moral algebra [13]. Since the 1950s, MCDM has been practiced by theoretical and empirical scientists to test the capability of mathematical modeling of the decision-making approach. The MCDM methods are applied in the following sectors: economics, logistics, industrial engineering, environmental science, urban studies and public policy.
Many researchers have relied on MCDM or Multi-Criteria Decision Analysis (MCDA). The top journals referred to MCDA and smart cities based in a number of publications are: “Sustainability,” “Energies,” “Symmetry” and “Applied Sciences.” A total of 162 scientific articles concerning the application of MCDA or MCDM techniques to selected decision problems in the field of smart cities from 2010 to 2020 worldwide were analyzed (Figure 2). The authors studied MCDM trends and applications in smart cities. During the analysis, the most frequent MCDA techniques associated with smart cities were identified: AHP, TOPSIS and SAW. The other MCDM techniques include ANP, DEA, DEMATEL, VIKOR, ELECTRE, PROMETHEE, MACBETH and MULTIMOORA. MCDM techniques enable evaluating alternatives in many criteria. MCDM techniques are classified as pairwise comparison-based methods (AHP, ANP), distance-based methods (TOPSIS, VIKOR) and outranking methods (ELECTRE, PROMETHEE) [14]. Table 1 presents characteristics of the most frequently applied MCDM techniques.
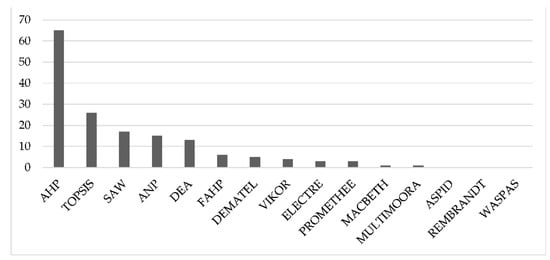
Figure 2.
The popularity of MCDA technics in smart cities (status: February 2, 2021) (Source: author’s work).

Table 1.
Characteristic of MCDM techniques.
The author conducted the literature review in the Web of Science and Elsevier databases. Table 2 presents the results of this analysis. The research targeted relevant manuscripts that focused on MCDM techniques in the field of smart cities and were published in 2016–2020. The summary indicates the methods, aims of each article, objects and main indicators of the research.
Table 2.
Papers relevant to MCDM and smart cities.
Based on the literature review, the author identified three ranges of smart cities evaluation: (i) the urban smartness performance, (ii) the urban smartness performance of different types and (iii) the urban smartness performance of different objects. The interest in the problem of assessment is high and constant. Most papers focused on the studies related to urban smartness performance [15]. The urban smartness performance obtains urban efficiency, urban sustainability performance [16], urban environmental efficiency [17,18] and low-carbon ecological city evaluation [19,20,21,22]. The urban smartness performance studies of different types include three perspectives: well-being performance, urban security performance and carbon emission performance [23]. The urban smartness performance studies of different objects refer to the following categories: building performance [24], household performance, enterprise performance [25], national performance [13] and regional performance [16,18].
The urban smartness condition assessment is carried out using evaluation indicators or key factors [35]. The evaluation indicators are divided into input (capital, labor, energy, air pollution) and output variables (gross domestic product, GDP). The key factors obtain population, area, urbanization, travel mode and climate. Moutinho et al. [21] argue that high GDP over CO2 emissions does not imply a high eco-efficiency score. Carli et al. [16] investigate of possibilities maximizing the efficiency and effectiveness of the actions for the sustainable development of energy, water and environmental systems of the whole city.
Marsal-Llacuna [25] suggests that smartness means contributing to sustainable development and resilience. Smartness in the smart city is when the three pillars of sustainability (environmental, economic and social) are safeguarded; while, urban resilience is being improved by making use of ICT infrastructure ICT [36,37,38]. Smartness in the smart city equals urban smartness, which is a combination of three components, such as sustainability, urban resilience and ICT infrastructure (Figure 3). The smart city value chain by Dameri [39] is the basis of urban smartness. The smart city value chain obtains (i) sustainability (carbon neutral, clean air and water); (ii) quality of life (safe, diverse, leisure, convenience); (iii) smart growth (knowledge, innovation, employment, investments). Furthermore, Trindade et al. [40] analyzed scientific studies focusing on both environmental sustainability and smart city concepts to understand the relationship between these two.
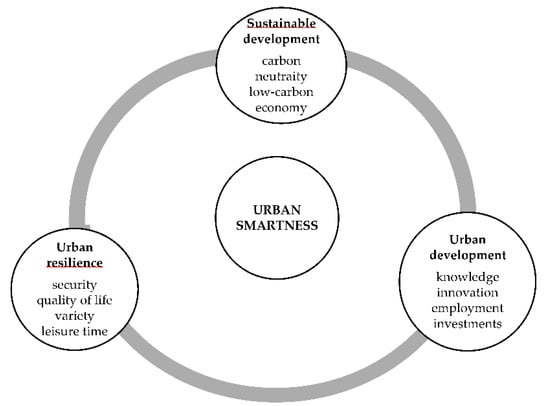
Figure 3.
Components of urban smartness (Note: author’s elaboration on the based [25,39]).
The literature contains many procedures for testing a city’s performance, such as The Smart City Index [7], The Innovation Cities Index [1], The Global Cities Index [2], The Green City Index [41], The City Blueprint [42] and The Sustainable Cities Index [43]. Numerous organizations and institutions have prepared city rankings, in particular, relating to the life quality, such as Institute for Urban Strategies [44], Mercer [3], Monocle [45] and Numbeo [46]. Conger has prepared an overview of the indexing methodology [35]. Table 3 presents the characteristics of the most popular smart city rankings. Dameri argues that the process of evaluating sustainable cities is a complex task [39]. Furthermore, Sacirovic et al. introduced a transformation between the present and the vision of a sustainable city in the future [47].
Table 3.
The characteristics of the most popular smart city rankings.
Some cities in Central and Eastern Europe could not become smart cities because there are a lot of problems with social inclusion. Excluding certain social groups (the poorly-off, the elderly, the disabled) is a threat resulting from the implementation of the smart city concept. Stigmatization of Roma has deeply rooted historical backgrounds. The integration of Roma will be difficult to implement because stigmatization remains in the collective mentality [48,49].
3. Research Method
The presented research focused on the ranking of smart cities. The scope of research has three steps: selection, evaluation and classification (Figure 4). The test procedure consists of several successive stages: (1) the selection of indicators and objects; (2) the construction normalized decision matrix; (3) the calculation of criterion weights; (4) linear ordering using TOPSIS method; (5) ranking and clustering of cities; (6) conclusions and finding the recommendations.
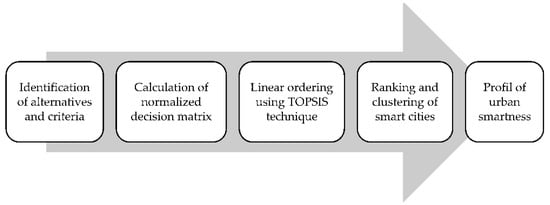
Figure 4.
The research design (Source: author’s work).
According to the review, the TOPSIS technique one of the most commonly applied to decision problems in field of smart cities and was used in this work. On the basis of decision theory, the first method of linear ordering using the pattern and anti-patterner was proposed by C.L. Hwang and K. Yoon in 1981 under the name TOPSIS. The test steps using the classic TOPSIS procedure can be concluded as follows [50]:
Step 1. The multiple attributes were selected in accordance with substantive and statistical considerations. Then attributes were divided into stimulants (S) and destimulants (D).
Step 2. Based on the multiple attributes, the decision matrix was constructed:
where represents the value of the -th attribute ( for the -th objects (cities, ) and .
Step 3. The value of the attributes was normalized in order to obtain their comparability in accordance with the formula:
Step 4. The normalized (vector-based) decision matrix was constructed:
where means the normalized value of the -th attribute ( for the -th alternatives (cities, ).
Step 5. The weight coefficients for indicators were determined based on expert opinion [51], where:
where means the criterion weight.
Step 6. The value of the normalized indicators was weighed based on the following formula:
Step 7. Based on the weight of each attribute, the weighted normalized decision matrix was calculated:
where means the weighted and normalized value of the -th attribute ( for the -th alternatives (cities, ).
Step 8. The model coordinates of the ideal () and anti-ideal () were established [52]:
where ; .
Step 9. Calculated the positive distance and the negative distance of each assessed object as follows:
where .
Step 10. The values of the relative closeness coefficient () of each object were calculated:
where 0 1, .
Step 11. The modification of the relative closeness coefficient () in the classic TOPSIS procedure was applied to simplify the smart city levels according to the following formula:
Step 12. The ranking of smart cities was prepared.
Step 13. The classification was determined on the basis of the relative closeness coefficient () as well as an arithmetic mean () and a standard deviation () with typological classes specified through the creation of four separate groups of similar objects:
Class I: if the relative closeness coefficient is
Class II: if the relative closeness coefficient is <
Class III: if the relative closeness coefficient is <
Class IV: if the relative closeness coefficient is < .
4. Research Materials
The starting point for the multi-criteria analysis of smart cities in this work was the assumptions and indicators proposed by the authors of the report “Smart cities. Ranking of European medium-size cities” [53] as well as ISO 37120:2014 standard [8,54,55]. This report developed a hierarchical structure including six characteristics of the smart city, 31 factors describing the key characteristics and 74 indicators enabling the evaluation of cities. Additionally, ISO 37120:2014 standard involves 46 core and 54 supporting indicators in seventeen thematic groups. The important step of the investigation was the initial verification of statistical data in Poland. On the basis of an analysis of publicly available database (LBD) of Statistics Poland, 21 indicators between 2017 and 2019. Table 4 provides the dimensions of the 21 indicators included in the studies.
Table 4.
Dimensions and indictors.
The ranking of smart cities is complex and multifaced [34]. Firstly, cities consist of many inter-related systems, which impact each other. Secondly, cities answer to different stakeholders, who may have conflict ideas.
The following analysis includes cities from all Polish voivodships. Table 5 provides a list of the general overview of the analyzed cities. The urban profile involves the following features, such as a voivodship, city population, city land area, population density and own income. Warszawa is the city with the largest land area, population and own income (517 km2; 1790,658 persons; 7307.64 PLN), but Swietochlowice has the highest population density (3723 persons/km2). Moreover, Chełm is the city with the least own income (2277.28 PLN). Figure 5 visualizes localization analyzed Polish cities.
Table 5.
The selected cities profile in 2019.
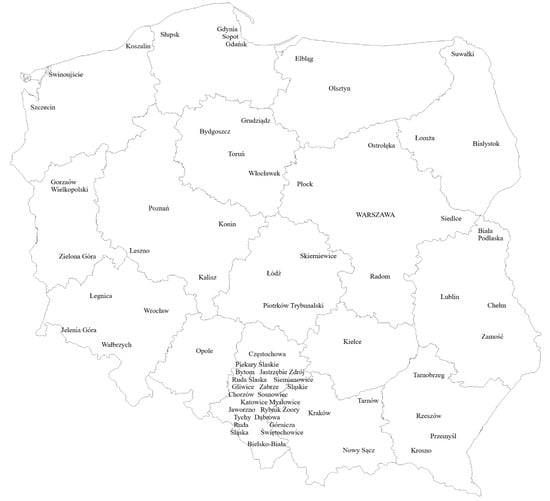
Figure 5.
Localization of the analyzed cities in Poland (Source: author’s elaboration).
At this step, the workflow of the TOPSIS method used in recommending a cities worthy of being a smart city in Poland is based on 66 alternatives in six dimensions, and 21criteria have been analyzed. Table 6 presents characteristics of the TOPSIS method in the context of alternatives and criteria.
Table 6.
Steps of the TOPSIS method.
5. Research Results
The research began with computing the basic statistics for smart city indicators by measuring the position (the arithmetic mean) and variability (the standard deviation, the variation coefficient). The entities entered in the REGON register are the most varied indicator (510.81%). Moreover, the net enrolment rate provides the least information (8.89%). Table 7 provides a list of the general statistics of each criterium. There are six stimulants (X1, X6, X7, X9, X10, X16), and the other criteria are destimulants.
Table 7.
The basic statistics of criteria.
Next, a decision matrix () was developed. Then, the normalized decision matrix (R) was developed based on a normalized vector (r). The weight factors () were determined, and the weighted normalized decision matrix (V) was developed.
The results of the calculated relative closeness coefficient () and the ranking of smart cities in relation to the basic level of urban smartness are summarized in Table 8. Likewise, the positive distance and the negative distance are presented in this table. The values of the relative closeness coefficient are in the range from 0.09087 to 0.82156, while the modification of the relative closeness coefficient () is between 0.00182 and 0.01648.
Table 8.
The ranking of smart cities.
The next step of investigation was the preparation six partial rankings for each dimension (economy, environment, transport, social capital, quality of life, public management), as well as the identification of the best and the worst cities in each dimension. The last stage was the comparative analysis and clustering smart cities.
6. Discussion
The relative closeness coefficient () was defined for each smart city. As a result, Krakow (KR) was found to be a desirable city among these alternatives, overtaking its nearest competitor, Wroclaw (WR). These cities are capitals of voivodship. Ostroleka (OS) ranked 65, leaving Konin (KN) last. These cities have power stations (Patnow-Adamow-Konin with a generation capacity of 1647 MW; Energa-681 MW) and consume a lot of water (8054.4; 17,607.9 m3). Figure 6 visualizes and summarizes of analyzed Polish cities for the relative closeness coefficient.
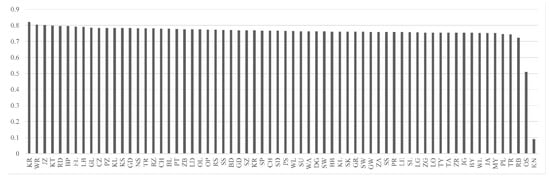
Figure 6.
The visualization of relative closeness coefficient (Source: author’s work.).
The preparation of six partial rankings for each dimension (economy, environment, transport, social capital, quality of life and public management) allowed the identification of the best and the worst cities in each dimension. The top cities in the economic dimension are Gliwice (GL, 0.827266), Poznań (PZ, 0.539027) and Lublin (LB, 0.515385). Moreover, Swinoujscie (SW, 0.8712), Koszalin (KS, 0.772187) and Grudziadz (GR, 0.724292) are the best cities in the transportation dimension. The high-level achieve Rzeszow (RZ, 0.879274), Katowice (KT, 0.760275) and Lublin (LB, 0.74743) in social capital. On the other hand, Elbląg (EL), Bytom (BY, 0.209898) and Piotrkow Trybunalski (PT, 0.083115) are the worst cities. Besides, the top cities in the management are Żory (ZR, 0.775757), Jastrzebie Zdroj (JZ, 0.774897) and Świętochłowice (ST, 0.768276). Bytom (BY, 0.33052), Zabrze (ZB, 0.317148) and Zielona Góra (ZG, 0.019516) are the worst cities. Table 9 provides a list of the best and the worst alternatives in each dimension of a smart city.
Table 9.
The best and the worst cities in each dimensions of smart city.
Hence, the overall assessment of smart cities is sufficient, and they performed poorly in promoting a low-carbon city and sustainable development. Moreover, the environment is an extremely important criterium (0.817). The best cities in this context are Jastrzebie Zdroj (JZ, 0.989288) and Biala Podlaska (BP, 0.922096). Additionally, the quality of life is of low importance among criteria, and the average achieves only 0.281. The best cities in this context are Chorzow (0.904502, CH) and Siemianowice Slaskie (0.470556, SS). Figure 7 presents dimensions of smart cities for the best city and the worst city as well as the average values.
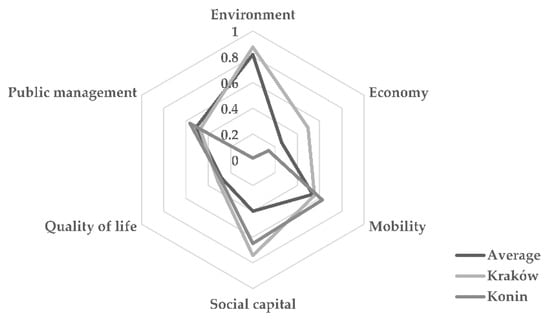
Figure 7.
Dimensions of smart cities (Source: author’s work).
According to the value of the relative closeness coefficient, a four-level classification of smart cities based on the assessment of urban smartness can be derived. Table 10 presents the classification of smart cities by their level of urban smartness. From the table, it can be seen that Krakow (KR), Wroclaw (WR) and Jastrzebia Gora (JZ) have reached the status excellent with regard to their urban smartness. The majority of smart cities (34) were in good status. Dabrowa Gornicza (DG), Swietochlowice (ST), Bielsko-Biala (BB), Kalisz (KL), Skierniewice (SK), Grudziadz (GR), Swinoujscie (SW), Gorzow Wielkopolski (GW), Zamosc (ZM), Sosnowiec (SO), Przemysl (PR) and Leszno (LE) belong to group III (medium class of urban smartness level), which is between and . In total, 17 cities are in the low class, and is below . The four-cluster is empty.
Table 10.
Classification of smart cities in terms of urban smartness level.
Research and experiments contribute to the creation of urban ranking and comparative analysis of smart cities worldwide. Sikora-Fernandez [57] assessed 16 Polish cities in which the leader was Warsaw, and the second place was taken by Wroclaw. On the other hand, Lodz and Zielona Gora were the cities with the lowest scores in this classification. Similarly, Lewandowska and Szymanska [58] analyzed and evaluated changes in 65 Polish cities based on selected characteristics of sustainable development. Additionally, Masik et al. [59] analyzed Polish smart city strategies in the field of new urban development policies. Stanković et al. [32] investigated Central and Eastern European cities in the field of social, economic and environmental aspects of urban life and provided the ranking cities. However, Moutinho et al. [21] evaluated the urban performance of German and French cities in terms of eco-efficiency. Gokhan and Ceren [29] assessed the dimensions of 44 smart cities around the world. On the other hand, Feizi et al. [31] analyzed the transportation performance of cities in the U.S. in the context of network performance, traffic safety, environmental impact and physical activity. Zhu et al. [28] explored the potential links between urban smartness and resilience for Chinese cities. Luo et al. [27] measured the centrality together with the factors influencing centrality using data for the population flow of cities in the Yangtze River Economic Belt. Further, Rana et al. [26] prioritized barriers to recognize the most important barrier category and ranking of specific barriers within the categories to the development of Indian smart cities.
It is worth emphasizing and university of the TOPSIS method in the context of urban analysis. Studies conducted in this paper present that the chosen method is an effective tool for the assessment of urban smartness. Nevertheless, it can be extending its application to other city components, such as transport, economy and energy. The presented multi-criteria analysis of Polish cities shows that the TOPSIS method allows multifaced assessment of cities, identification of their strengths and weaknesses in the field of defined criteria, and compilation of statistical and comparative analysis.
7. Conclusions
Using TOPSIS, the method of multi-criteria decision support selected for this work, six partial and one final ranking in terms of 21 criteria of the smart city concept were compiled for the 66 Polish cities. To sum up, the basis of literature studies and multi-criteria analysis of selected Polish cities in the field of urban smartness, it can be concluded that:
- -
- Smart city is an important research direction, which is confirmed by the growing publication number.
- -
- Multi-criteria decision support methods can be an effective and relatively simple tool for analysis and assessment of cities, useful for development strategy design.
- -
- MCDM techniques are one of the important tools in solving decision-making problems in the context of urban smartness, especially urban efficiency, sustainability performance, environmental efficiency and low-carbon ecological city evaluation.
- -
- TOPSIS, AHP and DEA are the most popular MCDM techniques in terms of the smart city.
- -
- The result of the conducted multi-criteria analysis using the TOPSIS technique was a ranking of the smart cities based on the urban smartness. This method can recommend cities that are worthy of being smart cities. Krakow (Alternative CR) has the highest value in the feasibility of being a smart city-based city that is equal to 0.82156. Krakow is the best of the assessed cities for location enterprises and projects. Konin was ranked last.
- -
- The proposed model can be used to analyze the potential of cities in the field of contemporary urban development, such as compact cities and sustainable cities.
- -
- It was limitations in the implementation phase with the availability of necessary statistical data. Furthermore, multi-criteria analysis using TOPSIS makes to take into account local conditions because of the possibility of defining the importance of criteria and the preference function.
Directions for future research include the TOPSIS method using other algorithms (normalization, weights). The author intends to develop rankings with other popular MDCM techniques, for example, DEA or AHP. Additionally, the efficiency of urban transport and urban resistance are the most important parts of smart cities. The research procedure can be used to assess cities in other countries and other urban dimensions. The proposed criteria are popular indicators that can be adapted to national statistics.
Funding
This study was realized during the scientific project WZ/WIZ/-INZ/2/2019 and supported by the Polish Ministry of Education and Science.
Institutional Review Board Statement
Not applicable.
Informed Consent Statement
Not applicable.
Data Availability Statement
Local Data Bank Polish Central Statistical Office. Available online: www.bdl.stat.gov.pl (accessed on 14 April 2020).
Acknowledgments
The author thanks everyone who provided constructive advice that helped to improve this paper.
Conflicts of Interest
The authors have declared that no competing interest exist.
Appendix A
Table A1.
The publications on the topic of the smart city between 1991 and 2021.
Table A1.
The publications on the topic of the smart city between 1991 and 2021.
| Web of Science | Scopus | Elsevier | Web of Science | Scopus | Elsevier | ||
|---|---|---|---|---|---|---|---|
| 1991 | 1 | 0 | 0 | 2007 | 1 | 1 | 4 |
| 1992 | 0 | 0 | 2 | 2008 | 3 | 6 | 4 |
| 1993 | 1 | 0 | 0 | 2009 | 8 | 19 | 4 |
| 1994 | 0 | 0 | 0 | 2010 | 18 | 101 | 21 |
| 1995 | 0 | 0 | 0 | 2011 | 60 | 124 | 17 |
| 1996 | 0 | 0 | 1 | 2012 | 109 | 219 | 52 |
| 1997 | 0 | 1 | 0 | 2013 | 339 | 488 | 105 |
| 1998 | 0 | 6 | 3 | 2014 | 639 | 805 | 261 |
| 1999 | 4 | 19 | 1 | 2015 | 1046 | 1238 | 461 |
| 2000 | 1 | 23 | 1 | 2016 | 1626 | 1983 | 850 |
| 2001 | 1 | 3 | 1 | 2017 | 2363 | 4229 | 1142 |
| 2002 | 1 | 29 | 1 | 2018 | 2762 | 5408 | 1440 |
| 2003 | 0 | 3 | 6 | 2019 | 2972 | 6669 | 1989 |
| 2004 | 1 | 1 | 5 | 2020 | 2387 | 5355 | 2884 |
| 2005 | 0 | 3 | 0 | 2021 | 75 | 812 | 698 |
| 2006 | 3 | 4 | 2 | Total | 14,421 | 27,549 | 9955 |
Note: author’s elaboration.
References
- World’s Most Innovative Cities: Preview—Innovation Cities Index 2020–2021 from 2THINKNOW. Available online: www.innovation-cities.com/worlds-most-innovative-cities-preview-innovation-cities-index-2020-from-2thinknow/19288/ (accessed on 19 September 2020).
- Kearney, A.T. Which Global Cities are Performing Best Today, Which Have the Best Long-Term Potential, and Make a “Smart City”? 2019. Available online: www.atkearney.com/documents/10192/8178456/Global+Cities+2016.pdf/8139cd44-c760-4a93-ad7d-11c5d347451a (accessed on 17 May 2020).
- Mercer. Vienna Tops Mercer’s 19th Quality of Living Rankings, London 2019. Available online: www.mercer.com/newsroom/2019-quality-of-living-survey.html (accessed on 16 April 2020).
- EasyPark. Smart Cities Index 2019. Available online: www.easyparkgroup.com/smart-cities-index/ (accessed on 5 April 2020).
- Berrone, P.; Ricart, J.E. IESE Cities in Motion Index 2020, Business School University of Navarra. Available online: www.media.iese.edu/research/pdfs/ST-0542-E.pdf (accessed on 5 September 2020).
- Economist Intelligence Unit. Hot Spots 2025. Benchmarking the Future Competitiveness of Cities. Available online: www.citigroup.com/citi/citiforcities/pdfs/hotspots2025.pdf (accessed on 13 January 2021).
- Institute for Management Development World Competitiveness Centre. Smart City Index. Available online: www.imd.org/wcc/world-competitiveness-center-ranking/smart-city-index-2020 (accessed on 10 January 2021).
- Fox, M.S. The semantics of populations: A city indicator perspective. J. Web Semant. 2018, 48, 48–65. [Google Scholar] [CrossRef]
- Anthopoulos, L.G. The Smart City in Practice. Public Adm. Inf. Technol. 2017, 22, 47–185. [Google Scholar] [CrossRef]
- Mora, L.; Deakin, M.; Reid, A. Combining co-citation clustering and text-based analysis to reveal the main development paths of smart cities. Technol. Forecast. Soc. Chang. 2019, 142, 56–69. [Google Scholar] [CrossRef]
- Pérez, L.; Oltra-Badenes, R.; Gutiérrez, J.O.; Gil-Gómez, H. A Bibliometric Diagnosis and Analysis about Smart Cities. Sustainability 2020, 12, 6357. [Google Scholar] [CrossRef]
- Guo, Y.-M.; Huang, Z.-L.; Guo, J.; Li, H.; Guo, X.-R.; Nkeli, M.J. Bibliometric Analysis on Smart Cities Research. Sustainability 2019, 11, 3606. [Google Scholar] [CrossRef]
- Porro, O.; Pardo-Bosch, F.; Agell, N.; Sánchez, M. Understanding Location Decisions of Energy Multinational Enterprises within the European Smart Cities’ Context: An Integrated AHP and Extended Fuzzy Linguistic TOPSIS Method. Energies 2020, 13, 2415. [Google Scholar] [CrossRef]
- Kaya, I.; Çolak, M.; Terzi, F. Use of MCDM techniques for energy policy and decision-making problems: A review. Int. J. Energy Res. 2018, 42, 2344–2372. [Google Scholar] [CrossRef]
- Liu, C.; Zhou, Z.; Liu, Q.; Xie, R.; Zeng, X. Can a low-carbon development path achieve win-win development: Evidence from China’s low-carbon pilot policy. Mitig. Adapt. Strat. Glob. Chang. 2020, 25, 1199–1219. [Google Scholar] [CrossRef]
- Carli, R.; Dotoli, M.; Pellegrino, R. Multi-criteria decision-making for sustainable metropolitan cities assessment. J. Environ. Manag. 2018, 226, 46–61. [Google Scholar] [CrossRef]
- Ma, J.; Zhang, Z.; Lu, C.; Xue, B. Could the Construction of Sustainable Development Pilot Zones Improve the Urban Environment Efficiency in China? Discret. Dyn. Nat. Soc. 2020, 2020, 1–9. [Google Scholar] [CrossRef]
- Geng, Y.; Zhang, H. Coordination assessment of environment and urbanization: Hunan case. Environ. Monit. Assess. 2020, 192, 1–18. [Google Scholar] [CrossRef]
- Pang, B.; Fang, C. TOPSIS-based measurement and analysis on dynamics of smart low-carbon development for major Chinese cities. J. Landsc. Res. 2016, 8, 51–58. [Google Scholar] [CrossRef]
- Su, M.; Li, R.; Lu, W.; Chen, C.; Chen, B.; Yang, Z. Evaluation of a Low-Carbon City: Method and Application. Entropy 2013, 15, 1171–1185. [Google Scholar] [CrossRef]
- Moutinho, V.; Madaleno, M.; Robaina, M.; Villar, J. Advanced scoring method of eco-efficiency in European cities. Environ. Sci. Pollut. Res. 2017, 25, 1637–1654. [Google Scholar] [CrossRef]
- Fang, C.; Pang, B.; Liu, H. Quantitative Study on the Dynamic Mechanism of Smart Low-Carbon City Development in China. Sustainability 2016, 8, 507. [Google Scholar] [CrossRef]
- Wang, S.; Gao, S.; Huang, Y.; Shi, C. Spatiotemporal evolution of urban carbon emission performance in China and prediction of future trends. J. Geogr. Sci. 2020, 30, 757–774. [Google Scholar] [CrossRef]
- Lombardi, P.; Abastante, F.; Moghadam, S.T.; Toniolo, J. Multicriteria Spatial Decision Support Systems for Future Urban Energy Retrofitting Scenarios. Sustainability 2017, 9, 1252. [Google Scholar] [CrossRef]
- Marsal-Llacuna, M.L. Measuring the Standardized Definition of “smart city”: A Proposal on Global Metrics to Set the Terms of Reference for Urban “smartness”. In Computational Science and Its Applications: Lecture Notes in Computer Science, Proceedings of the 15th International Conference on Computational Science and Its Applications—ICCSA, Banff, AB, Canada, 22–25 June 2015; Springer Science & Business Media: Berlin, Germany, 2004. [Google Scholar]
- Rana, N.P.; Luthra, S.; Mangla, S.K.; Islam, R.; Roderick, S.; Dwivedi, Y.K. Barriers to the Development of Smart Cities in Indian Context. Inf. Syst. Front. 2019, 21, 503–525. [Google Scholar] [CrossRef]
- Luo, J.; Chen, S.; Sun, X.; Zhu, Y.; Zeng, J.; Chen, G. Analysis of city centrality based on entropy weight TOPSIS and population mobility: A case study of cities in the Yangtze River Economic Belt. J. Geogr. Sci. 2020, 30, 515–534. [Google Scholar] [CrossRef]
- Zhu, S.; Li, D.; Feng, H. Is smart city resilient? Evidence from China. Sustain. Cities Soc. 2019, 50, 101636. [Google Scholar] [CrossRef]
- Gokhan, O.; Ceren, E. Evaluation of smart and sustainable cities through a hybrid MDCM approach based on ANP and TOPSIS technique. Heliyon 2020, 6, e05052. [Google Scholar] [CrossRef]
- Shi, H.; Tsai, S.-B.; Lin, X.; Zhang, T. How to Evaluate Smart Cities’ Construction? A Comparison of Chinese Smart City Evaluation Methods Based on PSF. Sustainability 2017, 10, 37. [Google Scholar] [CrossRef]
- Feizi, A.; Joo, S.; Kwigizile, V.; Oh, J.-S. A pervasive framework toward sustainability and smart-growth: Assessing multifaceted transportation performance measures for smart cities. J. Transp. Health 2020, 19, 100956. [Google Scholar] [CrossRef]
- Stanković, J.; Džunić, M.; Džunić, Ž.; Marinković, S. A multi-criteria evaluation of the European cities’ smart performance: Economic, social and environmental aspects. J. Econ. Bus. 2017, 35, 519–550. [Google Scholar] [CrossRef]
- Song, T.; Cai, J.; Yang, Z.; Chen, M.; Lin, J. Urban metabolic efficiencies and elasticities of Chinese cities. Chin. Geogr. Sci. 2016, 26, 715–730. [Google Scholar] [CrossRef]
- Tariq, M.A.U.R.; Faumatu, A.; Hussein, M.; Shahid, M.L.U.R.; Muttil, N. Smart City-Ranking of Major Australian Cities to Achieve a Smarter Future. Sustainability 2020, 12, 2797. [Google Scholar] [CrossRef]
- Conger, B.W. On livability, liveability and the limited utility of quality-of-life ranking. Sch. Public Policy 2015, 7, 1–8. Available online: www.policyschool.ca/wp-content/uploads/2016/03/livability-conger.pdf (accessed on 5 April 2020).
- Hajduk, S. The Smartness Profile of Selected European Cities in Urban Management—A Comparison Analysis. J. Bus. Econ. Manag. 2019, 19, 797–812. [Google Scholar] [CrossRef]
- Hajduk, S. Using multivariate statistical methods to assess the urban smartness on the example of selected European cities. PLoS ONE 2020, 15, e0240260. [Google Scholar] [CrossRef]
- Hajduk, S. Instruments of Spatial Management in the Context of Sustainability—A Multi-Dimensional Comparative Analysis of the Regional Cities. Annu. Set Environ. Prot. 2018, 20, 1219–1233. [Google Scholar]
- Dameri, R.P. Urban Smart Dashboard Measuring Smart City Performance. In Smart City Implementation. Creating Economic and Public Value in Innovation Urban Systems; Springer: Cham, Switzerland, 2017; pp. 67–84. [Google Scholar] [CrossRef]
- Trindade, E.P.; Hinnig, M.P.F.; Da Costa, E.M.; Marques, J.S.; Bastos, R.C.; Yigitcanlar, T. Sustainable development of smart cities: A systematic review of the literature. J. Open Innov. Technol. Mark. Complex. 2017, 3, 11. [Google Scholar] [CrossRef]
- Siemens. European Green City Index 2019. Available online: www.siemens.com/entry/cc/features/greencityindex_international/all/en/pdf/report_en.pdf (accessed on 10 April 2020).
- Feingold, D.; Koop, S.; Van Leeuwen, K. The City Blueprint Approach: Urban Water Management and Governance in Cities in the U.S. Environ. Manag. 2018, 61, 9–23. [Google Scholar] [CrossRef]
- ARCADIS. Sustainable Cities Index: Putting People at the Heart of City Sustainability 2018. Available online: www.arcadis.com (accessed on 15 March 2020).
- Institute for Urban Strategies. Global Power City Index. The Mori Memorial Foundation, London-New York-Paris 2019. Available online: www.mori-m-foundation.or.jp/pdf/GPCI2019_en.pdf (accessed on 14 April 2020).
- Monocle. Top Ranking for Quality of Life 2019. Available online: www.wien.gv.at/english/politics/international/competition/monocle-quality-of-life-survey.html (accessed on 19 May 2020).
- Numbeo. Quality of Life Index 2019. Available online: www.numbeo.com/quality-of-life/rankings.jsp (accessed on 6 April 2020).
- Sacirovic, S.; Ketin, S.; Vignjevic, N. Eco-industrial zones in the context of sustainability development of urban areas. Environ. Sci. Pollut. Res. 2018, 26, 24346–24356. [Google Scholar] [CrossRef]
- Creţan, R.; Málovics, G.; Méreiné-Berki, B. On the perpetuation and contestation of racial stigma: Urban Roma in a disadvantaged neighbourhood of Szeged. Geogr. Pannonica 2020, 24, 294–310. [Google Scholar] [CrossRef]
- Nicula, A.-S.; Boțan, C.N.; Gligor, V.; Cociș, E.-A. Celebrating the Great Union through Smart Digital Solutions: Lessons from Alba Iulia, Romania. J. Urban Hist. 2020. [Google Scholar] [CrossRef]
- Hwang, C.-L.; Yoon, K. Methods for Multiple Attribute Decision Making. Lect. Notes Econ. Math. Syst. 1981, 186, 58–191. [Google Scholar] [CrossRef]
- Halicka, K.; Bialystok University of Technology. Technology Selection Using the TOPSIS Method. Foresight STI Gov. 2020, 14, 85–96. [Google Scholar] [CrossRef]
- Ban, A.I.; Ban, O.I.; Bogdan, V.; Popa, D.C.S.; Tuse, D. Performance Evaluation Model of Romanian Manufacturing Listed Companies by Fuzzy AHP and TOPSIS. Technol. Econ. Dev. Econ. 2020, 26, 808–836. [Google Scholar] [CrossRef]
- Giffinger, R.; Fertner, C.; Kramar, H.; Kalasek, R.; Pichler-Milanoić, N.; Meijers, E. Smart Cities. Ranking of European Medium-Size Cities, Centrel of Regional Science; University of Technology: Vienna, Austria, 2007; Available online: www.smart-cities.eu/download/smart_cities_final_report.pdf (accessed on 29 December 2020).
- Fox, M.S. The role of ontologies in publishing and analyzing city indicators. Comput. Environ. Urban Syst. 2015, 54, 266–279. [Google Scholar] [CrossRef]
- ISO37120:2014. Sustainable development of communities—Indicators for city services and quality of life. Available online: https://www.iso.org/obp/ui/#iso:std:iso:37120:ed-1:v1:en (accessed on 21 November 2020).
- Local Data Bank Polish Central Statistical Office. Available online: www.bdl.stat.gov.pl (accessed on 9 February 2021).
- Sikora-Fernandez, D. Smarter cities in post-socialist country: Example of Poland. Cities 2018, 78, 52–59. [Google Scholar] [CrossRef]
- Lewandowska, A.; Szymańska, D. Ecologisation of Polish cities in the light of selected parameters of sustainable development. Sustain. Cities Soc. 2021, 64, 102538. [Google Scholar] [CrossRef]
- Masik, G.; Sagan, I.; Scott, J.W. Smart City strategies and new urban development policies in the Polish context. Cities 2021, 108, 102970. [Google Scholar] [CrossRef]


Publisher’s Note: MDPI stays neutral with regard to jurisdictional claims in published maps and institutional affiliations. |
© 2021 by the author. Licensee MDPI, Basel, Switzerland. This article is an open access article distributed under the terms and conditions of the Creative Commons Attribution (CC BY) license (https://creativecommons.org/licenses/by/4.0/).