Risk Assessment of Lack of Water Supply Using the Hydraulic Model of the Water Supply
Abstract
1. Introduction
2. Materials and Methods
2.1. Characteristics of the Research Object
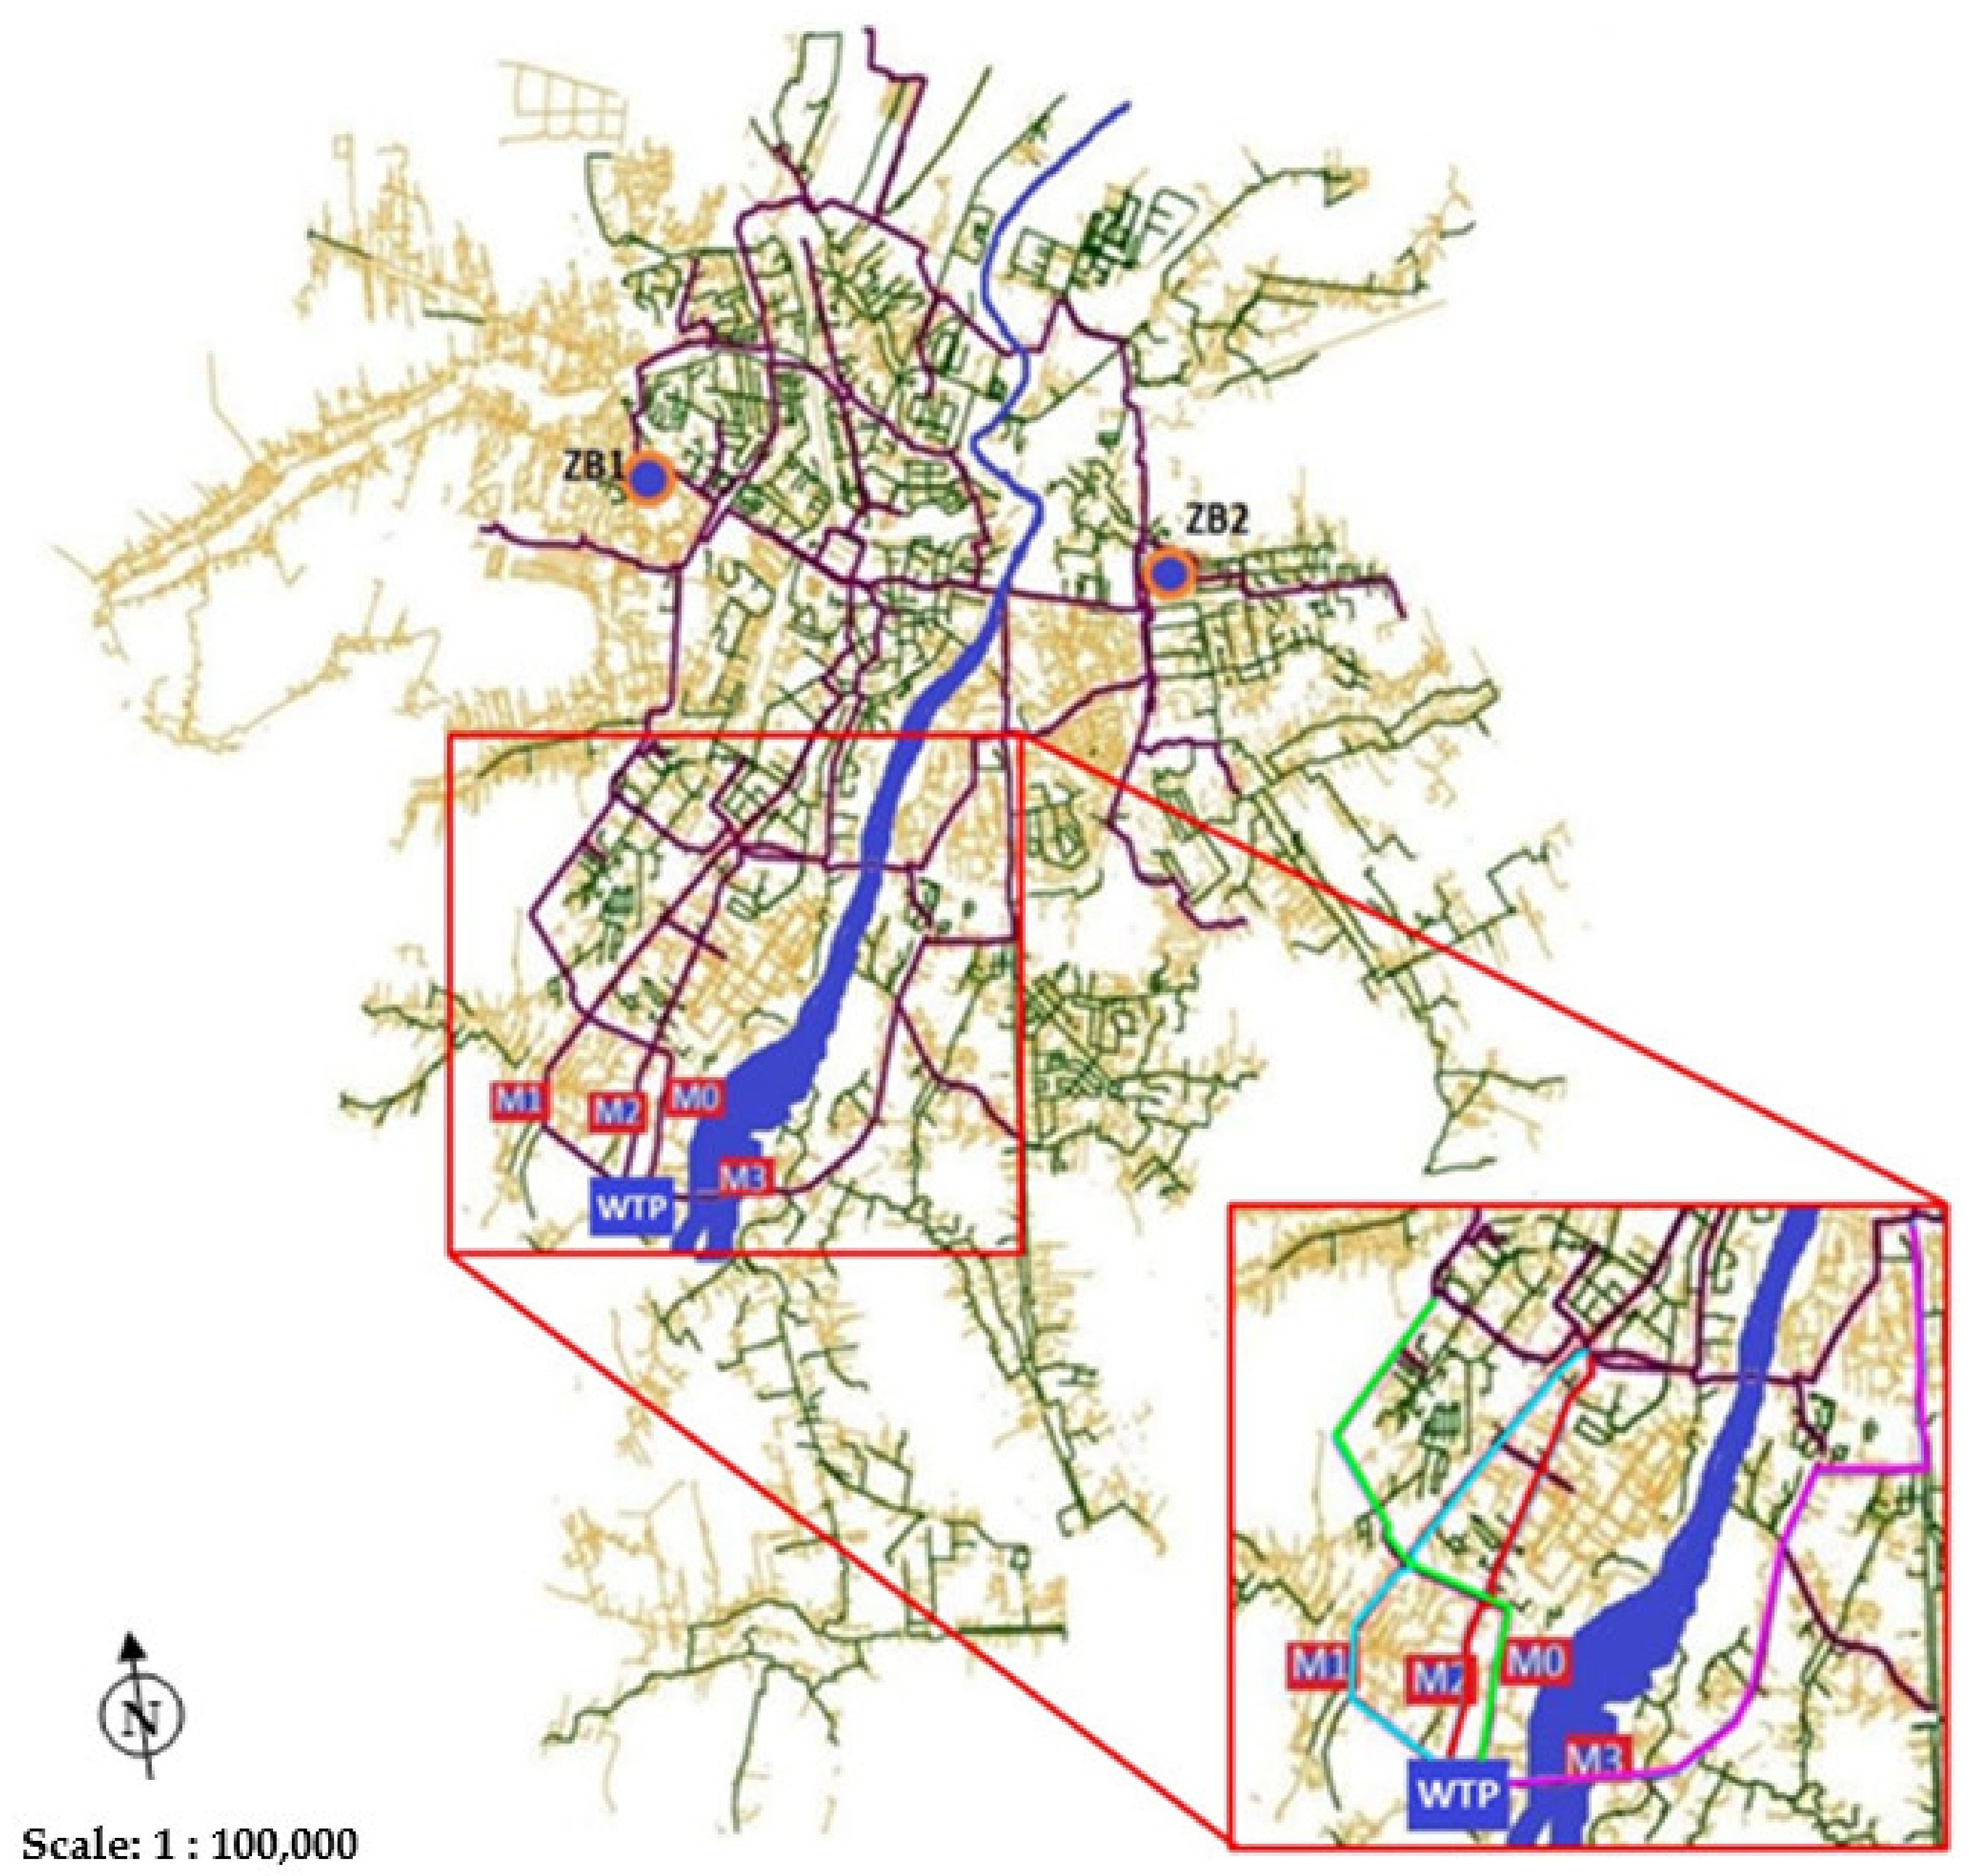
- M0 main pipe—supplies the north western part of the city and tanks ZB1,
- M1 main pipe—transports water to the central and northern parts of the city,
- M2 main pipe—transports water to the southern and central parts of the city,
- M3 main pipe—transports water from WTP to the eastern and north- -eastern parts of the city, supplying tanks ZB2.
2.2. The Risk Matrix for Lack of Water Supply
- pipe lengths are scaled according to the real map,
- terrain ordinates and pipe diameters are consistent with the map,
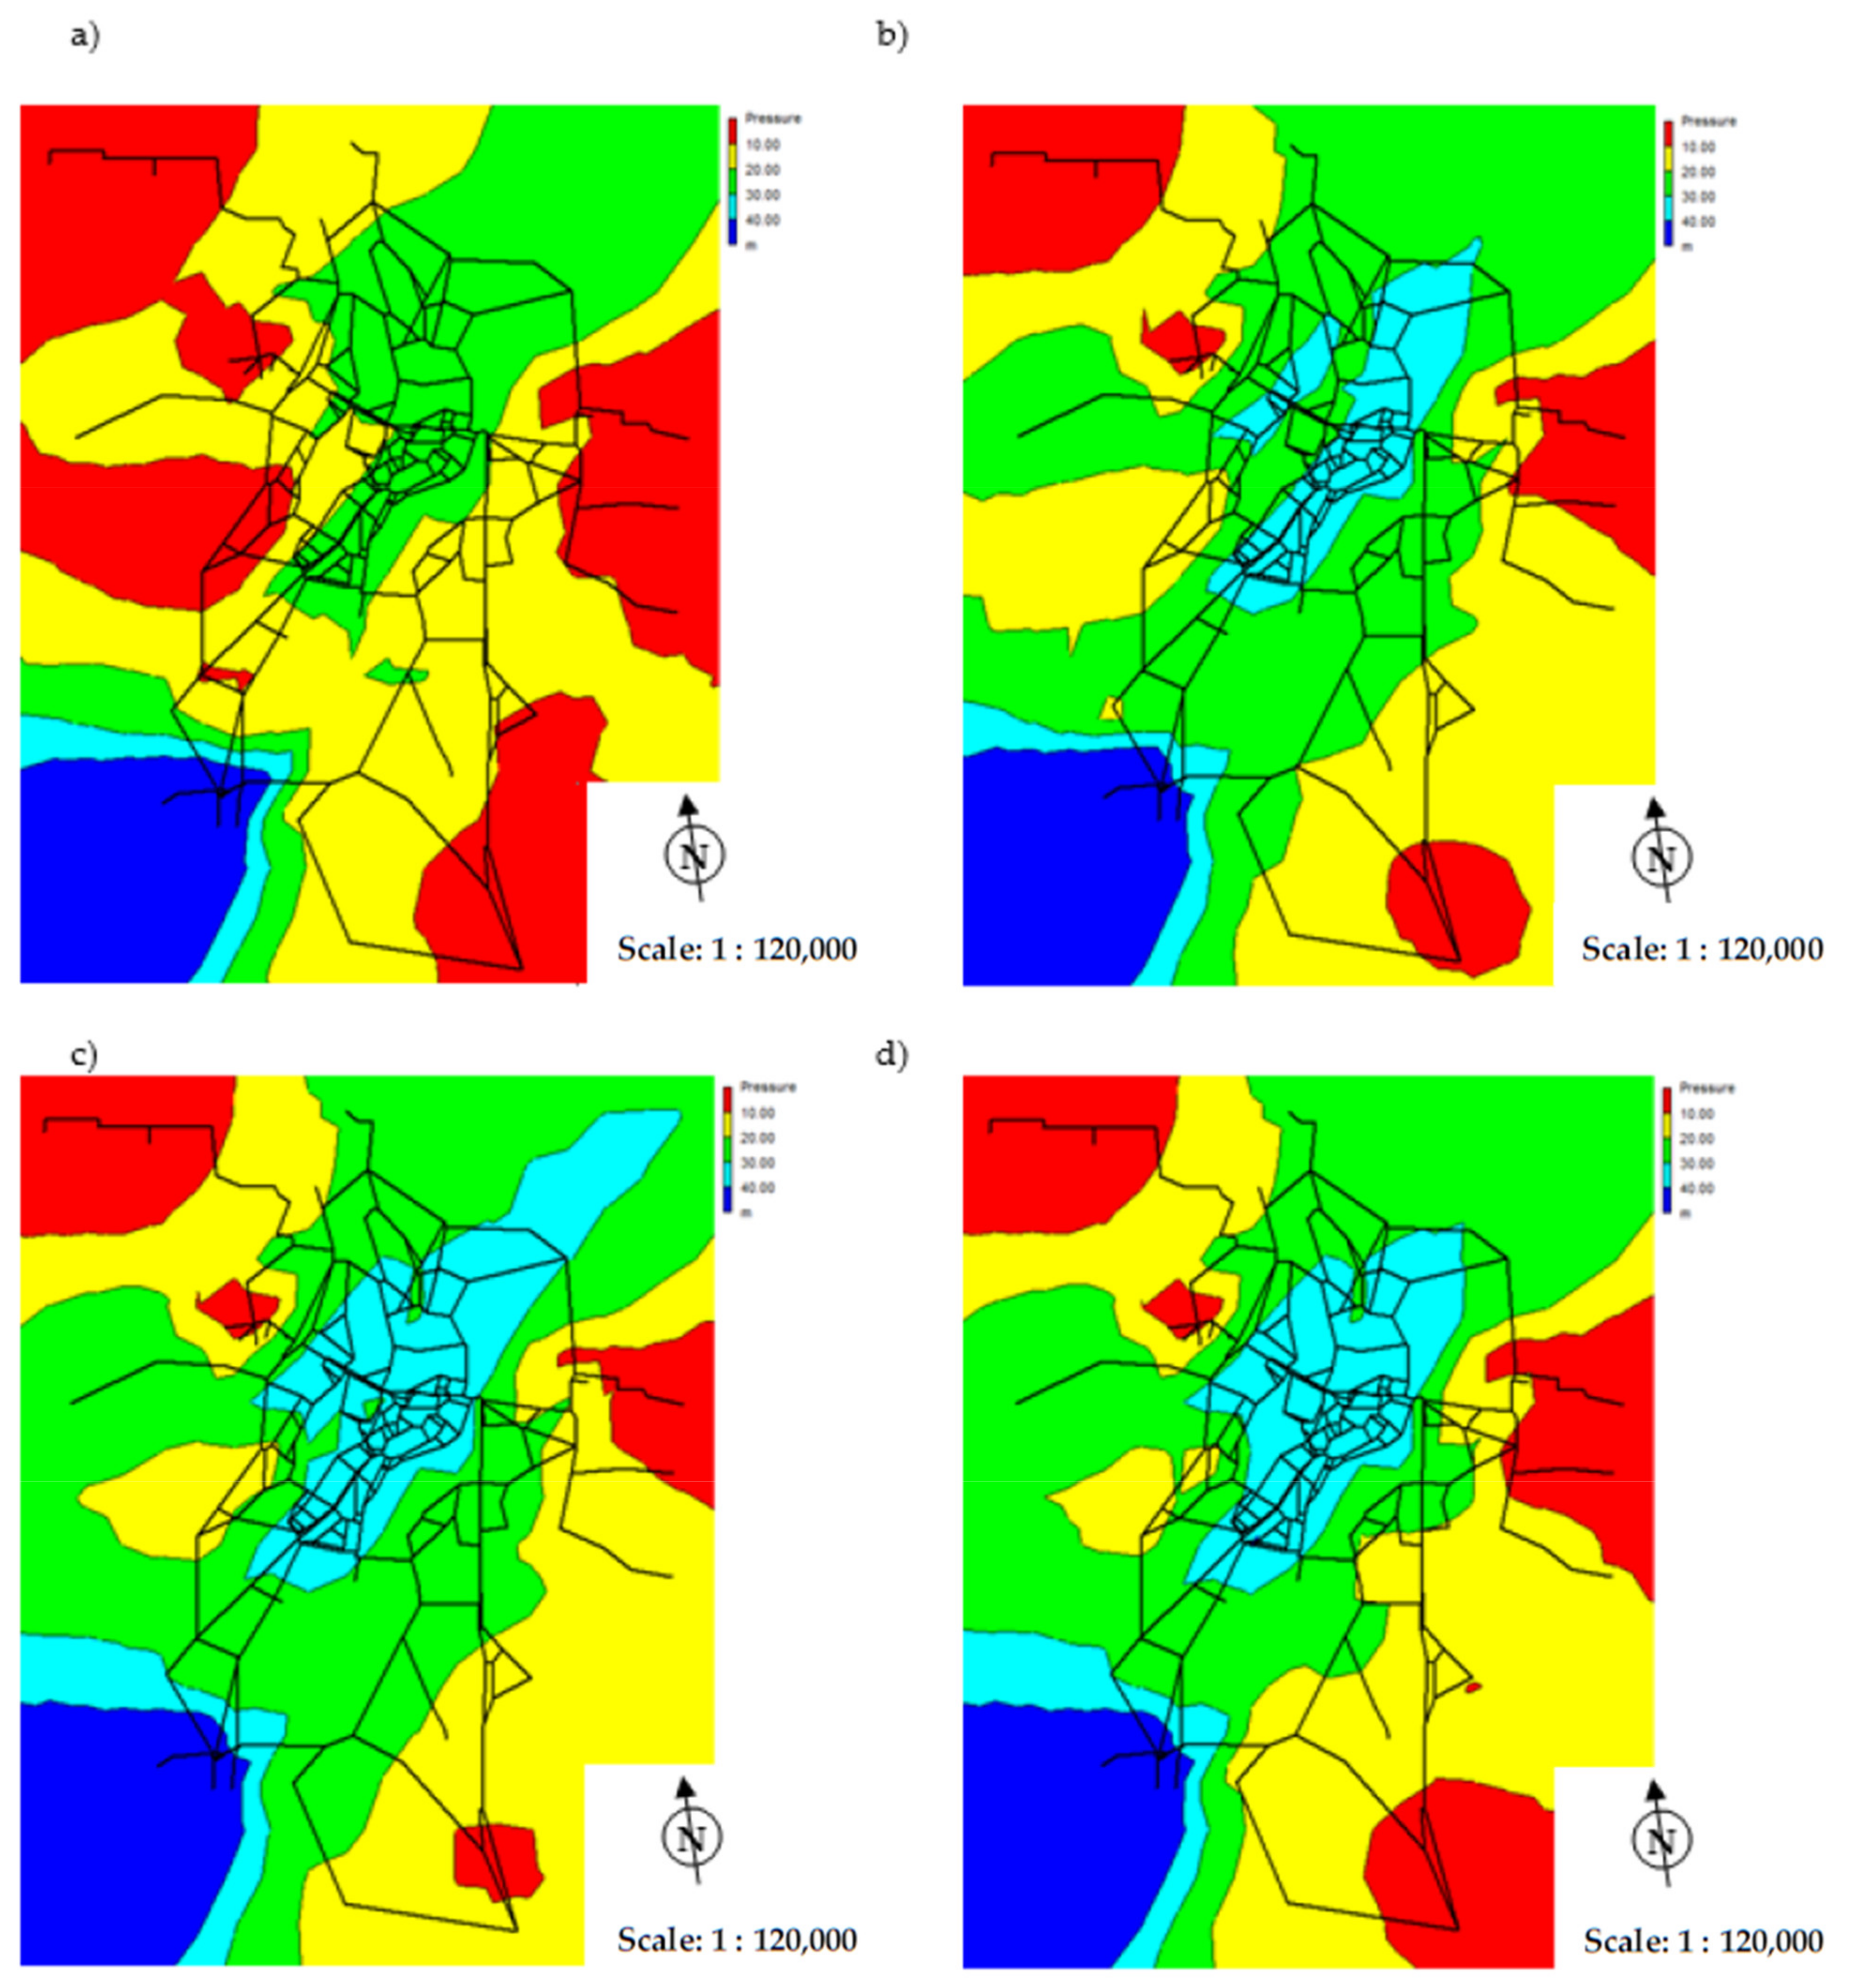
- water partitioning in nodes was assumed according to the number of inhabitants,
- characteristics of pumps and tanks were adopted on the basis of information provided by the water company.
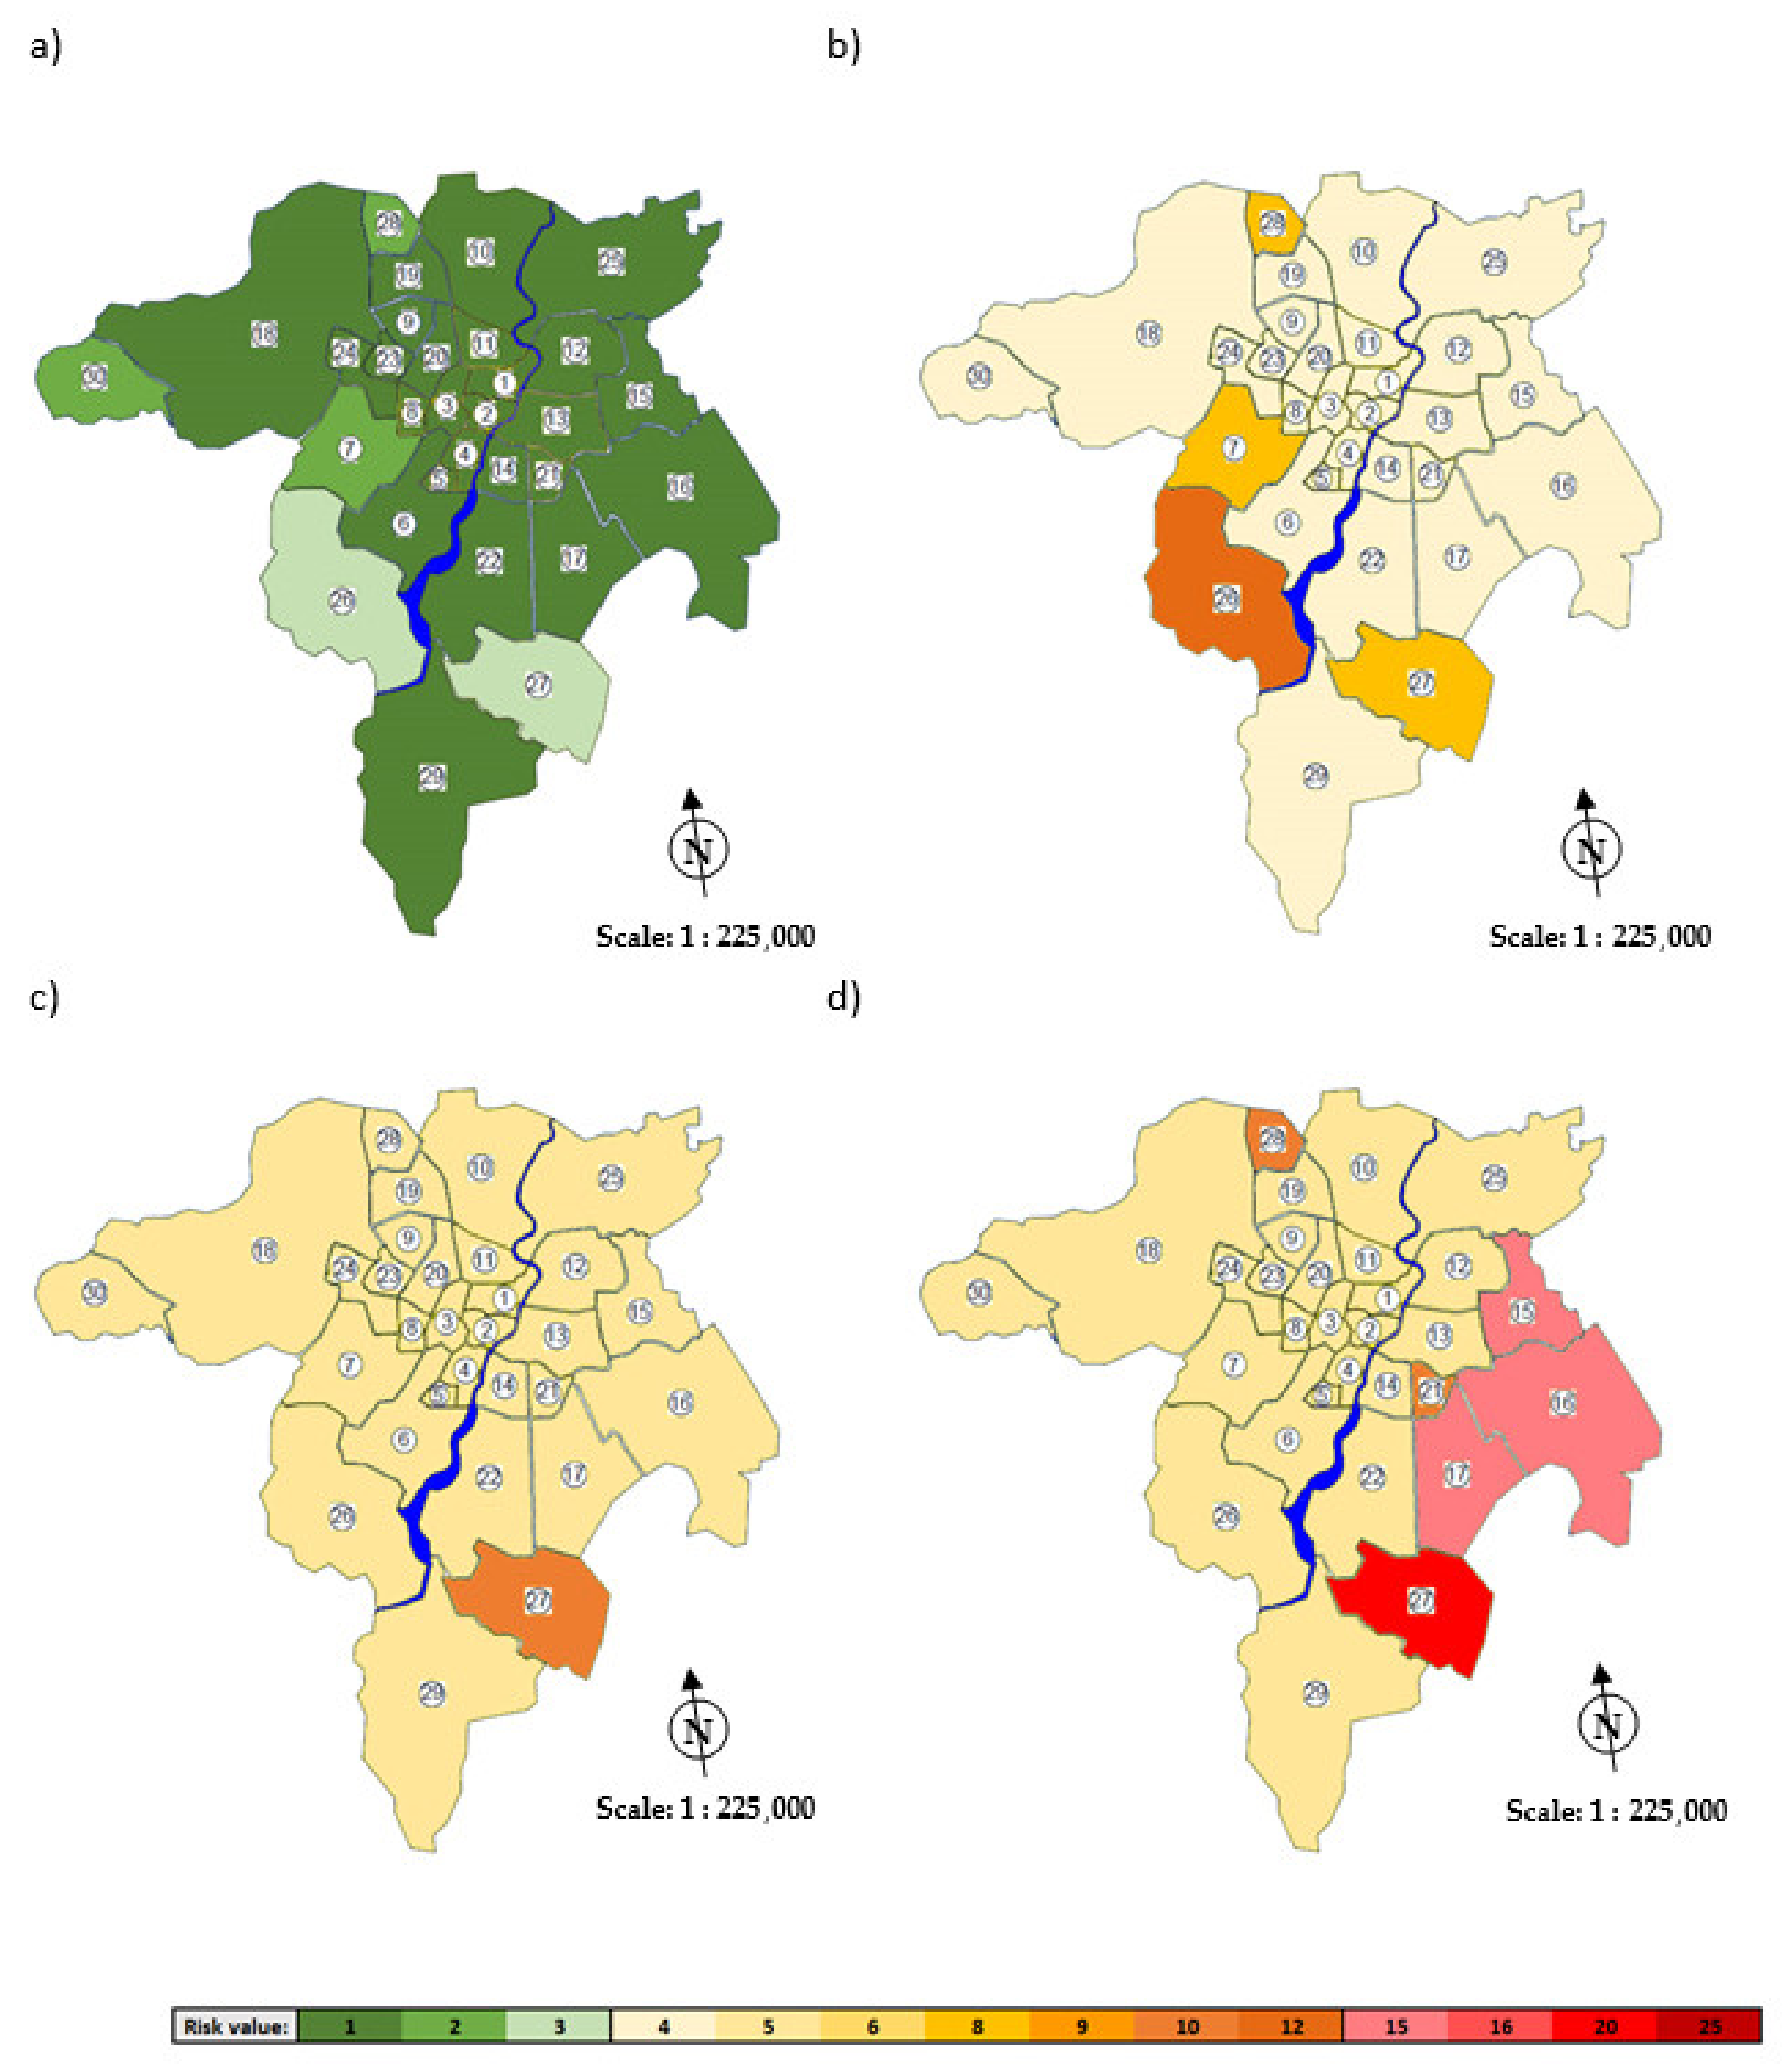
- tolerated risk − 1 ÷ 3,
- controlled risk 4 − ÷ 12,
- unacceptable risk − 15 ÷ 25.
3. Results
3.1. Water Main Pipes Failure Simulation
3.2. Failure Analysis of Water Main Pipes
3.3. The Risk of Lack of Water Supply to the Consumers
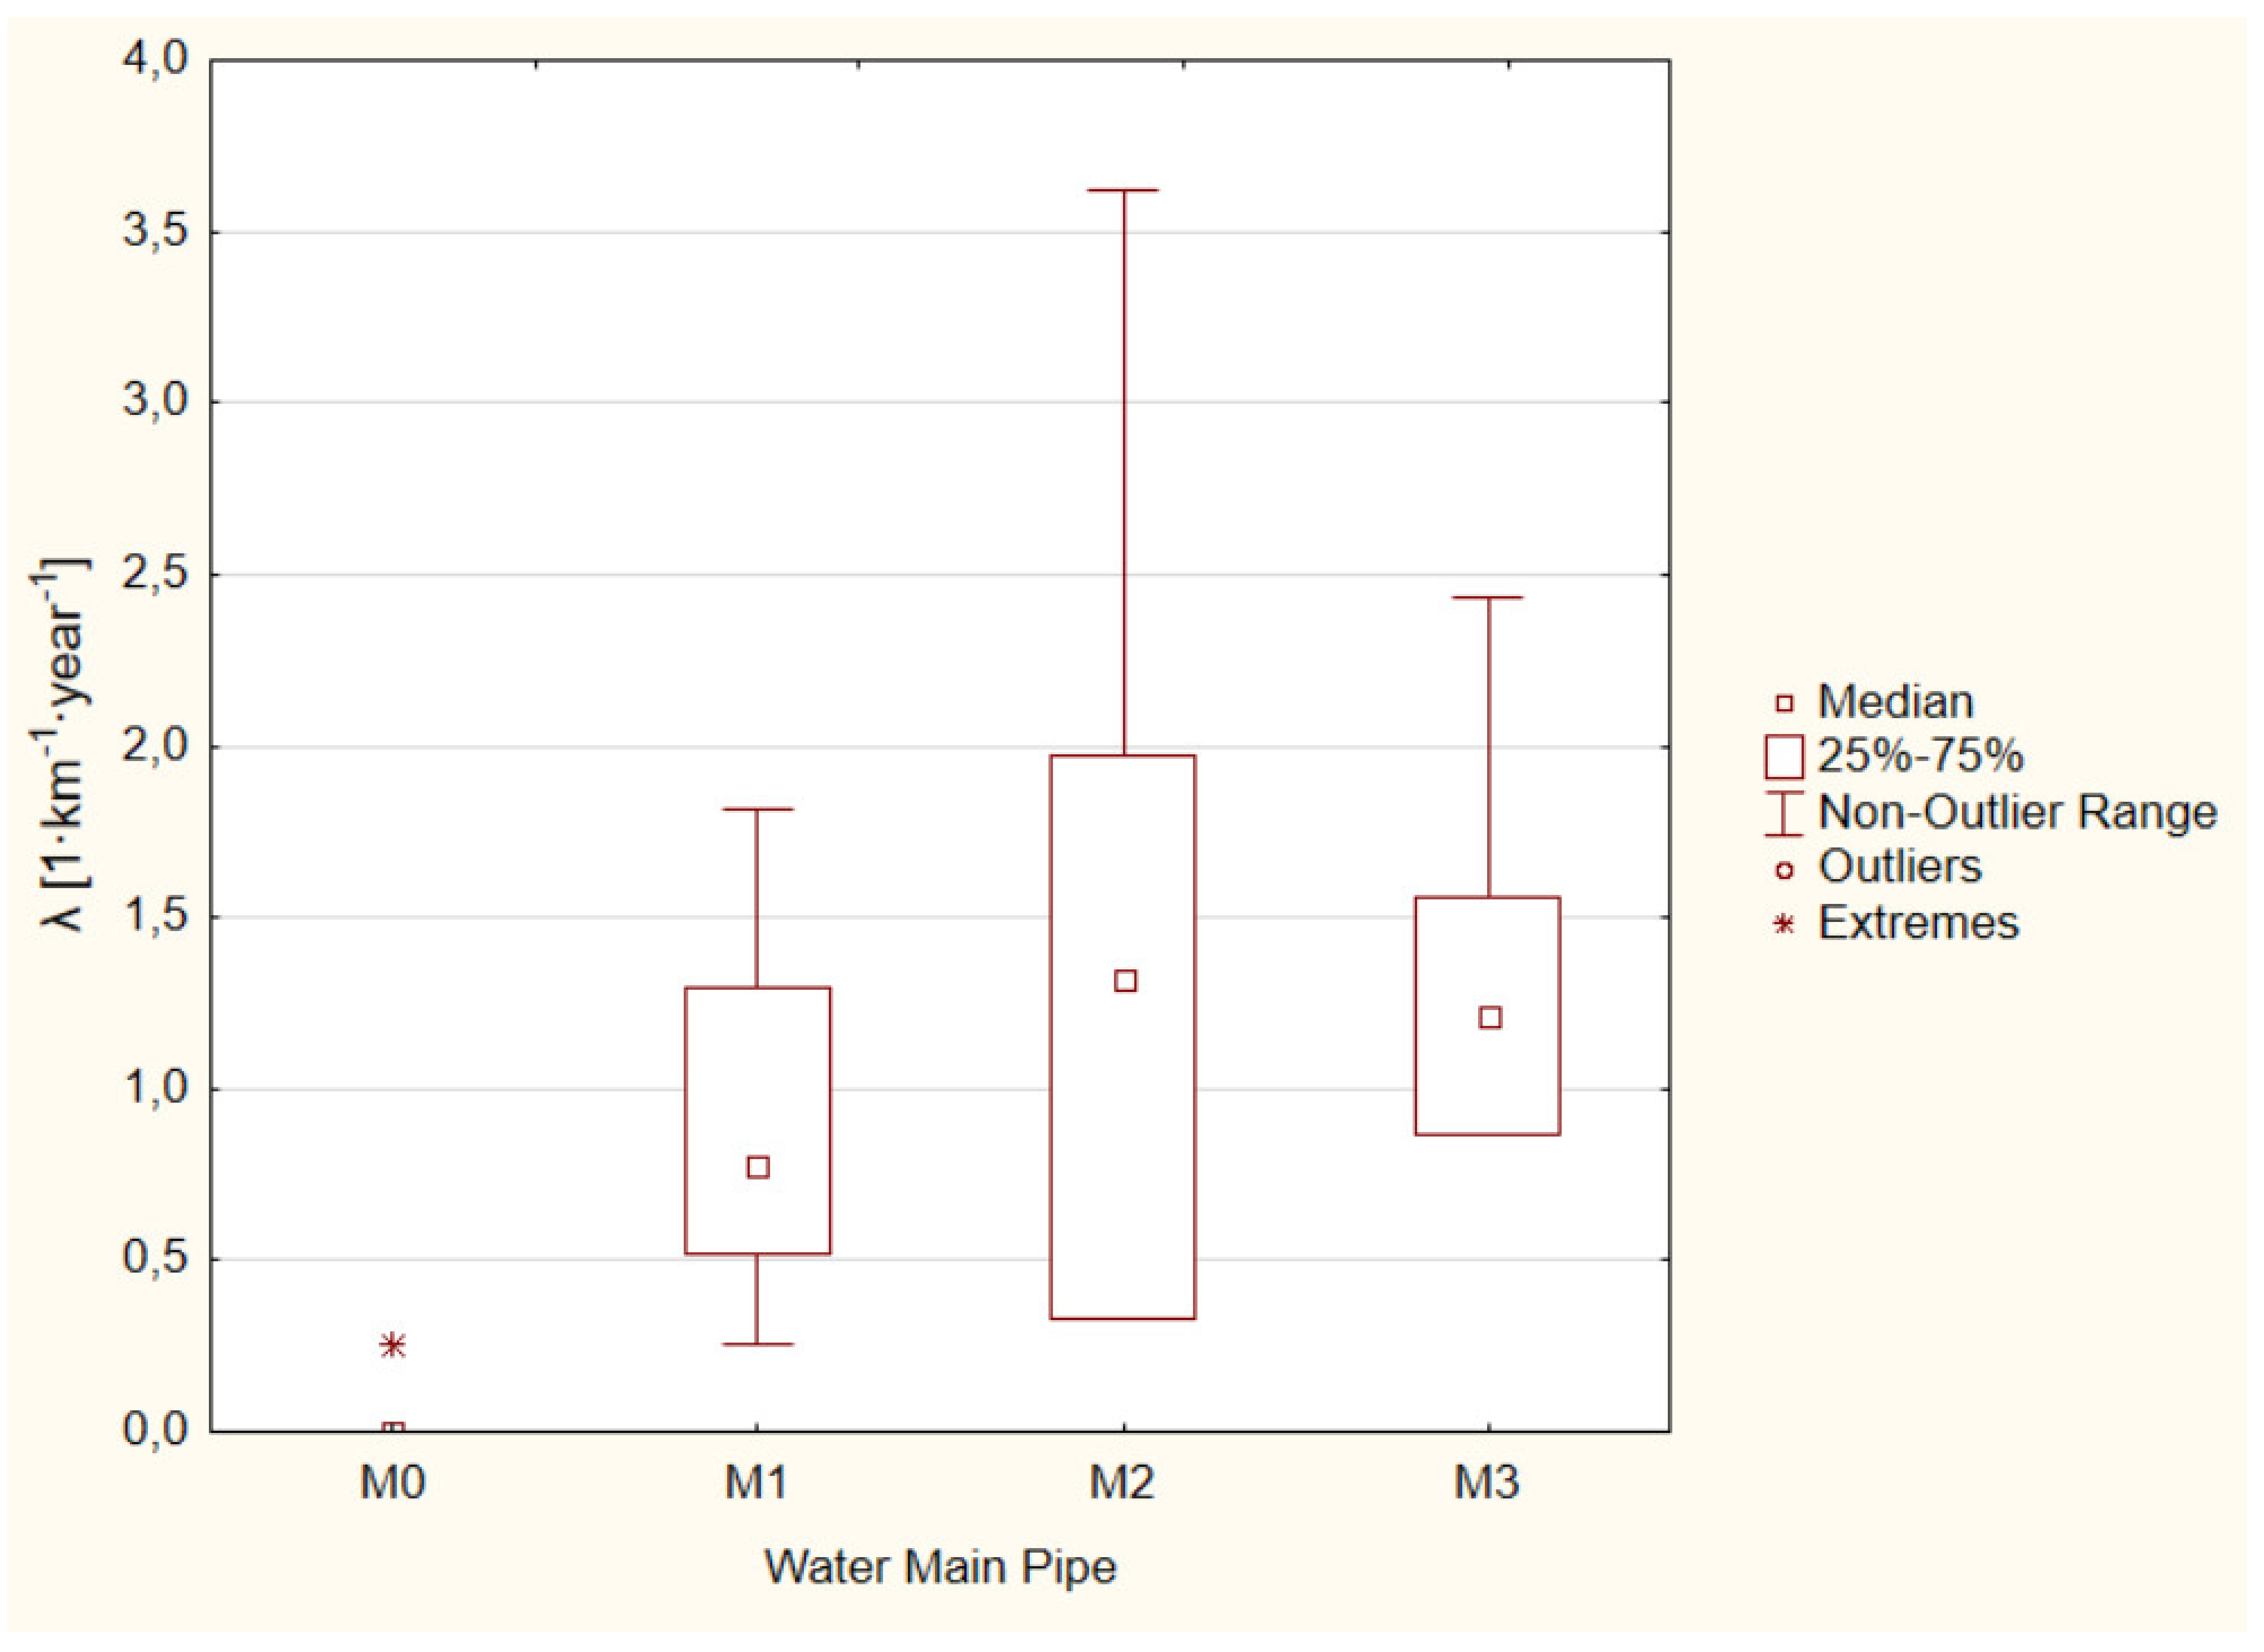
- M0 pipe: λavg = 0.02 fail./km·year → P = 1 (very small),
- M1 pipe: λavg = 0.93 fail./km·year → P = 4 (high),
- M2 pipe: λavg = 1.38 fail./km·year → P = 5 (very high),
- M3 pipe: λavg = 1.32 fail./km·year → P = 5 (very high).
4. Conclusions and Perspectives
Author Contributions
Funding
Acknowledgments
Conflicts of Interest
References
- Pietrucha-Urbanik, K.; Rak, J. Consumers’ Perceptions of the Supply of Tap Water in Crisis Situations. Energies 2020, 13, 3617. [Google Scholar] [CrossRef]
- Roeger, A.; Tavares, A.F. Do Governance Arrangements Affect the Voluntary Adoption of Water Safety Plans? An Empirical Study of Water Utilities in Portugal. Water Resour. Manag. 2020, 34, 1757–1772. [Google Scholar] [CrossRef]
- Szpak, D.; Tchórzewska-Cieślak, B. The Use of Grey Systems Theory to Analyze the Water Supply Systems Safety. Water Resour. Manag. 2019, 33, 4141–4155. [Google Scholar] [CrossRef]
- Guidelines for Drinking-Water Quality, 4th ed.; WHO: Geneva, Switzerland, 2011.
- Water Safety Plan Manual: Step-By-Step Risk Management for Drinking-Water Suppliers; WHO: Geneva, Switzerland, 2009.
- Kordana, S.; Słyś, D. Decision Criteria for the Development of Stormwater Management Systems in Poland. Resources 2020, 9, 20. [Google Scholar] [CrossRef]
- Saravanan, K.; Anusuya, E.; Kumar, R. Real-time water quality monitoring using Internet of Things in SCADA. Environ. Monit. Assess. 2018, 190, 556. [Google Scholar] [CrossRef]
- Fontenot, E.; Ingeduld, P.; Wood, D. Real Time Analysis of Water Supply and Water Distribution Systems. In Proceedings of the World Water & Environmental Resources Congress, Philadelphia, PA, USA, 23–26 June 2003. [Google Scholar]
- Weber, C.; Bunn, S. Water distribution optimization: Taking scada one step forward. In Proceedings of the World Environmental and Water Resources Congress 2009: Great Rivers, Kansas City, MO, USA, 17–21 May 2009. [Google Scholar]
- Stańczyk, J.; Burszta-Adamiak, E. The Analysis of Water Supply Operating Conditions Systems by Means of Empirical Exponents. Water 2019, 11, 2452. [Google Scholar] [CrossRef]
- Aral, M.M.; Maslia, M.L. Evaluation of human exposure to contaminated water supplies using GIS and modelling. In Proceedings of the Application of geographic information systems in hydrology and water resources management (Proc. HydroGIS’96 conference), Vienna, Austria, 16–19 June 1996; pp. 243–252. [Google Scholar]
- Yan, B.; Su, X.R.; Chen, Y.Y. Functional Structure and Data Management of Urban Water Supply Network Based on GIS. Water Resour. Manag. 2009, 23, 2633–2653. [Google Scholar] [CrossRef]
- Kubat, B.; Kwietniewski, M. Modelling and visualization of failure rate of a water supply network using the regression method and GIS. Desalination Water Treat. 2020, 186, 19–28. [Google Scholar] [CrossRef]
- Tchórzewska-Cieślak, B.; Rak, J.R.; Szpak, D. Method of Analysis and Assessment of ICT System Safety in a Water Company. J. Konbin 2019, 49, 301–318. [Google Scholar] [CrossRef]
- Lu, R.Q.; Zhang, H.W.; Niu, Z.G.; Peng, W.J. Study on an arrangement method for pressure monitoring points in urban water supply network by nonlinear mapping theory. J. Hydraul. Eng. 2010, 41, 25–29. [Google Scholar]
- Seyoum, A.G.; Tanyimboh, T.T.; Siew, C. Assessment of water quality modelling capabilities of EPANET multiple species and pressure-dependent extension models. Water Supply 2013, 13, 1161–1166. [Google Scholar] [CrossRef]
- Agunwamba, J.C.; Ekwule, O.R.; Nnaji, C.C. Performance evaluation of a municipal water distribution system using WaterCAD and Epanet. J. Water Sanit. Hyg. Dev. 2018, 8, 459–467. [Google Scholar] [CrossRef]
- Menapace, A.; Pisaturo, G.R.; De Luca, A.; Gerola, D.; Righetti, M. EPANET in QGIS framework: The QEPANET plugin. J. Water Supply Res. Technol. 2019, 69, 1–5. [Google Scholar] [CrossRef]
- Sun, F.; Chen, J.-N.; Zeng, S.-Y. Development and application of a multi-species water quality model for water distribution systems with EPANET-MSX. Huanjing Kexue 2008, 29, 3360–3367. [Google Scholar] [PubMed]
- Ramana, G.V.; Chekka, V.S.S.S. Validation and Examination of Existing Water Distribution Network for Continuous Supply of Water Using EPANET. Water Resour. Manag. 2018, 32, 1993–2011. [Google Scholar] [CrossRef]
- Mohapatra, S.; Sargaonkar, A.; Labhasetwar, P.K. Distribution Network Assessment using EPANET for Intermittent and Continuous Water Supply. Water Resour. Manag. 2014, 28, 3745–3759. [Google Scholar] [CrossRef]
- Duan, X.; Zong, Y.; Hao, K.; Huang, D.; Li, Y. Research of hydraulic reliability of water supply network based on the simulation of EPANET. IOP Conf. Series Earth Environ. Sci. 2019, 349, 012042. [Google Scholar] [CrossRef]
- Zhang, F.-E.; Chen, C.; Li, Y.; Dong, L.; Tu, B.; Zheng, M.; Zhou, R. The investigation of relationship between residual chlorine simulation attenuation and nodes water age in water distribution system by EPANET. In Proceedings of the 2011 International Symposium on Water Resource and Environmental Protection, Xi’an, Shaanxi Province, China, 20–22 May 2011; Volume 1. [Google Scholar]
- Aslani, H.; Zarei, M.; Taghipour, H.; Khashabi, E.; Ghanbari, H.; Ejlali, A. Monitoring, mapping and health risk assessment of fluoride in drinking water supplies in rural areas of Maku and Poldasht, Iran. Environ. Geochem. Heal. 2019, 41, 2281–2294. [Google Scholar] [CrossRef]
- Boryczko, K.; Tchorzewska-Cieslak, B. Analysis and assessment of the risk of lack of water supply using the EPANET program. Environmental Engineering IV. In Proceedings of the Conference on Environmental Engineering IV, Lublin, Poland, 3–5 September 2012. [Google Scholar]
- Boryczko, K.; Tchórzewska-Cieślak, B. Analysis of risk of failure in water main pipe network and of delivering poor quality water. Environ. Prot. Eng. 2014, 40. [Google Scholar] [CrossRef]
- Meyer, V.; Scheuer, S.; Haase, D. A multicriteria approach for flood risk mapping exemplified at the Mulde river, Germany. Nat. Hazards 2009, 48, 17–39. [Google Scholar] [CrossRef]
- Piegdoń, I.; Tchórzewska-Cieślak, B. Methods of visualizing the risk of lack of water supply. In Proceedings of the Safety and Reliability: Methodology and Application (Proc. Eur. Saf. Reliab. Conf., ESREL), Wroclaw, Poland, 14–18 September 2014. [Google Scholar]
- Bhowmik, A.K.; Alamdar, A.; Katsoyiannis, I.; Shen, H.; Ali, N.; Ali, S.M.; Bokhari, H.; Schäfer, R.B.; Eqani, S.A.M.A.S. Mapping human health risks from exposure to trace metal contamination of drinking water sources in Pakistan. Sci. Total. Environ. 2015, 538, 306–316. [Google Scholar] [CrossRef] [PubMed]
- Pietrucha-Urbanik, K.; Studziński, A. Qualitative analyscis of the failure risk of water pipes in terms of water supply safety. Eng. Fail. Anal. 2019, 95, 371–378. [Google Scholar] [CrossRef]


| Main Pipe | Diameter | Length | Material |
|---|---|---|---|
| mm | km | ||
| M0 | 1200 | 3.92 | gray cast iron |
| M1 | 450 | 3.86 | gray cast iron |
| M2 | 400 | 3.04 | PE |
| M3 | 400 | 5.76 | gray cast iron |
| Probability | Failure Rate λ [Failure ∙ km−1 ∙ year −1] | P |
|---|---|---|
| very low | <0.3 | 1 |
| low | 0.3–0.5 | 2 |
| medium | 0.5–0.75 | 3 |
| high | 0.75–1.0 | 4 |
| very high | >1.0 | 5 |
| Consequences | Population without Water | C |
|---|---|---|
| very low | <100 | 1 |
| low | 100–500 | 2 |
| medium | 500–2000 | 3 |
| high | 2000–5000 | 4 |
| very high | >5000 | 5 |
| P | C | ||||
|---|---|---|---|---|---|
| 1 | 2 | 3 | 4 | 5 | |
| 1 | 1 | 2 | 3 | 4 | 5 |
| 2 | 2 | 4 | 6 | 8 | 10 |
| 3 | 3 | 6 | 9 | 12 | 15 |
| 4 | 4 | 8 | 12 | 16 | 20 |
| 5 | 5 | 10 | 15 | 20 | 25 |
| Statistics | Failure Rate λ [1·km−1·year−1] | |||
|---|---|---|---|---|
| M0 | M1 | M2 | M3 | |
| average | 0.02 | 0.93 | 1.38 | 1.32 |
| median | 0 | 0.78 | 1.32 | 1.22 |
| minimum | 0 | 0.26 | 0.33 | 0.87 |
| maximum | 0.26 | 1.81 | 3.62 | 2.43 |
| standard deviation | 0.07 | 0.42 | 0.98 | 0.47 |
| lower quartile (25%) | 0 | 0.52 | 0.98 | 0.87 |
| upper quartile (75%) | 0 | 1.17 | 1.97 | 1.56 |
| Residential Area | The Number of Inhabitants (Consumers) | Number of Inhabitants Affected with Lack of Water Supply —Failure of M0 Pipe | Parameter C Point Weight—Failure of M0 Pipe | Number of Inhabitants Affected with Lack of Water Supply—Failure of M1 Pipe | Parameter C Point Weight—Failure of M1 Pipe | Number of Inhabitants Affected with Lack of Water Supply—Failure of M2 Pipe | Parameter C Point Weight—Failure of M2 Pipe | Number of Inhabitants Affected with Lack of Water Supply—Failure of M3 Pipe | Parameter C Point Weight—Failure of M3 Pipe |
|---|---|---|---|---|---|---|---|---|---|
| 1 | 4377 | 0 | 1 | 0 | 1 | 0 | 1 | 0 | 1 |
| 2 | 3358 | 0 | 1 | 0 | 1 | 0 | 1 | 0 | 1 |
| 3 | 4897 | 0 | 1 | 0 | 1 | 0 | 1 | 0 | 1 |
| 4 | 7530 | 0 | 1 | 0 | 1 | 0 | 1 | 0 | 1 |
| 5 | 4524 | 0 | 1 | 0 | 1 | 0 | 1 | 0 | 1 |
| 6 | 8604 | 0 | 1 | 0 | 1 | 0 | 1 | 0 | 1 |
| 7 | 3262 | 320 | 2 | 300 | 2 | 0 | 1 | 0 | 1 |
| 8 | 6876 | 0 | 1 | 0 | 1 | 0 | 1 | 0 | 1 |
| 9 | 11,322 | 0 | 1 | 0 | 1 | 0 | 1 | 0 | 1 |
| 10 | 4850 | 0 | 1 | 0 | 1 | 0 | 1 | 0 | 1 |
| 11 | 8791 | 0 | 1 | 0 | 1 | 0 | 1 | 0 | 1 |
| 12 | 3986 | 0 | 1 | 0 | 1 | 0 | 1 | 0 | 1 |
| 13 | 10,344 | 0 | 1 | 0 | 1 | 0 | 1 | 0 | 1 |
| 14 | 13,910 | 0 | 1 | 0 | 1 | 0 | 1 | 0 | 1 |
| 15 | 6106 | 0 | 1 | 0 | 1 | 0 | 1 | 820 | 3 |
| 16 | 7059 | 0 | 1 | 0 | 1 | 0 | 1 | 560 | 3 |
| 17 | 8350 | 0 | 1 | 0 | 1 | 0 | 1 | 840 | 3 |
| 18 | 9685 | 0 | 1 | 0 | 1 | 0 | 1 | 0 | 1 |
| 19 | 10,622 | 0 | 1 | 0 | 1 | 0 | 1 | 0 | 1 |
| 20 | 5318 | 0 | 1 | 0 | 1 | 0 | 1 | 0 | 1 |
| 21 | 4167 | 0 | 1 | 0 | 1 | 0 | 1 | 400 | 2 |
| 22 | 12,706 | 0 | 1 | 0 | 1 | 0 | 1 | 0 | 1 |
| 23 | 7716 | 0 | 1 | 0 | 1 | 0 | 1 | 0 | 1 |
| 24 | 5718 | 0 | 1 | 0 | 1 | 0 | 1 | 0 | 1 |
| 25 | 2323 | 0 | 1 | 0 | 1 | 0 | 1 | 0 | 1 |
| 26 | 3529 | 1060 | 3 | 700 | 3 | 0 | 1 | 0 | 1 |
| 27 | 2549 | 760 | 3 | 260 | 2 | 130 | 2 | 1000 | 4 |
| 28 | 959 | 480 | 2 | 100 | 2 | 60 | 1 | 450 | 2 |
| 29 | 6008 | 0 | 1 | 0 | 1 | 0 | 1 | 0 | 1 |
| 30 | 626 | 220 | 2 | 0 | 1 | 0 | 1 | 0 | 1 |
Publisher’s Note: MDPI stays neutral with regard to jurisdictional claims in published maps and institutional affiliations. |
© 2021 by the authors. Licensee MDPI, Basel, Switzerland. This article is an open access article distributed under the terms and conditions of the Creative Commons Attribution (CC BY) license (https://creativecommons.org/licenses/by/4.0/).
Share and Cite
Boryczko, K.; Piegdoń, I.; Szpak, D.; Żywiec, J. Risk Assessment of Lack of Water Supply Using the Hydraulic Model of the Water Supply. Resources 2021, 10, 43. https://doi.org/10.3390/resources10050043
Boryczko K, Piegdoń I, Szpak D, Żywiec J. Risk Assessment of Lack of Water Supply Using the Hydraulic Model of the Water Supply. Resources. 2021; 10(5):43. https://doi.org/10.3390/resources10050043
Chicago/Turabian StyleBoryczko, Krzysztof, Izabela Piegdoń, Dawid Szpak, and Jakub Żywiec. 2021. "Risk Assessment of Lack of Water Supply Using the Hydraulic Model of the Water Supply" Resources 10, no. 5: 43. https://doi.org/10.3390/resources10050043
APA StyleBoryczko, K., Piegdoń, I., Szpak, D., & Żywiec, J. (2021). Risk Assessment of Lack of Water Supply Using the Hydraulic Model of the Water Supply. Resources, 10(5), 43. https://doi.org/10.3390/resources10050043


