1. Introduction
The digital transformation landscape in developing countries is both complex and dynamic, offering opportunities for growth and diversification amid structural challenges and limited strategic capabilities [
1,
2]. The paradigm shift brought by Industry 4.0/5.0 enables these countries to accelerate their economic development and, in some cases, leapfrog stages that developed nations have experienced sequentially [
3]. Digital policies in African countries, for example, explicitly frame digitalization as a lever for productivity, job creation, and a transition toward knowledge-based economies [
1]. At the same time, Artificial Intelligence (AI) and related Fourth Industrial Revolution (4IR) technologies are emerging as new factors of production, complementing human and physical capital and enabling more efficient, data-driven processes [
4]. These technologies have the potential to expand internet access, increase the number of knowledge workers, and enhance the use of smart products with fewer errors, thereby strengthening competitiveness and innovation in developing-country contexts [
4].
Digitalization also affects labor markets, trade, and social inclusion. Evidence points to positive contributions to job creation and reductions in unemployment, including a favourable impact on female employment through more flexible work arrangements such as teleworking [
4]. At the same time, digitalization can help reduce poverty and improve living standards by generating new occupations for socially and economically marginalized groups [
4]. In terms of trade, it reduces transaction costs and facilitates diversification across tasks, products, and sectors [
1,
4], helping to overcome persistent specialization patterns and enabling developing countries to leverage latent comparative advantages and expand exports to developed markets [
1].
Despite this high potential, developing countries face substantial barriers that hinder the adoption of Industry 4.0/5.0 technologies and the realization of their benefits [
1,
2]. These barriers include inadequate digital infrastructure, high ICT service costs, limited scientific and technical capabilities, skills mismatches, and institutional and governance challenges. In addition, the complexity of 4IR technologies, their concentration among a small number of leading firms, and the need for complementary investments in skills, services, and organizational change further constrain absorption in developing-country contexts [
2]. These challenges underscore the need for structured, context-aware approaches to guide digital transformation.
In this context, maturity models (MMs) have become widely used tools to support organizations in navigating digital transformation pathways [
5]. MMs provide structured frameworks that allow organizations to assess their current digital capabilities and define staged trajectories toward more advanced states [
6,
7,
8,
9,
10,
11]. In resource-constrained environments, such as those prevalent in many developing countries, maturity models play a particularly important role by supporting prioritization, phased investment, and strategic planning, rather than ad hoc or overly ambitious transformation initiatives.
Beyond technological assessment, more advanced maturity models incorporate organizational, human, and sustainability dimensions, aligning with the broader Industry 5.0 agenda [
9,
11,
12]. By integrating aspects such as workforce capabilities, resilience, and social and environmental sustainability, these models aim to support more holistic and inclusive transformation pathways. However, the extent to which existing maturity models adequately reflect diverse sectoral realities, development contexts, and empirical evidence remains an open question.
Recent literature reviews on Industry 4.0/5.0 maturity and readiness models have mapped available frameworks and their conceptual dimensions, and have begun to incorporate Industry 5.0 perspectives into this landscape [
13,
14,
15,
16]. These reviews have highlighted persistent sectoral and geographical biases, with most models designed and validated in manufacturing firms located in industrialized economies. They also note the limited availability of standardized instruments, open datasets, and robust empirical validation. Nevertheless, most existing reviews rely primarily on descriptive comparisons and narrative synthesis, offering limited systematic analysis of empirical validation practices, sectoral coverage, or explicit consideration of developing-country applicability.
Building on this literature, our previous study published in
Sustainability [
17] developed an academic literature analysis of 75 Industry 4.0/5.0 maturity models, focusing on their conceptual structure, standardized dimensions, maturity levels, and enabling technologies, and proposing a meta-typology of hybrid I4.0–I5.0 designs. While that work concentrated on conceptual design choices and classificatory properties, it did not examine how these models are distributed geographically, how they have been empirically validated, or to what extent they explicitly address applicability in developing-country contexts.
The present article makes a distinct and non-overlapping contribution. Although it shares an initial review design and document-retrieval workflow with the Sustainability study, its analytical scope and research questions differ substantially. Specifically, this article shifts the focus from conceptual typologies to contextual, empirical, and geographical dimensions of maturity-model research. It introduces original analyses that are not addressed in the companion paper, including: (i) a sensitivity analysis of relevance-based database ranking; (ii) inferential and exact-statistical testing of associations between authorship configuration, development level, sectoral focus, and explicit statements on developing-country applicability; (iii) a normalized sectoral analysis with goodness-of-fit testing; and (iv) a large-scale, auditable synthesis of research gaps reported by model authors, supported by AI-assisted extraction and systematic human verification. As such, the present manuscript is designed to be read as a standalone contribution that extends existing reviews toward evidence-based insights on the transferability and contextual grounding of Industry 4.0/5.0 maturity models, particularly for emerging economies.
Against this background, this study analyzes 75 maturity models published between 2020 and 2024 to address the following research questions: where these models are produced and how developing countries are represented; how authorship type and development context relate to explicit applicability statements; how extensively models have been empirically validated and in which sectors; and which research gaps and limitations authors themselves identify as barriers to Industry 4.0/5.0 adoption in developing economies (
Table 1). The remainder of the paper is organized as follows.
Section 2 describes the review protocol and coding procedures.
Section 3 presents the empirical findings.
Section 4 discusses implications for theory and practice, with particular attention to developing-country contexts and Industry 5.0 dimensions.
Section 5 concludes and outlines directions for future research.
2. Materials and Methods
The research was carried out based on an exhaustive analysis of existing maturity models. The method consists of five sequential phases with parallel branches (see
Figure 1). First, the review design (1) is defined, establishing the sources, time frame, and inclusion/exclusion criteria to build the corpus. Then, the variables and categories are operationalized (2). Subsequently, data extraction, normalization, and coding are performed (3), yielding a dataset that serves as input for the analysis. Next, the analysis phase is conducted, comprising four branches that represent four groups of tools and techniques (4): descriptive statistics; visualization and bibliometrics; inferential statistics; and text mining and qualitative analysis. To facilitate traceability and reproducibility of the method, each phase has been named as shown in
Figure 1. Each phase is detailed below, along with the tools, methodologies, and software that supported them.
In both this article and our previous Academic Literature Analysis of Industry 4.0/5.0 maturity typologies and hybrid I4.0–I5.0 designs, published in
Sustainability [
17], we apply the same five-phase protocol to the same curated corpus of publications. Here we briefly summarise the shared design and data-collection phases (Phases 1–3 in
Figure 1) so that the study remains self-contained, and then focus on analytical procedures (Phase 4) that are specific to empirical validation, sectoral scope, and applicability to developing-country contexts. As in [
17], our analysis is deliberately confined to maturity models proposed in the peer-reviewed academic literature: we map the academic design space of Industry 4.0 and 5.0 maturity models as conceptual artefacts, rather than evaluating their diffusion or effectiveness in practice. The workflow for review design, document retrieval, and data extraction is shared across both studies, but in the present article the coding scheme and analytical focus are extended to address a different set of questions concerning empirical validation, sectoral scope, and applicability to developing-country contexts.
2.1. Document Retrieval Process (RQ1–RQ5, Review Foundation)
Five key research questions were defined (see
Table 1) to guide the analysis of the maturity models. These questions examine: (1) the geographical origin of the models and the developed–emerging country bias; (2) the influence of the type of authorship (single-country, international collaboration, or global approach) on the extent to which emerging contexts are considered; (3) the impact of the development level of the model’s country of origin on its stated applicability; (4) the degree of empirical validation and sectoral coverage achieved; and (5) the knowledge gaps identified by the literature itself as barriers to the adoption of Industry 4.0/5.0.
The search terms were structured to capture relevant literature using Boolean operators:
(“Industry 4.0” OR “Fourth Industrial Revolution” OR “Industry 5.0” OR “Fifth Industrial Revolution”) AND (“maturity model” OR “adoption model” OR “framework”)
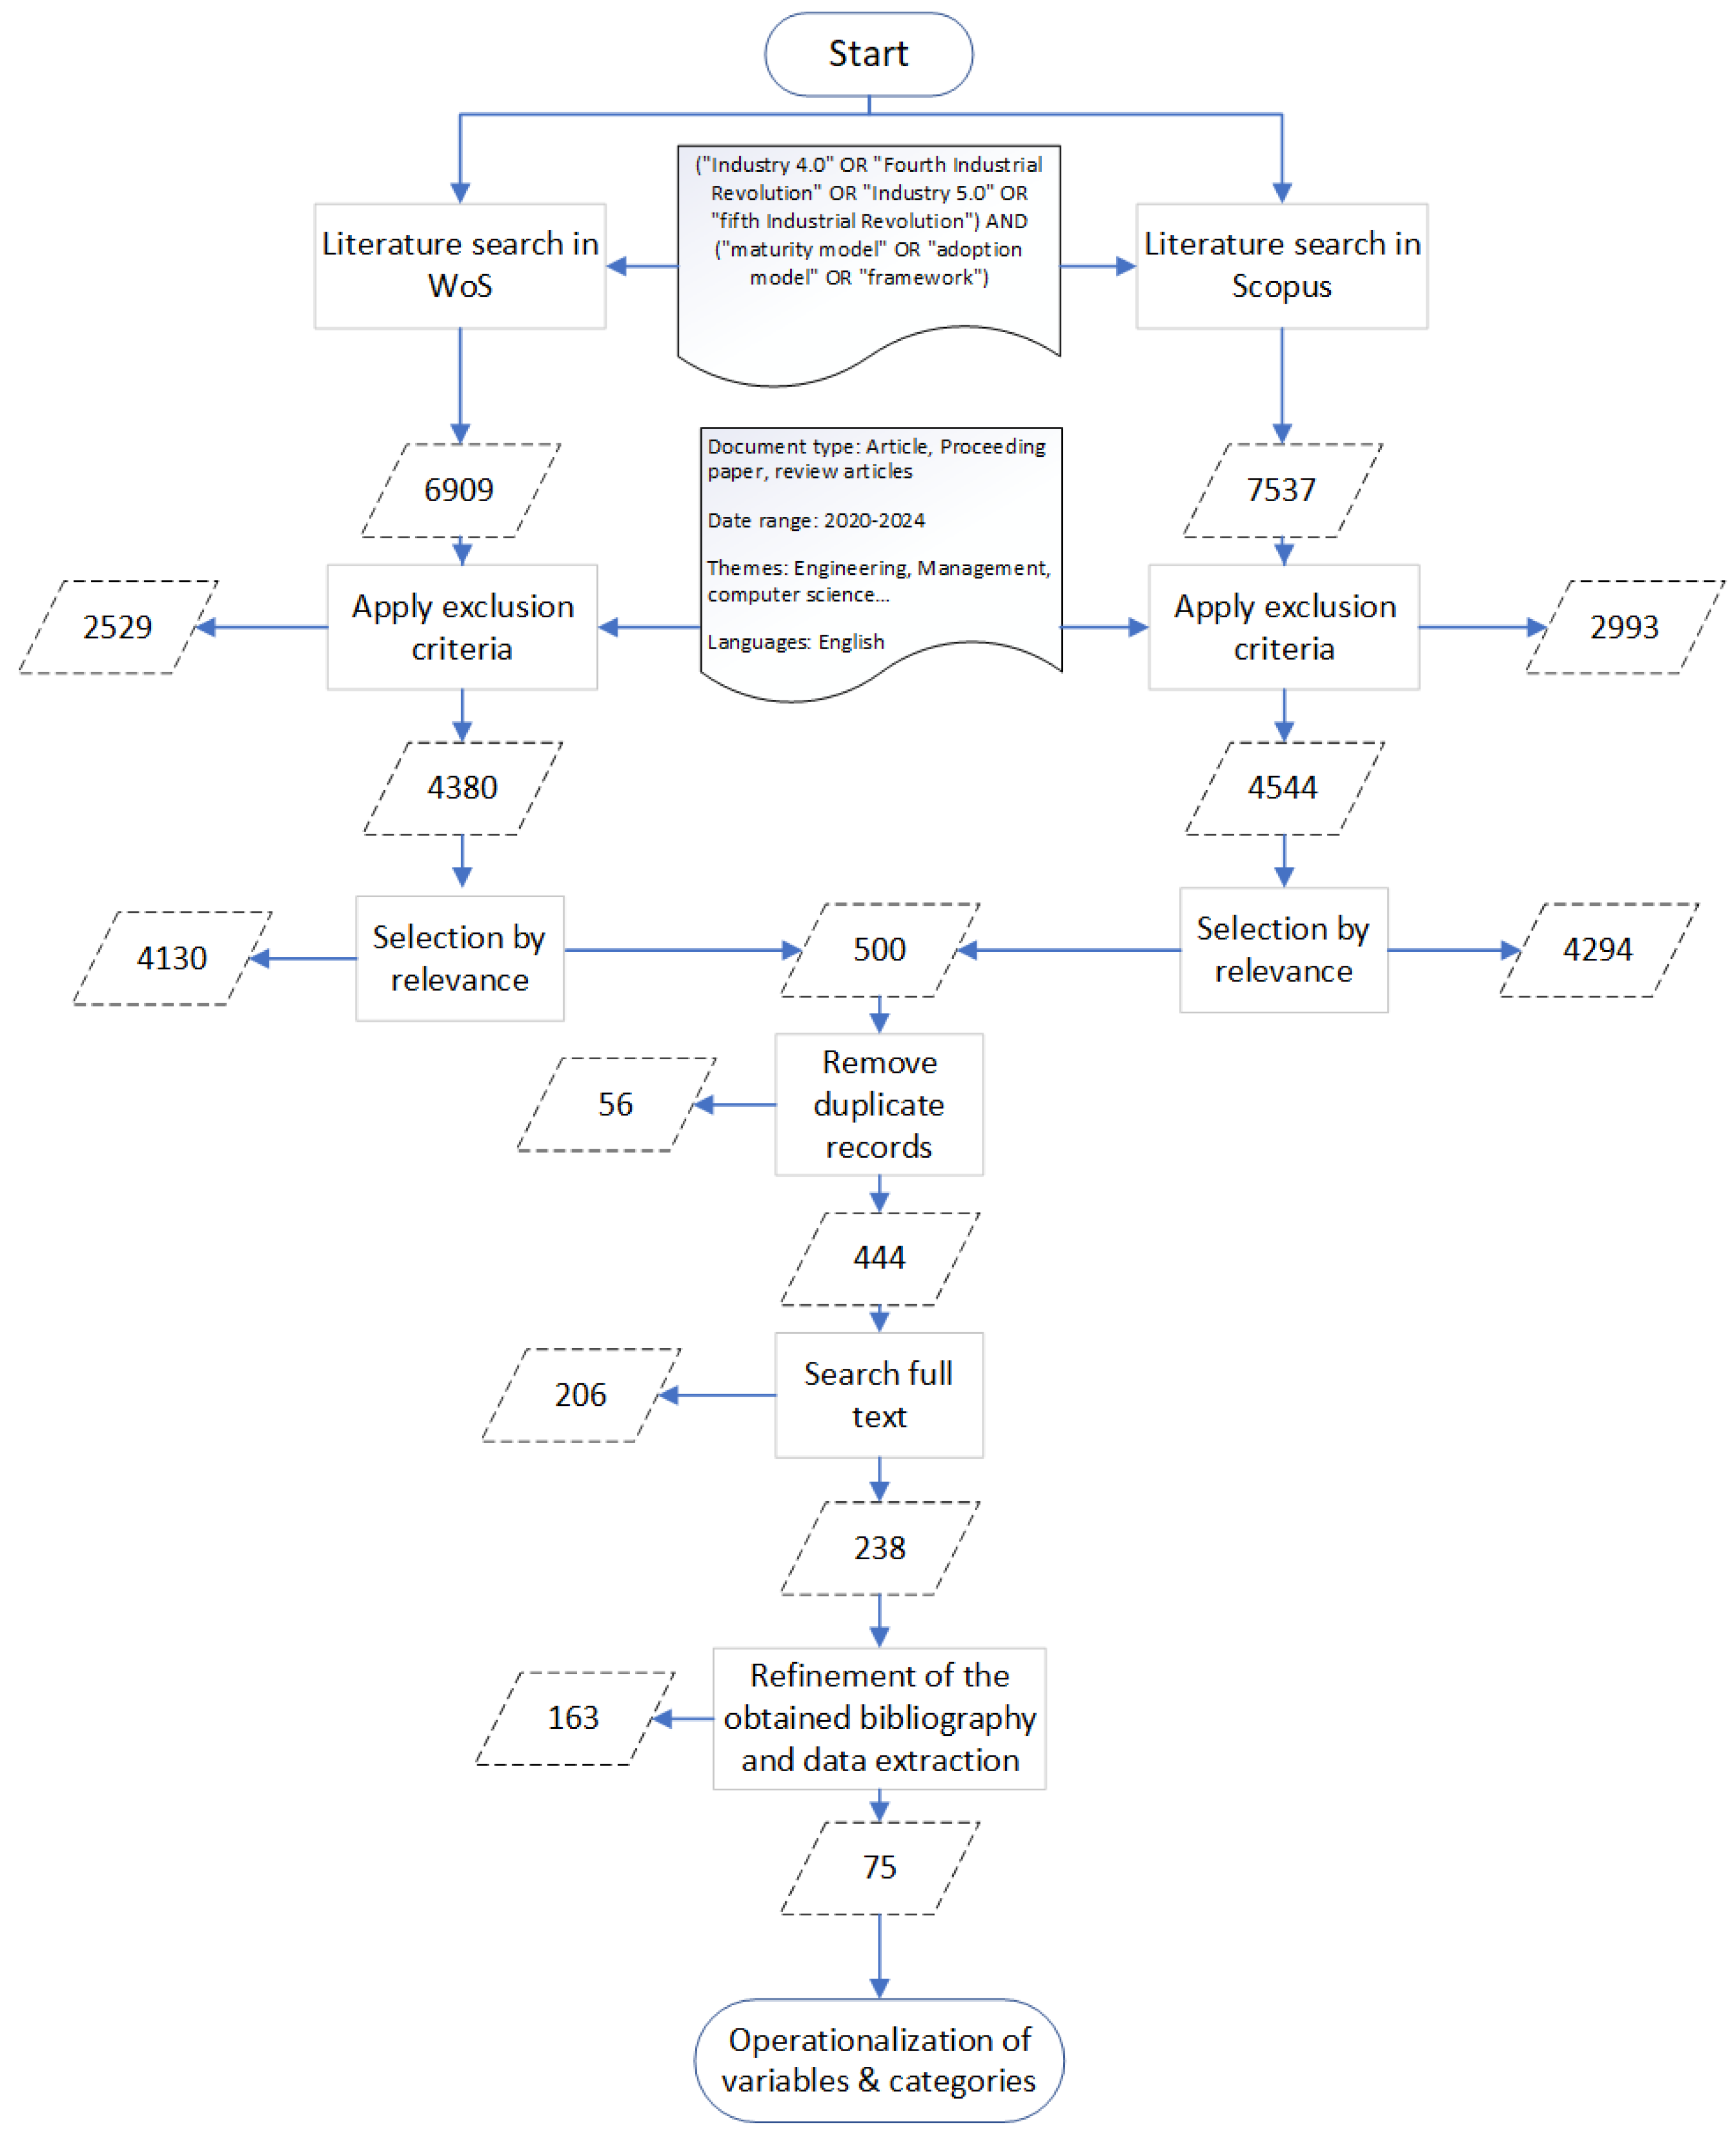
Web of Science and Scopus were selected due to their recognized coverage of high-quality scientific literature. The method followed for retrieving reference documents is illustrated in
Figure 2.
An initial search returned 6909 and 7537 records in Web of Science and Scopus, respectively. Results were first restricted to the 2020–2024 period, English-language, peer-reviewed articles, conference papers, and review articles, and to the subject categories listed in
Table 2. Because each database still yielded more than 4000 items, we relied on the built-in relevance ordering to obtain a manageable but information-rich subset. In Web of Science we used the default “Relevance” sort, which prioritizes records according to the occurrence and weighting of the query terms in the title, abstract, and author keywords. In Scopus we likewise kept the default relevance-based ordering, internally computed from the frequency of the search terms and their weighting by fields (title/abstract/keywords) for the query used. From each database we exported the first 250 records in the relevance-sorted list (500 records in total before de-duplication), treating this step as a transparent and reproducible heuristic: any researcher can replicate it by applying the same search string, temporal and document-type filters, and relevance ordering before exporting the top-ranked 250 records from each database.
After merging both sets, duplicates were removed based on DOI and title, yielding 444 unique documents. Throughout the screening process, records were discarded at several stages, as summarized in
Figure 2. First, after applying the exclusion criteria (document type, 2020–2024 date range, subject areas, and language), 2529 Web of Science records and 2993 Scopus records were excluded. Second, at the relevance-selection stage—in which only the 250 highest-ranked records in each database were retained—an additional 4130 Web of Science and 4294 Scopus documents were discarded. Full-text screening of the 444 remaining items led to the exclusion of 206 papers that either did not sufficiently describe an Industry 4.0/5.0 maturity model or were not available in full text, leaving 238 documents for detailed assessment. Finally, during the refinement of the bibliography and data extraction, 163 documents were excluded because they did not provide information that could be operationalized for the present analysis, yielding a final corpus of 75 primary articles, each defining at least one maturity model.
Because the relevance functions of commercial databases are proprietary and may under-represent certain topics (for example, niche sectors or alternative terminologies), we took three steps to reduce potential selection bias. First, we combined relevance-ranked results from two independent databases (Web of Science and Scopus), whose coverage and ranking algorithms differ. Second, we applied broad subject-area filters (engineering, computer science, management, and related domains; see
Table 2) instead of very narrow subfields, so as not to exclude a priori peripheral but substantively relevant contributions. Third, during full-text screening we complemented database searches with backward reference chasing: any maturity model cited as a primary instrument in an included article but missing from the initial set of 444 records was checked manually and, if it met the 2020–2024 inclusion criteria, added to the corpus. We also verified that Industry 4.0 maturity models considered canonical in prior reviews were retrieved by this strategy. These steps do not completely eliminate the risk of relevance-based bias but make the resulting set of 75 models more robust and transparent.
2.2. Sensitivity Analysis for Selection Bias
To assess the potential selection bias introduced by relevance-based truncation of database search results, a sensitivity analysis was conducted using an additional sample of maturity models drawn from ranks 251–500 of the original Web of Science and Scopus result lists.
Records ranked 251–500 were exported from Web of Science () and Scopus (), yielding a combined universe of 499 unique references after removal of one duplicate. From this universe, a high-sensitivity candidate list was generated through automated screening of titles, abstracts, and keywords for maturity- or readiness-model terminology (e.g., “maturity model”, “readiness model”, “capability maturity”, “maturity assessment”). This step was intentionally designed to maximize recall and resulted in 122 candidate records, accepting the presence of false positives.
Random selection was then implemented in Python using uniform sampling without replacement (random.sample), with a fixed random seed (seed = 20,260,109) to ensure full reproducibility. An initial random draw of 20 candidate records was manually screened against the eligibility criterion (i.e., the paper proposes, adapts, or applies a maturity or readiness model). Ineligible records were discarded and iteratively replaced through additional random draws from the remaining candidate pool until 20 eligible studies were identified.
In total, 60 candidate records were manually screened to obtain 20 eligible maturity-model articles, resulting in 40 exclusions. The same coding scheme, variable definitions, and boundary rules used for the main corpus were applied without modification to this sensitivity sample. Findings from this analysis are used exclusively as a robustness check and are not pooled with the primary dataset of 75 models. Full procedural traceability of the sampling process, including universe definition, candidate preselection, randomization settings, and exclusion counts, is documented in
Appendix A.
2.3. Operationalization of Variables and Categories
After identifying the maturity models under study, a set of variables was defined whose analysis supports each of the formulated research questions.
2.3.1. Type of Authorship
To analyze how the model’s origin influences whether authors discuss its applicability in developing countries, the variable Type of Authorship was defined. For the purposes of this study, it corresponds to the classification of the authors’ institutional affiliations.
Single-country: all authors are affiliated with institutions from the same country.
Collaboration (≥2 countries): affiliations from two or more countries are present.
Global: the model is declared as having no national affiliation or belonging to a supranational consortium.
Boundary rules: co-leadership between authors from different countries ⇒ Collaboration; declaration of global scope or supranational consortium ⇒ Global.
2.3.2. Development Level of the Country of Origin
To assess how the development level of the model’s country of origin influences the likelihood of explicitly considering developing countries, the variable Development Level of the Country of Origin was defined, based on the World Bank classification.
Developed: country classified as developed.
Developing: country not classified as developed.
Mixed: co-leadership involving countries with different development levels.
Global: no national affiliation (consortium/supranational).
Boundary rule: co-leadership between countries with different levels ⇒ Mixed.
2.3.3. Validation Method
The variable Validation Method was defined and analyzed to determine the extent to which existing models have been empirically validated. This variable indicates the type of empirical verification used to test the model:
No validation: no empirical verification performed.
Simulation/Demonstration: validation through simulation or demonstration without observed data.
Survey: evidence obtained through questionnaires.
Single case: validation conducted with a single case/company.
Multiple cases: validation conducted with more than one case/company.
Boundary rule: when multiple methods coexist, report the most empirical one (Multiple cases > Single case > Survey > Simulation > No validation).
2.3.4. Sectorization
The Sectorization variable was defined to identify how maturity models have been developed and validated across different sectors. It indicates whether the model specifies the sector(s) where it applies:
Specific: a single sector is explicitly declared (e.g., manufacturing).
Multisector: two or more sectors are explicitly mentioned.
Undefined: no sectoral boundaries are specified.
Boundary rule: if transversal activities (e.g., logistics, maintenance, quality) are described without a defined sector, classify as Undefined.
2.3.5. Worked Examples for Borderline Sector Classification
To ensure transparency and reproducibility in sector coding, explicit examples are provided for borderline cases frequently encountered in the corpus, such as automotive manufacturing, textiles/apparel, and cross-cutting logistics.
Automotive manufacturing. When a model explicitly targets the automotive industry (e.g., car assembly, OEM-specific production systems, or validation within automotive plants), it is coded as Specific, with the sector label Automotive manufacturing. For inferential analyses requiring normalized categories, this label is mapped to the broader Manufacturing category. By contrast, if automotive is mentioned only as one illustrative example within a general manufacturing framework, no automotive-specific sector code is assigned.
Textiles and apparel. Models are coded as Specific with the sector label Textiles/Apparel when their structure, indicators, or empirical validation are explicitly grounded in textile or garment production contexts. If textiles or apparel appear only as one example among several manufacturing sectors, the model is coded according to its dominant declared scope rather than as textile-specific.
Logistics as a cross-cutting function. When logistics (e.g., warehousing, transport, intralogistics) constitutes the primary object of assessment and is treated independently of the firm’s industrial sector, the model is coded as Specific with the sector label Logistics/Supply Chain. If logistics is addressed only as a transversal activity embedded within a broader manufacturing or supply-chain model, the sector classification follows the dominant production context rather than logistics as a standalone sector.
These examples illustrate how sector classification prioritized the declared scope, primary object of analysis, and validation context of each model, rather than incidental mentions of sectors or functions. For full transparency, the normalization rules and the mapping table used to harmonize synonymous sector labels (e.g., “Apparel”, “Clothing”, “Textile & Confections”) into analytic categories are provided in
Appendix B.
2.3.6. Identified Gaps/Limitations
To identify the research gaps recognized or highlighted by the authors of the maturity models, the variable Identified Gaps/Limitations was defined. Boundary rule: if a record fits multiple themes, assign all relevant tags and document the decision.
2.4. Data Extraction, Normalization, and Coding (RQ1–RQ5)
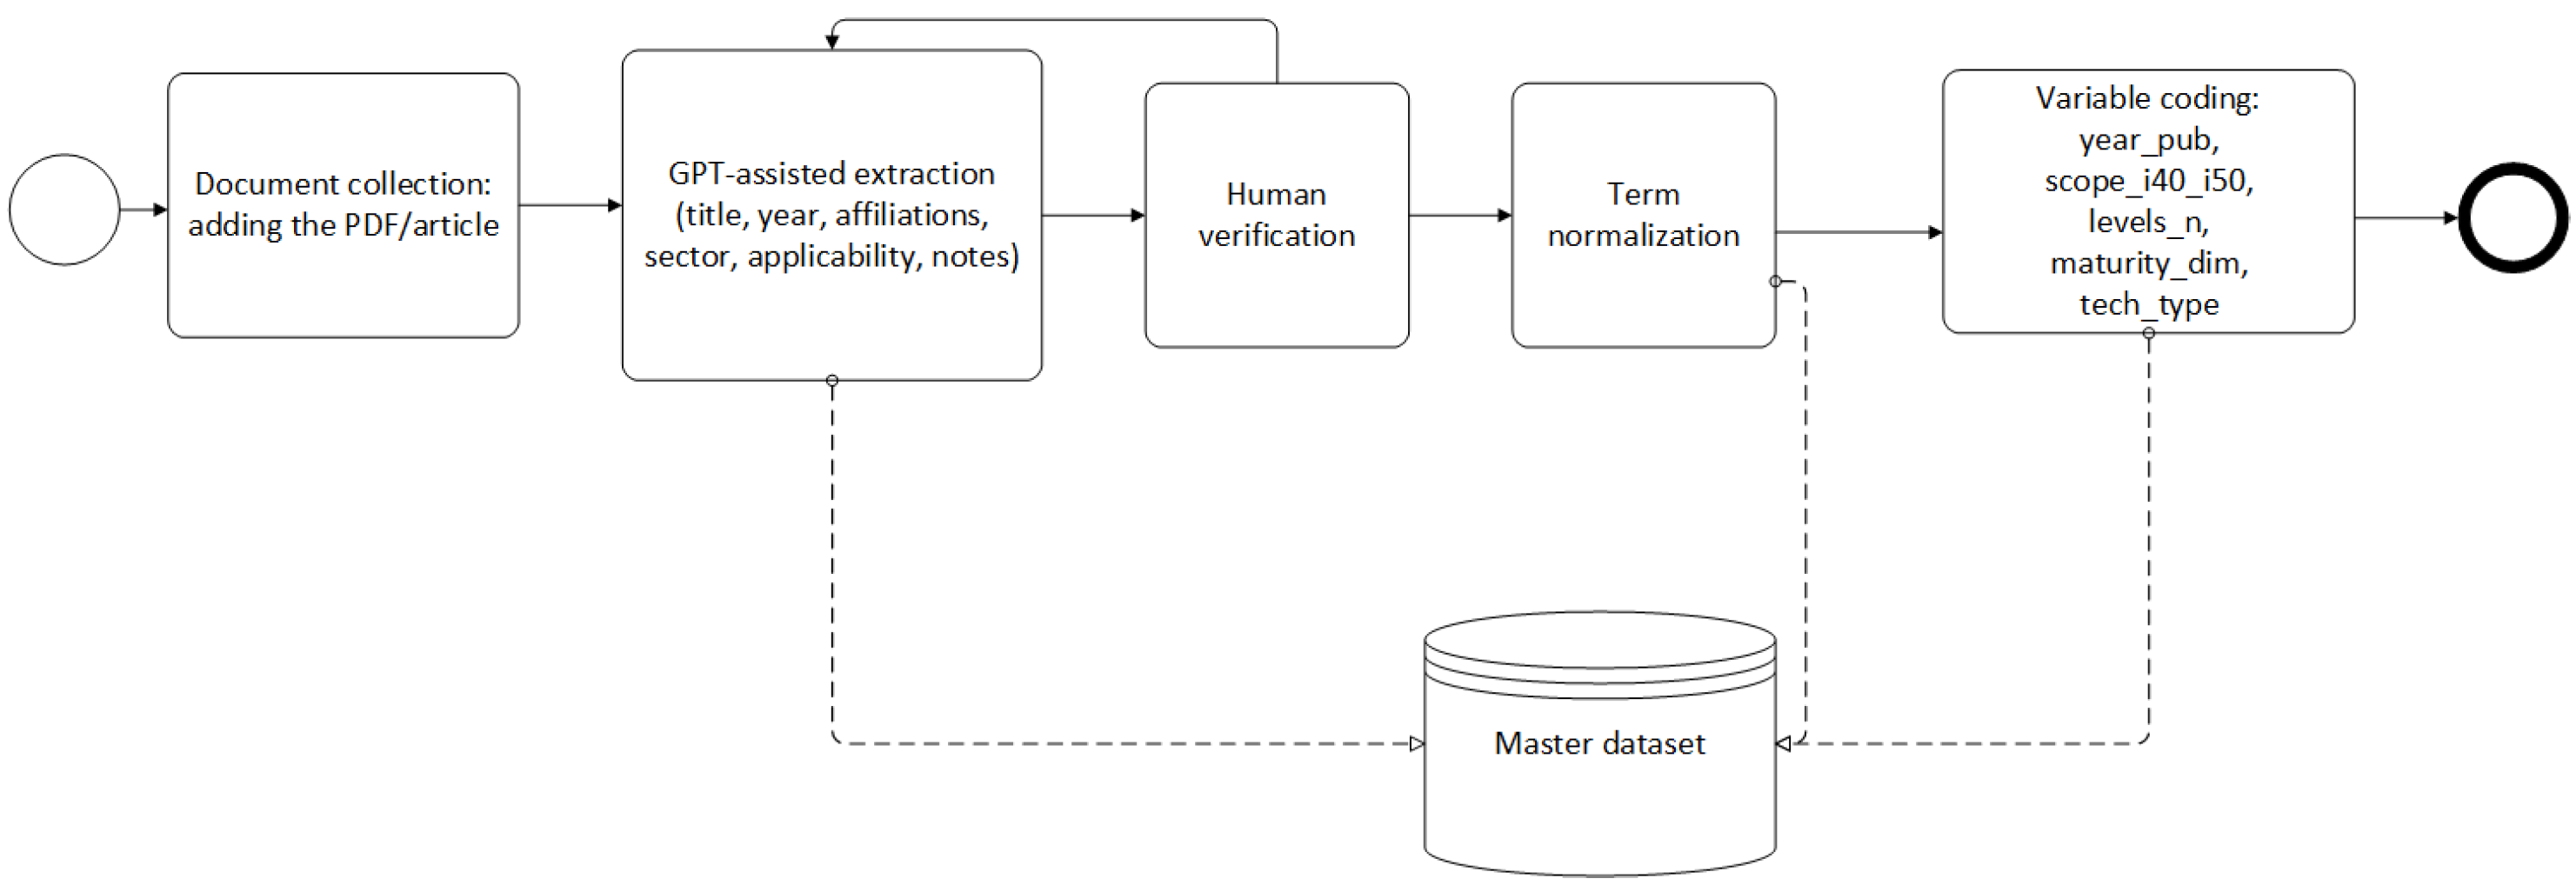
The data extraction and coding process (see
Figure 3) began with document collection, incorporating full-text articles (PDFs) and associated metadata into a document management system. This was followed by GPT-assisted pre-extraction using controlled, stepwise prompts designed to identify key elements, including title, year, author affiliations, sectoral focus, applicability mentions, validation approaches, and reported limitations or research gaps. The GPT agent was used strictly as a primary extractor to support scalability and consistency; it did not perform final coding or interpretation.
To ensure transparency and reproducibility of the AI-assisted extraction process used for RQ1–RQ4, the full interaction protocol and step-by-step instructions provided to the GPT-based agent are documented in
Appendix C. This protocol specifies the rules, scope, and sequential tasks guiding the identification of maturity models, their classification (Industry 4.0/5.0), sectoral scope, validation evidence, applicability to developing-country contexts, and inclusion or exclusion decisions. The agent was used exclusively as a primary extractor to support scalability and consistency, while all final coding, interpretation, and analytical decisions were performed by the authors through systematic human verification.
All automatically extracted outputs were subsequently subjected to complete human verification. Reviewers checked the accuracy, conceptual validity, and traceability of each extracted item against the source article. For research gaps (RQ5), GPT-assisted pre-extraction was conducted using a dedicated prompt specifically designed to identify explicit statements of prior gaps in the literature, limitations of the current study, and future research opportunities. The full prompt and detailed extraction instructions are documented in
Appendix D. During verification, reviewers explicitly distinguished between support at the level of the cited excerpt (
local textual support) and support at the level of the full document. In a small number of cases, gaps were conceptually present elsewhere in the article but not fully supported by the specific excerpt initially selected by the agent; these instances were treated as local citation misalignments rather than false-positive identifications and were corrected during verification.
Institution names and country affiliations were then standardized, after which the development level of each model was assigned. This variable was operationalized using the World Bank country income classification applied to the affiliation country of the lead author. In addition, a Global category was used for models that explicitly self-identify as global in scope or are developed by multinational consortia without a clearly dominant national anchoring. This approach provides a transparent and reproducible proxy for comparative analysis, but it does not capture within-country heterogeneity, transnational research trajectories, diaspora effects, or potential decoupling between the institutional origin of a model and the contexts in which it is validated or applied. Accordingly, development level is interpreted in this study as an indicator of institutional origin rather than as a comprehensive descriptor of contextual grounding.
Using the cleaned and normalized dataset, the core analytical variables (type_authorship, development_level, applicability_mention, validation_method, and sectorization) were coded according to predefined rules, with explicit boundary conditions applied where necessary to ensure consistency and reproducibility. For RQ5, thematic analysis of reported research gaps was conducted through inductive coding, iterative grouping, and triangulation, resulting in the variable gap_theme. To assess the robustness of the AI-assisted extraction and standardization process, a stratified audit covering 10% of the extracted gaps was conducted, balanced across gap types. The audit evaluated excerpt-level textual support, fidelity of standardization, and correctness of gap-type classification, and informed minor corrections to the dataset.
The first three phases of the workflow (review design, document retrieval, and data extraction/coding) are shared with our previous metatypology study [
17]. However, the extraction template and coding scheme were extended in the present study to capture additional variables related to authorship configuration, development level, empirical validation, sectoral focus, and research gaps, in direct alignment with the research questions addressed here.
All extracted data used to generate the figures and results are available in an open repository (version v1; DOI: 10.5281/zenodo.17454112) under the title “Industrial Digital Maturity (I4→I5)—75 Models, 2020–2024”. The repository includes the full dataset as well as a BibTeX file listing all primary sources used in the analysis and can be accessed at
https://zenodo.org/records/17454113, accessed on 27 October 2025.
2.5. Analytical Procedures
This section describes how the data were processed and analyzed for each research question (RQ). Building on the five-phase workflow shown in
Figure 1, the analytical procedures are grouped into four main families: (i) descriptive statistics, (ii) inferential statistics, (iii) text mining and qualitative analysis, and (iv) visualization and bibliometrics. A separate subsection summarizes the software environment used for data processing and analysis.
2.5.1. Descriptive Statistics (RQ1–RQ5)
Descriptive statistics were used to summarize and present the distributions of all variables defined in
Section 2.2 (Operationalization of Variables and Categories). For each variable, absolute (N) and relative (%) frequencies were computed, as well as cross-tabulations where relevant. These descriptive results provide the empirical basis for the figures and tables reported in
Section 3 and serve as inputs for subsequent inferential analyses. For RQ1, the distributions by country of origin and authorship type informed the geographic and collaboration visualizations. For RQ2 and RQ3, contingency tables were constructed for
Authorship ×
Applicability Mention and
Development Level ×
Applicability Mention. For RQ4, validation method and sectorization were summarized both individually and in combination. For RQ5, frequencies and percentages of gap themes derived from the text-mining pipeline were calculated.
2.5.2. Inferential Statistics (RQ2, RQ3, RQ4)
Associations between categorical variables were examined using contingency-table analyses. Pearson’s chi-square tests of independence () with a significance level of were considered when expected cell frequencies were adequate for asymptotic inference. For each table, observed and expected frequencies, values, degrees of freedom (), and p-values were computed, and standardized residuals were inspected when informative.
For cross-tabulations related to RQ2 and RQ3, small subgroup sizes produced sparse tables with low expected cell frequencies. In these cases, inferential analysis relied on exact tests. Specifically, Fisher’s exact test was used for tables, and its generalization to tables (Fisher–Freeman–Halton test) was applied using Monte Carlo approximation (20,000 simulations). All Monte Carlo simulations were conducted with a fixed random seed (seed = 20,260,113) to ensure full reproducibility of the results.
The variable Applicability to developing-country contexts was originally coded into three categories (explicit mention, implicit or partial mention, and no mention). Implicit applicability was coded when the study did not explicitly claim relevance for developing or emerging economies, but contextual features of the empirical setting strongly suggested such applicability, for example when validation was conducted in organizations located in developing regions, focused on SMEs operating under resource-constrained conditions, or embedded in infrastructural or institutional contexts typically associated with emerging economies. This full categorization was retained for descriptive reporting. For inferential analyses in both RQ2 and RQ3, the variable was operationalized as a binary indicator (any mention vs. no mention) to improve analytical tractability under sparse data conditions while preserving interpretability.
Effect sizes were reported using Cramér’s
V to complement significance testing, particularly given limited statistical power in small categories. All inferential analyses were conducted in
R using base functions for contingency-table testing, including Fisher’s exact test with Monte Carlo simulation. Specific results for the cross-tabulations
Authorship ×
Applicability Mention (RQ2),
Development Level ×
Applicability Mention (RQ3), and
Sectorization ×
Validation Method (RQ4) are presented in
Section 3.
In addition, to assess whether the distribution of models across target sectors departed from a neutral reference pattern (RQ4), a chi-square goodness-of-fit test was conducted on the frequency counts of
Sector_Objetivo. As a benchmark, a uniform distribution across the observed sector categories was used (i.e., equal expected counts per sector), serving as a transparent reference for detecting over- and under-representation. Because several sectors occur with low frequencies,
p-values were obtained via Monte Carlo simulation (10,000 replicates; fixed random seed = 20,260,113). To support interpretation beyond statistical significance, effect size was reported using Cohen’s
w (equivalently,
), and standardized residuals were inspected to identify the sector categories contributing most to deviations from the benchmark. Prior to the goodness-of-fit analysis, sector labels were harmonized into a reduced set of analytically meaningful macro-sectors to avoid artificial fragmentation due to synonymous or highly specific sector descriptions. For the sectoral analysis (RQ4), target sectors reported in the original studies were harmonized into a set of normalized sector categories prior to statistical testing. This normalization step was required to reduce terminological heterogeneity across studies and to enable meaningful goodness-of-fit testing under highly asymmetric distributions. The normalization criteria, including mapping rules and decision logic for ambiguous or compound sector labels, are fully documented in
Appendix B.
2.5.3. Text Mining and Qualitative Analysis (RQ5)
For RQ5, 562 text fragments related to gaps and limitations were extracted from the 75 maturity-model articles and incorporated into the dataset as individual records. A Natural Language Processing (NLP) pipeline was then applied in four steps: (i) preprocessing, (ii) inductive coding, (iii) thematic grouping, and (iv) quantitative–qualitative triangulation. Preprocessing included tokenization, stop-word removal, lemmatization, and part-of-speech tagging, implemented with NLTK [
18] and spaCy [
19]. Based on the preprocessed text, inductive coding was performed manually by the authors to identify recurrent gap statements, which were then grouped into broader themes (e.g., empirical validation, sectoral coverage, SME orientation, sustainability, implementation tools). Finally, the thematic structure was triangulated with quantitative frequencies to obtain the distribution of gap types reported in
Section 3.
2.5.4. Visualization and Bibliometrics (RQ1)
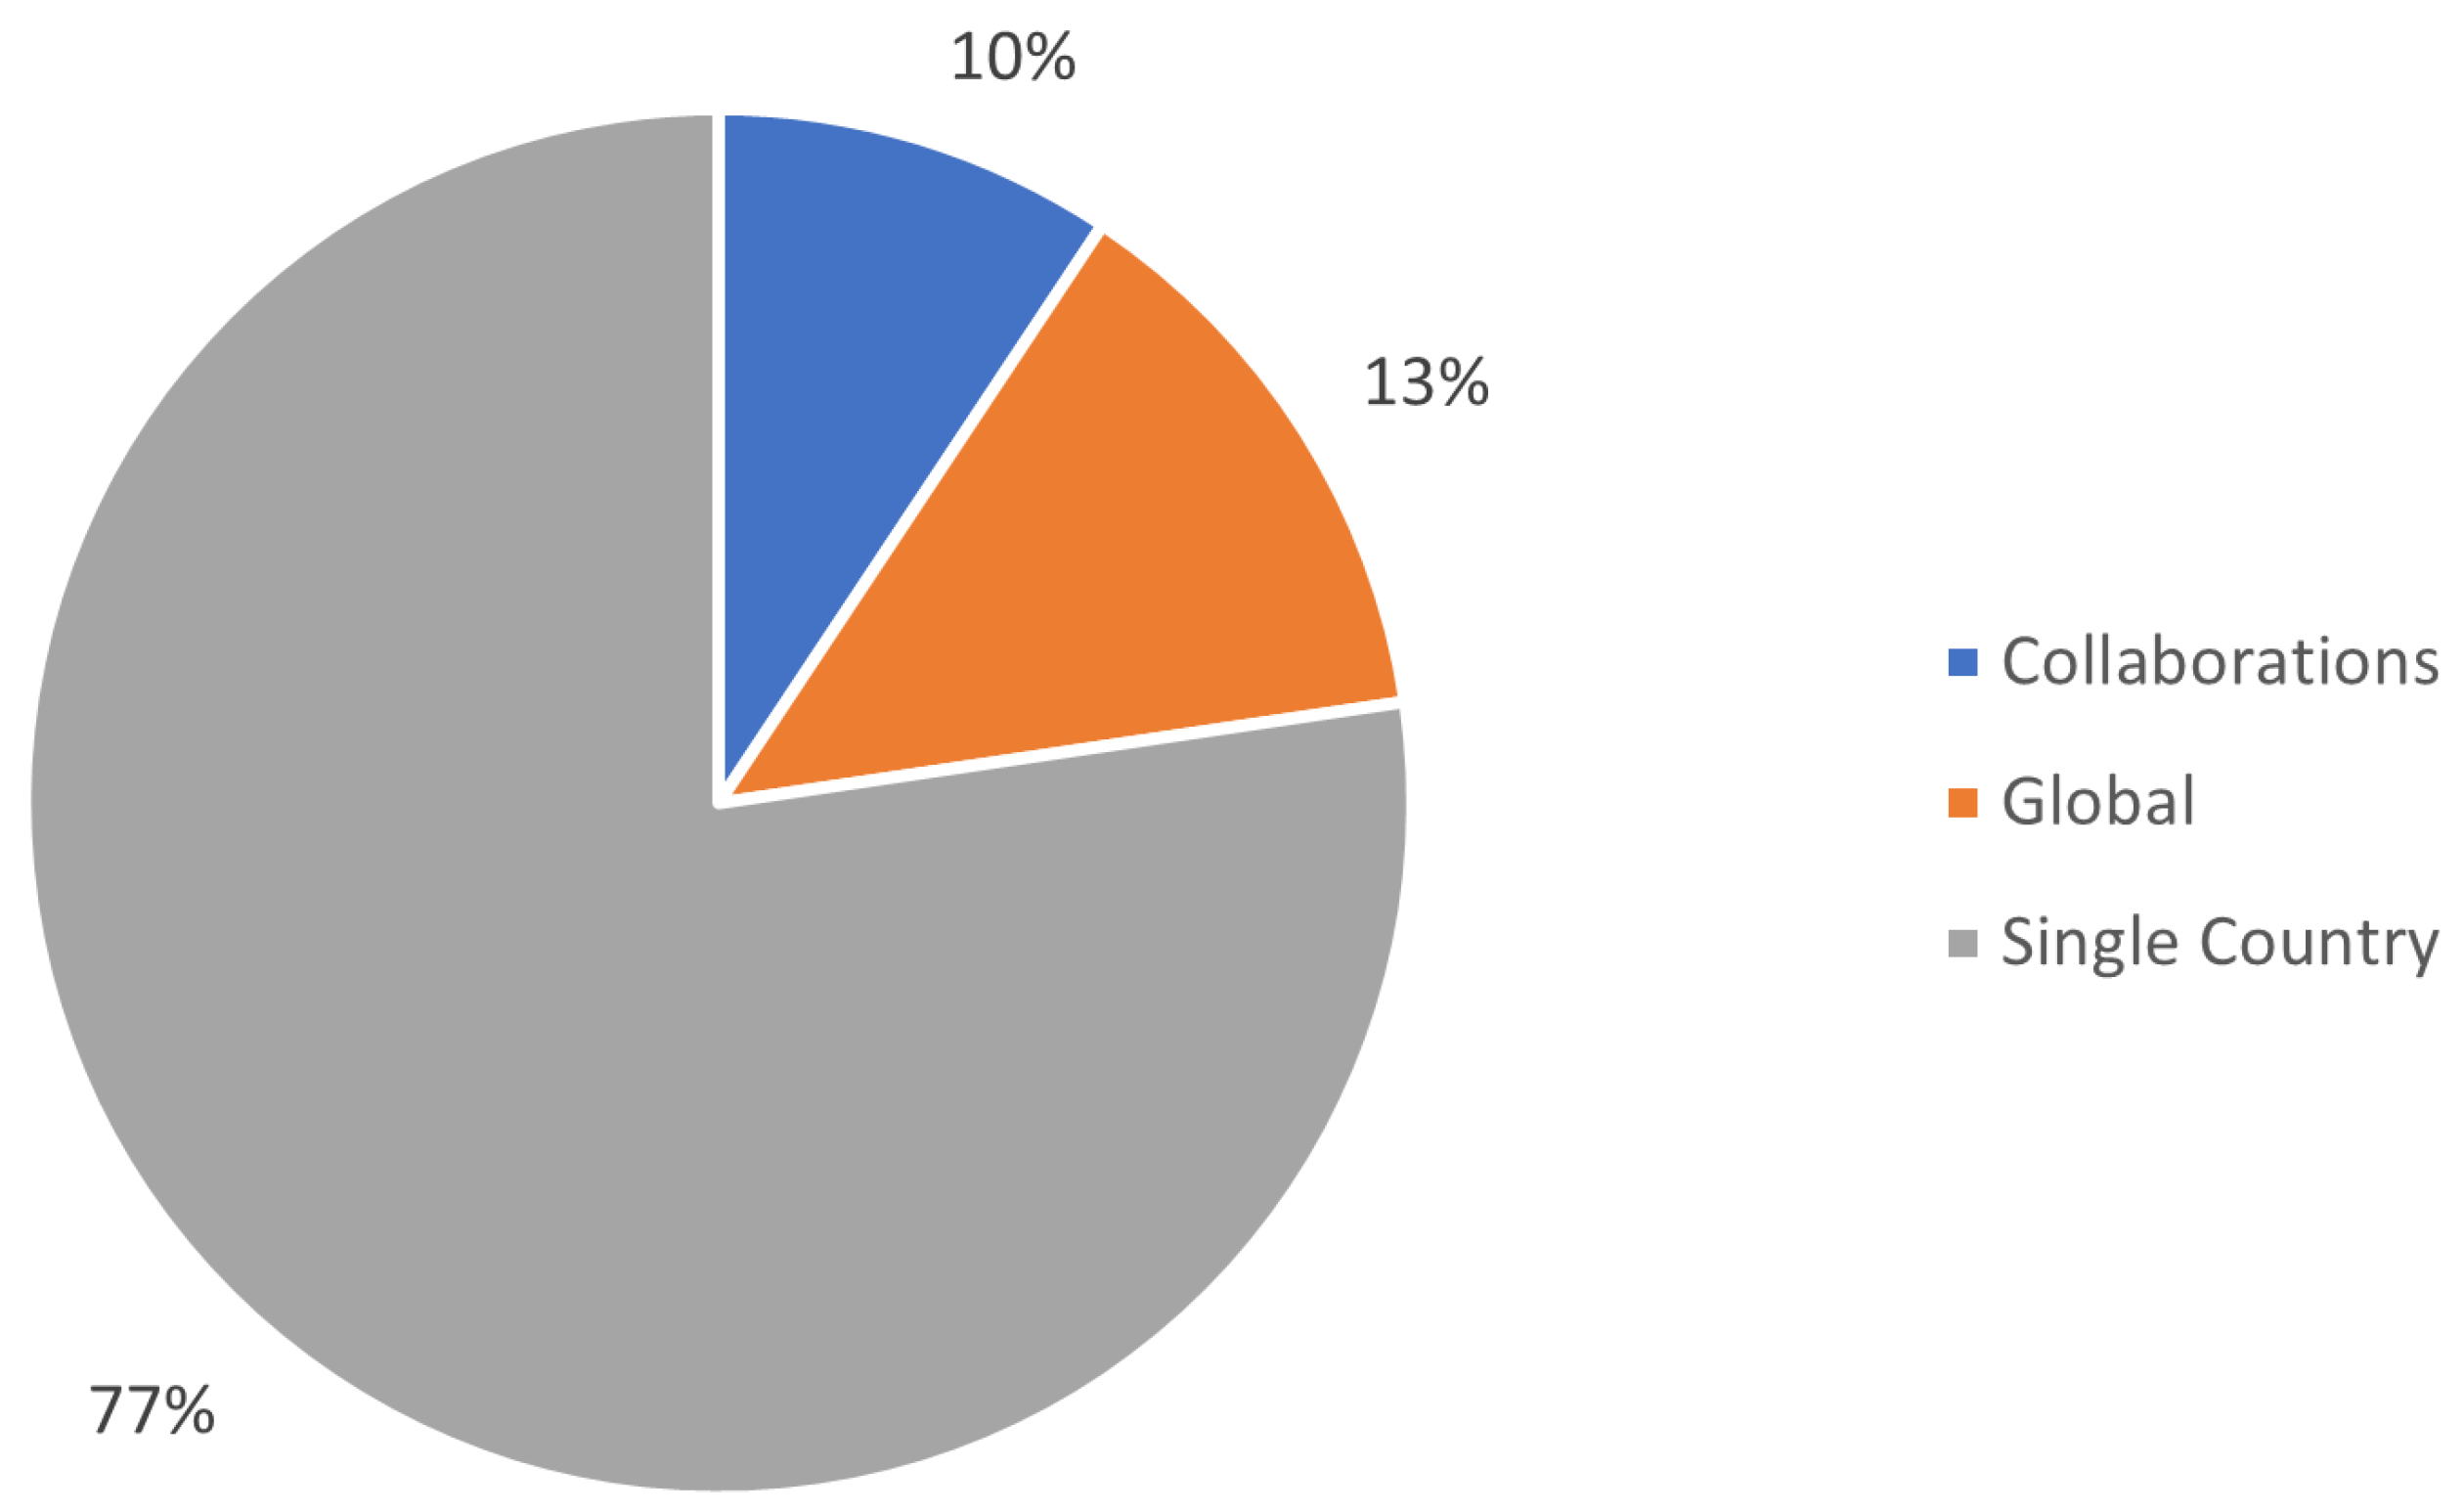
To represent the geographical origin of the models and the patterns of international collaboration underpinning knowledge production (RQ1), a set of visualizations and bibliometric analyses was produced. The distribution of maturity models by authorship configuration (single-country, international collaboration, and global) was first visualized using a pie chart created in Microsoft Excel (see
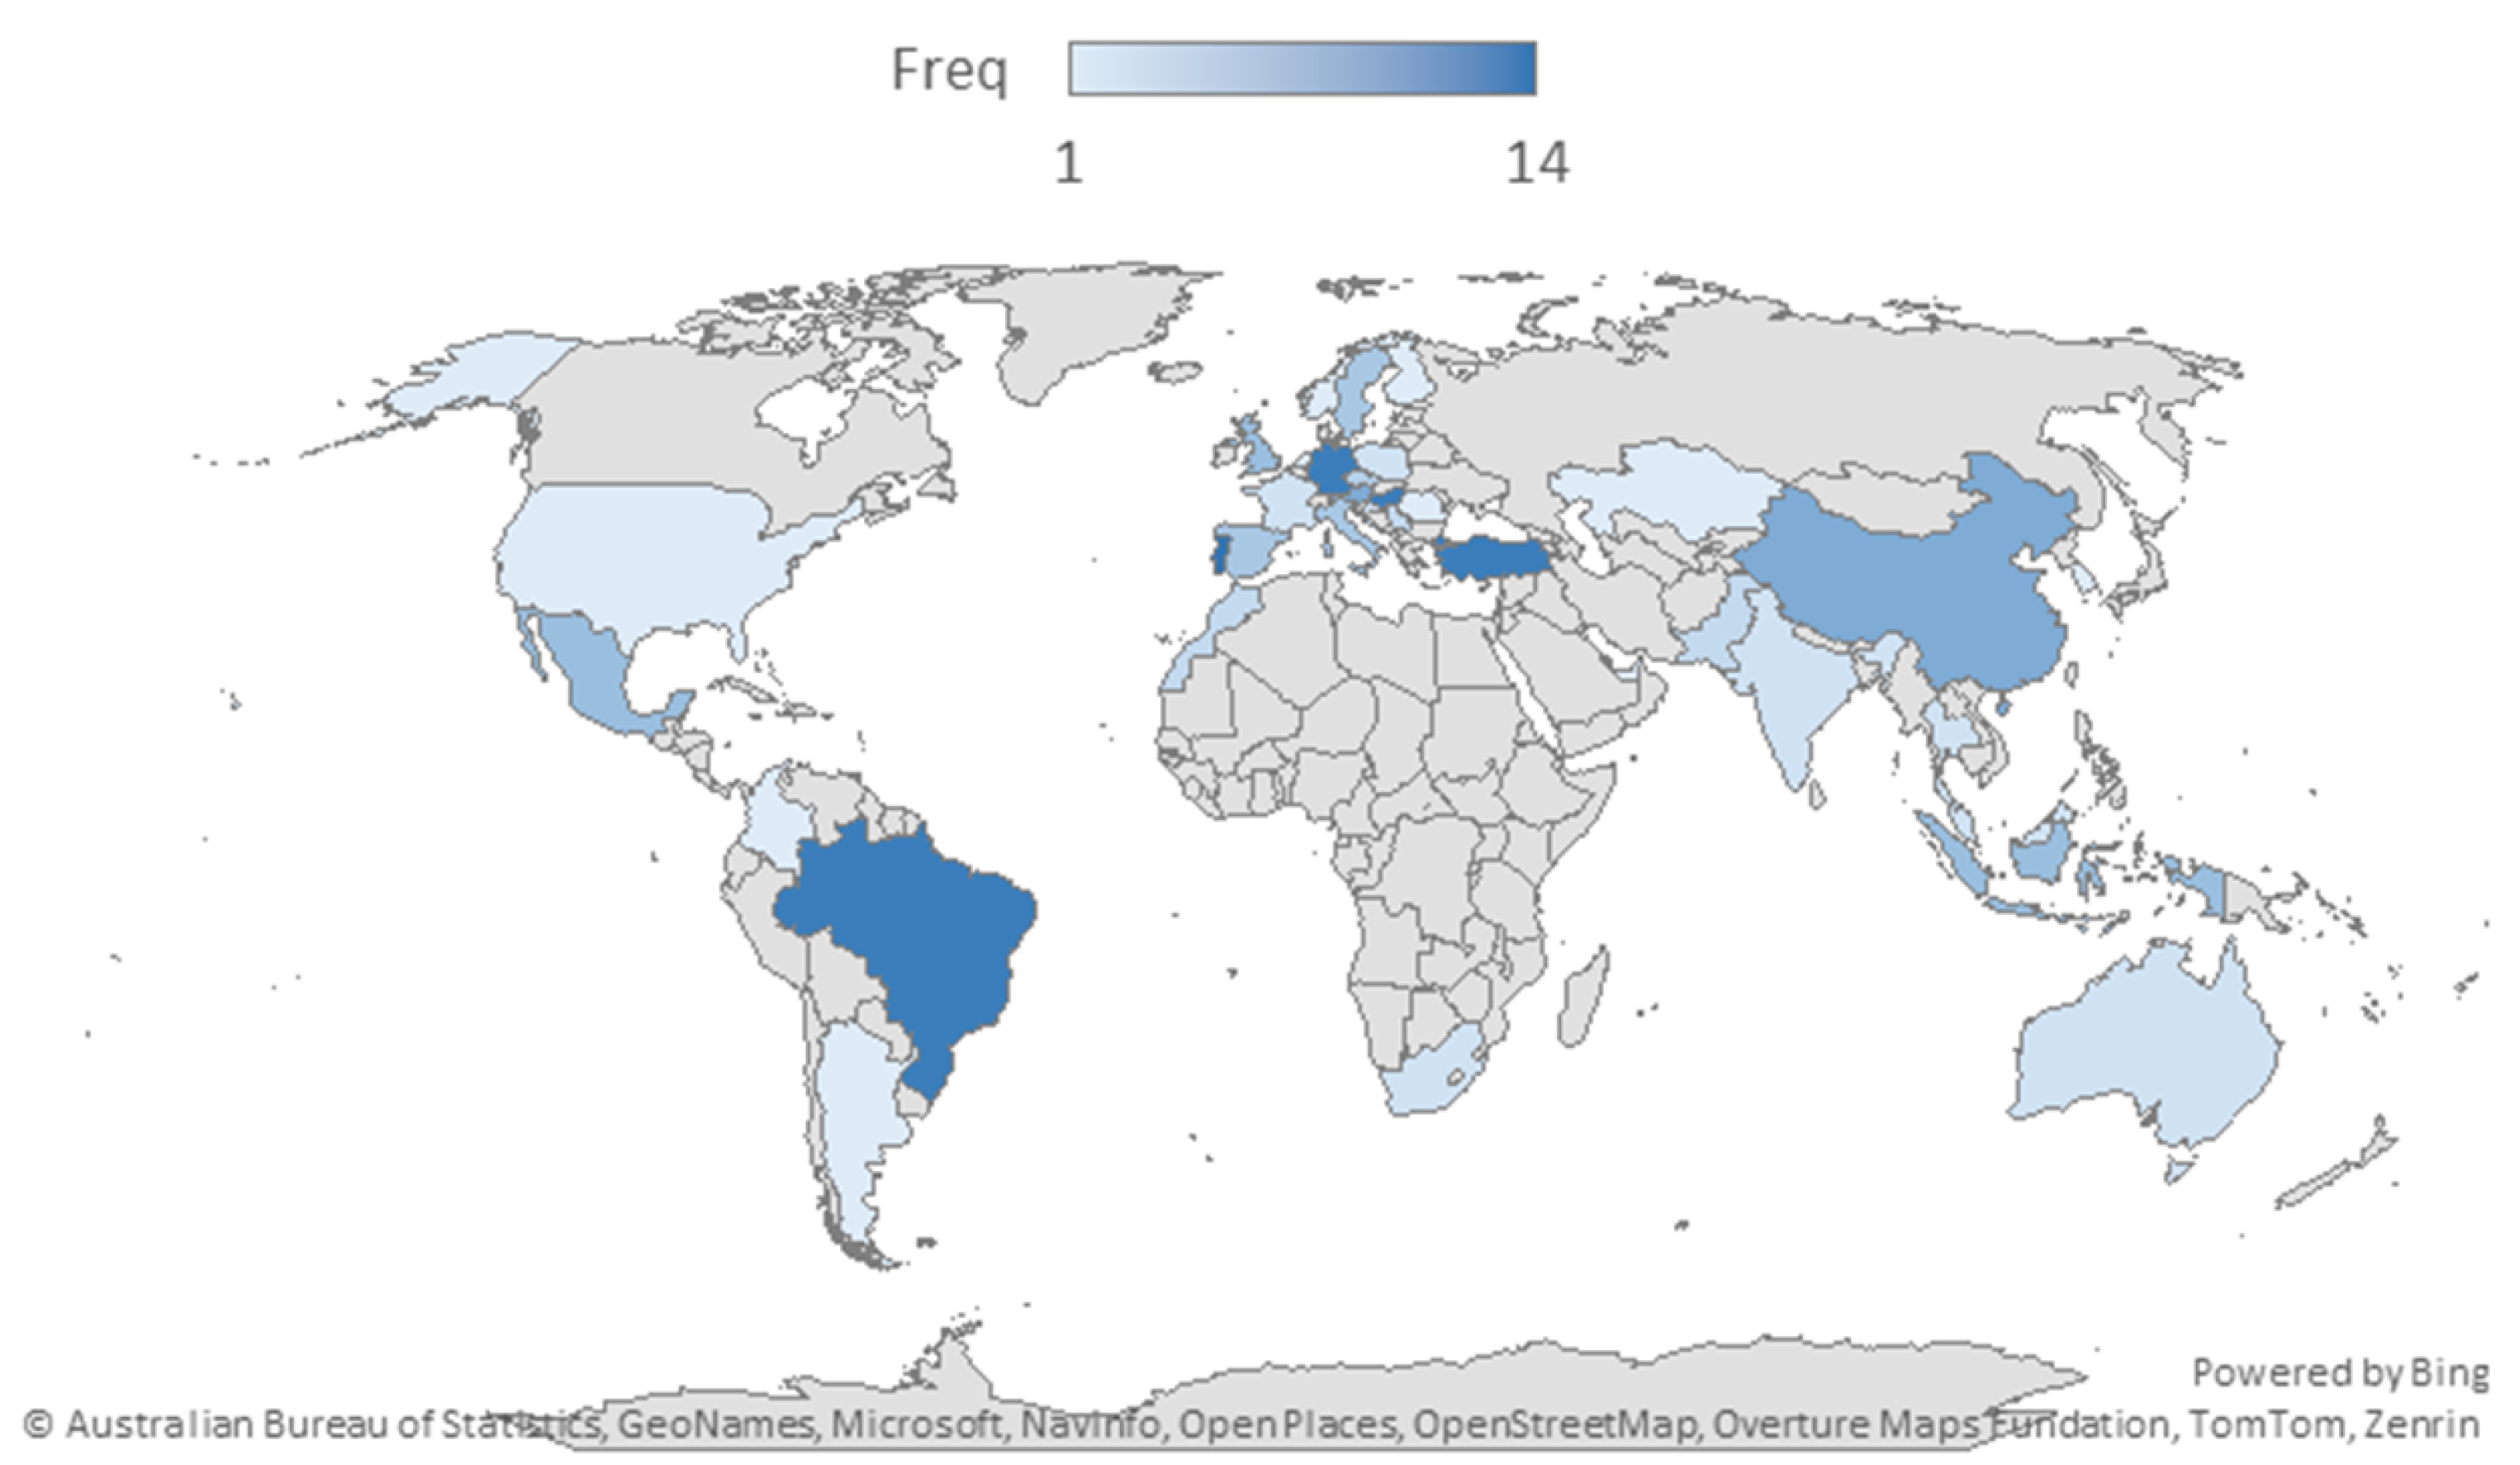
Figure 4), based on descriptive frequency counts derived from the curated dataset. Choropleth maps of geographical origin were then generated using the Power Map add-in for Microsoft Excel [
20], shading countries by the number of maturity models identified (see
Figure 5). International co-authorship networks were constructed with the Bibliometrix package for R [
21], based on a country–country collaboration matrix in which each row represents at least one co-authored article between two countries (e.g., “GERMANY–BRAZIL–1”). From this matrix, collaboration networks were visualized to highlight regional clusters and cross-regional ties (see
Figure 6).
2.5.5. Software Environment
All data processing and statistical analyses were conducted in Python 3.11. Tabular data were managed and transformed using the
pandas library [
22], which was also used to construct the contingency tables and descriptive summaries reported in
Section 3. Chi-square tests of independence were implemented with the
chi2_contingency function from
scipy.stats in SciPy [
23]. For the NLP pipeline described above, NLTK [
18] and spaCy [
19] were used for tokenization, lemmatization, stop-word removal, and part-of-speech tagging. Bibliometric analyses (including co-authorship networks) were carried out with Bibliometrix in R [
21], and choropleth maps of geographical origin were developed using the Power Map add-in for Microsoft Excel [
20].
2.6. Traceability Matrix: RQs–Method–Result–Evidence
To support methodological transparency and reproducibility,
Table 3 links each research question (RQ) to the corresponding variables, methods, evidence, and the main results discussed in
Section 3.
Table 3.
Traceability matrix linking research questions (RQ) to variables, methods, evidence, and results.
Table 3.
Traceability matrix linking research questions (RQ) to variables, methods, evidence, and results.
| RQ | Variable(s) | Procedure (Methods) | Evidence/Artifact | Linked Result |
|---|
| RQ1—Origin of Knowledge | V1; V2 | Section 2.4
Section 2.5.1
Section 2.5.4
Section 2.5.5 | DS1—dataset of 75 maturity models
Figure 4—origin by authorship type
Figure 5—geographical distribution by country
Figure 6—origin and collaboration networks | R1.1 Concentration of Industry 4.0/5.0 maturity models in a small group of developed countries, especially in Europe.
R1.2 International collaboration networks dominated by institutions from developed economies, with limited South–South ties. |
| RQ2—Authorship and Applicability | V1 | Section 2.4
Section 2.5.1
Section 2.5.2
Section 2.5.5 | DS1—dataset of 75 maturity models
Table 4—authorship × applicability to developing-country contexts | R2.1 Evidence is insufficient to detect systematic differences in applicability to developing-country contexts by authorship type.
R2.2 Small subgroup sizes limit statistical power, suggesting caution in interpreting non-significant differences. |
| RQ3—Development Level and Applicability | V2 | Section 2.4
Section 2.5.1
Section 2.5.2
Section 2.5.5 | DS1—dataset of 75 maturity models
Table 5—development level × applicability to developing-country contexts | R3.1 An exploratory association is observed between development level of institutional origin and the likelihood of mentioning applicability to developing-country contexts.
R3.2 Models originating in developing economies show higher rates of explicit or implicit applicability mentions, within the limits imposed by sparse categories. |
| RQ4—Validation and Sectors | V3; V4 | Section 2.4
Section 2.5.1
Section 2.5.2
Section 2.5.5 | DS1—dataset of 75 maturity models
Table 6—validation status distribution
Table 7—sectoral focus distribution
Figure 7—target sectors (specific)
Table 8—sectoral focus × validation
Table 9—validation by primary sector | R4.1 Most models report some empirical validation, dominated by surveys and case studies of limited scale.
R4.2 Sectoral coverage is highly skewed toward manufacturing, with statistically significant under-representation of other sectors.
R4.3 Multisectoral scope is often declared but less frequently demonstrated through cross-sector validation. |
| RQ5—Research Gaps | V5 | Section 2.4
Section 2.5.1
Section 2.5.3
Section 2.5.5 | DS1—dataset of 75 maturity models
Figure 8—distribution of gap types | R5.1 Recurrent gaps concern limited empirical validation, narrow sectoral scope, and lack of longitudinal or cross-country evidence.
R5.2 Many gaps highlight insufficient attention to developing-country contexts, SMEs, and resource-constrained environments.
R5.3 Explicit Industry 5.0 dimensions are infrequently operationalized and empirically validated.
R5.4 Open tools, datasets, and implementation resources remain rare, limiting replication and adoption. |
Table 4.
Cross-distribution of Authorship Type × Applicability to Developing-Country Contexts (RQ2).
Table 4.
Cross-distribution of Authorship Type × Applicability to Developing-Country Contexts (RQ2).
| Origin | Explicit Mention | Implicit or Partial Mention | No Mention at All | Total |
|---|
| Collaborations | 1 | 0 | 6 | 7 |
| Global | 1 | 0 | 9 | 10 |
| Single-country | 5 | 6 | 47 | 58 |
| Total | 7 | 6 | 62 | 75 |
Table 5.
Cross-distribution of Development Level × Applicability to Developing-Country Contexts (RQ3).
Table 5.
Cross-distribution of Development Level × Applicability to Developing-Country Contexts (RQ3).
| Development Level | Explicit Mention | Implicit or Partial Mention | No Mention at All | Total |
|---|
| Developed | 0 | 1 | 35 | 36 |
| Developing | 6 | 5 | 16 | 27 |
| Global | 1 | 0 | 9 | 10 |
| Mixed | 0 | 0 | 2 | 2 |
| Total | 7 | 6 | 62 | 75 |
Table 6.
Distribution of maturity models by validation status ().
Table 6.
Distribution of maturity models by validation status ().
| Validation Status | Models | % of Total |
|---|
| Not validated (no evidence) | 11 | 14.7% |
| Simulation/Demo (laboratory environment) | 4 | 5.3% |
| Survey (questionnaire data) | 18 | 24.0% |
| Single case study (one case study) | 17 | 22.7% |
| Multiple case studies (≥2 case studies) | 25 | 33.3% |
| Total | 75 | 100% |
Table 7.
Distribution of maturity models by level of sectoral focus ().
Table 7.
Distribution of maturity models by level of sectoral focus ().
| Level of Sectoral Focus | Models | % of Total |
|---|
| Specific (defined sector) | 57 | 76.0% |
| Multisector (multiple sectors) | 14 | 18.7% |
| Undefined (general sector) | 4 | 5.3% |
| Total | 75 | 100% |
Table 8.
Relationship between sectoral scope and validation status. Number of maturity models by combination of sectoral focus and validation type ().
Table 8.
Relationship between sectoral scope and validation status. Number of maturity models by combination of sectoral focus and validation type ().
| Sectoral Focus∖Validation | Not Validated | Simulation/Demo | Survey | Single Case | Multiple Cases |
|---|
| Specific | 7 | 3 | 13 | 17 | 17 |
| Multisector | 1 | 1 | 4 | 0 | 8 |
| Undefined | 3 | 0 | 1 | 0 | 0 |
Table 9.
Validation methods by primary sector of the models. Distribution of validation types used across the five most frequent target sectors.
Table 9.
Validation methods by primary sector of the models. Distribution of validation types used across the five most frequent target sectors.
| Primary Sector | Not Validated | Simulation/Demo | Survey | Single Case | Multiple Cases |
|---|
| Manufacturing | 3 | 2 | 9 | 8 | 12 |
| Manufacturing (SMEs) | 1 | 0 | 2 | 2 | 1 |
| Automotive | 0 | 0 | 0 | 0 | 3 |
| Multisector (NA) | 0 | 1 | 1 | 0 | 0 |
| Textile | 0 | 0 | 1 | 0 | 1 |
2.7. Use of AI Tools
As part of the data extraction and synthesis process, we used controlled, task-specific prompts with a large language model to assist in the systematic extraction of research gaps. This AI assistance was strictly limited to the **initial identification of candidate text segments** according to predefined criteria. All extracted content was subsequently subjected to **complete human verification** and manual coding by the authors; no part of the manuscript was generated by AI without human oversight.
Detailed procedures for AI-assisted extraction, including verification and auditing protocols, are documented in
Section 2.4.
3. Results
This section presents the empirical results structured around the research questions. Geographical patterns of model origin and collaboration are reported in
Figure 4,
Figure 5 and
Figure 6, and their relationship with explicit applicability to developing-country contexts is examined in
Table 4 (RQ2) and
Table 5 (RQ3). Empirical validation strategies and sectoral concentration are analysed in
Table 6,
Table 7 and
Table 8, with subsector-level detail provided in
Figure 7 (RQ4). Finally, the synthesis of research gaps and limitations identified by primary studies is presented in
Section 3.6, including the distribution of gap types (
Figure 8) and their dominant thematic patterns (RQ5).
3.1. Applicability and Geographical Origin
A relevant analysis derived from the maturity model dataset concerns their applicability in the context of developing countries and how the model’s origin influences such applicability. Based on the available data, it is possible to identify key patterns and trends that help to understand both the opportunities and challenges related to the adoption of these models across different economic and geographic contexts.
To this end, the distribution of the 75 maturity models published between 2020 and 2024 was examined, classified into three categories according to the country of origin and type of collaboration: Single-Country, Collaborative, and Global. This classification followed the criteria defined in the methodology:
Single-Country: models developed and published entirely from one country;
Collaborative: those resulting from joint efforts between two or more nations (e.g., identified as “Collaboration (Italy–Poland)”); and
Global: models that are not explicitly linked to any specific national context in their documentation, suggesting a universal scope or orientation.
The frequency analysis (see
Figure 4) revealed that 58 models, representing approximately 77.3% of the total, fall into the Single-Country category; 7 models (9.3%) correspond to the Collaborative category; and 10 models (13.3%) were classified as Global.
These results show that the majority of maturity models are created within a national framework (Single-Country), followed by a smaller share developed through international collaborations and globally oriented approaches. This distribution provides an initial indication of prevailing trends in knowledge production within this field, suggesting that the literature base is largely rooted in local initiatives. It also raises important questions about how the origin, whether individual, collaborative, or global, might influence the applicability of these models in developing countries contexts.
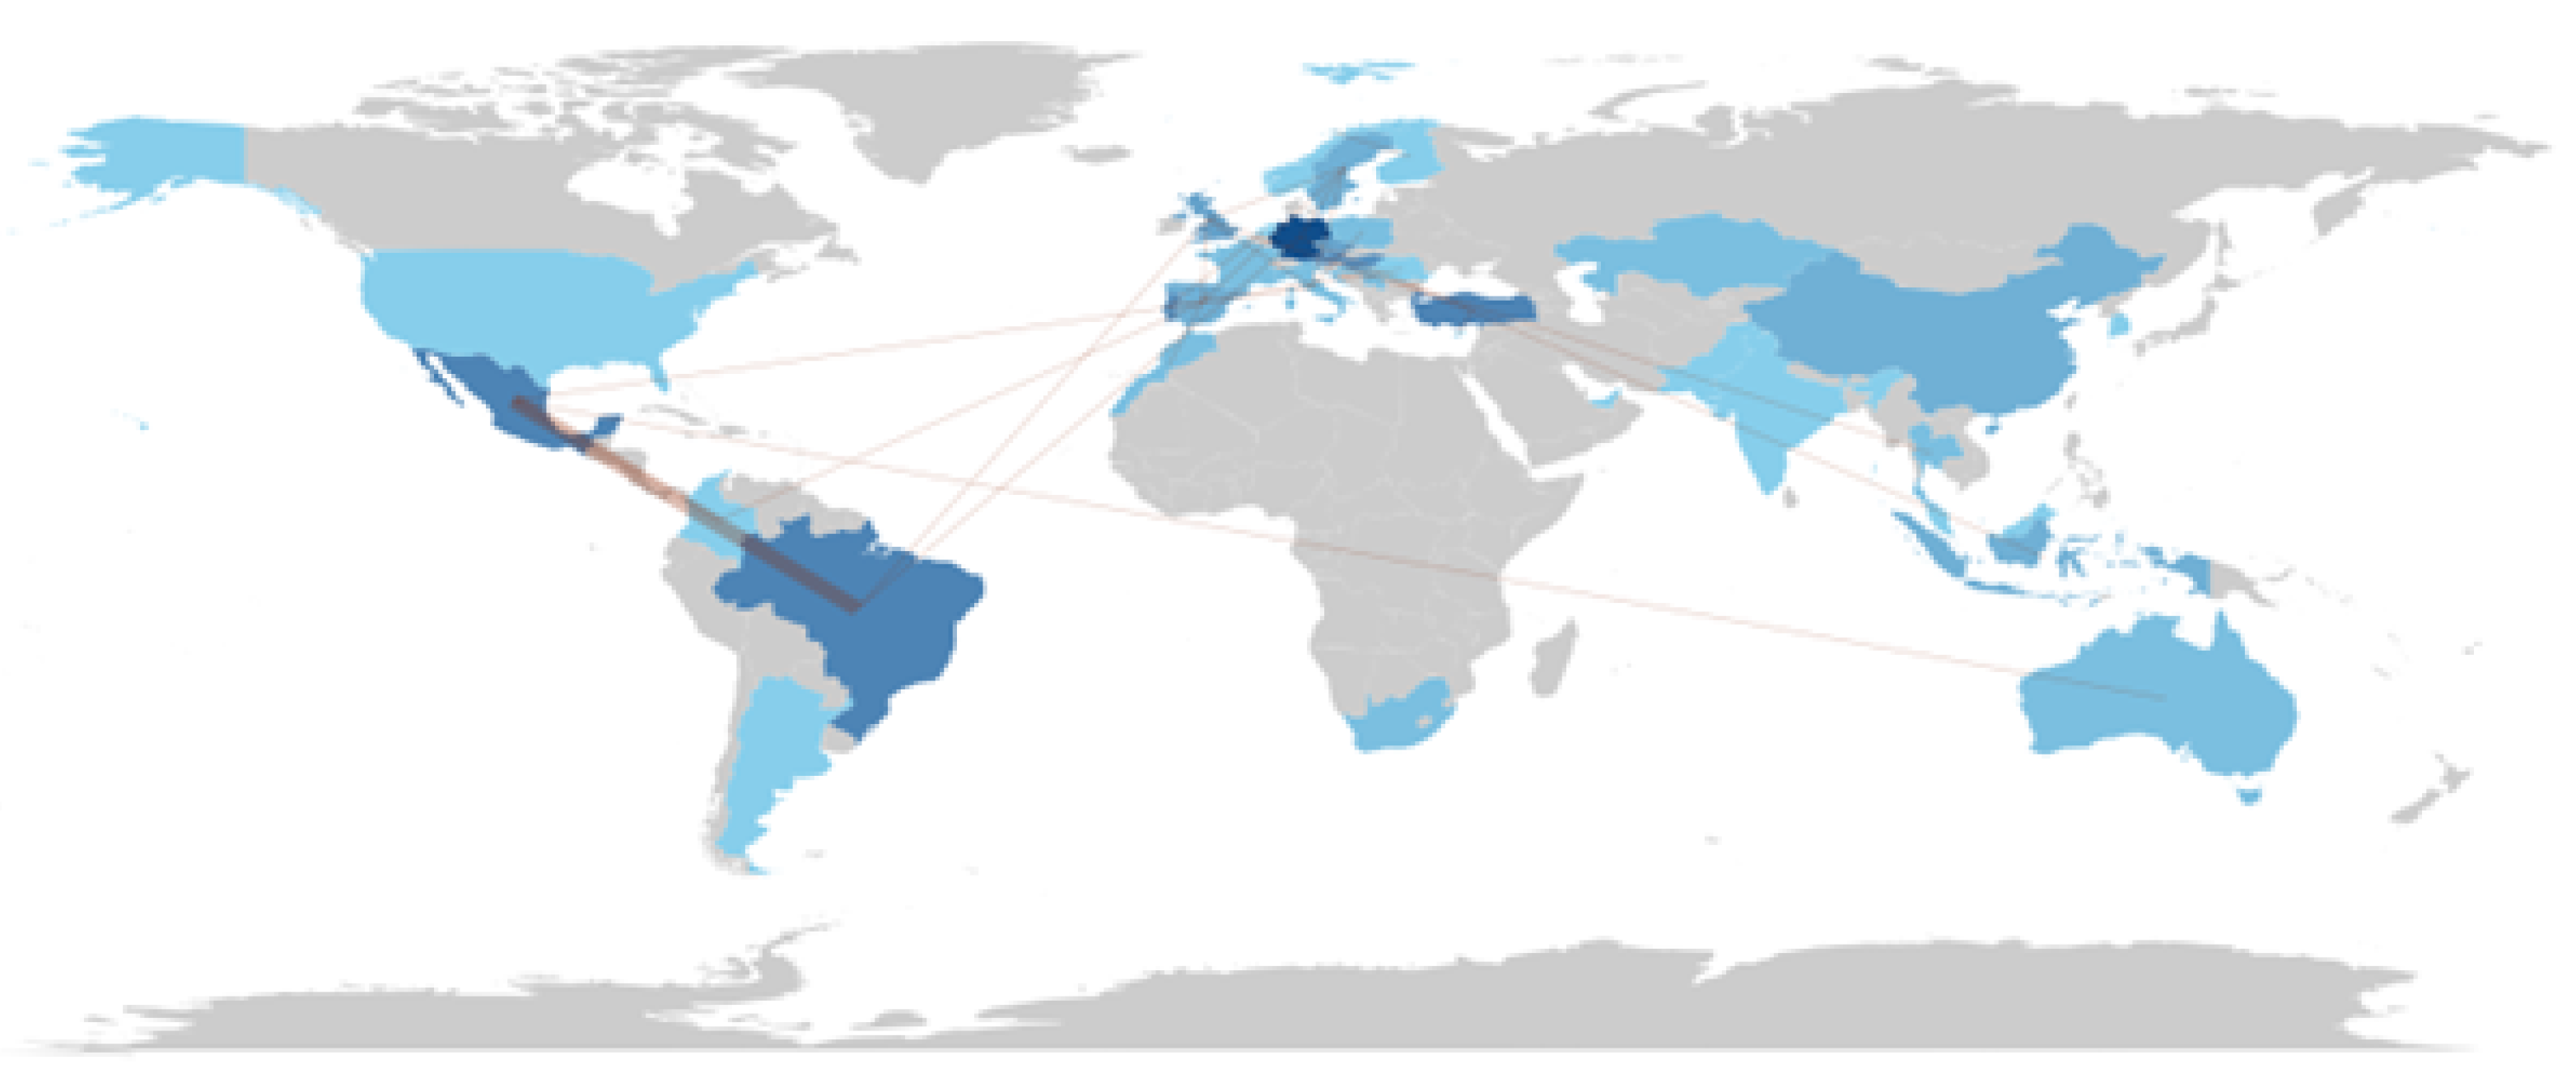
On the other hand, the geographical distribution is highly uneven (see
Figure 5). Nearly half (48%) of the models originate from developed countries, and just over one-third (36%) from developing economies; the remainder come from models declared as “global” with no specific country of reference or from mixed collaborations with limited scope. Europe overwhelmingly dominates model production, accounting for around 60% of the total, led by Germany and supported by strong contributions from other countries such as Portugal, Italy, and Spain. Asia ranks second with approximately 27% of the models, particularly from Turkey, Indonesia, and other industrialized economies in the region, while Latin America accounts for only 13%, almost exclusively due to Brazil and Mexico. Africa, North America (beyond a single U.S. study), and Oceania appear only marginally, each represented by one model.
These distributions indicate a strong concentration of model production in developed economies, with relatively fewer contributions from emerging regions.
In addition to analyzing the individual distribution of models, the network of international collaborations was also examined (see
Figure 6). For this analysis, a matrix was created in which each row represents a collaboration between two countries (e.g., “GERMANY–BRAZIL–1” indicates that at least one article was co-authored by authors from Germany and Brazil).
A large share of collaborations occurred among European countries, including partnerships between Finland and Norway, Italy and Poland, Italy and Spain, and Portugal with the Netherlands and Romania, as well as various interactions among the United Kingdom, Sweden, Italy, and Spain. This highlights the high density and cohesion of the European bloc in knowledge production. Connections between Europe and other regions were also identified. For example, collaborations between Germany and Brazil (Europe–Latin America), Germany and Indonesia (Europe–Asia), as well as Mexico with Spain (Latin America–Europe) and Spain with Colombia (Europe–Latin America) indicate that Europe stands out not only for its internal output but also for its capacity for international cooperation. Similarly, collaborations between Austria and Thailand (Europe–Asia), and between Mexico and Australia (Latin America–Oceania), demonstrate the global dimension of these research networks. In Latin America, the collaboration between Brazil and Mexico is particularly noteworthy, with a frequency of 2, suggesting a strong connection within the region.
3.2. Origin vs. Applicability to Developing-Country Contexts (RQ2)
Descriptive row-wise analysis indicates that explicit references to applicability to developing-country contexts are uncommon across all origin categories. Within the Collaborations category, 14.3% of models include an explicit mention, while 85.7% do not address applicability. Among Global models, 10.0% include an explicit mention and 90.0% provide no reference. In the Single-country category, 8.6% of models include an explicit mention and 10.3% provide an implicit or partial reference, whereas 81.0% do not address applicability in developing-country contexts.
For inferential analysis, explicit and implicit mentions were collapsed into a single binary category (
any mention vs.
no mention), as described in
Section 2. Given the small size of several subgroups and the presence of low expected cell frequencies, asymptotic chi-square tests were not applied. Instead, the association between model origin and applicability to developing-country contexts was evaluated using a Fisher–Freeman–Halton exact test with Monte Carlo approximation (10,000 simulations).
The exact test indicates a statistically significant association between model origin and applicability mention (Monte Carlo
). The corresponding effect size, measured using Cramér’s
V, was approximately 0.47, indicating a moderate association in the analyzed dataset. Given the exploratory nature of the analysis and the limited size of some origin categories, these results are reported as evidence of association within the studied corpus and do not imply causal relationships. However, this association should be interpreted with caution. Several origin categories, particularly
Collaborative and
Global models, are represented by small cell counts (see
Table 4), which limits the stability of estimated associations. Although exact tests and effect sizes were employed to mitigate violations of asymptotic assumptions, the results should be understood as indicative patterns within the analyzed corpus rather than as definitive or generalizable evidence.
3.3. Development Level vs. Applicability to Developing-Country Contexts (RQ3)
To analyze the possible influence of the development level (classified as Developed, Developing, Global, and Mixed) on the mention of applicability in developing-country contexts, the following
contingency table (
) was created. As in the previous section, inferential statistical methods were applied (see Materials and Methods).
Table 5 shows the cross-distribution.
The results indicate that, within the Developed group, the vast majority of models (35 out of 36, 97.2%) make no reference to applicability in developing-country environments, and only one model (2.8%) includes an implicit mention. In contrast, within the Developing group, there is greater sensitivity to the topic: 22.2% of the models (6 out of 27) make an explicit reference and 18.5% (5 out of 27) make an implicit one, totaling 40.7% of models that address applicability in such contexts. Conversely, in the Global and Mixed categories, the trend mirrors that of the Developed group, with omission predominating (90% and 100%, respectively).
To test whether the observed differences were statistically significant, a chi-square test of independence was performed. With 6 degrees of freedom and a 5% significance level, the critical chi-square value is approximately 12.59. Since the obtained test statistic () exceeds this threshold, the result indicates .
The analysis indicates a statistically detectable association between the development level of the country (or countries) of origin and the way applicability in developing-country contexts is mentioned. This result should be interpreted as exploratory, given the presence of sparsely populated categories—most notably the
Mixed and
Global groups (
Table 5)—which constrain statistical power and the stability of effect estimates. Accordingly, the observed association is indicative of patterns within the reviewed literature rather than conclusive evidence of systematic differences. Specifically, models originating from Developing environments are more likely to include explicit or implicit mentions, in contrast to those developed in Developed countries, where such mentions are almost nonexistent.
At the same time, the limited participation of entire regions (e.g., Sub-Saharan Africa, Southeast Asia beyond a few economies, or North America beyond the United States) indicates geographical gaps where these models have had little penetration, or at least limited visibility, in the analyzed literature. This geographic pattern likely influences the applicability of maturity models in developing contexts. Since most models were created with industrialized environments in mind, they may incorporate implicit assumptions (advanced technological infrastructure, mature 4.0 ecosystems, high baseline digitalization) that do not hold true in many emerging economies. The fact that 83% of the studies do not discuss applicability in developing countries reinforces this interpretation: it implies that authors typically did not explicitly consider contextual differences in industries outside the developed world when formulating their models. Consequently, such models may not fit well in settings where manufacturing SMEs face capital, talent, or connectivity constraints that differ substantially from those in European or North American contexts.
Conversely, the few studies that do address applicability in emerging economies tend to come from authors based in those same contexts or from global analyses concerned with transferring Industry 4.0 practices to less developed regions. This points to an emerging awareness among part of the academic community regarding the need to adapt maturity models to diverse realities. The explicit mentions identified (in about 9% of the works) reflect deliberate efforts to consider local factors, such as technological gaps, government incentive policies, or cultural and organizational differences, that could affect the attainable 4.0 maturity level in developing countries. However, since these cases remain scarce, it is plausible that many model proposals still suffer from an origin bias, being calibrated primarily according to the experiences of advanced economies and thus limiting their universal validity.
Overall, the geographical analysis of Industry 4.0/5.0 maturity models reveals an uneven distribution with important implications for their global adaptability. The concentration of contributions in the developed world suggests that the characteristics and criteria of these models predominantly reflect the conditions of highly digitalized industries and favorable socioeconomic environments. This geographical focus may limit the capacity of these models to effectively adapt to developing contexts, where companies are often at very different stages of digitalization and face distinct structural challenges. In other words, the relevance and utility of many existing maturity models in developing countries remain questionable unless differences in resources, scale, and priorities are adequately considered.
Nonetheless, the landscape also reveals opportunities. The presence of several proposals originating from emerging economies (and some global initiatives) demonstrates that it is possible to reconceptualize maturity models by incorporating the perspective of developing countries. Although still in the minority, these emerging models could serve as starting points to enrich or reorient existing methodologies, emphasizing flexibility and contextualization. Ultimately, the findings suggest a pressing need to update and validate Industry 4.0/5.0 maturity models across a broader range of geographical environments. Only through greater geographical inclusiveness, fostering more balanced international collaborations and field studies in underrepresented regions, can the maturity assessment tools become truly universal and applicable across the full spectrum of industrial realities, from the most advanced economies to developing nations.
3.4. Validation Status and Sectoral Analysis
Among the main challenges in the development of maturity models are those related to empirical validation and clarity regarding their intended sectors of application. Through a systematic analysis of the selected maturity models, this section explores how the models have been validated, ranging from single case studies to surveys and simulations, and the diversity of industrial sectors they address. By identifying validation patterns, levels of sectoral focus, and their evolution over time, this section provides a critical perspective on the rigor and practical applicability of these models, as well as their sectoral orientation. This approach not only reveals trends and gaps in the literature but also lays the groundwork for the design of more robust and contextually relevant models, especially for developing-country settings.
3.4.1. Validation Status of Maturity Models (RQ4)
The validation quality of each model was analyzed based on the variable
Validation Method.
Table 6 summarizes the distribution of the 75 maturity models across the different categories of this variable.
It can be observed that nearly two-thirds of the models (55 out of 75) include validations through case studies: 17 models (23%) performed a single, in-depth case study (e.g., applied in one company), while 25 models (33%) conducted multiple case studies across different organizations or contexts. Another 24% (18 models) used survey-based validation, generally to measure perceived maturity levels across multiple firms simultaneously. In contrast, only 4 models (5%) were validated through simulation or demonstration in controlled environments (laboratory or pilot), making this the least frequent category. Finally, 11 models (15%) were published without any empirical validation, relying instead on theoretical foundations or the authors’ expert judgment.
Regarding the intensity of validation, notable differences exist across categories. Models with multiple case studies included on average ~6 real cases (median ), ranging from a minimum of 2 to a maximum of 32 in one exceptional model. By definition, single case study models each employed one case. For survey-based studies, the validation scale tends to be broader: excluding two cases where the sample size was not reported (recorded as 0), the surveys collected between 16 and 323 responses, with a median of approximately 70 participants. This indicates that many studies surveyed several dozen companies, and one case reached over 300 respondents (MM.12). In contrast, simulation/demo validations are typically not counted as empirical “cases”: three out of four simulation models reported no cases (), and only one model described three simulated scenarios as its form of validation. Overall, the majority of maturity models seek some level of empirical support, either through case studies or surveys, although the depth and robustness of the evidence vary widely, ranging from conceptual simulations or perception-based surveys to practical implementations in dozens of factories.
3.4.2. Level of Sectoral Focus of Maturity Models (RQ4)
To describe how the models are distributed according to their sectoral focus (Specific, Multisector, Undefined),
Table 7 summarizes the distribution by category.
As shown in
Table 7, an overwhelming majority of the analyzed maturity models, 57 out of 75 (76.0%), were developed with a specific sector in mind. This indicates that Industry 4.0/5.0 maturity research is largely dominated by sector-tailored approaches. In contrast, only 14 models (18.7%) claim a multisectoral scope, and a very small subset of 4 models (5.3%) do not define any particular sector, presenting themselves as general-purpose or horizontal frameworks.
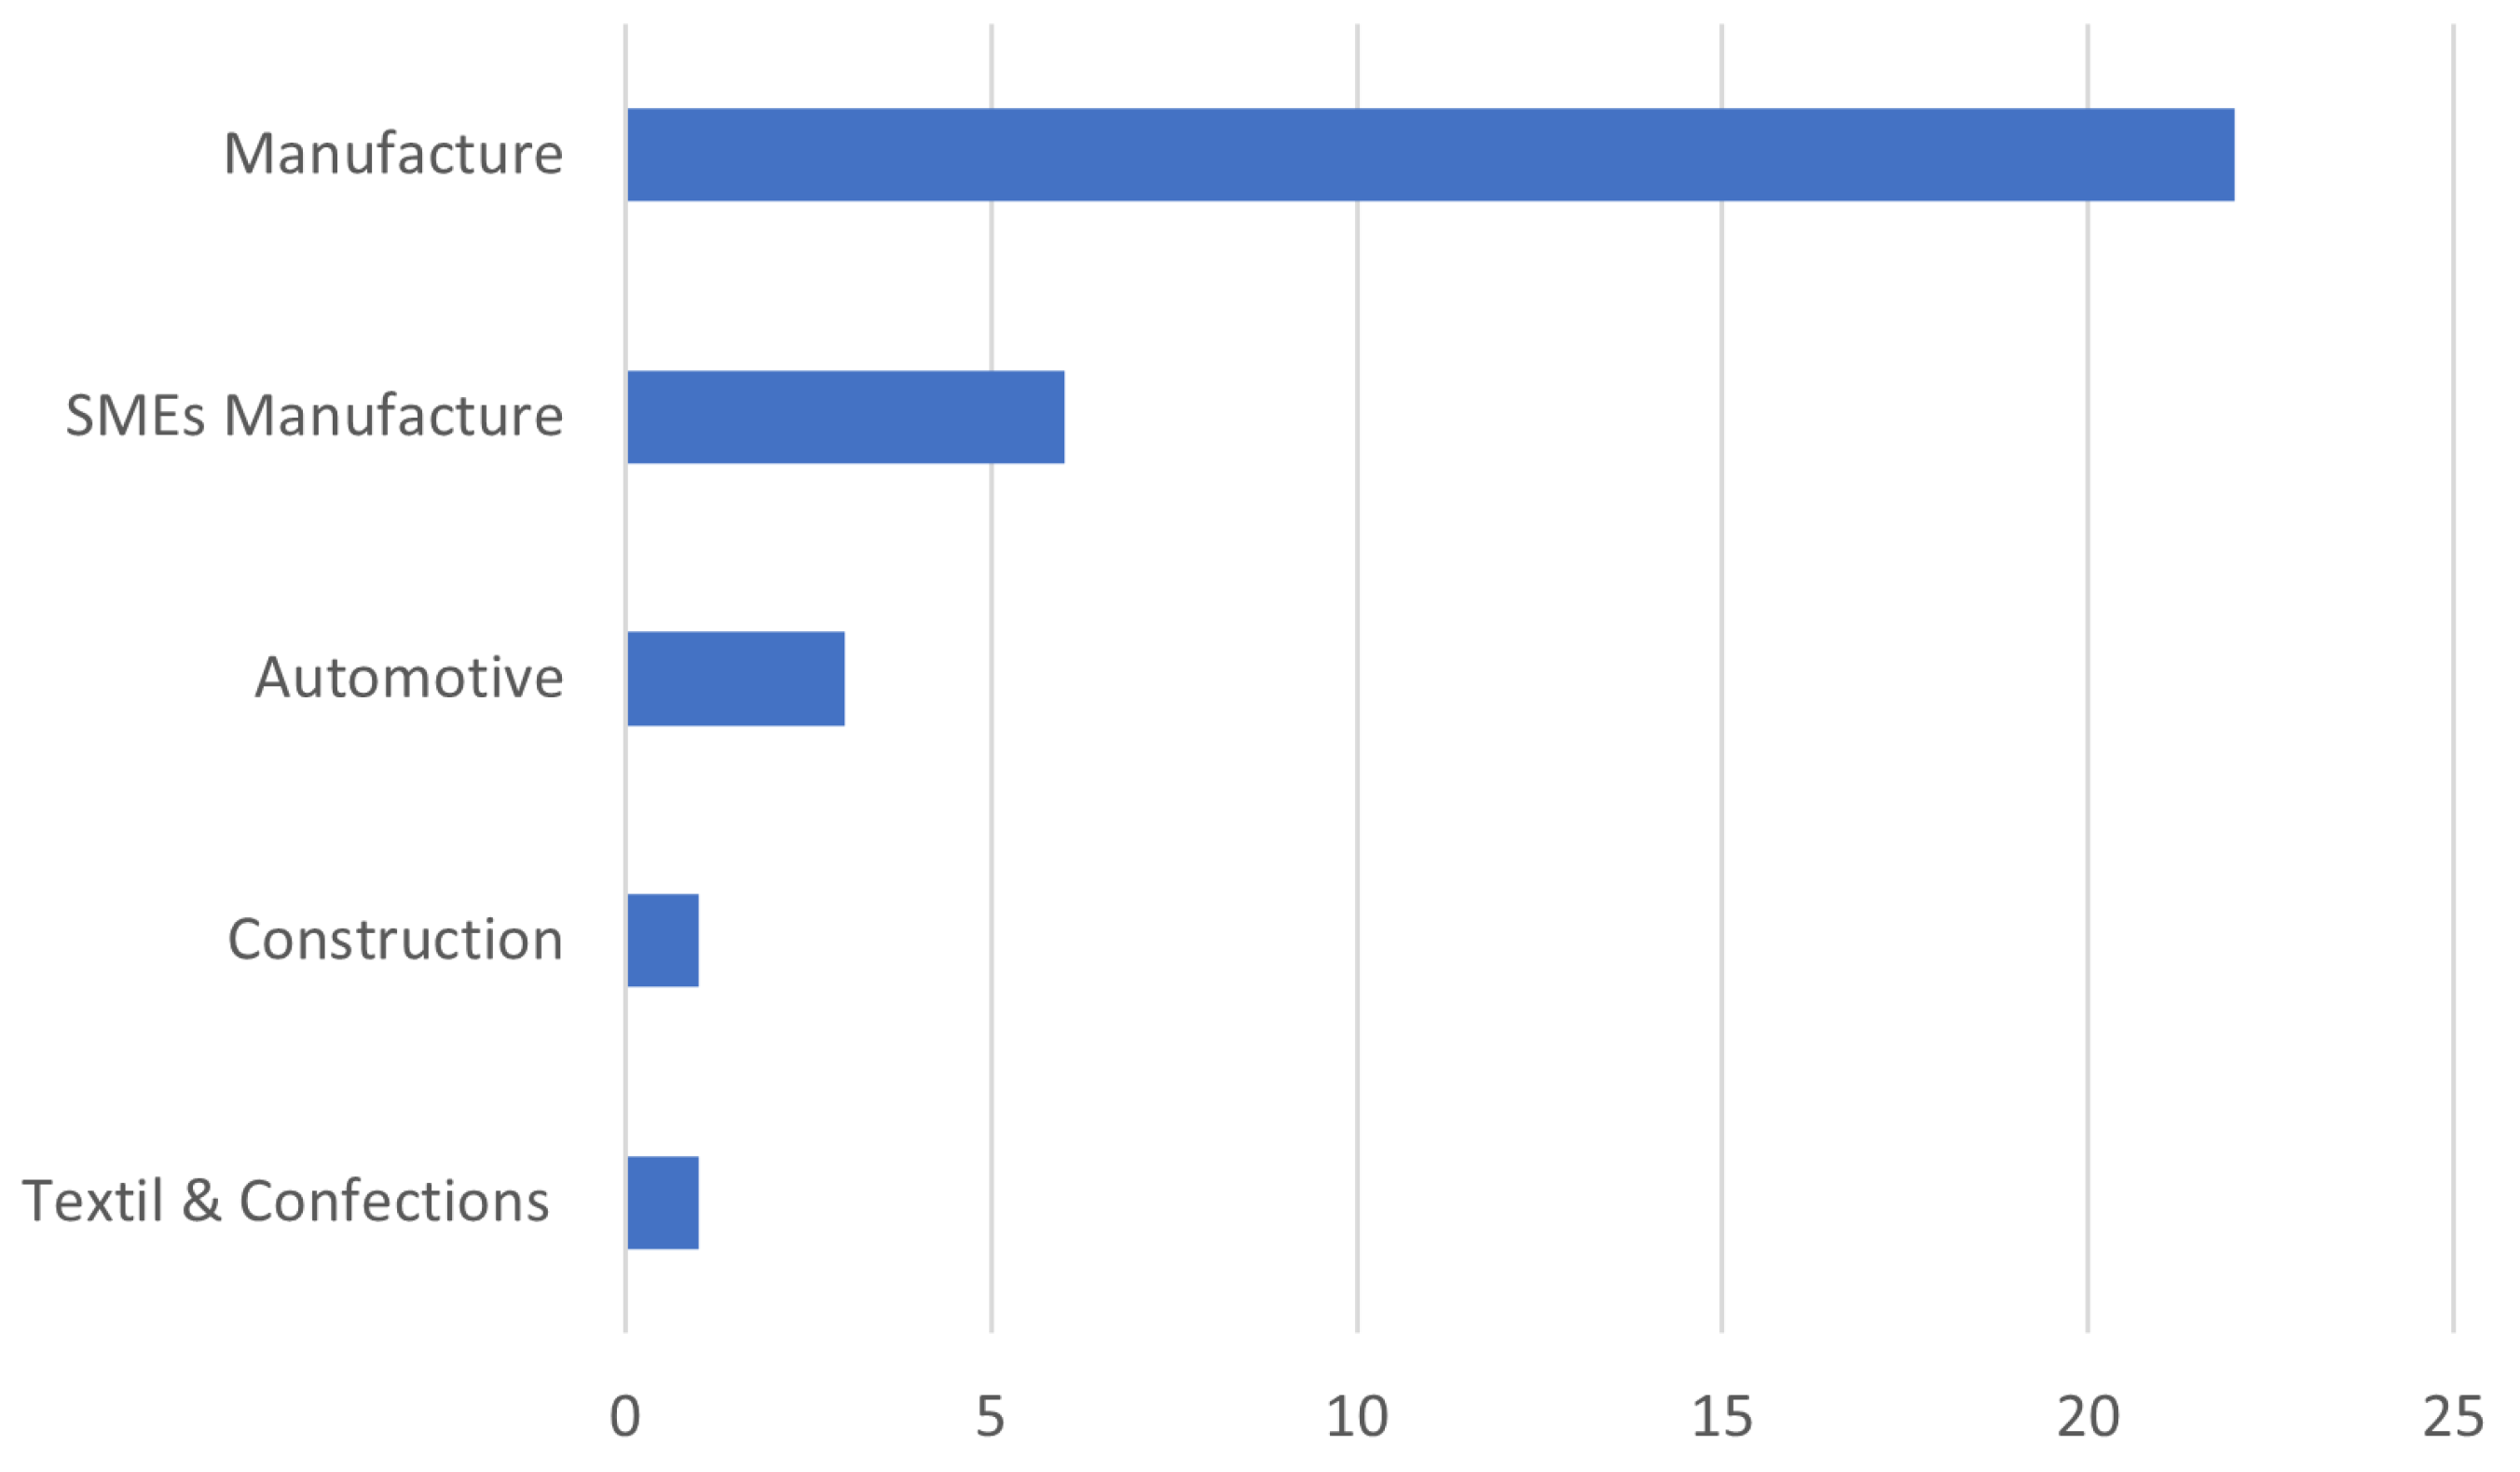
When examining the target sectors of the models classified as Specific, manufacturing and industrial production contexts clearly dominate the design space. Manufacturing-oriented models represent the largest share within this category, followed at a considerable distance by models targeting manufacturing SMEs and, to a lesser extent, the automotive sector. Beyond these cases, other sectors appear only sporadically, typically represented by one model each. Overall, sectoral coverage can therefore be characterized as broad but shallow: a relatively wide variety of sectors is mentioned across the corpus, but most are supported by very limited empirical and conceptual depth.
To formally assess whether this observed concentration reflects a statistically meaningful pattern rather than random variation, target sectors were harmonized into normalized sector categories following explicit criteria (documented in
Appendix B) and tested against a uniform benchmark using a goodness-of-fit test. Given the strong asymmetry in the distribution and the presence of small cell counts, inference relied on a Monte Carlo approximation. The results indicate that the observed sectoral distribution differs significantly from a uniform distribution (
), with a very large effect size (Cohen’s
), confirming a highly uneven representation of sectors in the analyzed maturity models.
Among the 14 multisector models, nearly all declare applicability to more than one sector. However, the degree of specification varies substantially. Some models explicitly list multiple distinct sectors, while others label themselves as multisectoral without detailing how sectoral differences are accounted for in the model structure or assessment criteria. Only a small number of multisector models clearly articulate differentiated sectoral scopes, which constrains meaningful comparative analysis between sector-specific and genuinely cross-sector frameworks.
Finally, the four models classified as having an undefined sectoral focus correspond to general-purpose approaches, often emphasizing horizontal dimensions such as organizational culture, workforce capabilities, or human–technology interaction rather than industry-specific characteristics. These models frequently align with Industry 5.0 perspectives that prioritize holistic and human-centric considerations over sectoral specialization.
Figure 7 provides a descriptive subsector-level view of the most frequently targeted sectors among models classified as
Specific. This visualization is intended to illustrate patterns of concentration within manufacturing and related domains. Statistical inference regarding sectoral concentration, however, is conducted on normalized sector categories, as reported above, to ensure analytical robustness under highly asymmetric distributions.
3.5. Relationship Between Sectoral Focus and Validation (RQ4)
Given that differences exist both in sectoral scope and in validation methods, it is pertinent to analyze how these two dimensions intersect. The following contingency table (
Table 8) cross-tabulates the level of sectoral focus (rows) with the validation status (columns) of each model.
Table 9 then provides a more detailed breakdown, showing how the five most frequent sectors employed each type of validation.
Several trends can be drawn from this table. First, Undefined models (general-purpose frameworks) show the highest proportion of non-validation: 3 out of 4 (75%) were not validated. This suggests that the more theoretical or universal frameworks, often associated with Industry 5.0 visions, remain largely at the conceptual level.
In contrast, Multisector models are usually validated: 13 out of 14 (93%) include some type of empirical evidence. Notably, none of the multisector models relied on a single case study (0 single cases), likely because a model designed for several industries cannot be sufficiently demonstrated through a single case. Instead, multisector validations are mainly divided between surveys (4 models) and, especially, multiple case studies (8 models). This indicates a preference for gathering broad evidence, either through cross-sectoral surveys or by applying the model in multiple organizations from different industries, to support multisector applicability. Only one multisector model lacks validation (a 2023 case, possibly an emerging conceptual framework).
Specific models, on the other hand, exhibit a more balanced distribution of validation methods. Being the largest category (57 models), they also dominate in absolute numbers across all validation types. However, it is noteworthy that even among the specific models, 7 (12%) lack validation, reflecting that not all sectoral proposals reached the testing phase. Within partial validations, 3 specific models employed simulations. Surveys were used in 13 specific models, typically focusing on manufacturing SMEs, where it is feasible to survey a large number of firms. Case studies are almost evenly split: 17 specific models used single case studies (e.g., one automotive company), while another 17 employed multiple case studies within the same sector (e.g., several manufacturing plants). This indicates that both validation strategies are common in sector-specific models, some emphasizing in-depth exploration of a representative organization, and others seeking generalization within a sector through multiple implementations.
The table above provides a deeper sector-level perspective. Manufacturing (general) accounts for 34 models employing a variety of validation methods, with multiple case studies (12 models) and surveys (9 models) standing out as the most frequent, reflecting the abundance of empirical research in manufacturing environments. Only 3 manufacturing models lack validation, a relatively low percentage given the sector’s prominence.
For Manufacturing SMEs, out of six total models, two were either unvalidated or minimally validated, while two conducted survey-based studies (e.g., national surveys of industrial SMEs) and three performed one or more case studies.
Interestingly, Automotive models (3 total) were all validated through multiple case studies, meaning each automotive model was tested in more than one setting (for example, across several plants or divisions within an automotive company).
In contrast, in the Textile/Apparel sector, the two available models used distinct validation strategies: one employed a survey (a perception study across textile firms) and the other multiple case studies (applied across several textile factories), showing methodological diversification even with limited samples.
The Multisector (NA) row in the table corresponds to models whose “primary sector” was undefined (marked as Multisector in the dataset). Among these two models, one used a survey and the other a simulation, aligning with the previously noted tendency of broad-scope models to rely on survey-based or pilot-simulation evidence rather than single-case demonstrations.
Illustrative Cases of Exceptional Validations and Atypical Sectors in the Sample
One model (see
Appendix E, MM.12) took quantitative validation to the highest level by conducting an extensive survey among hundreds of manufacturing companies to assess their maturity level. With 323 responses collected, this study presents the largest
in the entire sample, demonstrating the feasibility of obtaining maturity metrics at a national scale. This approach stands in stark contrast to the majority of models, which rarely exceed a few dozen observations.
A recent multi-sector model (
Appendix B, MM.34) employed an unusual hybrid validation strategy, combining real-world testing with simulations. Specifically, components of the model were tested across different sectors (e.g., aerospace component manufacturing and engine maintenance), and its use was also simulated in hypothetical scenarios (e.g., urban flooding in a smart city). This mixed validation demonstrates an exceptional level of verification, covering both real and virtual environments to assess the model’s robustness.
In 2024, a model emerged focusing on a rarely covered sector in the literature: the food industry, specifically seafood processing. This model (
Appendix E, MM.37) adapted the maturity framework to an Industry 5.0 context for small-scale fishing enterprises, an area previously unexplored. Its validation, carried out through a survey (42 responses), represents a pioneering application within the food value chain.
The existence of only one model in this domain highlights current sectoral gaps and the pressing need to expand maturity model research into industries such as food, agriculture, healthcare, and others that remain largely overlooked. Short summaries of these exemplary models are also provided in
Appendix F.
3.6. Gaps and Limitations (RQ5)
To address RQ5, evidence on research gaps reported across 75 Industry 4.0 and Industry 5.0 maturity models was synthesized, based on 562 gap records extracted from the analyzed articles. The analytical framework integrates two complementary perspectives: (i) a quantitative analysis describing the distribution of gaps by type (prior gap, intrinsic limitation, future opportunity), and (ii) a qualitative thematic analysis identifying recurrent content patterns (e.g., empirical validation, sustainability, SME orientation, assessment tools). This section reports the relative frequencies of gap types and the dominant thematic patterns observed over the 2020–2024 period, highlighting persistent structural voids and emerging research directions in maturity-model development.
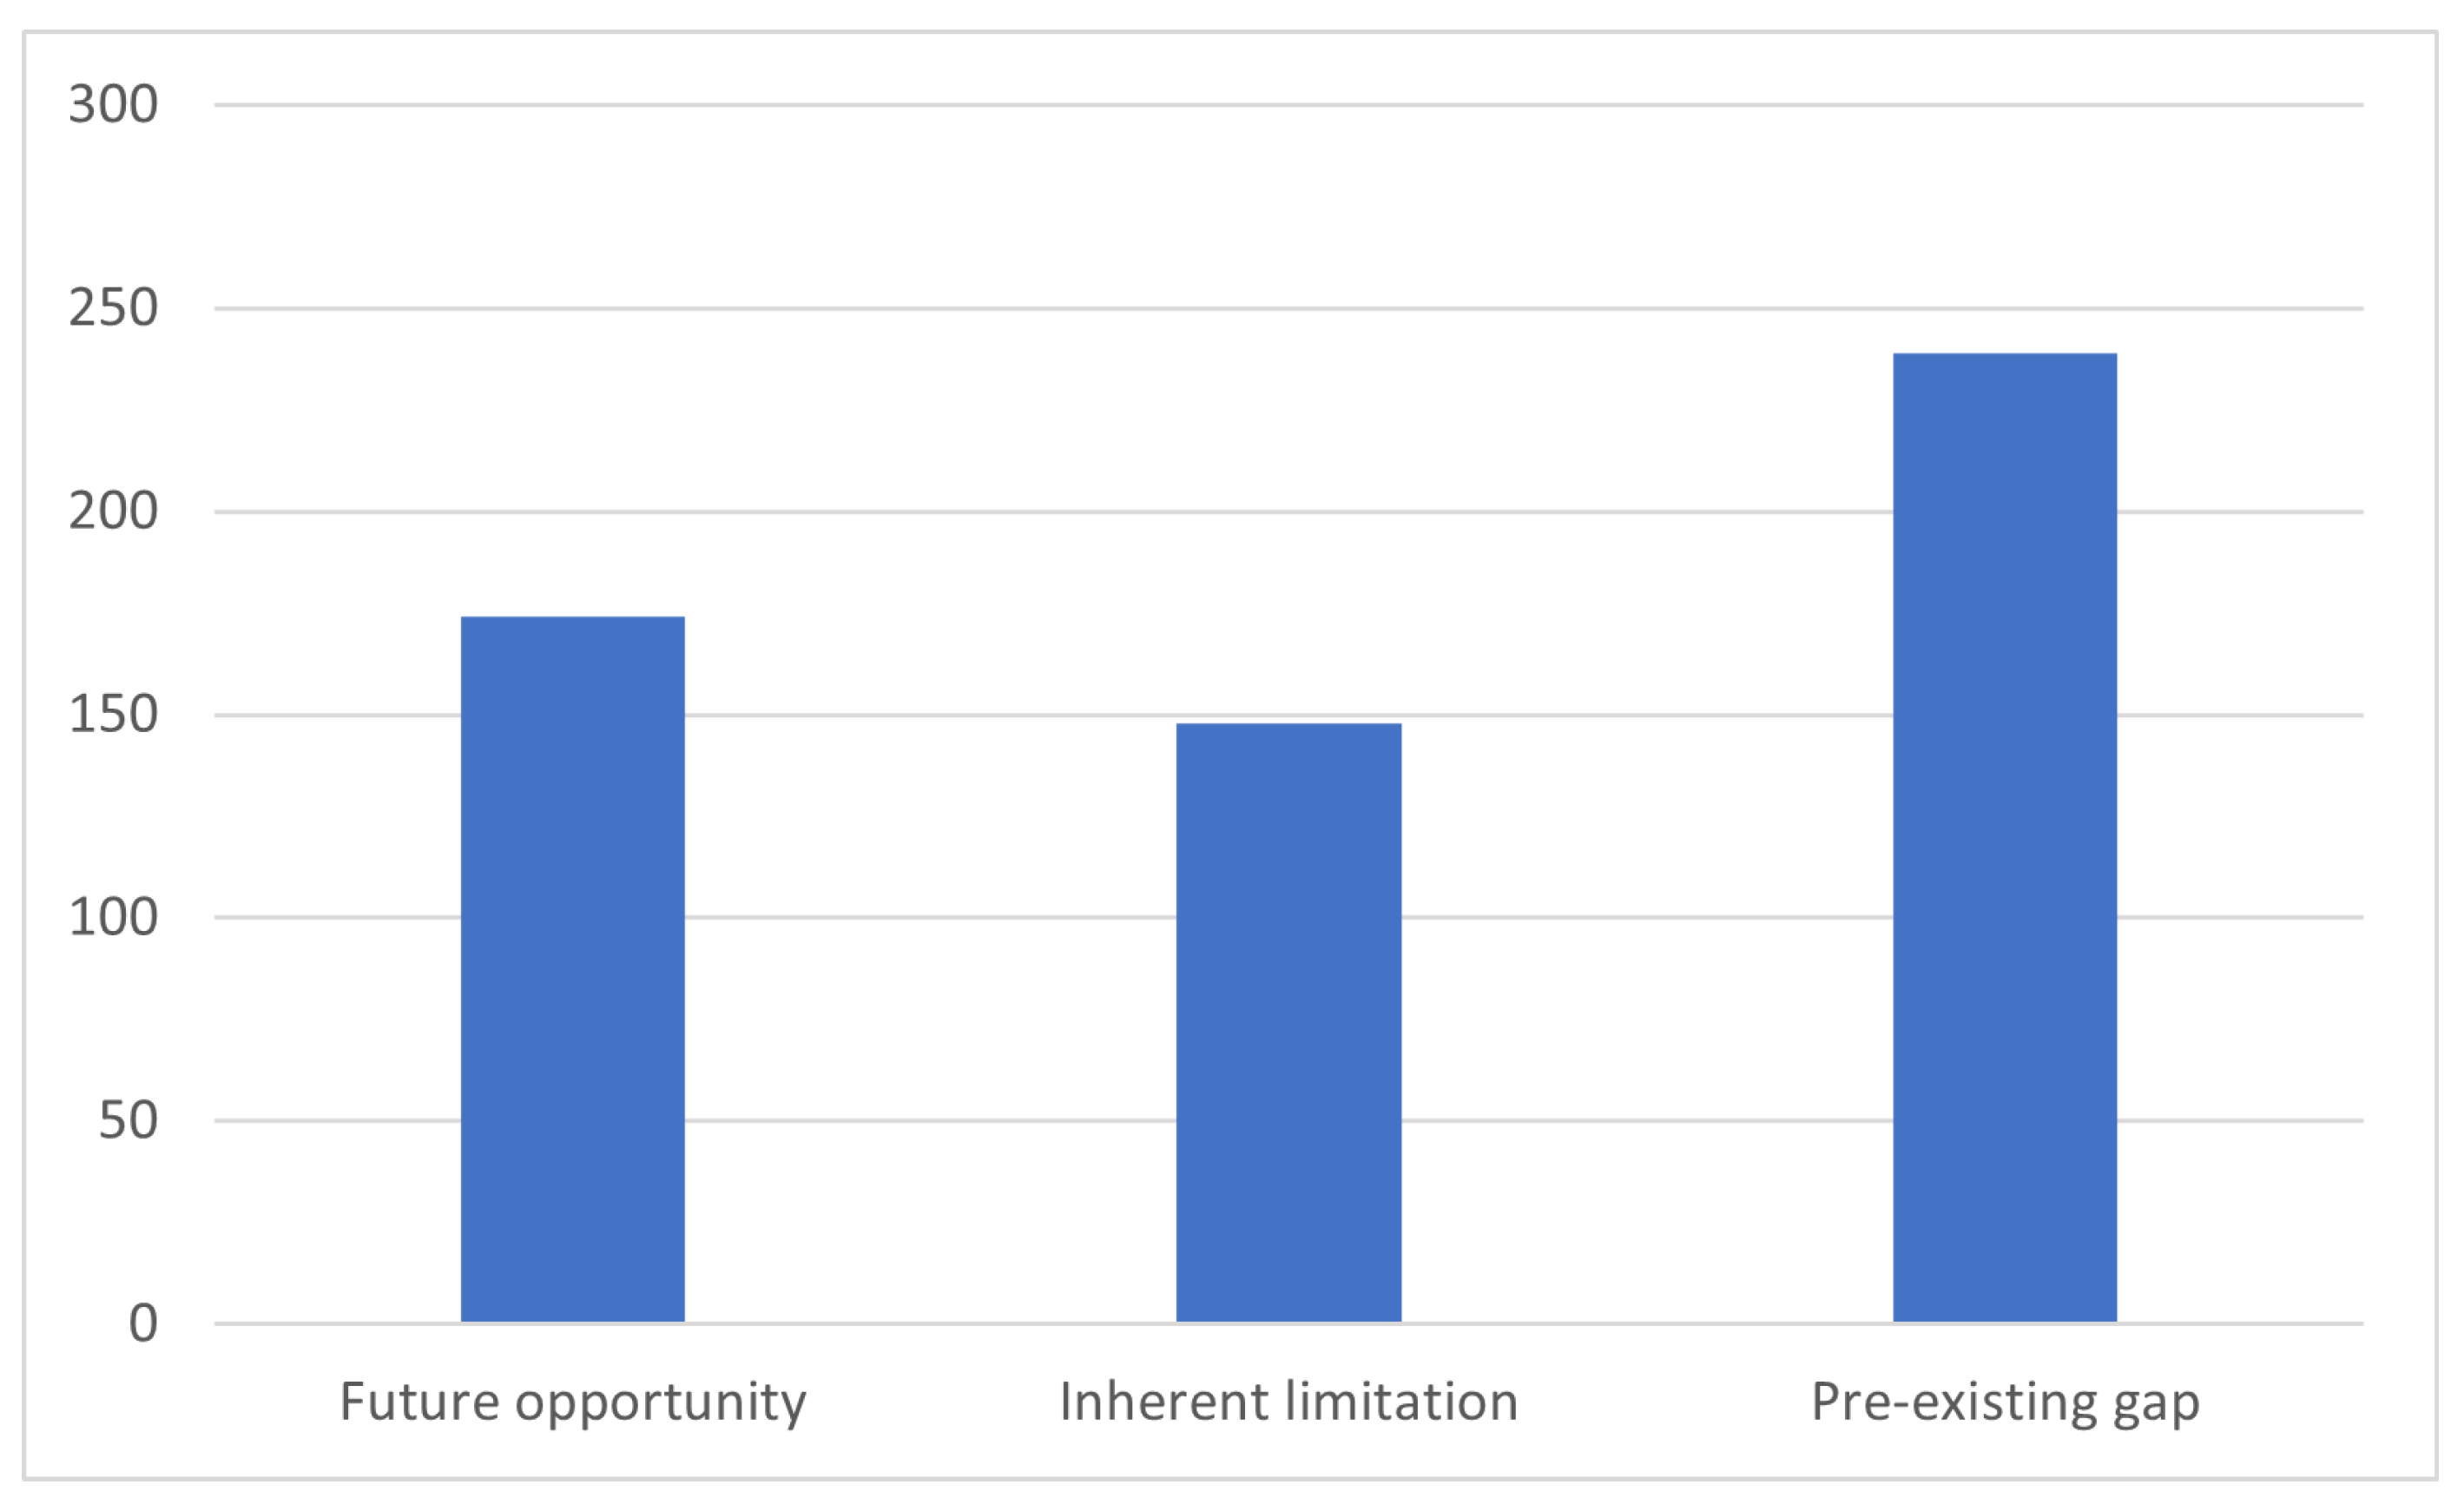
Figure 8 summarizes the distribution of research gaps identified across the analyzed maturity models, distinguishing between pre-existing gaps inherited from prior literature, intrinsic limitations acknowledged by the authors, and future research opportunities proposed by the studies.
Gap extraction was supported by a GPT-based agent using controlled, task-specific prompts, strictly as a primary extractor to enhance scalability and consistency. All extracted gap records were subsequently subjected to complete human verification prior to analysis. To explicitly assess the reliability of the AI-assisted extraction and standardization process, a stratified audit covering 10% of the gap records () was conducted, balanced across the three gap types.
The audit evaluated four aspects: (i) textual support of the extracted gap at the level of the cited excerpt (hallucination control), (ii) fidelity of gap standardization, (iii) correctness of gap-type classification, and (iv) the corrective action required after review. The results indicate high semantic and procedural reliability. Of the audited gaps, 52 out of 56 (92.9%) were directly supported by the cited text. The remaining cases reflected local citation misalignments rather than false-positive gap identification: the gap was present elsewhere in the article but not optimally anchored in the initially selected excerpt. No conceptually invalid gaps were identified.
Standardization fidelity was assessed as accurate in 51 cases (approximately 91%), with one instance of over-generalization detected and corrected during verification. Similarly, gap-type classification (prior gap, intrinsic limitation, future opportunity) was correct in 51 audited cases (approximately 91%), with a single misclassification corrected. Overall, 49 gap records required no modification, while 7 cases (12.5%) were edited, reformulated, reclassified, or discarded. The discard rate was low (3 cases; 5.4%), indicating effective control without systematic inflation or suppression of gaps. These results demonstrate that the AI-assisted pipeline, when combined with systematic human verification, provides a transparent and reliable basis for gap synthesis.
Among the 562 gap records, prior gaps represent the most frequent category, accounting for 42.6% (239 cases). These refer to deficiencies inherited from earlier studies or existing models, such as missing dimensions or analytical perspectives not addressed in previous frameworks. Future opportunities constitute 31.0% of the records (174 cases) and focus on proposing new research directions or extensions, including the integration of emerging technologies or underexplored organizational perspectives. Self-acknowledged limitations account for the remaining 26.4% (148 cases) and capture constraints explicitly recognized by the authors, such as limited empirical validation or restricted sectoral scope.
This distribution suggests that recent literature places slightly greater emphasis on identifying inherited gaps and future research avenues than on critically elaborating the limitations of individual studies. Nevertheless, all three categories are substantively represented, indicating a balanced pattern of retrospective critique, self-reflection, and forward-looking orientation.
Common Thematic Patterns and Persistent Gaps
The qualitative thematic analysis of the standardized gap entries revealed several recurring patterns across the 2020–2024 period. The most prominent theme concerns insufficient empirical validation, frequently manifested through references to limited case studies, absence of large-scale testing, or lack of longitudinal evidence. This issue appears consistently throughout the period, indicating a persistent structural weakness in maturity-model research.
A second dominant theme relates to the need for new or expanded maturity models that incorporate dimensions previously underrepresented in the literature. These include sustainability, human-centric and social factors, and the integration of advanced digital technologies such as Artificial Intelligence, Internet of Things, and data analytics. Such gaps are particularly prominent in years with higher publication volume.
Sectoral limitations also emerge as a recurrent concern. Many gap statements highlight the narrow focus of existing models on manufacturing, with limited applicability to sectors such as logistics, healthcare, services, or agri-industry. Closely related is the frequent lack of explicit orientation toward small and medium-sized enterprises (SMEs), which are often characterized by resource constraints and informal organizational structures.
Additional themes include weak integration of sustainability and social responsibility criteria, limited standardization across maturity models, and the absence of practical implementation support such as assessment tools, digital platforms, or structured roadmaps. Finally, a smaller number of gap statements point to underexplored issues such as cybersecurity and the lack of dynamic or longitudinal perspectives capable of capturing maturity evolution over time.
4. Discussion
The results obtained across the five research questions offer a multi-layered picture of how Industry 4.0/5.0 maturity models are conceived, validated, and framed for use in developing-country contexts. Taken together with the conceptual metatypology developed in our previous study [
17], they highlight not only where maturity-model research is being produced and how it is distributed across sectors and regions, but also how unevenly empirical validation and contextual sensitivity are incorporated. In this section we discuss the implications of these patterns for knowledge production, model design, and policy in developing economies, structuring the discussion by research question.
4.1. RQ1 Where Is Knowledge on Industry 4.0/5.0 Maturity Models Being Produced, and How Well Represented Are Developing Countries?
RQ1 examined where Industry 4.0/5.0 maturity models are being produced and how strongly developing countries are represented in the existing knowledge base. The descriptive results reveal a clear geographical concentration of model development. Of the 75 maturity models analysed, 77.3% are authored within a single country; almost half originate in developed economies (48%), just over one third in developing economies (36%), and the remainder are framed as global or emerge from mixed-country collaborations. In regional terms, Europe accounts for approximately 60% of all models, followed by Asia (27%) and Latin America (13%), while Africa, North America beyond a single U.S. study, and Oceania are only marginally represented. Taken together, these figures point to a geographically asymmetric and uneven map of knowledge production.
The analysis of co-authorship networks reinforces this picture. Collaborative ties are dense within Europe and along Europe–Latin America and Europe–Asia corridors, whereas South–South collaborations are rare and occur at very low frequency. This structure suggests that the industrial conditions, research agendas, and policy priorities of highly digitalised and innovation-intensive ecosystems have played a disproportionate role in shaping the design space of Industry 4.0/5.0 maturity models. Although this concentration does not imply that models originating in such contexts are intrinsically superior, it does indicate that many frameworks are likely to embed implicit assumptions regarding infrastructure availability, workforce skills, governance capacity, and data readiness that may not hold in less endowed environments.
An additional confounding factor in interpreting the geographical concentration observed in RQ1 is language bias. The review was deliberately restricted to English-language publications indexed in Web of Science and Scopus. This decision was motivated by the objective of ensuring comparability, traceability, and methodological consistency across studies, given that English-language outlets constitute the dominant medium for internationally visible, peer-reviewed research and provide standardized metadata, citation practices, and indexing criteria required for systematic analysis.
At the same time, this choice inevitably privileges research outputs that are visible within English-dominant academic indexing systems. As a consequence, locally developed maturity models published in other languages—such as Spanish or Portuguese in Latin America, or Chinese and Japanese in parts of Asia—are likely to be underrepresented or entirely absent from the analyzed corpus. Accordingly, the observed geographical distribution should not be interpreted as a comprehensive map of global maturity-model development, but rather as a representation of where such models are most visible within international, English-indexed academic outlets.
The apparent dominance of Europe and other developed economies may therefore partially reflect differential indexation and language visibility rather than substantive differences in model-building activity. While the sensitivity analysis mitigates relevance-ranking bias within the selected databases, it does not eliminate language-related visibility constraints. These constraints should be explicitly borne in mind when generalizing the findings of RQ1 beyond the scope of English-indexed academic literature.
From a design perspective, these findings highlight the importance of making contextual assumptions explicit rather than treating advanced industrial settings as the default benchmark. Dimensions, indicators, and maturity pathways should be specified in ways that allow adaptation to different levels of technological intensity, firm size, and institutional maturity. Examples include tiered or phased maturity paths, alternative indicators suitable for low-data environments, or variants explicitly calibrated for resource-constrained contexts. For firms and SMEs in developing economies, the strong origin bias observed in the literature suggests that existing maturity models should be applied with caution: they may function as aspirational reference points, but often require substantial local adaptation and prioritisation before being translated into actionable implementation plans. For policy makers, the concentration of model production in a relatively small group of countries underscores the need to support locally grounded research and co-designed maturity frameworks that reflect national and regional industrial structures, including the prevalence of SMEs, informal sectors, and hybrid production systems.
The empirical basis for RQ1 is primarily descriptive and bibliometric. Country counts and collaboration networks capture patterns of volume and connectivity, but they do not establish causal relationships between geographical origin and model effectiveness. Moreover, the temporal window analysed (2020–2024), the reliance on Web of Science and Scopus, and the use of relevance-ranked subsets introduce potential selection and visibility biases, particularly for contributions from emerging economies, non-English outlets, or less indexed venues. These limitations do not invalidate the observed asymmetries, but they warrant caution when generalising the findings beyond the analysed corpus.
To further assess the robustness of the observed geographical concentration, a sensitivity analysis was conducted using an additional sample of maturity models drawn from ranks 251–500 of the original database search results. While models originating in developed economies remain predominant, this supplementary sample exhibits a higher proportion of models developed in emerging or mixed-economy contexts than the main corpus. This pattern suggests that relevance-based ranking mechanisms may partially amplify the apparent dominance of developed-economy contributions. Accordingly, geographical concentration should be interpreted as relative and conditioned by database ranking and indexation practices, rather than as an absolute reflection of global maturity-model development.
Overall, the evidence indicates that enhancing the global relevance of Industry 4.0/5.0 maturity models requires a more geographically balanced research effort. This includes fostering cross-regional consortia with shared leadership between institutions from developed and developing economies, designing explicit adaptation protocols that distinguish universal from context-dependent components, and systematically documenting applications in low-digital-intensity environments. Such steps would help shift maturity models from tools largely shaped by industrialised contexts toward instruments capable of meaningfully supporting digital transformation across the full spectrum of industrial realities.
4.2. RQ2 Does the Type of Model Origin (Single-Country, Collaboration, or Global Approach) Influence Whether Authors Discuss Applicability to Developing-Country Contexts?
RQ2 examined whether the origin of maturity models, operationalized through authorship configuration, is associated with whether authors explicitly or implicitly discuss applicability in developing-country contexts. The descriptive cross-tabulation between model origin and applicability mention (
Table 4) indicates that, across single-country, collaborative, and global models, explicit references to developing-country applicability are generally uncommon, and the majority of studies do not address this issue in the published text.
When explicit and implicit mentions were combined for inferential analysis, the application of an exact Fisher–Freeman–Halton test with Monte Carlo approximation indicated a statistically detectable association between model origin and applicability mention. This result suggests that, within the analyzed corpus, the likelihood that applicability to developing-country contexts is mentioned varies across origin categories. However, given the exploratory nature of the analysis and the limited size of some subgroups, this association should be interpreted cautiously and not as evidence of a causal relationship.
Importantly, the observed association does not imply that collaborative or global models systematically embed stronger contextual sensitivity by design. Rather, the results indicate heterogeneity in reporting practices across origins, with no origin category consistently addressing applicability in a comprehensive or systematic manner. Even among collaborative and global models, references to developing-country contexts remain sparse, suggesting that broader authorship configurations do not automatically translate into explicit engagement with contextual constraints, infrastructural limitations, or institutional conditions characteristic of developing economies.
From a research design perspective, these findings highlight that collaboration per se is not sufficient to ensure contextualization. What appears to matter is how contextual issues are framed and operationalized within the study, and whether researchers with direct experience of developing-country settings play a substantive role in model design, validation, and interpretation. Authorship configuration alone is therefore an imperfect proxy for contextual sensitivity.
The analysis of RQ2 is subject to several limitations. Subgroup sizes for collaborative and global models are relatively small, which increases uncertainty and limits the stability of inferential results. In addition, authorship origin was operationalized using affiliation information and declared scope, which does not capture asymmetries of influence within research teams or the extent to which partners from different regions shape conceptual and methodological choices. Finally, the coding of applicability mention is based exclusively on what is reported in published articles and cannot account for contextual considerations that may have informed the research process but were not explicitly documented. Consequently, the results should be understood as reflecting patterns of reporting within the academic literature, rather than the full range of considerations that may guide maturity-model development in practice.
4.3. RQ3 Does the Development Level of the Country of Origin Influence the Likelihood That the Model Explicitly Considers Developing Countries?
RQ3 examined whether the development level of the country or countries in which a maturity model is developed is associated with the likelihood that the model explicitly or implicitly addresses its applicability in developing-country contexts. The descriptive results reveal clearly differentiated patterns across development-level categories. Among models originating in developed economies, almost all make no reference to applicability in developing-country settings, whereas models originating in developing economies show a substantially higher incidence of both explicit and implicit mentions. Models classified as Global or Mixed follow a pattern closer to that of developed economies, with applicability considerations being largely absent.
The inferential analysis provides exploratory statistical support for this pattern. Importantly, this support emerges from contingency tables that include modest cell sizes in several categories, particularly for Global and Mixed models. While exact tests were used to address sparse data conditions, the resulting associations should be interpreted as suggestive rather than definitive, reflecting tendencies within the analyzed corpus rather than stable population-level effects. Using an exact test appropriate for sparse contingency tables, a statistically detectable association was identified between development level and applicability mention. While this result does not imply causality, it indicates that the likelihood of explicitly addressing developing-country applicability is not randomly distributed across development-level categories within the analyzed corpus.
Any interpretation of this association must, however, clearly distinguish empirical evidence from explanatory inference. One plausible interpretation is a form of contextual proximity: research teams embedded in developing economies may be more directly exposed to constraints related to infrastructure, financing, skills availability, and institutional support, making contextual fit a more salient concern during model design. In contrast, models developed in advanced industrial settings may implicitly assume relatively mature digital ecosystems and higher baseline capabilities, reducing the perceived need to explicitly discuss transferability. This interpretation should be regarded as exploratory rather than definitive.
At the same time, alternative explanations must be explicitly considered. Publication bias may play a role, as authors based in developing-country contexts may face stronger expectations to justify relevance, contextualization, or applicability when publishing in international, English-language journals. Conversely, authors from developed economies may be less compelled to articulate contextual boundaries that are implicitly assumed by editors and reviewers. In addition, indexation and visibility effects associated with Web of Science and Scopus may amplify certain writing conventions and epistemic norms, thereby shaping what is made explicit in published articles without necessarily reflecting differences in underlying design intent. Importantly, the absence of an explicit applicability statement does not imply that contextual considerations were absent from the research process, only that they were not foregrounded in the published text.
This association should therefore not be interpreted in essentialist terms. The operationalization of development level relies on country-level classifications applied to author affiliations, which abstract from substantial heterogeneity within countries, transnational research trajectories, and possible decoupling between the institutional origin of a model and the contexts in which it is validated or applied. In particular, the Global category aggregates heterogeneous configurations under a single label and does not guarantee that models were empirically grounded across diverse development environments.
These findings refine and complement the results of RQ1 and RQ2. RQ1 demonstrated that the production of Industry 4.0/5.0 maturity models is heavily concentrated in developed economies, shaping the dominant academic design space. RQ2 showed that authorship configuration (single-country, collaborative, or global) is not systematically associated with applicability mentions. Taken together, RQ3 suggests that the development context may be associated with whether developing-country applicability is explicitly articulated, but it does not establish the mechanism underlying this association.
From a design and research-policy perspective, the results underscore the importance of explicitly stating contextual assumptions in maturity-model research, regardless of country of origin. Models intended for broad use would benefit from clearly specifying boundary conditions, including minimum infrastructural, organizational, and institutional requirements, as well as potential limitations when applied in resource-constrained settings. At the same time, disentangling contextual proximity effects from publication and indexation biases would require complementary qualitative, comparative, or field-based research designs that go beyond the scope of the present study.
Several limitations of the RQ3 analysis should be acknowledged. The number of models classified as Global or Mixed remains small, which limits the stability of estimates for these categories. Development level was operationalized using World Bank classifications applied to author affiliations, which necessarily simplifies heterogeneous national and subnational realities. Finally, the coding of applicability mentions relies exclusively on what is documented in published articles and cannot capture undocumented adaptations or informal uses of models in practice. These constraints suggest that the observed association should be interpreted as indicative rather than conclusive.
4.4. RQ4 To What Extent Are Existing Models Empirically Validated and in Which Sectors, and How Does This Limit Their Transferability to Emerging Economies?
RQ4 examined how patterns of empirical validation and sectoral focus shape the transferability of Industry 4.0/5.0 maturity models to emerging economies. Rather than focusing solely on whether validation is reported, the analysis highlights how the hlcontext and sectoral anchoring of validation constrain the external validity of existing frameworks.
A central finding is the strong concentration of validation efforts in manufacturing and closely related industrial domains. This concentration systematically privileges environments characterized by relatively high capital intensity, standardized processes, and more mature digital infrastructures. As a result, the empirical foundations of many maturity models implicitly reflect the operational logics and resource assumptions of industrial production settings, while sectors that are strategically important for developing economies—such as agri-food systems, logistics services, healthcare, public administration, or infrastructure-related activities—remain weakly represented in validation designs.
This imbalance has direct implications for transferability. Models validated primarily in advanced manufacturing contexts often embed assumptions about data availability, workforce skills, organizational maturity, and investment capacity that may not hold in other sectors or in resource-constrained environments. When applied beyond their original validation settings, such models risk producing distorted maturity assessments or unrealistic improvement pathways. In this sense, the critical issue is not whether a model has been validated per se, but whether its validation context meaningfully resembles the environments in which it is later deployed.
A key distinction emerging from the analysis concerns the difference between
declared multisectoral scope and
empirically demonstrated cross-sector applicability. Several models explicitly describe themselves as multisectoral, yet their validation evidence does not substantiate this claim. For example, the
Modular Maturity Model for Industry 4.0 (MM.15; [
24]) presents itself as broadly applicable across industries; however, its empirical validation is limited to manufacturing-related cases, with no documented application in clearly distinct sectors such as services, logistics, or public organizations. In such cases, multisectoral scope remains largely aspirational, supported by conceptual generality rather than by sectorally differentiated empirical evidence.
By contrast, a small number of models do demonstrate empirically grounded multisectoral validation. The
Digital Twin Maturity Model (MM.34; [
25]) provides a notable example: its validation strategy combines applications in different industrial contexts (e.g., aerospace component manufacturing and maintenance operations) with simulation-based assessments in non-industrial scenarios, such as smart-city infrastructure use cases. Although still limited in scale, this approach illustrates how maturity constructs can be tested across heterogeneous sectoral logics, strengthening claims of cross-sector applicability.
From an Industry 5.0 perspective, the limitation observed in most models is not simply the absence of human-centric or sustainability-oriented dimensions, but the lack of empirical designs capable of substantiating them. Human-centricity and sustainability are frequently articulated at a conceptual level, yet rarely operationalized through measurable indicators or validated against socio-technical outcomes. The near absence of predictive or longitudinal validation further exacerbates this mismatch, as it prevents assessing whether improvements along such dimensions translate into durable organizational, social, or environmental benefits over time.
Finally, the sectoral patterns identified must be interpreted in light of the deliberate exclusion of practitioner-developed maturity models produced by consultancies, industry associations, and standardization bodies. Many of these frameworks are widely applied in service sectors, logistics, energy, or public organizations, but they fall outside the scope of this review due to the focus on peer-reviewed academic literature. Consequently, the findings of RQ4 characterize the priorities and validation practices of academically developed maturity models rather than the full ecosystem of maturity assessment tools used in practice.
Taken together, the results underscore the need for validation strategies that are both sector-sensitive and context-aware. Strengthening the external validity of maturity models requires clearer differentiation between declared scope and demonstrated applicability, systematic empirical work in underrepresented sectors, and explicit reporting of sector-specific constraints encountered during validation. These steps are particularly critical if maturity models are to function as credible decision-support instruments for firms and policy-makers in emerging-economy contexts.
4.5. RQ5 What Research Gaps Do Authors Themselves Identify as Obstacles to Industry 4.0/5.0 Adoption in Developing Countries?
RQ5 synthesized the research gaps and limitations explicitly identified by primary studies as barriers to Industry 4.0/5.0 adoption, with particular relevance for developing-country contexts. Rather than reiterating their frequency, the analysis focuses on the structural patterns that emerge across these self-reported gaps and their implications for the evolution of maturity-model research.
The most persistent concern across the corpus relates to empirical robustness. Authors repeatedly acknowledge that their models rely on limited forms of evidence—small samples, single-case studies, cross-sectional surveys, or simulations—rather than on systematic multi-site or longitudinal validation. This recurrent admission signals a shared recognition that many maturity models remain weakly tested against real organizational trajectories or performance outcomes. As such, confidence in their predictive capacity and suitability for guiding high-stakes investment or policy decisions remains constrained.
A second cluster of gaps highlights limited sectoral coverage and organizational scope. Numerous studies explicitly note that their models have been developed for, or validated within, narrowly defined industrial contexts, most often manufacturing. At the same time, authors frequently point to the insufficient adaptation of existing frameworks to small and medium-sized enterprises, despite SMEs constituting the dominant organizational form in many economies. These acknowledgements reinforce the observation that much of the maturity-model evidence base is anchored in relatively formalized, capital-intensive settings, which may not reflect the operational realities of firms in developing countries.
A third group of gaps concerns the integration of sustainability, resilience, and human-centric dimensions. While these aspects are increasingly invoked in the discourse surrounding Industry 5.0, authors commonly frame them as future extensions rather than as empirically grounded components of current models. The lack of operational indicators and validation strategies for socio-technical dimensions creates a disconnect between normative ambitions and available measurement tools, particularly in contexts where social and environmental vulnerabilities are pronounced.
Beyond conceptual limitations, the literature also reveals significant operational shortcomings. Many studies recognize the absence of standardized taxonomies, shared metrics, and openly accessible assessment instruments, which hampers replication, cross-model comparison, and cumulative synthesis. Practical tools such as questionnaires, digital platforms, or reference datasets are rarely provided in reusable formats, and longitudinal or cross-country evidence remains scarce. These deficits limit the capacity of maturity models to function as scalable and adaptable instruments beyond their original study settings.
Taken together, the gaps identified by primary studies point to an implementability deficit that is especially salient for emerging economies. From the perspective of firms and policy-makers, maturity models often appear as promising but weakly substantiated artefacts—designed in contexts that differ from their constraints and lacking the operational infrastructure needed for low-cost deployment. Importantly, these gaps do not merely enumerate shortcomings; they delineate a coherent research agenda. Addressing them requires stronger empirical validation across diverse sectors and contexts, explicit attention to SME realities, systematic integration of sustainability and human-centric indicators, and a commitment to openness through shared data, instruments, and codebooks. In this sense, the self-identified gaps in the literature function as a roadmap for reorienting maturity-model development toward the practical needs of developing economies.
5. Conclusions
This article has examined how Industry 4.0/5.0 maturity models are being validated, scoped, and framed for use in developing-country contexts, based on an academic literature analysis of 75 models published between 2020 and 2024. By combining descriptive profiling, inferential statistics, and text-based synthesis of 562 gap statements, we mapped the geographical origin of these models, their empirical grounding, their sectoral focus, and the main limitations that authors themselves recognise as barriers to adoption in emerging economies.
5.1. Contributions and Main Findings
The study makes four main contributions. First, it documents the geography of knowledge production on Industry 4.0/5.0 maturity models. Most frameworks are proposed in single-country studies from developed economies, with Europe as the dominant hub and limited participation from underrepresented regions. Although more than one-third of models originate in developing or emerging economies, the overall landscape remains strongly asymmetric.
Second, the analysis shows that the type of authorship (single-country, collaborative, global) is not significantly associated with whether a study mentions applicability to developing countries, whereas the development level of the country of origin is. Models originating from, or co-led with, developing economies are substantially more likely to include explicit or implicit statements about their use in resource-constrained contexts, while models from developed countries largely omit this discussion.
Third, we provide a systematic overview of empirical validation strategies and sectoral scope. Most models report some empirical evidence, but validation is often limited to small samples, cross-sectional surveys, or single-case studies; only a minority provide more robust multiple-case or large-sample designs, and around 15% have no reported validation at all. Sectoral coverage is heavily skewed toward manufacturing and manufacturing SMEs, with services, agri-food, healthcare, and public-sector applications appearing only sporadically. Multisector models are rare but tend to rely on stronger empirical designs, especially multiple-case applications.
Fourth, by synthesizing 562 gap and limitation statements, we outline a research agenda grounded in the concerns of the primary studies themselves. Recurrent themes include insufficient empirical rigor, narrow sectoral and SME coverage, limited predictive or longitudinal validation, and weak operationalization of sustainability and human-centric dimensions associated with Industry 5.0. While such dimensions are increasingly invoked at a conceptual level, they are rarely anchored in measurable indicators or tested through validation designs capable of assessing their substantive impact over time. Together, these issues point to a persistent implementability deficit that constrains the usefulness of maturity models for guiding digital transformation in developing-country settings.
5.2. Implications for Research and Practice
For designers of maturity models and researchers, the findings underscore the importance of treating contextual applicability and empirical validation as first-order design requirements rather than ancillary considerations. Models intended for use in emerging economies should (i) make assumptions about infrastructure, skills, and organizational capabilities explicit; (ii) offer tiered and resource-aware maturity pathways suitable for SMEs; and (iii) operationalize Industry 5.0 principles—such as human-centricity and sustainability—through measurable indicators linked to predictive or longitudinal validation designs. Strengthening empirical rigor will often require mixed-method approaches that combine multi-site case studies, surveys, and longitudinal follow-ups capable of relating maturity trajectories to organizational, social, or environmental outcomes.
For policy-makers and practitioners in developing countries, the results caution against the uncritical transfer of maturity models developed in highly digitalised industrial environments. When selecting or adapting a model, decision-makers should interrogate its origin, validation track record, sectoral scope, and relevance to local constraints. Public programmes that promote Industry 4.0/5.0 adoption can play a catalytic role by supporting co-design and validation of models with local firms, funding open assessment tools and reference datasets, and encouraging the inclusion of sustainability, resilience, and inclusion targets alongside purely technological metrics. In this way, maturity models can evolve from static diagnostic checklists into dynamic instruments for planning, monitoring, and governing digital transformation.
5.3. Limitations
Several limitations should be considered when interpreting the findings of this study. First, the corpus is restricted to peer-reviewed publications indexed in Web of Science and Scopus during the 2020–2024 period. Although these databases provide broad coverage of high-impact academic literature, they do not capture the full universe of Industry 4.0/5.0 maturity models. In particular, practitioner-oriented models developed by consultancies, industrial associations, and standardization bodies, as well as grey literature and proprietary frameworks, fall outside the scope of this review. As a result, the conclusions of this article apply specifically to maturity models developed and disseminated within the academic literature and should not be generalized to the wider ecosystem of industrial assessment tools used in practice.
Second, the reliance on relevance-based ranking to truncate the initial search results (top 250 records per database) introduces a potential selection and visibility bias. Although this heuristic was applied transparently and consistently across both databases, relevance algorithms are proprietary and may amplify the prominence of contributions from well-established research communities, journals, and English-language outlets. To assess the robustness of the observed geographical patterns, a sensitivity analysis was conducted using an additional sample of 20 maturity models drawn from ranks 251–500. This supplementary analysis indicates a higher relative presence of models originating in developing or mixed-economy contexts than in the main corpus, suggesting that relevance-based ordering may partially overstate the dominance of developed-economy contributions. Nevertheless, the results should be interpreted as relative patterns conditioned by database ranking and indexation practices, rather than as an exhaustive representation of global model development.
Third, the corpus is limited to English-language publications. This language restriction may confound interpretations of geographical concentration, as maturity models developed and published in other languages (e.g., Spanish, Portuguese, Chinese, or Japanese) are likely underrepresented. Consequently, locally grounded models addressing developing-country contexts may remain invisible to the present analysis. While this limitation does not invalidate the patterns identified within the English-indexed academic literature, it constrains the extent to which the findings can be extrapolated to global knowledge production as a whole.
Fourth, the operationalization of development level constitutes an additional limitation. Assigning models to development categories based on the affiliation country of the lead author and World Bank country classifications necessarily simplifies complex realities. This approach does not capture substantial heterogeneity within countries, transnational research trajectories and diaspora patterns, or cases in which the institutional origin of a model differs from the context in which it is validated or applied. In addition, the Global category aggregates heterogeneous configurations under a single label and should not be interpreted as evidence that models were empirically grounded across diverse development environments. Alternative or complementary proxies, such as the geographical location of empirical validation, the primary application setting, or multi-level coding schemes distinguishing origin, validation, and use contexts, could provide a more fine-grained representation of contextual grounding and represent a promising direction for future research.
Fifth, all variables were coded exclusively from information explicitly reported in the published articles. Under-reporting of validation procedures, sectoral scope, or applicability conditions may therefore bias the results. In particular, the absence of an explicit applicability statement does not necessarily imply that a model cannot be used in developing-country contexts, but rather that such considerations were not documented by the authors. Similarly, the degree of validation or contextual adaptation applied in practice may exceed what is reported in the academic publications.
Sixth, although research gaps were identified using a hybrid AI–human workflow with complete human verification, the AI-assisted extraction process operates at the level of local textual excerpts. As evidenced by the stratified audit, a small number of gaps were conceptually valid at the document level but were not fully supported by the specific excerpt initially selected by the automated extractor. These cases required manual correction and highlight a limitation related to excerpt-level anchoring rather than to the validity of the identified gaps themselves. While systematic human verification mitigates the risk of hallucination and misclassification, the quality of excerpt selection remains sensitive to document structure and reporting practices. Future work could strengthen traceability by aggregating evidence from multiple excerpts or by incorporating explicit document-level referencing during automated extraction. In addition, gap verification was conducted by a single expert reviewer; although appropriate for an audit-oriented validation, future studies could employ dual coding and inter-rater reliability measures to further enhance robustness.
Seventh, the quantitative analyses are exploratory and rely on relatively small subgroups for certain categories (e.g., collaborative and global models). To address violations of asymptotic assumptions, exact tests with Monte Carlo approximation were employed where appropriate. While this approach improves robustness under sparse data conditions, the resulting p-values remain sensitive to recoding decisions and small changes in cell counts. In addition, the operationalization of applicability as a binary variable for inferential purposes entails a loss of granularity, which may obscure distinctions between explicit and implicit forms of contextual consideration. Accordingly, statistically detectable associations should be interpreted cautiously and not as evidence of stable or generalizable effects. In addition, effect sizes were reported to support substantive interpretation of associations, but these estimates remain sensitive to small cell counts and should be interpreted as corpus-specific rather than population-level parameters.
Finally, and most importantly, this review does not assess the real-world effectiveness or impact of the analyzed maturity models. The study maps the academic design space of Industry 4.0/5.0 maturity models as conceptual and methodological artefacts, focusing on their origin, validation claims, sectoral scope, and stated applicability. It does not evaluate whether the application of these models leads to successful digital transformation outcomes, performance improvements, or sustained capability development in practice. This constitutes a substantive boundary of the study and highlights the need for future research linking maturity assessments to longitudinal evidence on organizational, sectoral, and policy outcomes, particularly in developing-country settings.
5.4. Directions for Future Research
Future work could extend and deepen this analysis in several directions. Longitudinal and cross-country studies are needed to track how industrial digital maturity evolves over time and to assess whether maturity scores derived from existing models predict changes in performance, resilience, or sustainability. Sectoral blind spots identified in this review—including agri-food, healthcare, logistics, and public services—warrant targeted efforts to design and validate models that reflect their specific constraints and opportunities, especially in developing-country contexts. There is also a need for greater standardisation and interoperability across frameworks, including shared taxonomies, benchmark datasets, and open-source assessment tools that enable replication and comparative meta-analyses. Finally, as Industry 5.0 matures, future maturity models should more systematically incorporate human-centric, social, and environmental dimensions, and empirically test how these interact with technological and economic indicators.
Taken together with our previous metatypology of Industry 4.0/5.0 maturity models [
17], which focused on the evolution of model scope, level structures, dimensions, and enabling technologies, this article completes a two-part research programme. The earlier contribution clarifies how industrial digital maturity is conceptualised at the interface between Industry 4.0 and Industry 5.0, while the present study examines how those models are empirically validated, sectorally scoped, and framed for use in developing-country contexts. Both strands point toward the same conclusion: a qualitative leap in validation practices, contextual sensitivity, and openness is required if maturity models are to function as effective instruments for a fair and sustainable digital transformation that narrows, rather than widens, the gap between developed and developing economies. Finally, as Industry 5.0 matures, future maturity models should more systematically incorporate human-centric, social, and environmental dimensions, operationalize them through observable indicators, and empirically test their effects using longitudinal or predictive validation designs.