Abstract
Lean implementations often deploy tools in isolation, leaving gaps in how abnormalities are exposed, resolved at the root cause, escalated when needed, and converted into organisational learning. This study proposes a five-stage closed-loop routine for daily factory management that integrates problem visibility, standardised shop-floor cadence, disciplined problem-solving, and tiered escalation within a single operating logic. The novelty lies not in the individual Lean tools, but in the specification of cadence, triggers, accountable roles, and verification steps that connect them into a replicable end-to-end routine. The model was evaluated through a 19-month longitudinal, single-site field intervention (quasi-experimental before–and–after) on the bottleneck production line of a pharmaceutical plant in Hengoed, Wales (UK). Line OEE increased by over 50% in relative terms. At factory level, total output increased by 20% year-on-year in 2024 (context indicator), alongside qualitative field observations of shorter time-to-resolution and improved cross-functional coordination. As a single-site study, external validity is context-dependent; nevertheless, the paper provides a specified closed-loop routine and field evidence on the operational effects of embedding an integrated Lean cycle into daily management. Practically, the study provides a specified routine that practitioners can replicate and adapt; academically, it contributes to Lean implementation research by showing how tool bundles can be operationalised as an end-to-end daily management routine with observable performance effects.
1. Introduction
In today’s highly globalised and interconnected markets, organisations operate under unprecedented levels of competition. In this context, products and services must be delivered to agreed quality standards and deadlines [1]. Customers are increasingly expecting products and services that combine high quality with reduced costs and shorter lead times, while also demanding flexibility and compliance with increasingly stringent sustainability and regulatory requirements. Such pressures are particularly evident in complex industries such as pharmaceuticals, automotive, tourism, and fast-moving consumer goods (FMCG), where operational resilience and process optimisation are vital to maintaining competitiveness. Under these conditions, operational excellence has become more than a source of competitive advantage; it is a prerequisite for organisational survival and long-term sustainability.
Within this challenging landscape, Lean management has emerged as one of the most widely adopted approaches for achieving operational efficiency. Rooted in the Toyota Production System and formalised through the philosophy of The Toyota Way, Lean emphasises the systematic elimination of waste, continuous improvement, and the development of people as problem-solvers. A central premise is that sustained performance depends on both a production system that makes problems visible and a human system that develops capable people to resolve them [2]. Over the past decades, Lean principles have been widely disseminated and adapted across sectors far beyond the automotive industry, including healthcare, pharmaceuticals, FMCG and services. Empirical evidence frequently reports Lean’s potential to improve efficiency, enhance quality, and support organisational learning, although outcomes vary with context and implementation maturity. Despite these successes, Lean implementation in practice often remains fragmented, with tools adopted without being embedded into a coherent daily management system. This fragmentation can yield local improvements yet still fail to sustain performance, particularly when abnormalities recur or process variability is high.
Another recurring challenge is the lack of robust mechanisms to systematically expose, understand, and resolve operational problems. The Lean approach stresses the importance of making problems visible and equipping people with the skills and mindset to address them effectively. Nevertheless, many companies fail to establish standardised routines for surfacing issues, let alone integrate them with structured problem-solving methodologies. As a result, problems remain hidden or are addressed ad hoc, preventing the organisation from developing resilience and a culture of continuous learning.
Čiarnienė and Vienažindienė [3] further reinforce that several challenges and barriers to Lean adoption remain unresolved. Specifically, organisations face two primary categories of obstacles: those related to human factors, such as employee resistance to change (lack of engagement), skills, poor communication, and weak mindset, and those rooted in organisational structures and processes. Addressing both dimensions is crucial for the successful implementation of Lean principles and for fostering a culture of continuous improvement. Integrating these considerations into a standardised process is essential to ensure that Lean does not remain a set of isolated tools. In this sense, it becomes a sustainable management philosophy embedded in both people and organisational systems. From a research perspective, this situation reveals a notable gap. While the academic literature on Lean is extensive [1], it primarily focuses on individual tools, case studies of implementation, or high-level discussions of Lean principles. There is a lack of straightforward frameworks that combine two complementary elements: (1) mechanisms for systematically exposing operational problems; and (2) methodical approaches for resolving those problems through disciplined routines and escalation mechanisms.
This paper addresses this challenge by proposing an ordered process model that integrates problem exposure with structured problem-solving in an operating loop. The model, explained in Section 3, combines strategic KPIs, visual management, standardised operational routines on the shop floor, root-cause analysis, and corresponding corrective actions, as well as escalation mechanisms, to ensure continuous improvement and people development. As synthesised in Section 2.7, prior studies associate sustained gains with coherent bundles of Lean practices embedded in daily management, rather than stand-alone tool adoption [2,4,5,6,7,8,9,10]. This situation motivates the present article. It directly responds to the fragmentation of Lean tool use and the absence of a systematic approach to surface and resolve operational problems.
Research gap: Despite extensive Lean publications, to our knowledge, the literature does not offer a straightforward cyclical routine that systematically links abnormality exposure, disciplined root-cause resolution, escalation when needed, and verification-based learning within daily shop-floor management. Based on this gap, the article investigates the following research question:
RQ1. How can widely adopted Lean practices be integrated into a practical, closed-loop system that supports visibility, standardisation, problem-solving discipline, and people development within daily operations management?
RQ2. What operational and organisational effects can be achieved by embedding such an integrated Lean cycle into routine shop-floor management?
We return to these questions in Section 5, contrasting our results with extant evidence to clarify originality and contribution.
To evaluate the model, it was implemented and tested at Norgine’s pharmaceutical manufacturing facility in Hengoed (Wales, UK), a high-compliance environment, allowing for a realistic assessment of its practical impact on operational effectiveness. The study contributes both practically by providing a replicable framework for improving performance in different manufacturing environments and academically by advancing Lean implementation research towards a system-based rather than a tool-based perspective. It shows how fragmented practices can be connected into a management architecture that resolves operational problems while strengthening capability development and organisational learning. By bridging theory and practice, the study contributes to Lean implementation research by specifying a closed-loop daily management routine and examining its operational effects in a regulated manufacturing context.
2. Literature Review
2.1. Introduction to Lean Business System
The Toyota Production System (TPS), the foundation of Lean philosophy, was systematised by its original architects—Ohno, Shingo, and later Monden—who emphasised just-in-time, Jidoka (built-in quality with line-stop authority), standardised work, and disciplined problem-solving [11,12,13]. While TPS drew insights from earlier mass-production practices at Ford—most notably continuous flow—it diverged by pursuing flexibility, waste elimination and people-centred problem detection at the gemba. In Ford’s case, production focused on a single product with essentially unlimited demand (the Model T, famously offered predominantly in black).
In the post-1950s context, Toyota had to compete with global automotive giants despite low volumes, high product variety, limited capital (especially after World War II), and constrained factory space. This created a strong imperative to eliminate waste across the value stream while developing flexible production capabilities [11,12,13], including frequent changeovers and adaptable workflows. These challenges catalysed TPS, which laid the groundwork for what is now recognised as Lean Thinking, Lean Business System, or Lean Management, all of which are based on the Toyota Way.
2.2. Evolution of Lean
Following the establishment of the TPS, Toyota demonstrated that high productivity and quality could be achieved in low-volume, high-variety environments. As Lean ideas gained visibility through international comparisons of automotive production systems, they drew sustained attention from Western manufacturers and researchers. Over time, Lean principles were formalised into a broader management approach—often discussed under the umbrella of The Toyota Way—and were subsequently adapted beyond the shop floor into administrative and office processes, as well as across a wide range of sectors [10,14,15]. Unlike traditional business systems, Lean promotes flexibility, responsiveness to customer demand, and the development of individuals as problem solvers.
2.3. Evolution and Formalisation of “The Lean Thinking”
The term Lean Manufacturing was first popularised in 1991 by James P. Womack, Daniel T. Jones, and Daniel Roos in their seminal work, The Machine That Changed the World [14]. Drawing on extensive research at the Massachusetts Institute of Technology (MIT), the authors compared production systems across major regions of the global automotive industry—including North America, Europe and Japan—concluding that TPS represented the most efficient and innovative management model of its time. TPS was thus recognised as the first system to operationalise the principles that would later be known as Lean.
A decade later, Womack and Jones [15] further consolidated the philosophy in Lean Thinking: Banish Waste and Create Wealth in Your Corporation, where they articulated five guiding principles that extend TPS beyond the factory floor into a broader business philosophy. These principles: (1) defining value from the customer’s perspective, (2) mapping the value stream, (3) ensuring uninterrupted flow, (4) enabling pull-based production, and (5) striving for perfection, provided a structured framework for organisations seeking to eliminate waste (muda) and align operations with customer value.
Each principle has both practical and cultural implications. For instance, defining value highlights the distinction between what customers truly seek and the non-value-adding activities imposed by traditional processes. Value stream mapping (VSM) [16] helps visualise and redesign processes to eliminate inefficiencies, while the concepts of flow and pull emphasise responsiveness and agility rather than the rigid, push-driven logic of mass production. Ultimately, the pursuit of perfection embodies the idea of continuous improvement (kaizen), positioning Lean as a perpetual journey rather than a one-time project.
Together, these contributions marked a decisive evolution: Lean was no longer regarded simply as an adaptation of TPS but as a comprehensive management philosophy applicable across industries. By combining cultural, operational, and strategic elements, Lean Thinking provided organisations with a systematic way to create sustainable value in increasingly competitive and complex markets.
Early Lean Manufacturing narratives emphasised process and operational efficiency, paying comparatively less attention to human and organisational dimensions [17]. This marks a key distinction from its successor Lean Management (also called Lean Thinking), which expanded its scope to include people development, leadership practices, and broader organisational systems.
More recently, Lean has advanced through integration with Industry 4.0. Examples include the pairing of Lean manufacturing tools with innovative digital technologies to raise productivity in construction [18]; the use of digital value-stream ‘shadows’ that extend conventional VSM by enabling near-real-time visibility and data-driven feedback for continuous improvement [19]; and the application of data science techniques to support lean daily management and decision-making [20]. This trajectory is often referred to as “Lean 4.0”.
2.4. Human-Centric Evolution of Lean Management
In recent years, Lean Management has progressively broadened its scope to incorporate human-centric dimensions alongside operational efficiency. Hines [21], for instance, introduces the concept of the “people value stream”, which stresses the role of employees as active value creators and highlights the importance of their continuous development. Similarly, Bouranta et al. [22] conducted a systematic literature review that identified human resource–related themes, such as training, leadership, organisational culture, participation, and communication, as critical enablers of successful Lean adoption. Expanding this perspective, Koemtzi et al. [23] emphasise that future research should explore HR-related aspects more deeply, particularly managerial engagement, performance development, and work design.
Beyond theoretical discussions, empirical studies provide evidence of the benefits associated with a human-centred approach. For example, Bektas and Kiper [24], examining the healthcare sector, found that Lean practices enhanced job satisfaction and autonomy while also reducing employee turnover, illustrating the dual benefit for staff and organisations. Complementing these findings, practical evidence also supports the link between Lean practices and employee engagement. In the case of J. Macêdo, where Lean methodology was piloted at the Jaguaré unit (São Paulo), an organisational climate survey conducted by the Hay Group revealed a remarkable shift: between 2007 and 2009, this unit progressed from last place to first in engagement scores among ten plants, offices, and warehouses. This outcome highlights how systematic Lean implementation can not only drive operational improvements but also foster a culture of participation, motivation, and sustained commitment.
Collectively, these insights reflect a growing emphasis on the socio-technical dimensions of Lean. Foundational TPS texts highlight Just-in-Time, Jidoka, standardised work, and structured problem-solving at the gemba. At the same time, the Toyota Way literature foregrounds respect for people and leadership as enabling conditions. Subsequent Lean studies further expand on leadership behaviours, participation, and capability development, as well as waste elimination and standardised work [2,4,10,11,21].
2.5. Challenges in Lean Implementation
Although Lean principles have been widely adopted across sectors, many organisations continue to face persistent difficulties in converting Lean theory into sustainable practice. A common issue lies in the fragmented use of Lean tools. Equally critical to Lean adoption are the human and organisational dimensions. Barriers arise from both people-related aspects, such as engagement, skills, and mindset, and from structural issues like hierarchy, communication gaps, and a lack of standardised routines. If not addressed together, these challenges leave Lean implementation superficial, with improvements confined to isolated processes rather than the entire enterprise [3].
Recent evidence points to four specific risk factors that can undermine the implementation of Lean (as well as any system, such as TPM): (i) low recognition of the value of internal audits; (ii) poor decisions in equipment selection; (iii) concerns about job security; and (iv) insufficient priority given to Lean tasks in relation to daily tasks. When these factors are present, projects stall or deteriorate over time [25]. On the other hand, the same study reports that employees and managers generally believe in the benefits of Lean—and that results improve when implementation is strategic, structured, and carefully planned, with clear timelines/Gantt charts, milestones, and a transparent dashboard to monitor progress and avoid deviations. These findings reinforce the need for planning with defined deadlines, visible monitoring, and leadership support as integral parts of Lean implementation, rather than optional extras [25]. A project-based engineering readiness analysis shows that gaps in practical governance, support team, company division, cross-functional alignment, and the desire to drive innovation often precede poor implementation outcomes. The study explains that businesses fail to implement successfully because they focus only on the system’s physical characteristics. It is key to have a positive mindset, behaviour and vision with top management working to inspire the business through the Lean culture [26].
While the Toyota Production System emphasises making issues visible and empowering employees to address them, in practice, detection is often inconsistent, and responses are reactive rather than systematic. This limits organisational learning, reinforces variability, and prevents the establishment of a genuine culture of continuous improvement. In the present study, these risks are explicitly mitigated by visual management to make deviations and milestones visible, through a two-tier PDCA with action tracking to standardise and verify corrective measures, and via a formal chain of help to secure timely technical and leadership support.
2.6. Some Techniques and Tools
In his study entitled Quantitative Analysis of Lean Applications in Scientific Publications over the Last Two Decades, Rei [1] presented an extensive review of how Lean tools have been applied and described in academic literature. His work highlighted that, despite being widely referenced, these tools are often portrayed differently by various authors in different contexts. Building on this, Costa and Filho [27] proposed a classification framework that organises Lean tools into four main categories: (A) assessment methods, such as value stream mapping and process mapping; (B) improvement methods, including 5S, continuous flow and kaizen; (C) monitoring methods, especially visual management; and (D) hybrid methods that combine assessment and improvement, such as DMAIC (Define–Measure–Analyse–Improve–Control) and the PDCA cycle.
Rei’s study [1] also presented alternative groupings and applications of these and other tools from different authors, books, and articles, reflecting the diversity of interpretations in the literature.
Beyond this diversity of interpretations, recent empirical studies indicate that combining Lean practices with digital technologies can increase labour productivity in construction projects, and that data science can support Lean implementation by strengthening performance monitoring, feedback, and decision-making within the PDCA logic and related practices (e.g., visual management and root-cause analysis) [18,20]. These findings motivate the synthesis in Section 2.7, moving from individual tools toward an integrated, shop-floor-ready routine.
2.7. Integration of Some of the Lean Tools into a Closed-Loop System
This work proposes a repeatable end-to-end routine that links daily management to disciplined problem-solving and escalation. The framework integrates strategic alignment (via KPIs), visual performance control, standardised shop-floor routines, two-level PDCA with action tracking, and a tiered ‘chain of help’ into a single operating logic. Section 3 specifies the design and operationalisation of each stage, and Section 4 reports the field results. Prior research indicates mixed outcomes in Lean adoption. Beyond technical tool selection, implementation success is contingent on organisational routines, leadership behaviours, and the ability to sustain problem-solving over time. Studies highlight that initiatives may stagnate or deteriorate when daily management lacks clear ownership, escalation, and verification mechanisms, or when improvements are not translated into standard work and learning cycles [2,3,4,5,6,7,25]. This mixed evidence motivates the present focus on specifying a closed-loop routine that connects problem visibility, disciplined resolution, and escalation within daily operations. Across the Lean literature, sustained performance improvements are more consistently reported when practices are deployed as coherent bundles embedded in daily management routines (with clear ownership, feedback, and follow-up), rather than as stand-alone tools [2,4,5,6,7,25].
Collectively, these findings support the cadence architecture we describe in Section 3.1 and evaluate in Section 3.2: making problems visible, reacting quickly, codifying solutions, and institutionalising learning.
3. Materials and Methods
3.1. Conceptual System: The Five-Stage Closed-Loop Architecture
This subsection presents our original five-stage system—its rationale, elements, and operating logic. Section 3.2 then details its empirical evaluation.
3.1.1. Overview of the Proposed Model
Inspired by Toyota’s principle of making problems visible and developing people to solve them [2], the framework integrates problem exposure and resolution. Its purpose is to provide a robust mechanism for continuous improvement and systematic capability development.
While Lean practices are widespread, many firms still lack a fully integrated system that both identifies operational deviations and ensures their permanent resolution. To address this gap, the model unfolds as a five-stage cycle designed to detect, analyse, and eliminate problems at the root. The novelty is not the individual tools per se, but the specification of cadence, triggers, roles, and verification steps that connect them into a single, closed-loop routine for daily operations.
The first three stages: definition of (i) KPIs, (ii) visual management, and (iii) standardised shop-floor routines, constitute the foundation for reliable problem exposure. The final two components: (iv) action monitoring board, structured problem analysis and resolution using PDCA, and (v) a formal escalation mechanism (“chain of help”), form a solution engine that drives sustained corrective action and organisational learning. By embedding these five components into a disciplined, standardised, human-centred framework, the model specifies cadence, triggers, roles, and verification steps that turn daily operations into a repeatable learning routine (Figure 1).
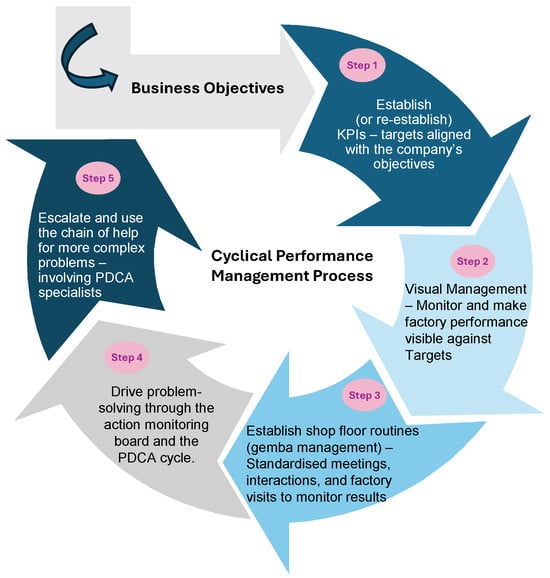
Figure 1.
The five-stage cycle to improve efficiency and operational sustainability.
3.1.2. Definition of KPIs (Stage 1)
KPIs are measurable indicators that express how effectively an organisation achieves its strategic objectives in both production and non-production areas. In manufacturing, they serve as a practical compass, translating long-term goals into concrete targets, making both progress and deviations visible, and guiding corrective actions when necessary. It serves as a managerial tool for tracking and managing processes, ensuring desired performance levels are achieved. By providing objective, accurate information on the course of production activities, they enable decision-makers to identify weaknesses and continuously adjust operations, thereby maintaining alignment between day-to-day routines and the overall business strategy [28].
Pour et al. [29] emphasise the importance of KPIs. In their work, “An Industry 4.0 Technology Selection Framework for Manufacturing Systems and Firms Using Fuzzy AHP and Fuzzy TOPSIS Methods,” the KPIs were established across four dimensions: Production, Environmental, Social, and Economic. Within production dimensions, KPI definition is foundational: it highlights ISO 22400’s set of 34 KPIs for manufacturing operations management. It recommends organising KPIs into categories aligned with production goals so that they can be selected and cascaded appropriately. The study reinforces the power of the Key Performance Indicators outlined in this paper as the first stage.
In the present model, KPIs are anchored in five fundamental pillars: Safety (including environmental management), Quality, Delivery (customer service and reliability), Cost/Productivity, and People. The definition of KPIs begins with senior leadership, ensuring that each indicator is directly linked to the company’s long-term strategy. Once defined, these targets are systematically cascaded through successive organisational layers—business units, production areas, and individual lines—so that the objectives remain coherent and measurable at every level. Performance-monitoring frameworks stress that indicators must be chosen and optimised at the appropriate level (machine, cell, line, factory, enterprise, and global supply chain), so that decisions are taken where they are most effective [30].
For effective deployment, indicators must be specific, measurable, achievable, relevant, and time-bound (SMART), thereby providing a clear framework for action and accountability. From a practical standpoint, each pillar is translated into both corporate-level and shop-floor metrics.
Safety: At the executive level, performance is tracked through company-wide lost-time accident rates, which are then broken down to individual production lines by monitoring incidents and near-misses.
Quality: Senior management can employ measures such as Complaints Per Million (CPM), which are further detailed at the operational level by counting non-conformities or inspection deviations.
Delivery: Company-wide efficiency can be assessed using the On-Time-In-Full (OTIF) rate, while line-level monitoring compares planned versus actual output on an hourly or shift basis. OEE is widely recognised as one of the most crucial performance indicators for evaluating the effectiveness of individual equipment and integrated production systems [31], as it combines availability, performance, and quality into a single, actionable metric. In this case, the planned output per hour translates to the required OEE for the business through each machine/line.
Cost/Productivity: The application of Lean tools will improve cost control through indicators [32]. In this case study, corporate profitability is evaluated through financial indicators such as net income, gross margin, and cost of goods sold, complemented by plant-wide effectiveness measures. At the operational level, losses are tracked in Kilograms or as a percentage of production, alongside a changeover that exceeds the planned amount.
People: Employee engagement can be evaluated using recognised external benchmarks, such as Gallup or Great Place to Work (GPTW) surveys. These can be translated into shop-floor metrics, such as absenteeism and punctuality rates, or into engagement indicators tailored to shift-level leadership teams.
By establishing KPIs along these five pillars and ensuring their systematic deployment from strategy to shop floor, the organisation initiates the first stage of the proposed closed cycle. This structured alignment lays the foundation for continuous improvement, enabling rapid identification and resolution of deviations while fostering a culture of transparency and shared accountability.
3.1.3. Visual Management (Stage 2)
Once organisational KPIs for production lines have been defined and deployed, performance and emerging problems must be visible to those executing the process. The model therefore uses visual management boards as a simple, shared control that enables operators and leaders to track progress in real time and respond promptly to deviations. In Lean contexts, visual management must be immediately legible: simplicity, standardisation, availability, and easy access are essential requirements for supporting planning and control [33]. Beyond communication, visual controls support teamwork and day-to-day problem-solving by making priorities and deviations explicit [33]. Similarly, Pawlik et al. [34] found that visual control boards make performance and abnormalities explicit, enabling deviations to be highlighted and discussed daily. When a workstation does not meet the plan, the leader records the cause and prioritises corrective action. Across the cases examined, rapid detection of abnormalities was consistently emphasised as an enabler of timely corrective action. Together, these studies support the use of visual management as an early-stage mechanism to surface abnormalities and structure daily discussions, which, in turn, feed the subsequent stages of the closed-loop routine.
In this study, the boards follow a clear, intuitive layout that presents hourly production targets and shift performance. Data is recorded directly during operations using a simple colour-coding system: green indicates performance that meets or exceeds the target, while red immediately signals any shortfall (see Figure 2 for an illustrative example of the overall board layout across Safety, Quality, Delivery, Costs and Escalation/People in a 12-h shift pattern; Figure 3 and Figure 4 provide enlarged sections for a more detailed view).
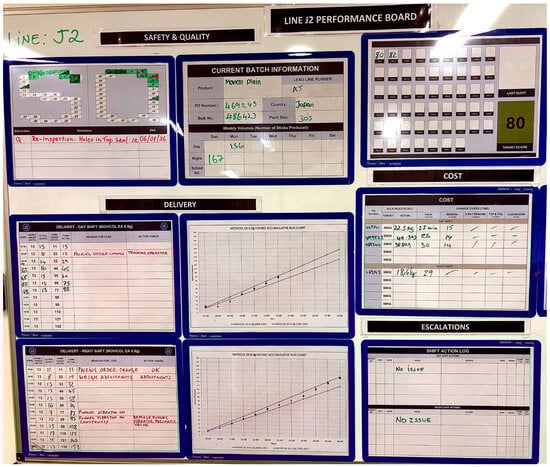
Figure 2.
Real example of a line visual board in practice.
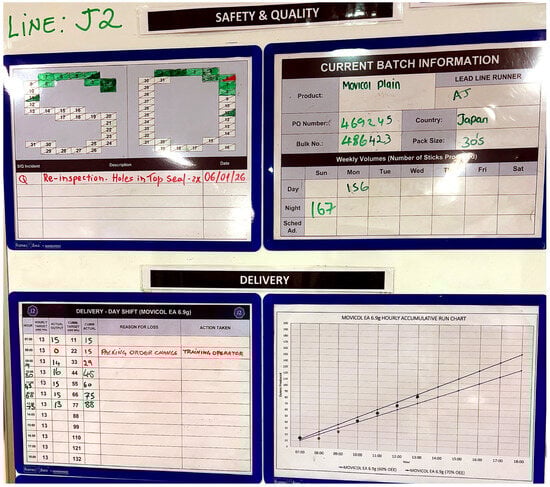
Figure 3.
Detailed example of the Safety, Quality sections and Delivery part (single-shift view), of the visual board.
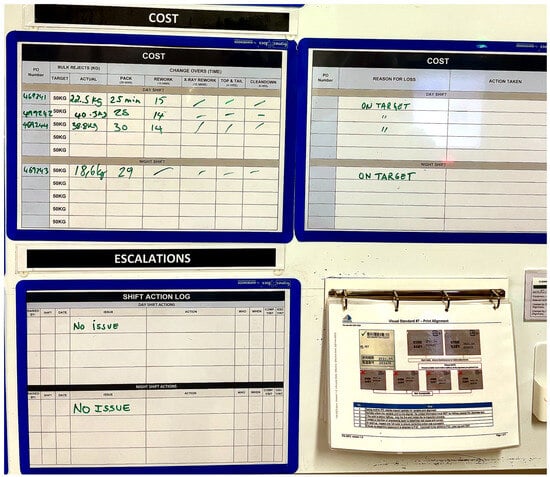
Figure 4.
Detailed example of Costs and Escalations (including People) part of the VM.
The approach is applied across the five key dimensions:
Safety: Any incident occurring during the shift is recorded and triggers a red status in the safety section, which is then discussed in the DOR (Daily Operational Review) meeting. Any safety issue triggers a PDCA level 1 or 2 (Stage 4 in Section 3.1.5).
Quality: deviations or rework are tracked; any occurrence results in red marking and is discussed in the DOR meeting. A quality problem also requires raising PDCA.
Delivery: Hourly production is compared to the planned target; values are logged in green when achieved and red when they fall below plan, allowing for near real-time tracking. The cumulative values are also included in the graphics beside the hourly control table.
Cost/Productivity: losses/waste during the shift are recorded using the same green/red logic to flag variances. Changeovers are monitored using planned-versus-actual time, with the same visual cues.
People: absenteeism and late arrivals are monitored, with any occurrence displayed in red in the escalations section of the board. This is escalated to Team Leaders and, when required, to Shift Leaders to review priorities and redeploy resources to the line.
In the escalation area, if any production interruption exceeds 3 h, a simplified “Level 1” PDCA must be initiated. This structured mini-cycle focuses on rapid root-cause identification using the “five whys” and immediate containment (as explained in Section 3.1.5)–See Figure 3 and Figure 4.
To sustain the process, team leaders and maintenance technicians receive specific training on the effective use of the boards and supporting PDCA routines. In this way, visual management not only reports outcomes but also facilitates effective decision-making. Still, it actively triggers Stage 4 of the model: problem analysis and resolution through the action-monitoring board and PDCA cycle, ensuring that deviations are both visible and systematically addressed.
3.1.4. Standardised Gemba Routines (Stage 3)
The third stage of the model establishes disciplined, standardised factory routines to systematically capture, understand, and address issues arising from day-to-day production activities and more complex organisational processes. By embedding structured meetings and scheduled checkpoints into the operational rhythm, this stage ensures that problems are detected early and channelled to the appropriate level for resolution—either through immediate countermeasures or, when necessary, through the formal problem-solving process described in Stage 4. This process is also called “Gemba Management”.
Gemba literally means ‘the real place’—the shop floor—where value is created and where managers go to observe conditions directly and support problem solving, consistent with the principle of genchi genbutsu (‘go and see for yourself’ to understand the situation thoroughly) [10,35]. Empirical evidence in remanufacturing also indicates that production analysis boards make deviations visible for daily discussion, with issues reviewed at short intervals by production and engineering leadership [34]. Together, this supports the practical role of gemba-based daily management routines in accelerating detection, coordination, and response.
Production analysis boards placed near machines display hour-by-hour plan-versus-actual data, require the cause to be recorded when targets are missed, and serve as a visualisation of problems at the shop floor level. Daily stand-up reviews in front of the area board consolidate performance, quality, safety and 24 h issues, with KPIs posted on the board to support action. When an area fails to meet the plan, the area leader immediately investigates and records the cause on the board. In remanufacturing, where the quality of incoming cores varies and new issues arise frequently, rapid on-site identification is essential to stabilise the process. Every few hours, the production manager and the process engineer review the flagged deviations; even when a definitive fix cannot be implemented within the facility, the information captured is passed to planning so cycle-time expectations and resources can be adjusted and future recurrence reduced [34]. This part resembles stages four and five of this paper, with the start of a problem-solving process and a chain of help.
Powell et al. [36] also underscores the need for a standardised framework for successful lean implementation. In their work, they focus on Lean as an education system rather than a production system, including Action Learning (AL), with learning rooted in real tasks, problem-solving via incisive questioning, and learning-by-doing, as well as Lean Assessments and Gemba Walks. Action Learning through Gemba walks and problem-solving emerges as a critical success factor for the deployment of lean management [36], reinforcing Stage 3 (this section) and Stage 4 (the next section) of the present work.
For this study, to ensure coverage across the entire production cycle, these routines are arranged at multiple time horizons—per shift, daily, weekly, and monthly—creating a continuous loop of monitoring and action (Figure 5).
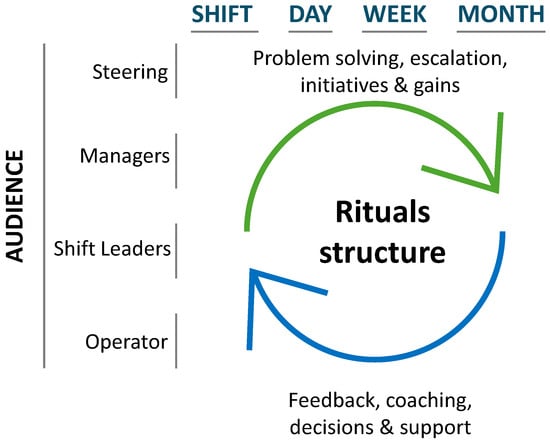
Figure 5.
Standardised shop-floor routines cycle.
- -
- Using a two-shift model (12 h × 12 h, four days on/three days off), the routines are summarised as follows:Shift Handover (SH): Structured transfer of critical operational information between outgoing and incoming teams.
- -
- Shift Operational Review (SOR): About one hour after SH; validates initial shift status and decides immediate escalations.
- -
- Short Interval Control (SIC): Two scheduled checks per shift; leaders and maintenance review lines in front of the VM boards.
- -
- Daily Operational Review (DOR): 24 h performance review; confirms short-term corrective/preventive actions.
- -
- SQDC: Cross-functional review of Safety, Quality, Delivery and Cost; integrated action plan created/updated.
- -
- Reliability Meeting (RM): Weekly Pareto of losses and key breakdowns; PDCA actions defined and owners assigned.
- -
- Weekly Operations Review (WOR): Trends in OEE, losses and people; ensures alignment with plant-level objectives.
- -
- Continuous Improvement (CI): Follow-up on open PDCAs, help chain escalation and triage of new improvement opportunities.
- -
- Monthly Operational Review (MOR): Executive-level review of monthly/quarterly trends and target attainment.
By consistently applying these routines, the organisation establishes a stable operational rhythm that strengthens communication across hierarchical levels, accelerates decision-making, and reinforces accountability, sustaining and improving performance, supporting frontline employees who ultimately create real value for the business (Figure 6). This disciplined cadence transforms continuous improvement from an occasional initiative into a daily management practice, thereby sustaining productivity gains and supporting long-term organisational growth. A concise timetable appears in Figure 7; detailed agendas are provided in Appendix A.
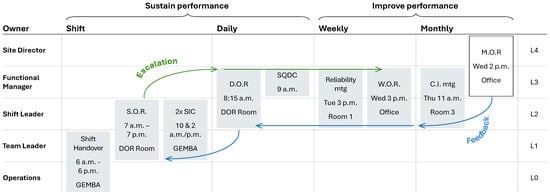
Figure 6.
Gemba management routines cycle.
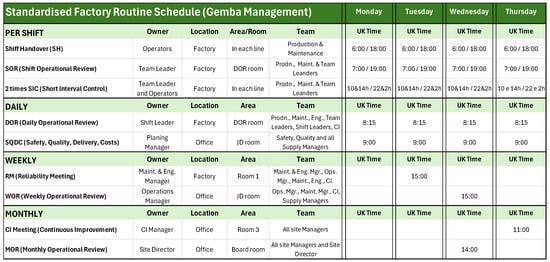
Figure 7.
Detailed schedule for the standardised factory routines.
3.1.5. PDCA and Action-Monitoring Board (Stage 4)
Several authors argue that the PDCA cycle is far more than a lean manufacturing tool; rather, it represents a continuous-improvement philosophy embedded in organisational culture, fostering ongoing learning and systematic knowledge creation [37]. Additionally, PDCA has been demonstrated to work in strong synergy with a range of continuous improvement tools and methods. Its flexibility allows it either to serve as a central framework for complex improvement strategies or to operate in combination with other approaches within hybrid models [38]. Building on this understanding, the fourth stage of the proposed model acts as a solution engine, transforming problem identification into a rigorous and standardised resolution process through the combined use of an action-monitoring board—referred to here as a kamishibai board due to its similar visual structure—and the PDCA (Plan–Do–Check–Act) methodology.
Within Lean management, a kamishibai board serves as a visual control system, ensuring that essential shop-floor activities—such as safety checks, 5S audits, and routine equipment inspections—are consistently performed. Each task is represented by an individual kamishibai card, which specifies the activity, its frequency, and the person responsible. In the present study, the action-monitoring board employs the same visual logic, using cards of a similar format to record, track, and close out improvement actions; however, its primary purpose is to operate as an action-tracking mechanism rather than as a conventional audit tool (see Figure 8).
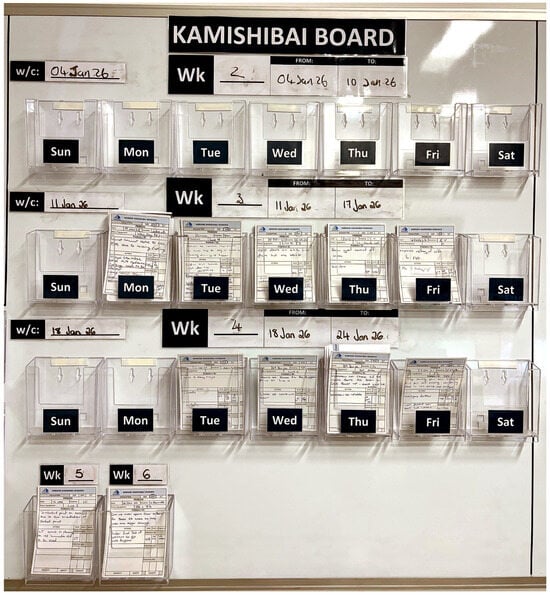
Figure 8.
A real example of an action-tracking (kamishibai) board.
Located in the central production area, the room and the board provide a focal point for key daily management routines, including the Shift Operational Review (SOR) and the Daily Operational Review (DOR). Issues detected during these meetings are documented on action cards and placed on the board, each with a clearly defined completion deadline. Progress is reviewed and updated against these dates with strict discipline. This time-bound, highly visible process ensures that observations requiring immediate action are not lost in scattered spreadsheets or diluted in overly complex action plans, a common deficiency of conventional follow-up systems. Figure 9 shows an action-tracking card design alongside a real-case card.
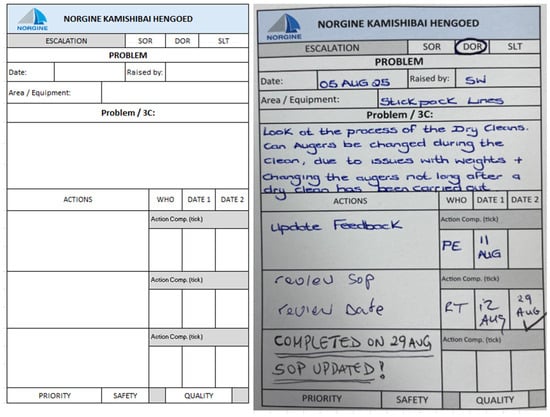
Figure 9.
Action-tracking card design beside a real case card.
For more complex or recurring problems, a two-tier PDCA approach is applied:
Level 1 PDCA provides a straightforward and rapid problem-solving approach. Operators and maintenance technicians are trained to work on a single A4 sheet, following four concise steps: defining the problem, implementing immediate containment countermeasures, identifying root causes using the Five Whys technique, and setting permanent corrective actions to prevent recurrence.
Level 2 PDCA adopts the more comprehensive A3 format standard in Lean practice, following an eight-step structure: (1) problem statement; (2) detailed situational analysis supported by facts and data; (3) goal setting; (4) root-cause analysis; (5) action-plan development; (6) result tracking; (7) standardisation of successful implemented actions; and (8) recognition, reflection, and sharing of lessons learned.
By integrating visual management with these two-tier PDCA routines, the model provides a robust and repeatable mechanism for continuous improvement. This disciplined approach not only accelerates the resolution of operational issues but also sets the stage for the final escalation process, where particularly complex or persistent problems are addressed through a well-planned chain of help.
3.1.6. Escalation and Tiered Help Chain (Stage 5)
The fifth and final stage of the model establishes a structured escalation and “chain of help” mechanism, ensuring that issues which cannot be resolved through the regular PDCA process are addressed quickly and effectively. While the previous stage focuses on disciplined problem-solving within production teams, this stage provides a formal pathway for problems that persist or require expertise beyond the shop floor.
The help chain is a standardised, time-bound mechanism through which frontline personnel signal an abnormality and have the appropriate knowledge mobilised to respond. It promotes “one-problem flow”: a single issue is addressed at the gemba to restore normal conditions and prevent propagation. In practical terms, the help chain specifies (i) the triggers that initiate support, (ii) the visual signals that make the deviation explicit, (iii) the roles accountable for the response, and (iv) the rules for tiered escalation when resolution is not achieved within defined limits. It also requires capturing and feeding back what was learned so that effective countermeasures are standardised and recurrence is avoided [8]. The escalation framework adopts a clear, time-bounded hierarchy to prevent prolonged equipment downtime and unresolved systemic failures. Unresolved issues advance through predefined tiers within set time limits, typically initiated by an andon signal [9]. In the current example, suppose a critical asset—previously identified by senior management as strategically essential—remains out of service for more than 30 min. In that case, the operator responsible must immediately inform the team leader and maintenance technician. Should the interruption exceed one hour, the team leader escalates the issue to production and maintenance supervisors. After two hours, supervisors are required to notify their respective managers. If the stoppage reaches four hours, the plant director is informed, regardless of whether the incident occurs during day or night shifts.
Beyond unplanned downtime, the escalation tool also applies when a Stage 4 PDCA action remains unresolved within an agreed timeframe, or when internal capabilities prove insufficient to identify and eliminate the root cause. In such cases, the matter is transferred to a specialist team—often including senior engineering or experts—under the guidance of the company managers.
This structured “chain of help” serves two complementary purposes: it reduces mean time to resolution by ensuring rapid mobilisation of the right expertise, and it maintains process ownership by documenting and reviewing each escalation step. As a result, the organisation minimises production losses while strengthening cross-functional collaboration and accountability.
Methodologically, Stages 4 and 5 operationalise the intervention through an action tracker, PDCA L1–L2 with auditable time limits, and a tiered, time-bounded help chain, ensuring execution, escalation when needed, and standardisation, with feedback to KPIs and daily routines [8,9,37,38].
Once all five stages of the model are fully implemented and results stabilised, targets are systematically re-evaluated, initiating a new continuous improvement cycle. In this way, the escalation process not only acts as a safety net for exceptional cases but also closes the loop conceptually and operationally, linking back to KPI review and target setting to sustain long-term performance.
3.2. Research Design, Data, Measures, Analysis, and Validity
This research adopts a longitudinal, single-site field intervention with a quasi-experimental before-and-after design, standard in Operations Management (OM) case research. Following OM guidance, we ensured clear operational definitions of constructs, transparent data protocols, and triangulation to support construct and internal validity, as well as practical relevance [39]. See Ethics for details on confidentiality and independence.
- -
- Assumptions and scope: The intervention assumes a discrete, line-based production setting where (i) plan-versus-actual can be observed at short intervals; (ii) losses can be classified into availability, performance and quality; and (iii) shop-floor routines can be standardised without compromising GMP compliance. The routine is not presented as universal; effectiveness is expected to be context-dependent (e.g., product mix, regulatory constraints, equipment criticality, and maturity of existing routines).
- -
- Site and units: Regulated pharmaceutical plant (discrete processing with high compliance). Primary unit: the bottleneck line (Line 9); site-wide aggregated indicators (e.g., total output, plant OEE) were tracked for context. The trial site is Norgine’s Hengoed (Wales, UK) plant, operating under Good Manufacturing Practice (GMP) within the UK regulatory framework (MHRA oversight). The unit exhibits a relatively strong quality discipline (mature SOPs and audit readiness).
- -
- Authors’ roles: Author 1—lead designer of the five-stage routine and on-site facilitator; Author 2—methodological oversight and validation.
- -
- Time horizon and phases (19 months; January2024–July2025): Baseline (January–June 2024) reflects the pre-intervention state before Stage 1–3 routines were standardised and before PDCA/action-tracking and escalation rules were formally activated. Ramp-up (July–December 2024) covers the embedding of Stages 1–3 (KPI cascade, visual management, and standardised shop-floor cadence). Steady state (January–July 2025) corresponds to full operation of the solution engine (Stages 4–5), with two-level PDCA, action tracking, and tiered escalation operating under defined triggers and review cycles.
- -
- Data and measures: (i) hourly plan-versus-actual and line visual boards; (ii) downtime/breakdown records; (iii) instantaneous line velocity versus planned rate; (iv) quality deviations/rework logs; (v) people availability/attendance. Primary outcome: OEE for Line 9 (integrates availability, performance, quality) [31]. Secondary indicators: losses/waste, changeover overruns, safety/quality incidents. All measures were captured via line visual boards and the production/OEE system (automated records for downtime, speed, rejects), with daily reconciliation during the DOR meetings (see Section 3.1.4). Due to a confidentiality agreement with the host company, the specific manufacturer/model of the Line 9 equipment and the proprietary production/OEE system are not disclosed. Operational definitions, data sources, capture frequency, and decision rules (including PDCA/escalation triggers) are summarised in Appendix B (Table A1).
- -
- Data validation: Automated OEE inputs (downtime, speed, and rejects) were cross-checked against the shift visual boards during the DOR meetings. Any discrepancies were logged and corrected using the plant’s standard data-correction workflow. For critical events (extended stops and quality deviations), entries were verified against maintenance records and quality logs.
- -
- Implementation protocol: Five-stage cycle: KPIs cascaded top-down; visual boards; shift/daily/weekly/monthly routines; action-monitoring board (kamishibai-like); PDCA Level 1 (L1)–Level 2 (L2); help chain (tiered escalation). Fidelity implementation was supported by intensive training and explicit triggers (e.g., interruptions > 3 h → PDCA L1; unresolved PDCA within the site team → escalation). Help-chain design—triggers, visual signalling, accountable roles, and tiered operating logic—follows published guidance [8]. All protocols are detailed in Section 3.1.2, Section 3.1.3, Section 3.1.4, Section 3.1.5 and Section 3.1.6.
- -
- Analysis: We analysed monthly OEE as a longitudinal outcome across three phases (baseline, ramp-up, steady state). We report phase-wise descriptive summaries (mean and standard deviation) to characterise central tendency and variability, alongside the time-series trajectory shown in Figure 10. Phase differences are reported as absolute percentage-point changes and relative improvements. As robustness checks, we examined shutdown months, re-estimated summaries excluding those months, and decomposed OEE into availability, performance, and quality contributions to understand which component(s) drove the observed change. Given the single-site, non-randomised design, we treat the quantitative results as field evidence rather than causal estimates. Descriptive statistics were computed in Microsoft Excel 2024 (Microsoft Corporation, Redmond, WA, USA).
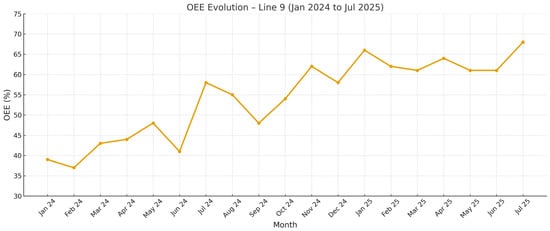 Figure 10. Line 9 OEE (Overall Equipment Effectiveness) evolution.
- -
- Potential confounds: We tracked significant operational changes that could affect OEE independently of the routine (e.g., major equipment upgrades, planned shifts in maintenance strategy, product-mix changes, and extended shutdowns). No major step-change capital intervention on Line 9 was recorded during the study window. Line 9 operated under sustained demand pressure as the site bottleneck; however, product mix may still influence performance and is treated as a contextual factor in interpretation.
- -
- Validity and reliability: Mitigations included a continuous pre–post series; triangulation across the production/OEE system, visual boards, and quality logs; and explicit, auditable PDCA/escalation triggers. Construct validity was supported by operational definitions and triangulation across sources; reliability by standardised capture on visual boards and in the production/OEE system. Internal validity was strengthened through simple robustness checks (e.g., excluding shutdown months and decomposing OEE into availability, performance, and quality). External validity is limited to the single-site context; any transfer is analytical and context-dependent [39].
- -
- Ethics: No human subjects beyond routine managerial roles; no identifiable personal data; commercially sensitive operational data were treated as confidential; the company had no control over analysis or publication decisions.
4. Results
The proposed five-stage daily management routine was implemented in a regulated pharmaceutical manufacturing plant in Hengoed, Wales (UK). The intervention targeted recurring losses and deviations that constrained throughput on the site’s primary bottleneck (Line 9). The primary quantitative outcome was monthly Overall Equipment Effectiveness (OEE) for Line 9, complemented by output indicators. Line 9 manufactures Moviprep and Plenvu bowel-preparation products, which are strategically relevant within the company’s portfolio.
4.1. Implementation Status and Fidelity
Implementation followed the three phases defined in Section 3.2. During ramp-up (July–December 2024), Stages 1–3 (KPI cascade, visual performance boards, and standardised gemba routines) became the default cadence for daily management on Line 9. During steady state (January–July 2025), the solution engine (Stages 4–5) operated routinely, including action tracking, two-level PDCA (L1/L2), and tiered escalation under explicit triggers and time bounds.
Fidelity was assessed through routine execution evidence, including (i) completion and use of the shift/DOR visual boards, (ii) action-tracking records showing ownership and closure, (iii) documented PDCA initiation (and closure) when trigger thresholds were reached, (iv) regular conduct of scheduled shop-floor reviews (e.g., SIC/SOR/DOR as applicable), and (v) escalation records when actions exceeded agreed time bounds. Automated OEE inputs were reconciled daily against shop-floor records during the DOR meetings, as described in Section 3.2.
4.2. Primary Outcome: Line 9 OEE over Time
Figure 10 reports the monthly OEE trajectory for Line 9 from January 2024 to July 2025. In the baseline period (January–June 2024), OEE ranged from 37% to 48% (mean 42.0%). During ramp-up (July–December 2024), OEE increased to 48–62% (mean 55.8%). In steady state (January–July 2025), OEE stabilised at a higher level, ranging from 61% to 68% (mean 63.3%).
Table 1 summarises descriptive statistics by phase (including min–max and standard deviation). The full monthly series used for calculations is provided in Appendix C to support transparency and reproducibility.

Table 1.
Monthly OEE and total output by study phase (Line 9).
The output from Line 9 was tracked in parallel (Appendix C). Across the observation window, monthly total production increased from approximately 1.0 million packs in early 2024 (first quarter) to approximately 1.5–1.6 million packs in 2025. Product mix varied over time and is therefore treated as contextual information when interpreting the OEE trajectory and output trends.
5. Discussion and Conclusions
The results indicate that integrating problem exposure and disciplined resolution within a single closed-loop cycle can deliver sustained improvements in operational performance. This study addresses the gap identified in the Introduction: the absence of a straightforward, shop-floor-ready cycle that systematically identifies problems, resolves them through disciplined actions, and escalates them when necessary. Two research questions guided the study. RQ1: How to integrate widely used Lean practices into a practical, closed-loop routine? RQ2: What operational and organisational effects result from embedding this routine in daily management?
Answer to RQ1—integration into a closed loop: Section 3.1 specifies a five-element architecture: (1) KPI cascade, (2) visual management, (3) standardised gemba routines, (4) action-monitoring board and two-level PDCA, and (5) a tiered help chain with explicit cadence, roles, and triggers. This moves beyond fragmented tool use by defining a repeatable, end-to-end routine that supports capability development and organisational learning.
Answer to RQ2—operational and organisational effects: Quantitatively, Line 9 OEE rose from 42.0% (baseline) to 63.3% (steady state), an over 50% relative gain, with total plant output increasing 20% YoY in 2024 (context indicator). Qualitatively, time-to-resolution was shortened via the help chain; cross-functional coordination increased through gemba routines. Learning was institutionalised by standardising effective countermeasures on the boards and through PDCA closure. In parallel, we noted qualitative signals of higher engagement on and off the shop floor (e.g., increased participation in SIC/SOR/DOR/MOR, etc., more timely card updates on the action board, and quicker response to escalation calls), consistent with evidence that Lean routines can enhance job satisfaction, autonomy, and participation [21,22,24]. While engagement was not directly measured in this pilot, these observations align with prior findings (Section 2.4) and suggest a plausible pathway from visibility and ownership to improvements in organisational climate.
Positioning and boundary conditions: Prior Lean implementation research reports mixed outcomes and highlights that tool deployment without explicit ownership, escalation pathways, and verification cycles may stall or deteriorate over time (as synthesised in Section 2.7). In this field intervention, the routine’s explicit cadence, triggers, and time-bounded help chain likely mitigated these known failure modes by accelerating detection, enforcing follow-up, and standardising learning through PDCA closure. Quantitatively, Table 1 and Appendix C indicate not only a higher OEE level across phases but also a stabilisation pattern consistent with reduced month-to-month volatility in steady state, while acknowledging that monthly aggregation and context factors (e.g., shutdowns and product mix) can still influence observed variability. Accordingly, the evidence should be interpreted as applied field support for the proposed closed-loop routine, rather than a causal estimate.
Three factors in particular explain these outcomes:
- Visibility and fast reaction.
The combination of visual management, linked to business KPIs, and Gemba-based routines ensured that deviations were identified within hours (sometimes minutes), allowing immediate countermeasures to be taken and preventing the situation from worsening.
- Structured root-cause elimination.
The action tracker (kamishibai-like) and two-level PDCA process provided a repeatable mechanism for addressing both quick fixes and deeper systemic causes. This dual approach explains the shift from short-term recovery (July–December 2024) to long-term stability (January–July 2025).
- Escalation discipline.
The “chain of help” acted as a formal backstop when in-house expertise was insufficient, ensuring that critical incidents never came to a standstill.
Compared with more tool-fragmented Lean deployments, the routine was associated with stabilisation (Table 1 and Appendix C) and with qualitative signals of organisational learning through PDCA closure and standardisation.
These findings support the view that Lean is not merely a set of tools but a management philosophy that depends on standardised, human-centred routines [2,21,24].
Relation to prior work: This reading is consistent with evidence that Lean tools tend to produce more durable effects when embedded within a disciplined system framework [2,4,5,6,7]. Prior PDCA cases demonstrate reductions in defect and scrap rates [37,38]. In parallel, help-chain mechanisms support frontline personnel in escalating and resolving abnormalities [8,9], while KPI frameworks emphasise alignment across organisational layers [30]. Our contribution consists of operationalising some of these tools into a single daily management routine that specifies visibility, cycle, rhythm, triggers, and who escalates what, when, and how learning is standardised.
5.1. Practical Implications
The present methodology can be replicated as an intervention protocol in other industrial contexts, subject to local conditions (e.g., regulatory constraints, organisational structure, and baseline maturity) and implemented with fidelity to the specified cadence, triggers, and ownership mechanisms. Its strength lies in combining disciplined routines with sufficient operational flexibility to adapt to different organisational cultures. Julião et al. [40], in A Systematic Lean-Driven Framework for Warehouse Optimization, proposed a Lean-based methodology organised into three sequential steps: Define (Diagnosis), Improve, and Control. Although their approach employs different tools and lacks a cyclical structure, their findings support the idea that Lean-based management architecture, such as the one proposed here, can also be effectively applied in logistics operations. In practice, the value resides in specifying roles, triggers, and ownership, allowing the routine to be transplanted with minor tailoring rather than redesigned from scratch.
5.2. Limitations and Future Research
Three constraints should be acknowledged. First, this is a single-site, single-line, quasi-experimental pre–post field intervention without randomisation or a parallel control, which limits causal inference and leaves the possibility of unobserved confounding factors. Second, outcomes are reported on a monthly aggregate basis; although automated OEE inputs were reconciled against factory records and robustness checks were applied (e.g., excluding shutdown months and decomposing OEE components), measurement practices, shutdown effects, and product-mix variation may still influence estimates. Third, the pilot site operated under sustained bottleneck demand and a relatively high baseline quality discipline, which may have accelerated adoption compared with lower-maturity environments. Therefore, transferability should be treated as analytical and context-dependent, and future studies should test the routine across multiple sites and sectors, ideally using comparative designs with stronger controls.
Future research could address these limitations by testing the model in other contexts, such as food processing, logistics, or electronics manufacturing, as well as in service settings where processes are less standardised. Comparative studies across different cultural settings and maturity levels would help clarify the model’s scalability and the factors influencing its adoption rate.
Further work may also explore how emerging digital technologies, such as real-time data analytics and Industry 4.0 tools, can enhance or even automate certain stages of the cycle, further increasing responsiveness and potentially reducing the implementation and stabilisation time.
5.3. Conclusions
In summary, this study shows that integrating problem visibility, root-cause elimination, and structured escalation into a single closed-loop cycle can support improvements in operational efficiency and organisational learning. The industrial case suggests that a disciplined yet flexible management architecture can turn recurring inefficiencies into opportunities for systematic improvement.
Beyond the quantitative gains observed, such as a >50% relative increase in OEE (with steady-state months in the 61–68% range), the proposed model offers a more fundamental contribution; it shows that sustainable performance improvement does not arise from isolated initiatives but from integrating interdependent processes into a consistent daily management rhythm. The integration of these five techniques is an innovation that enables quick detection of abnormalities, structured analysis, and prompt resolution, turning continuous improvement into an embedded organisational habit rather than a periodic exercise. The model also advances Lean theory by bridging the persistent gap between tools and systems. In doing so, it offers a practical pathway to operational excellence that is both measurable and repeatable as a specified routine, with transferability requiring contextual tailoring and further multi-site testing across sectors and maturity levels.
Overall, the study shows that a specified cadence—visibility, action tracking, PDCA discipline, and time-bounded escalation—can be integrated into daily shop-floor management in a regulated environment, with observable performance effects. For researchers, the contribution is a fully operationalised routine (roles, triggers, and verification) that can be tested across sites and sectors. For practitioners, it provides a practical template that can be adopted with local tailoring. Future studies should strengthen causal inference through multi-site comparative designs and directly measure people-related outcomes (e.g., engagement and culture) rather than relying solely on field observations.
Author Contributions
Conceptualization, M.J.d.A.F. and D.D.d.M.; Methodology, M.J.d.A.F.; Validation, D.D.d.M.; Formal analysis, M.J.d.A.F.; Investigation, M.J.d.A.F.; Data curation, M.J.d.A.F.; Writing—original draft, M.J.d.A.F.; Writing—review and editing, D.D.d.M.; Visualization, M.J.d.A.F.; Supervision, D.D.d.M.; Project administration, M.J.d.A.F. All authors have read and agreed to the published version of the manuscript.
Funding
This research received no external funding.
Data Availability Statement
The data are contained within the article.
Acknowledgments
The authors express their gratitude to the Coordenação de Aperfeiçoamento de Pessoal de Nível Superior—Brasil (CAPES) and to the Conselho Nacional de Desenvolvimento Científico e Tecnológico—Brasil (CNPq).
Conflicts of Interest
The authors declare no conflicts of interest.
Appendix A. Detailed Agendas for Standardised Shop-Floor Routines
- Per-Shift Routines:
Shift Handover (SH): Operators, team leaders, and shift supervisors transfer critical operational data and ongoing concerns in a structured, standardised format to ensure continuity and precision.
Shift Operational Review (SOR): Conducted approximately one hour after the handover with key operators, team leaders, and shift leaders, this meeting provides a systematic forum to validate the initial shift status and escalate any urgent issues.
Short Interval Control (SIC): Two time-boxed checkpoints per shift during which team leaders, supervisors, and maintenance technicians inspect all production lines to identify anomalies and implement immediate corrective actions. This check is done in front of the Visual Management board of all lines.
- Daily Routine:
Daily Operational Review (DOR): Brings together production and maintenance managers, planners, and line leaders to review the past 24 h’ performance, identify trends, and set short-term corrective or preventive actions.
Safety, Quality, Delivery, and Costs (SQDC): Managers from logistics, planning, maintenance, operations, safety, and quality will discuss and address any issues related to these four dimensions (SQDC) over the past 24 h, as well as any logistics or planning problems that have arisen. An action plan is created in this meeting to mitigate the problems encountered.
- Weekly Routine:
Reliability Meeting (RM): Utilises Pareto analysis to identify and assess recurring losses and key breakdowns from the previous week. Actions are defined following the PDCA methodology to eliminate root causes and prevent recurrence.
Weekly Operations Review (WOR): Examines trends in OEE (Overall Equipment Effectiveness), Waste/Loss opportunities, and any personnel concerns, while also focusing on unit engagement. It is at a more managerial level to ensure alignment with plant-wide strategic objectives.
- Monthly Routine:
Continuous Improvement Meeting (CI): Focuses on the follow-up of ongoing PDCAs projects, help chain and the evaluation of new opportunities for process enhancement.
Monthly Operational Review (MOR): an executive-level meeting provides a high-level analysis of monthly, quarterly, semi-annual, and annual trends, verifying progress toward strategic business goals and ensuring integration between long-term planning and daily management.
Appendix B
Table A1.
Detailed information of measures and tools.
Table A1.
Detailed information of measures and tools.
| Measure/Tool | Operational Definition | Data Source | Capture Frequency | Trigger/Decision Rule (Routine Link) | Notes/Validation |
|---|---|---|---|---|---|
| Overall Equipment Effectiveness (OEE)— Line 9 (primary outcome) | OEE = Availability × Performance × Quality (A × P × Q). Reported as %. | Production/OEE system (automated) + visual board cross-check | Monthly for reporting; reviewed daily/weekly via routine meetings | Used as headline performance indicator; driver decomposition (A/P/Q) used in robustness checks and reviews | Daily reconciliation with the Continuous Improvement team and in DOR; investigate discrepancies between system and board entries |
| Availability (A) | A = Operating time/Planned production time. Downtime reduces operating time. Reported as %. | Production/OEE system downtime log + line board notes | Hourly logging; rolled up daily/weekly/monthly | Unplanned stop >3 h ⇒ PDCA Level 1; escalation tiers per help-chain for critical assets | Downtime reasons validated by team leaders, shift leaders, and the maintenance team during SIC/DOR and Reliability Meetings (RM) |
| Performance (P) | P = Actual output rate/Designed rate. Proxy: instantaneous line velocity vs planned rate. Reported as %. | Production/OEE system (speed/throughput) + hourly plan-vs-actual board | Hourly; reviewed in SIC/SOR/DOR; trended weekly/monthly | Sustained shortfall (red hour blocks) ⇒ immediate countermeasure; recurring loss ⇒ PDCA Level 1 or 2 (A3) | Speed losses discussed by team leaders, shift leaders, and the maintenance team during SIC/DOR and RM. |
| Quality (Q) | Q = Good units/Total units (or 1 − reject rate). Reported as %. | Quality deviations/rework log + production/OEE rejects | Per event; summarised daily/weekly/monthly | Any safety/quality incident or deviation ⇒ PDCA L1 or L2 depending on severity/recurrence | Quality records reconciled with board entries in DOR; QA confirms deviation closure. |
| Hourly plan vs actual output | Planned units per hour compared to actual produced units per hour; coded green (met)/red (miss). | Line visual board (manual capture) | Hourly; reviewed multiple times per shift | Any red hour triggers on-the-spot check; repeated reds drive escalation/PDCA prioritisation | Team leader validates entries during SIC and SH; photos/archives retained per site practice |
| Downtime/breakdown duration | Sum of stoppage minutes by reason/category (e.g., equipment failure, changeover, material). | Production/OEE system log + maintenance records | Continuous; reviewed daily and weekly | Critical stop thresholds follow help-chain tiers (e.g., 30 min → team leader; 1 h → supervisors; 2 h → managers; 4 h → plant director) | Root-cause confirmed through PDCA closure; recurrence tracked in RM Pareto |
| Changeover overrun | Changeover time minus planned standard; reported as minutes over plan. | Production/OEE system timestamps + board notes | Per changeover; reviewed daily/weekly | Overrun beyond defined limit ⇒ immediate containment + PDCA if recurring | Verification via next changeover performance; standard updated if countermeasure is validated |
| Losses/waste | Material losses recorded as kg or % of production, aligned to Cost/Productivity pillar. | Line visual board + production records | Per shift; reviewed daily/weekly/monthly | Exceeds the limit ⇒ PDCA prioritisation in CI/RM; action card opened | Cross-check with mass balance/stock; validation during WOR/MOR |
| Safety incidents/near misses | Count of incidents and near misses; any occurrence flagged red in Safety section. | Line visual board + EHS (Environment, Health and Safety) reporting log | Per event; reviewed daily/weekly/monthly | Any incident ⇒ escalation per site EHS procedure; PDCA L1/L2 opened as required | EHS confirms classification and closure; lessons shared in routine meetings |
| People availability/attendance | Absence and lateness counts (or % attendance) per shift/team. | Shift schedule + line visual board (People/Escalation section) | Per shift; reviewed daily | Absence/lateness triggers reallocation/escalation to team/shift leaders for resource balancing | SIC, SOR, DOR. Validated against HR/schedule records when needed |
| PDCA Level 1 (L1) cases | Rapid A4 problem-solving: problem definition, containment, 5 Whys, permanent action. | PDCA sheets + action-monitoring (kamishibai-like) board | Opened as needed; reviewed at each routine meeting | Triggered by interruption >3 h and other defined deviations; must have owner and due date | Closure requires evidence of effectiveness and a standardisation step. PDCAs’ control in the CI meeting. |
| PDCA Level 2 (L2) cases | A3 problem-solving: structured 8-step analysis, data, countermeasures, standardisation and learning. | A3 documents | Opened for complex/recurring issues; reviewed monthly | Triggered by recurrence or high-impact losses; escalation if overdue or beyond site capability | Reviewed by managers; learning shared and incorporated into standard work. PDCAs’ control in the CI meeting. |
| Help-chain escalations | Tiered escalation path specifying triggers, accountable roles, and time-bounded tiers. | Line visual board/visual signals + escalation log/meeting notes | Event-driven; reviewed daily/weekly/monthly | Escalate unresolved issues through predefined time tiers; specialist support mobilised when required | Each escalation step is documented; outcomes are fed back into PDCA/standards. CI meeting control. |
Appendix C. Line 9 OEE Details
Table A2.
Line 9 OEE and production volumes from 24 January to 25 July.
Table A2.
Line 9 OEE and production volumes from 24 January to 25 July.
| Month | Jan 24 | Feb 24 | Mar 24 | Apr 24 | May 24 | Jun 24 | Jul 24 | Aug 24 | Sep 24 | Oct 24 | Nov 24 | Dec 24 | Jan 25 | Feb 25 | Mar 25 | Apr 25 | May 25 | Jun 25 | Jul 25 |
|---|---|---|---|---|---|---|---|---|---|---|---|---|---|---|---|---|---|---|---|
| Actual OEE (Overall Equipment Effectiveness) | 39% | 37% | 43% | 44% | 48% | 41% | 58% | 55% | 48% | 54% | 62% | 58% | 66% | 62% | 61% | 64% | 61% | 61% | 68% |
| OEE target | 45% | 45% | 45% | 45% | 45% | 45% | 50% | 50% | 50% | 50% | 50% | 50% | 60% | 60% | 60% | 60% | 60% | 60% | 65% |
| Total volume per month (thousand packs) | 1018 | 1001 | 1003 | 1177 | 1164 | 1043 | 1131 | 1243 | 1162 | 1288 | 1522 | 1305 | 1583 | 1531 | 1524 | 1584 | 1527 | 1542 | 1615 |
| Product “Mov” volume (thousand packs) | 335 | 320 | 476 | 123 | 331 | 381 | 435 | 390 | 441 | 345 | 263 | 349 | 327 | 270 | 303 | 333 | 297 | 311 | 294 |
| Product “Plu” volume (thousand packs) | 683 | 681 | 527 | 1054 | 833 | 663 | 696 | 853 | 721 | 943 | 1259 | 956 | 1256 | 1261 | 1221 | 1251 | 1230 | 1231 | 1321 |
References
- Rei, B.M.A. Quantitative Analysis of Lean Applications in Scientific Publications over the Last Two Decades. Master’s Thesis, Instituto Superior de Engenharia de Lisboa (ISEL), Lisbon, Portugal, 2023. (In Portuguese) [Google Scholar]
- Liker, J.K.; Hoseus, M. Toyota Culture: The Heart and Soul of the Toyota Way; McGraw-Hill: New York, NY, USA, 2008. [Google Scholar]
- Čiarnienė, R.; Vienažindienė, M. Lean Manufacturing Implementation: The Main Challenges and Barriers. Manag. Theory Stud. Rural Bus. Infrastruct. Dev. 2013, 35, 41–47. [Google Scholar]
- Spear, S.; Bowen, H.K. Decoding the DNA of the Toyota Production System. Harv. Bus. Rev. 1999, 77, 96–106. [Google Scholar]
- Shah, R.; Ward, P.T. Lean manufacturing: Context, practice bundles, and performance. J. Oper. Manag. 2003, 21, 129–149. [Google Scholar] [CrossRef]
- Bhasin, S.; Burcher, P. Lean viewed as a philosophy. J. Manuf. Technol. Manag. 2006, 17, 56–72. [Google Scholar] [CrossRef]
- Mann, D. Creating a Lean Culture: Tools to Sustain Lean Conversions, 2nd ed.; Productivity Press: Boca Raton, FL, USA, 2010. [Google Scholar]
- Pelizzon, A.; Saurin, T.A.; Marodin, G.A. Help Chain: Guidelines for Design and Operation in Lean Production Systems. Gestão Produção 2019, 26, e1974. [Google Scholar] [CrossRef]
- Gödri, I. An Escalation System for Handling and Analyzing Production Disturbances. Period. Polytech. Mech. Eng. 2024, 68, 141–148. [Google Scholar] [CrossRef]
- Liker, J.K. The Toyota Way: 14 Management Principles from the World’s Greatest Manufacturer; McGraw-Hill: New York, NY, USA, 2004. [Google Scholar]
- Ohno, T. Toyota Production System: Beyond Large-Scale Production; Productivity Press: Portland, OR, USA, 1988. [Google Scholar]
- Shingo, S. A Study of the Toyota Production System: From an Industrial Engineering Viewpoint; Productivity Press: Portland, OR, USA, 1989. [Google Scholar]
- Monden, Y. Toyota Production System: An Integrated Approach to Just-In-Time, 4th ed.; Productivity Press: Boca Raton, FL, USA, 2011. [Google Scholar]
- Womack, J.P.; Jones, D.T.; Roos, D. The Machine That Changed the World: The Story of Lean Production; Rawson Associates: New York, NY, USA, 1991. [Google Scholar]
- Womack, J.P.; Jones, D.T. Lean Thinking: Banish Waste and Create Wealth in Your Corporation; Simon & Schuster: New York, NY, USA, 2003. [Google Scholar]
- Rother, M.; Shook, J. Learning to See: Value Stream Mapping to Create Value and Eliminate Muda; Lean Enterprise Institute: Brookline, MA, USA, 1999. [Google Scholar]
- Dekier, Ł. The Origins and Evolution of Lean Management System. J. Int. Stud. 2012, 5, 46–51. [Google Scholar] [CrossRef]
- Kulakov, K.Y.; Orlov, A.K.; Kankhva, V.S. Evaluation of Lean Manufacturing Tools and Digital Technologies Effectiveness for Increasing Labour Productivity in Construction. Systems 2023, 11, 570. [Google Scholar] [CrossRef]
- Frick, N.; Terwolbeck, J.; Seibel, B.; Metternich, J. Design Model for the Digital Shadow of a Value Stream. Systems 2024, 12, 20. [Google Scholar] [CrossRef]
- Pozzi, R.; Cannas, V.G.; Rossi, T. Data Science Supporting Lean Production: Evidence from Manufacturing Companies. Systems 2024, 12, 100. [Google Scholar] [CrossRef]
- Hines, P. Human Centred Lean—Introducing the People Value Stream. Int. J. Lean Six Sigma 2022, 13, 1511–1532. [Google Scholar] [CrossRef]
- Bouranta, N.; Psomas, E.; Antony, J. Human Factors Involved in Lean Management: A Systematic Literature Review. Total Qual. Manag. Bus. Excell. 2021, 32, 1113–1145. [Google Scholar] [CrossRef]
- Koemtzi, M.D.; Psomas, E.; Antony, J.; Tortorella, G.L. Lean Manufacturing and Human Resources: A Systematic Literature Review on Future Research Suggestions. Total Qual. Manag. Bus. Excell. 2022, 33, 468–495. [Google Scholar] [CrossRef]
- Bektas, G.; Kiper, F. Applications of Lean in Human Resources Management in Healthcare. J. Pak. Med. Assoc. 2022, 72, 532–536. [Google Scholar] [PubMed]
- Slavina, T.; Štefani, N. Facing Challenges of Implementing Total Productive Management and Lean Tools in Manufacturing Enterprises. Systems 2024, 12, 52. [Google Scholar] [CrossRef]
- Karimulla, U.; Gupta, K.; Von Kallon, D.V. An Investigation into Lean Implementation Preparedness in the Engineering Projects Sector. Systems 2024, 12, 335. [Google Scholar] [CrossRef]
- Costa, L.B.M.; Filho, M.G. Lean Healthcare: Review, Classification and Analysis of Literature. Prod. Plan. Control 2016, 27, 823–836. [Google Scholar] [CrossRef]
- Sujová, A.; Vysloužilová, D.; Koleda, P.; Gajdzik, B. Research on the Evaluation of the Efficiency of Production Processes through the Implementation of Key Performance Indicators. Manag. Syst. Prod. Eng. 2023, 31, 404–410. [Google Scholar] [CrossRef]
- Pour, P.D.; Ahmed, A.A.; Nazzal, M.A.; Darras, B.M. An Industry 4.0 Technology Selection Framework for Manufacturing Systems and Firms Using Fuzzy AHP and Fuzzy TOPSIS Methods. Systems 2023, 11, 192. [Google Scholar] [CrossRef]
- LaCasse, P.M.; Otieno, W.; Maturana, F.P. A Survey of Feature Set Reduction Approaches for Predictive Analytics Models in the Connected Manufacturing Enterprise. Appl. Sci. 2019, 9, 843. [Google Scholar] [CrossRef]
- Di Luozzo, S.; Pop, G.R.; Schiraldi, M.M. The Human Performance Impact on OEE in the Adoption of New Production Technologies. Appl. Sci. 2021, 11, 8620. [Google Scholar] [CrossRef]
- Luna, A.; Herrera, R.F.; Castañeda, K.; Atencio, E.; Biotto, C. Benefits and Limitations of Lean Tools in the Building Design Process: A Functional and Comparative Analysis. Appl. Sci. 2025, 15, 5137. [Google Scholar] [CrossRef]
- Pedó, B.; Formoso, C.T.; Viana, D.D.; Tzortzopoulos, P.; Brandalise, F.M.P.; Whitelock-Wainwright, A. Visual Management Requirements to Support Design Planning and Control within Digital Contexts. Sustainability 2022, 14, 10989. [Google Scholar] [CrossRef]
- Pawlik, E.; Ijomah, W.; Corney, J.; Powell, D. Exploring the Application of Lean Best Practices in Remanufacturing: Empirical Insights into the Benefits and Barriers. Sustainability 2022, 14, 149. [Google Scholar] [CrossRef]
- Imai, M. Gemba Kaizen: A Commonsense Approach to a Continuous Improvement Strategy, 2nd ed.; McGraw-Hill: New York, NY, USA, 2012. [Google Scholar]
- Powell, D.J.; Coughlan, P. Corporate Lean Programs: Practical Insights and Implications for Learning and Continuous Improvement. Procedia CIRP 2020, 93, 820–825. [Google Scholar] [CrossRef]
- Realyvásquez-Vargas, A.; Arredondo-Soto, K.C.; Carrillo-Gutiérrez, T.; Ravelo, G. Applying the Plan-Do-Check-Act (PDCA) Cycle to Reduce the Defects in the Manufacturing Industry—A Case Study. Appl. Sci. 2018, 8, 2181. [Google Scholar] [CrossRef]
- Rangel-Sánchez, M.-Á.; Urbina-González, J.-D.-J.; Carrera-Escobedo, J.-L.; Guirette-Barbosa, O.-A.; Murillo-Rodríguez, V.-A.; Durán-Muñoz, H.-A.; Cruz-Domínguez, O.; Celaya-Padilla, J.-M. Enhancing Scrap Reduction in Electric Motor Manufacturing for the Automotive Industry: A Case Study Using the PDCA (Plan-Do-Check-Act) Approach. Appl. Sci. 2024, 14, 2999. [Google Scholar] [CrossRef]
- Voss, C.; Tsikriktsis, N.; Frohlich, M. Case Research in Operations Management. Int. J. Oper. Prod. Manag. 2002, 22, 195–219. [Google Scholar] [CrossRef]
- Julião, B.J.B.; Reis, M.S.; Duarte, B.P.M. A Systematic Lean-Driven Framework for Warehouse Optimization. Systems 2025, 13, 813. [Google Scholar] [CrossRef]
Disclaimer/Publisher’s Note: The statements, opinions and data contained in all publications are solely those of the individual author(s) and contributor(s) and not of MDPI and/or the editor(s). MDPI and/or the editor(s) disclaim responsibility for any injury to people or property resulting from any ideas, methods, instructions or products referred to in the content. |
© 2026 by the authors. Licensee MDPI, Basel, Switzerland. This article is an open access article distributed under the terms and conditions of the Creative Commons Attribution (CC BY) license.