Article

Unlocking the “Code” of Green Innovation Based on Machine Learning: Evidence from Manufacturing Enterprises in China

1
College of Business Administration, Huaqiao University, Quanzhou 362021, China
2
Business Management Research Center, Huaqiao University, Quanzhou 362021, China
*
Author to whom correspondence should be addressed.
Systems 2025, 13(9), 736; https://doi.org/10.3390/systems13090736 (registering DOI)
Submission received: 3 July 2025 / Revised: 21 August 2025 / Accepted: 21 August 2025 / Published: 25 August 2025
(This article belongs to the Section Systems Practice in Social Science)

Abstract

Enhancing green innovation performance is crucial for manufacturing enterprises to achieve sustainable development. This paper employs the strategic tripod framework (organization, industry, institution) using the K-means clustering algorithm to identify types of manufacturing performed by listed companies in China’s Shanghai and Shenzhen markets and adopts the CART decision tree algorithm to analyze influencing factors of green innovation performance across different enterprise types. The study finds that manufacturing enterprises can be divided into three types, with significant differences in influencing factors of green innovation performance. From the perspective of internal drivers, the improvement in green innovation performance mainly relies on organizational resource endowments, among which R&D ability is particularly key. From the perspective of the external institutional environment, the driving logic of mimetic pressure shows differentiated characteristics between different enterprise groups and differentiated response strategies need to be formulated accordingly. In addition, when the overall impact of external factors is weak, the level of industrial structure still has a prominent promoting effect on green innovation performance. Based on the data-driven perspective, this paper identifies the influencing factors of green innovation performance of different types of manufacturing enterprises, which is helpful to improve the green innovation performance of manufacturing enterprises.

1. Introduction

Since the Industrial Revolution, global manufacturing has grown significantly amid technological iteration and globalization. Yet, this scale-driven extensive model has caused excessive resource consumption, accumulating pollution and ecological degradation, which has become a common challenge to global sustainability. To address this, economies have taken varied measures to boost manufacturing green innovation: In Made in China 2025, China clearly strengthens the supervision of green development in the manufacturing industry, promotes enterprises to fulfill their environmental responsibilities, and facilitates green development. The European Union defines green economic activities through the EU taxonomy, providing unified standards to avoid greenwashing and guide capital toward genuine green innovation projects [1]. States in the United States, on the other hand, leverage tax credits and renewable portfolio standards to drive green innovation and transformation through local climate policies [2].
Scholars have conducted extensive research on the influencing factors of green innovation performance (GIP). At the macro-institutional level, views on how institutions affect enterprises’ GIP differ: one holds that environmental regulations worsen corporate pollution [3]; another argues that they effectively boost economic growth and reduce pollution [4]. At the meso-industrial level, academia has not reached a consensus on how industrial agglomeration impacts enterprises’ GIP: some studies suggest that industrial agglomeration can significantly promote GIP [5], while others emphasize a nonlinear relationship between the two [6]. Additionally, some scholars point out that this influence exhibits regional heterogeneity [7]. Furthermore, industrial structure upgrading is generally regarded as an important path to improve GIP [8]. At the micro-organizational level, empirical studies have generally confirmed that enterprises’ capabilities play a key role in enhancing GIP [9,10]. These studies reveal mechanisms across micro, meso, and macro dimensions: the micro-organizational dimension is the internal foundation for corporate green innovation, the meso-industrial dimension forms the external industrial environment, and the macro-institutional dimension provides a constraint and incentive framework. For manufacturing enterprises achieving high GIP involves interactions across multiple levels of factors. It relies not only on internal organizational capabilities but also on industrial synergies and institutional guidance. By integrating these three dimensions, the strategic tripod framework can effectively deal with this complexity by systematically considering these interrelated factors, thus breaking through the limitations of traditional theories and becoming an important analytical tool in innovation management research [11], and is gradually being applied to enterprise green innovation research [12]. However, most studies are limited to exploring the linear or simply nonlinear impacts of organizational, industrial, and institutional factors on GIP, with few delving into the synergistic effects between these factors. Additionally, existing research pays insufficient attention to the heterogeneous characteristics of enterprises, rarely addressing differences in manufacturing enterprise types and their differentiated paths to improving GIP. Meanwhile, most studies adopt linear econometric regression analysis methods, neglecting the complex interaction effects between variables.
The key research questions that arise from this are as follows: (1) What types of manufacturing enterprises are there? (2) How do organizations, industries, and institutions affect the GIP of manufacturing enterprises under the strategic tripod framework? What are the differences in their impacts on different types of manufacturing enterprises? (3) How to effectively improve GIP among different types of manufacturing enterprises?
To address the aforementioned issues, this study adopts the strategic tripod theoretical framework and employs machine learning methods to explore the heterogeneous improvement pathways for GIP in manufacturing enterprises. Ultimately, it provides practical recommendations for managers of manufacturing enterprises and policymakers.
The remainder of this paper is organized as follows: Section 2 reviews the relevant literature. Section 3 introduces the research methods. Subsequently, Section 4 elaborates on research ideas and measures variables. Section 5 classifies the enterprise groups and conducts a characteristic analysis. Section 6 identifies GIP influencing factors for different enterprise types. Finally, Section 7 summarizes the work.

2. Related Literature

To explore the influencing factors and improvement paths of the GIP of manufacturing enterprises, this paper systematically reviews the relevant research achievements.

2.1. GIP

The concept of green innovation was first proposed by Fussler and James [13], and its core lies in reducing environmental impact and enhancing the commercial value of enterprises. Unlike the traditional innovation mode, green innovation is guided by green development and aimed at reducing the negative impact of products on the environment in the entire life cycle. It not only meets the green demand of the market but also highlights the environmental responsibility and business ethics of enterprises [14]. The concept of GIP emerged precisely from the focus on the green attributes and process orientation of innovation activities. This concept represents a deeper and broader reinterpretation of traditional innovation performance, emphasizing the comprehensive benefit outcomes that enterprises or organizations achieve through innovation investments under specific environmental and resource constraints. GIP comprehensively reflects the coordinated development efficacy of enterprises across economic, environmental, and social dimensions [14].
As the core driving force for promoting green innovation, enterprises need to actively implement green development strategies and improve their GIP. However, due to the large investment, high risk, and slow effectiveness of green innovation, enterprises often encounter problems such as weak investment willingness and low GIP. For these problems, scholars have conducted in-depth explorations of GIP’s key influencing factors, with research perspectives predominantly converging on external environmental factors and internal driving forces. In the field of external environment research, scholars mainly rely on institutional theory and market theory. According to the institutional theory, coercive pressure, normative pressure, and mimetic pressure constitute a legitimacy constraint, which prompts enterprises to shift from passive response to active layout in green innovation [15]. Specifically, coercive pressure essentially means that the government reconstructs the rules through legal coercion. Xu et al. [16] expressed the belief that this coercive pressure is a sufficient condition for promoting GIP. Huang and Chen [17] also supported this view, pointing out that coercive pressure affects GIP by influencing green slack. However, Sherazi et al. [18] counter this perspective, arguing that this coercive pressure is insufficient to influence GIP. The normative pressure relying on the constraints of social values on organizations guides enterprises to actively incorporate environmental responsibility into strategic decisions, which can positively affect GIP [16]. The mimetic pressure compels enterprises to actively imitate leading benchmark enterprises in the industry, thereby reducing decision-making risks. Compared with coercive pressure, it can more effectively promote green technology innovation [19]. Market theory further reveals how supply–demand dynamics shape green innovation. On the demand side, consumer preferences drive enterprises to accelerate green product iteration; conversely, the supply side employs policy instruments such as taxes and subsidies to adjust the cost–benefit structure and reshapes the green innovation incentive framework for enterprises [20]. Turning to internal factors, scholars predominantly apply the resource-based view, dynamic capability theory, and knowledge-based view. According to the resource-based view, Wang et al. [9] and Wang et al. [21] identified the resources required for green innovation and categorized these into capital, organization, and technology. Among these, the capital dimension is represented by financial resources, while the organizational dimension encompasses factors such as executive capabilities, corporate size, and ownership. Regarding dynamic capabilities theory, Fang and Sheng [10] empirically tested the core mediating role of knowledge dynamic capability on the impact of policy orientation on GIP. Riaz et al. [22] further revealed the positive moderating effect of green absorptive capability on green learning orientation and GIP. Using the knowledge-based view, Li et al. [23] analyzed the promoting effects of knowledge acquisition and knowledge flow on GIP. Sun [24] further verified the value of knowledge sharing.

2.2. The Strategic Tripod Framework

The strategic tripod framework, proposed by Peng [25], innovatively integrates the strategic resource view [26], the strategic industrial view [27], and the institutional perspective [28]. The resource-based view holds that the unique resources within an enterprise are the core of its long-term competitiveness. Acquiring and effectively leveraging valuable, scarce, hard-to-imitate, and irreplaceable resources stand as the cornerstones of building competitive advantage. The industry-based view posits that an enterprise’s performance is shaped by its external industrial environment. To achieve superior performance, an enterprise must either transition to a more favorable industry or strategically reposition itself within the existing industry structure [27]. The institutional perspective, in contrast, emphasizes the important influence of formal and informal institutions on the operation of enterprises [28]. Based on the aforementioned integrated perspective, the strategic tripod framework identifies three key dimensions: organization, industry, and institution. These dimensions are not isolated entities; rather, they are interconnected and exert reciprocal influences, collectively shaping the GIP of enterprises.
Regarding organizational factors, existing research tends to explore the impact of organizational characteristics on the GIP of enterprises. Rothwell [29] first showed that managers’ environmental commitment and risk awareness are crucial for companies to engage in green innovation. Later, Jiang et al. [30] found that managers with different levels of environmental awareness adopt different strategies to optimize GIP, which often leads to positive outcomes. Additionally, Dangelico et al. [31] highlighted the importance of integrating external resources to improve GIP. Jiang et al. [32] further established a strong link between managerial skills and GIP, while highlighting that this relationship intensifies in state-owned enterprises, those with a high proportion of institutional investors, and those operating under conditions of stricter environmental regulations or less developed product markets. From the perspective of industry, existing research directions focus on the impact of industrial characteristics on GIP. Liu and Wu [33] employed dynamic panel threshold and mediating effect models to examine how the industrial agglomeration of tourism nonlinearly affects the green innovation efficiency of the tourism sector, with industrial structure upgrading acting as a key mechanism. Qiu et al. [8] also found that industrial structure upgrading has a significant positive impact on GIP. At the institutional level, existing research tends to explore the impact of the three-dimensional pressures of institutions on GIP. Regarding coercive pressure, some scholars argue that environmental regulations exacerbate the pollution situation of enterprises [3], while others believe that environmental regulations are an effective means to promote economic development and reduce environmental pollution [27]. In the dimension of normative pressure, some studies have shown that social norms can make up for the deficiencies in formal institutions and play a supplementary role [34]. Under mimetic pressure, competitors’ green innovation practices compel enterprises to pursue the same type of green innovation [35]. Latecomer enterprises can reduce the cost of trial and error by imitating the technical experience of pioneers [36]. However, overdependence on imitation suppresses R&D investments in original innovation. The marginal revenue of imitating enterprises will decrease as the number of participants increases, ultimately leading to a decline in the overall profits of the industry [34].
The existing literature on the relationship between the strategic tripod framework and GIP is still insufficient. Although the effectiveness of the strategic tripod framework in traditional innovation has been partially verified [14,37], due to the unique attributes of green innovation, its driving mechanism may not be fully explained by traditional theories directly. Thus, it is necessary to re-examine the synergy of the three elements on GIP. In addition, current research mostly focuses on the impact of a single dimension, and few scholars have attempted to explore the driving mechanism of GIP from the perspective of the strategic tripod [12].
In summary, existing research predominantly concentrates on single-factor impacts on GIP. Few studies explore the improvement paths of enterprises’ GIP under the comprehensive action of multiple factors, and little research examines the combination of conditions such as organizations, industries, and institutions. Frequently, research adopts a broad perspective that does not fully account for the diversity of enterprise types or the differentiated characteristic combinations driving diverse teams toward GIP. In addition, regarding research methods, most of the existing studies use linear econometric regression analysis to explore the impact mechanism of GIP. Although this paradigm can verify the linear relationship between variables, it has several limitations. When analyzing the interaction effects of multi-dimensional factors, it cannot fully capture the complex interactions and subtle differences in the data. Moreover, it is difficult for this paradigm to comprehensively and deeply explain the combination problems among multiple conditions.
Benefiting from the rapid development of big data analysis technology, machine learning methods can identify the types of data objects in an unsupervised scenario and provide differentiated solutions for different object types. Therefore, this paper uses K-means clustering to classify manufacturing enterprises. Based on the strategic tripod framework, with multi-dimensional characteristics of organization, industry, and institution as conditional attributes, and GIP as the decision attribute, it mines potential decision rules for different types of groups through the classification and regression tree (CART) algorithm to identify heterogeneous pathways for improving GIP.

3. Preliminaries

In this section, we review the relevant theoretical background, including the K-means clustering algorithm, which is a commonly used clustering algorithm in the field of data mining, and the CART, a predictive model with a tree-like structure.

3.1. K-Means Algorithm

The K-means clustering algorithm is a machine learning tool used for cluster analysis [38]. Its basic principle is as follows: for each data point, its distance from all clustering centers is calculated, and it is assigned to the cluster represented by the nearest clustering center. After one iteration, the center of each cluster is recalculated, and then each data point is reassigned to the nearest center. This process is repeated until the cluster allocation results converge, meeting the condition of “maximizing similarity within clusters and minimizing similarity between clusters” [39]. Due to the simple principle, easy implementation, and good clustering effect of the K-means algorithm regarding algorithm characteristics, the K-means clustering algorithm is used to group the sample enterprises in the enterprise classification stage in this paper.
The implementation steps of this algorithm in this study are as follows: Firstly, the optimal number of clusters is determined by the elbow method combined with the contour coefficient. Then, k samples are randomly selected from the dataset as the initial clustering center, the similarity between all samples and each clustering center is calculated by using the Euclidean distance, and the samples are assigned to the closest cluster. Then, the average value of the samples in each new cluster is calculated as the new clustering center, and the clustering center is iteratively updated. When the allocation results of all samples no longer change, the algorithm terminates [40].

3.2. CART Algorithm

Decision trees are a machine learning method that can be used for classification and regression, and common algorithms include ID3, C4.5, and CART, all of which follow a top-down construction approach [40]. Compared with ID3 and C4.5, the CART algorithm performs better in terms of processing speed, computational workload, and other aspects [41]. In addition, the binary tree structure generated by this algorithm is hierarchical, making the results easy to interpret. During the tree construction process, it automatically conducts feature selection, which enables the identification of key influencing factors and the clarification of their mechanisms of action. Moreover, it excels at capturing complex nonlinear interactions, thus compensating for the limitations of traditional linear models in multivariate analysis [42]. Therefore, the CART algorithm has been widely applied in recent years [39,40,42]. In fact, the algorithm mainly involves two processes: tree generation and pruning [40]. The tree is generated using a recursive dichotomy: starting from the root node, the Gini index of all features is calculated, the feature with the smallest Gini index is selected to segment, and the left and right subnodes are generated. Then, the above process is repeated for each subnode until the stop conditions are met. Pruning aims to solve the problem of overfitting the initial tree and is divided into pre-pruning and post-pruning: pre-pruning stops splitting by setting parameters such as the minimum number of samples, information gain threshold, and maximum tree depth. Post-pruning is generally based on support and confidence, starting from the lowest non-leaf node to remove the branches that contribute less to the performance of the model.
Regarding the above advantages of the CART algorithm, this paper adopts it in the impact mechanism analysis stage to explore the potential decision-making rules of different types of manufacturing enterprise groups.

4. Research Framework and Variable Selection

4.1. Research Framework

Based on the strategic tripod framework, this paper uses machine learning algorithms to analyze the impacts of three-dimensional characteristic variables of organizations, industries, and institutions on the GIP of manufacturing enterprises. As shown in Figure 1, the research framework of this paper mainly includes the following three aspects: (1) feature selection of manufacturing enterprises (relevant data of listed manufacturing enterprises are obtained from multiple-source databases, and the three-dimensional characteristic variables of organizations, industries, and institutions are selected and measured based on the strategic tripod framework); (2) group division of manufacturing enterprises (following variable selection and measurement, correlation and collinearity analyses are conducted to ensure variable quality and independence. Subsequently, the K-means algorithm classifies enterprises into clusters, providing a basis for differentiated analysis); (3) analysis of the influencing factors of the manufacturing enterprises’ GIP. Based on the clustering results, the study further focused on the influencing factors of GIP. The organizational, industrial, and institutional variables were set as conditional attributes, and GIP was taken as the decision attribute. The CART algorithm was then used to mine the potential decision-making rules, aiming to deeply analyze the nonlinear relationship between the variables and the GIP in different enterprise groups.

4.2. Variable Selection

4.2.1. Dependent Variable—GIP

The measurement of enterprises’ GIP is generally carried out from two dimensions: input and output. However, due to significant challenges in acquiring input data and the intricate interdependencies between input and output, existing studies have gradually leaned toward an output-oriented approach to GIP measurement. Among output-oriented indicators, green patent data is widely recognized in academia for its ability to quantify both the scale and quality of green innovation [43]. Additionally, studies have noted that compared with authorized patents, the number of patent applications offers higher stability, reliability, and timeliness [44]. Building on these research consensuses, this paper, with reference to existing practices [45,46], uses the proportion of the number of green patent applications in the current period to the total number of patent applications in the current period as a measure of GIP.

4.2.2. Independent Variables—Strategic Tripod Framework

To scientifically identify the impacts of organization, industry, and institution on the GIP of manufacturing enterprises, this paper conducts subsequent analyses based on seven characteristic variables in organizational factors (R&D ability and financial ability), industrial factors (industrial agglomeration and industrial structure upgrading), and institutional factors (coercive pressure, normative pressure, and mimetic pressure). The following is a detailed introduction to these characteristic variables:
(1)
The organizational level
The organizational level mainly includes two indicators: R&D ability and financial ability, which are as follows:
R&D ability is a basic element of technological innovation ability. Drawing on the research of Zhang and Zuo [47], this paper takes the natural logarithm of the actual R&D investment amount of manufacturing enterprises in China as the measurement index.
Financial ability can reflect the technological innovation ability of enterprises from an economic perspective. Referring to the measurement method of He et al. [48], this paper selects 11 representative financial indicators as research objects from four dimensions: debt-paying ability, profitability, operating ability, and development ability. It uses factor analysis to construct a relatively comprehensive evaluation system for financial ability, using the comprehensive score of the company as a measurement index of financial ability. The detailed financial indicators are presented in Table 1.
(2)
The industrial level
The industrial level mainly includes two indicators: industrial agglomeration and industrial structure upgrading. The details are as follows:
Drawing on the approach of Bergman and Feser [49], the degree of industrial agglomeration is measured by the ratio of a region’s manufacturing employment share to its total employment share in the national context.
Industrial structure upgrading refers to the process or trend in which the industrial structure continuously transforms from a low-level form to a high-level form. Referring to the measurement methods of scholars such as Shi and Zhao [50], the ratio of the output value of high-end technology industries to that of mid-end technology industries in the manufacturing sector is selected to represent the degree of industrial structure upgrading in the manufacturing industry.
(3)
The institutional level
The institutional level mainly includes three indicators of coercive pressure, normative pressure, and mimetic pressure [51], which are as follows:
Coercive pressure mainly refers to the government’s administrative instructions, constraint requirements, or laws and regulations of the force. The governance cost per thousand CNY of industrial output can better reflect the intensity of environmental regulation faced by enterprises.
Normative pressure reflects values and codes of conduct to a greater degree, mainly restricting the behaviors of enterprises through moral domination [51]. Among the moral norms of various social groups, public opinion pressure from the news media has a significant impact. Therefore, following the method of Jiang et al. [30], the total number of news reports on an enterprise in the current year is selected to measure the normative pressure.
Mimetic pressure drives enterprises to imitate other enterprises in the same industry. Therefore, we measure the mimetic pressure by the industry average of the environmental information disclosure index [52].
Based on the above content, the variable information shown in Table 2 can be obtained.

5. Classification and Characteristic Analysis

5.1. Data Source and Processing

China has many manufacturing enterprises, with green patent applications ranking first globally for years. Its rich data and diverse innovation activities can fully reflect the dynamic green innovation changes across enterprise types. Therefore, this study selects A-share listed manufacturing enterprises on China’s Shanghai and Shenzhen Stock Exchanges as samples. Considering data availability, variable data from 2013 to 2022 are used in this paper. Notably, because industrial structure upgrading data have not been updated and there is a lack of suitable alternatives, this indicator only covers 2010–2019. However, this does not significantly affect the study, as it uses ten-year averages for all indicators. This approach smooths short-term fluctuations, focusing more on variables’ long-term trends. To ensure the validity and reliability of the sample, the data are screened according to the following conditions: Enterprises with zero green patent applications from 2013 to 2022 or those with missing key variables are excluded. In addition, enterprises marked as ST, *ST, and those with abnormal operations are excluded. Finally, a final sample of 1408 enterprises is obtained.
The sample data comes from multiple sources: GIP and mimetic pressure data are from CNRDS, coercive and normative pressure data are from the China Statistical Yearbook, industrial agglomeration data are from the China Population and Employment Statistics Yearbook, and the remaining variables are from CSMAR.

5.2. Division of Manufacturing Enterprises

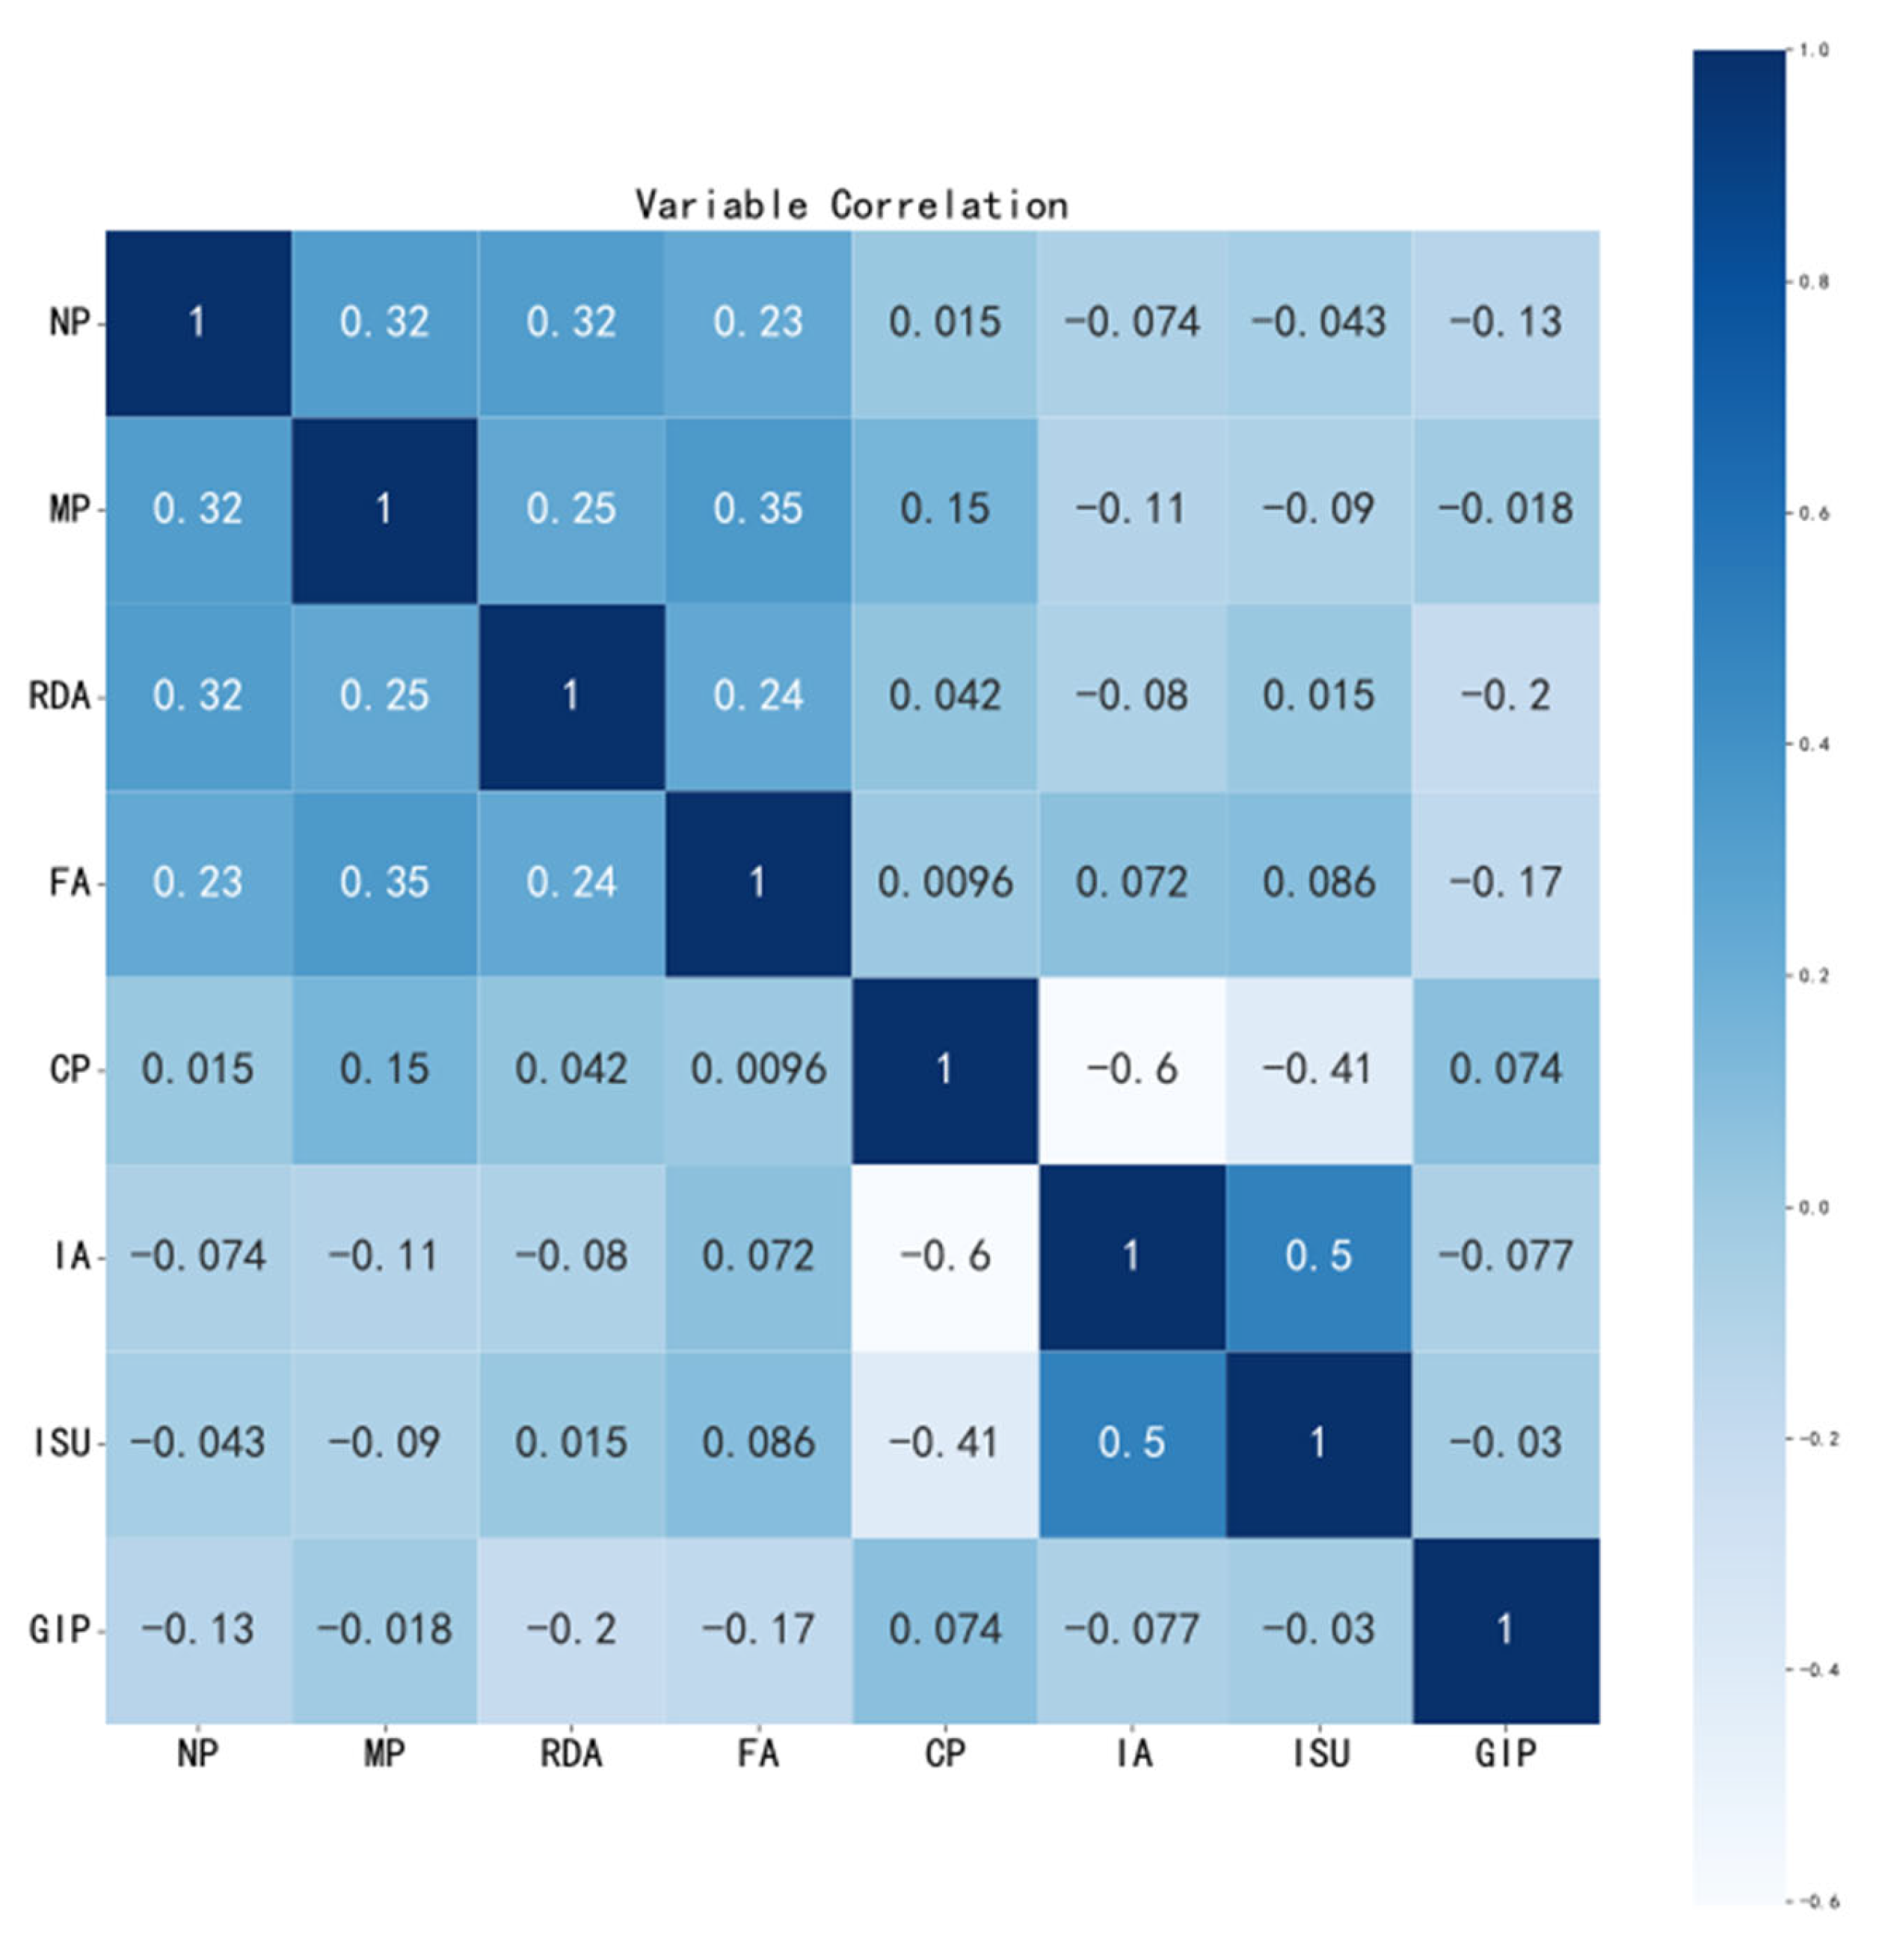
The Pearson correlation analysis results between variables (Figure 2) show that no significant high correlation exists between the seven initial variables and GIP. This indicates that GIP is not determined by a single factor but is the result of multiple factors. Consequently, an in-depth analysis of GIP’s influencing factors is required.
In addition, the collinearity analysis results revealed that the variance inflation factor (VIF) for normative pressure was 7.4, exceeding the threshold of 5.0. This indicates that there is a high degree of linear correlation between normative pressure and the other independent variables, suggesting a high level of collinearity. To ensure the validity and reliability of the conclusion, this paper will exclude this variable and select six conditional variables, namely, R&D ability, financial ability, industrial agglomeration, industrial structure upgrading, coercive pressure, and mimetic pressure, to carry out subsequent research.
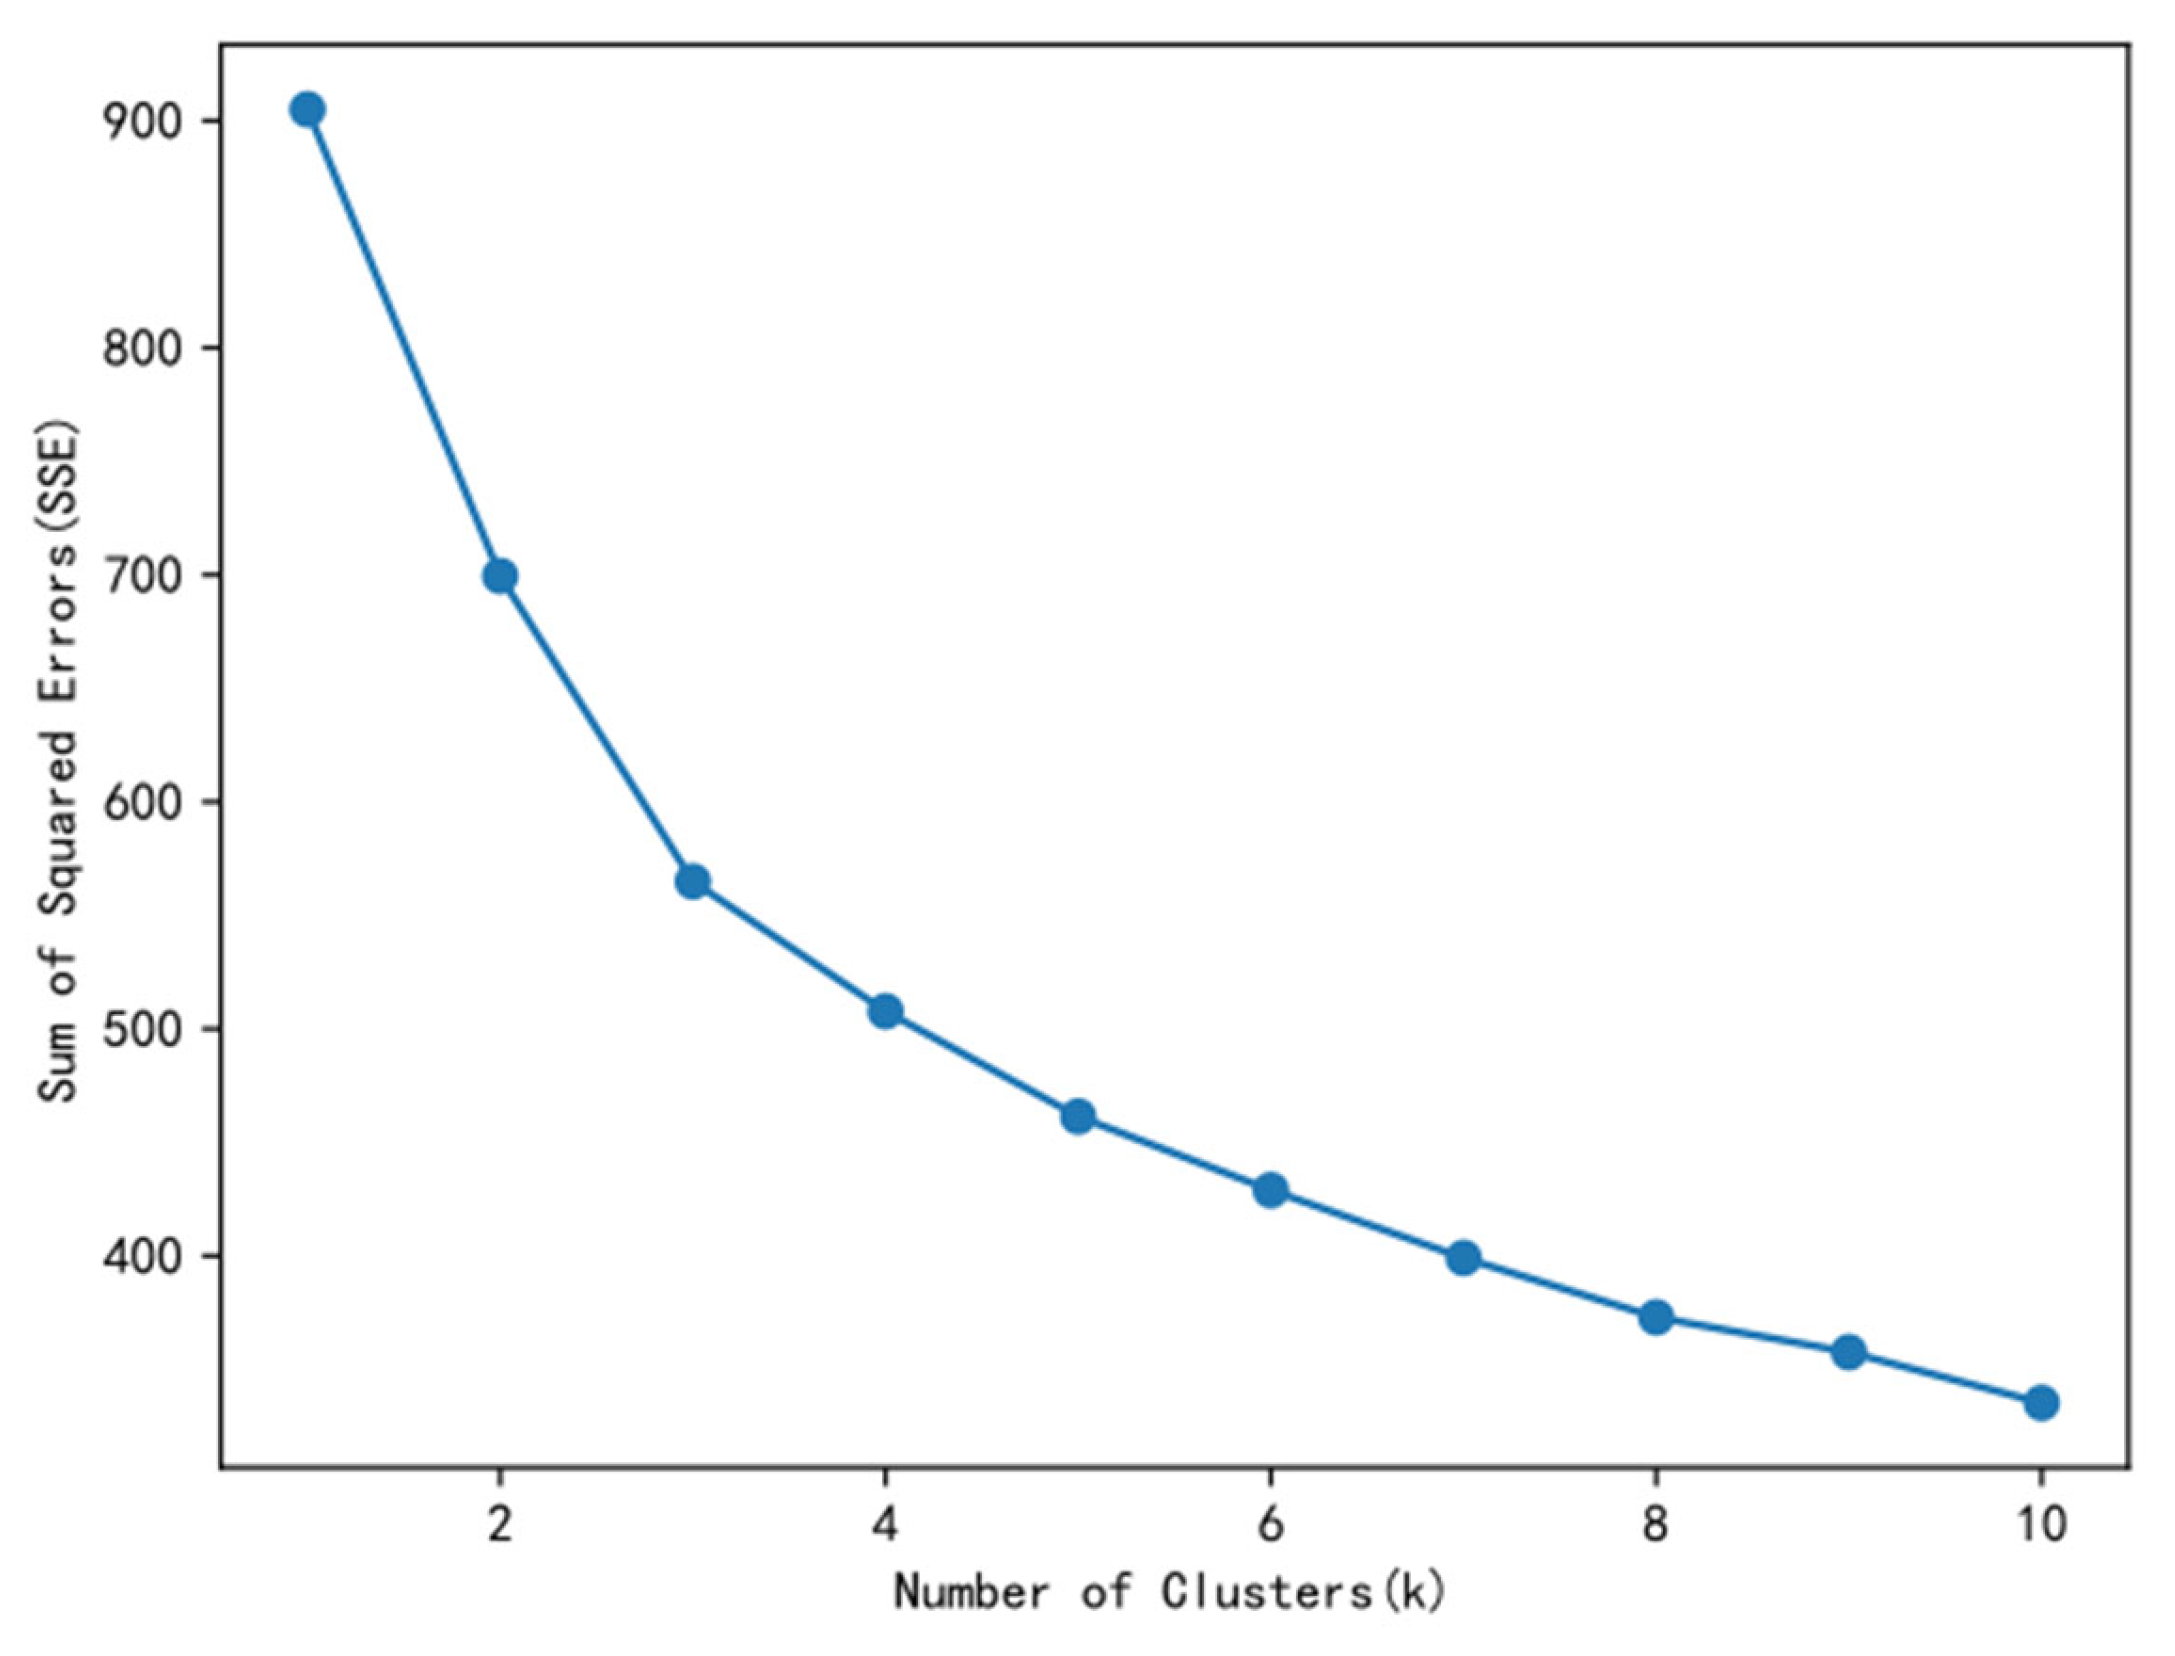
Given that the K-means clustering algorithm can quickly and accurately identify target objects with similar characteristics, this paper employs the K-means clustering algorithm to classify them. The analysis first employed the elbow method, which identified the optimal number of clusters as three (as shown in Figure 3) [39]. Subsequently, the K-means clustering algorithm classified 1408 listed manufacturing enterprises into three distinct enterprise groups based on their trait similarities.
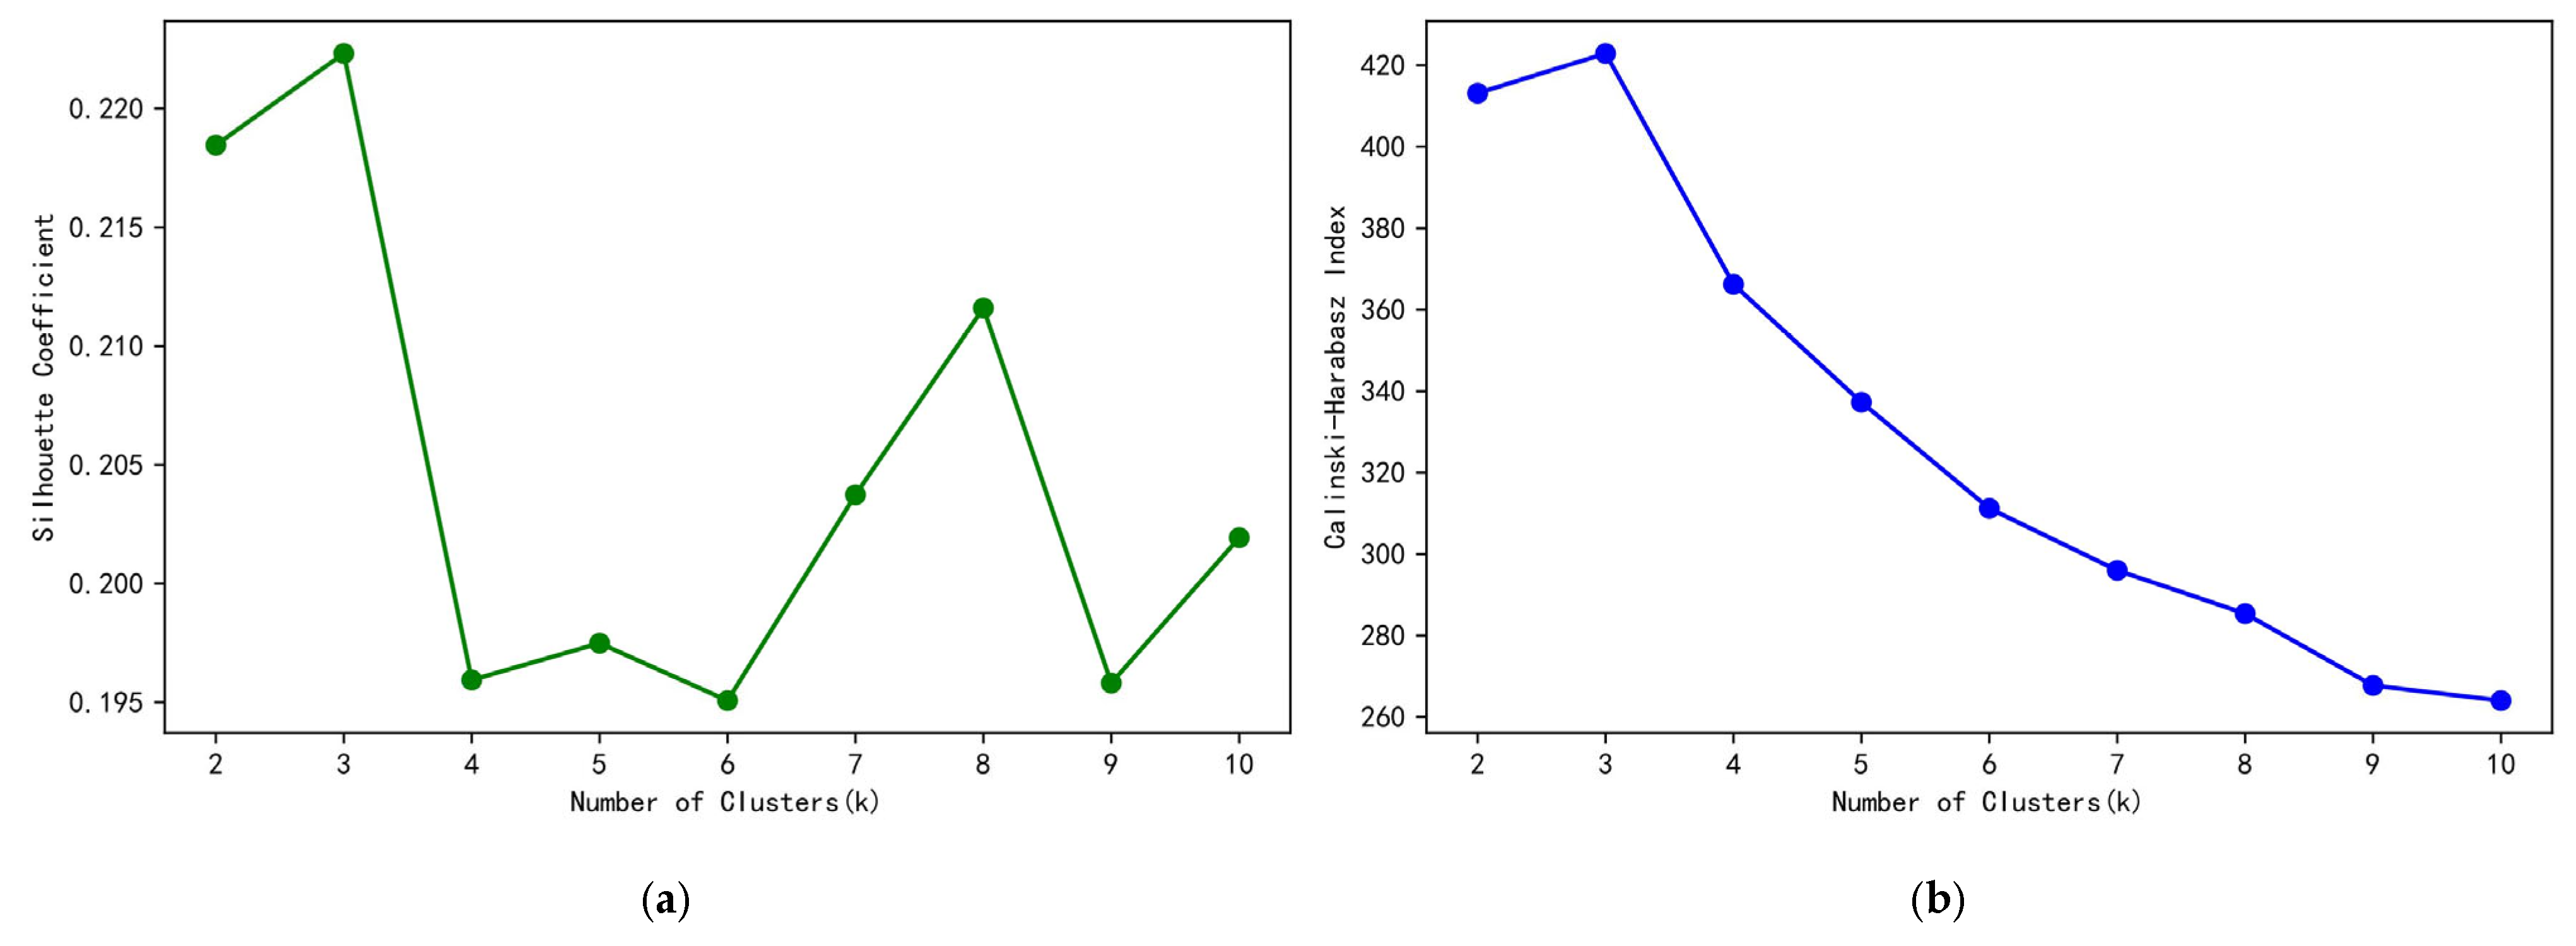
To test the clustering effect, we further calculated the Silhouette coefficient and Calinski-Harabasz index. As shown in Figure 4, when there are three clusters, both Silhouette coefficient and Calinski-Harabasz index are largest. Although the prior is a little low (0.223), but the latter is higher (422.900). That is, the clustering results exhibit good intra-cluster compactness and inter-cluster separability. Overall, the clustering results have a certain degree of robustness. The subsequent sections delineate the nomenclature and characteristic analyses for each enterprise group.

5.3. Characteristics Analysis of Manufacturing Enterprises

Through relevant calculations, the characteristic information (Table 3) can ultimately be obtained.
(1) According to the feature differences, the first enterprise group is named the “industry-driven” enterprise group. The main reasons for naming it as such are as follows: Comparatively, the average levels of coercive pressure, R&D ability, and financial ability in this enterprise group are relatively low, while the degrees of industrial agglomeration and industrial structure upgrading are relatively high. This implies that these enterprises encounter certain resource or capability limitations, rendering it difficult to effectively convert and implement green innovation accomplishments. Nevertheless, they are vigorously propelling the enhancement of their GIP by virtue of the impacts of industrial agglomeration and industrial structure upgrading.
Table 3 shows that enterprises with high GIP account for 59.2%. This indicates that these enterprises have successfully obtained more green innovation resources and opportunities through the industrial agglomeration effect and the upgrading of the industrial structure.
(2) In the second enterprise group, the average levels of coercive pressure, industrial agglomeration, and industrial structure upgrading are not high; thus, these enterprises face certain challenges regarding external environmental regulation and industrial structure upgrading. However, their mimetic pressure, R&D ability, and financial ability are relatively high. That is, in a highly competitive market environment, enterprises of this type can continuously innovate by relying on their resource endowments, draw inspiration from the same industry, and moderately imitate and learn to enhance their competitiveness. Therefore, this enterprise group is named the “capability-driven” enterprise group.
In the situation of scarce external resources, 45.4% of the enterprises have achieved high GIP by relying on their endogenous growth momentum, which highlights the value of internal resources. However, this proportion also reveals the bottleneck of relying solely on internal resources to drive green innovation. To break through this limitation, it is urgent to strengthen strategic cooperation between enterprises and efficiently integrate and utilize external resources.
(3) The reasons for naming the third enterprise group as the “challenge-oriented” enterprise group are as follows: The average levels of R&D ability, financial ability, industrial agglomeration, and industrial structure upgrading in this enterprise group are relatively low, and it faces the dual challenges of insufficient internal capability and lack of external support. The level of coercive pressure is high, and the relevant regulatory agencies are strict within the industries to which such enterprises belong.
This kind of enterprise encompasses 472 companies, among which only 4.3% have achieved high-level GIP. This further indicates that this type of enterprise faces certain challenges in green innovation.
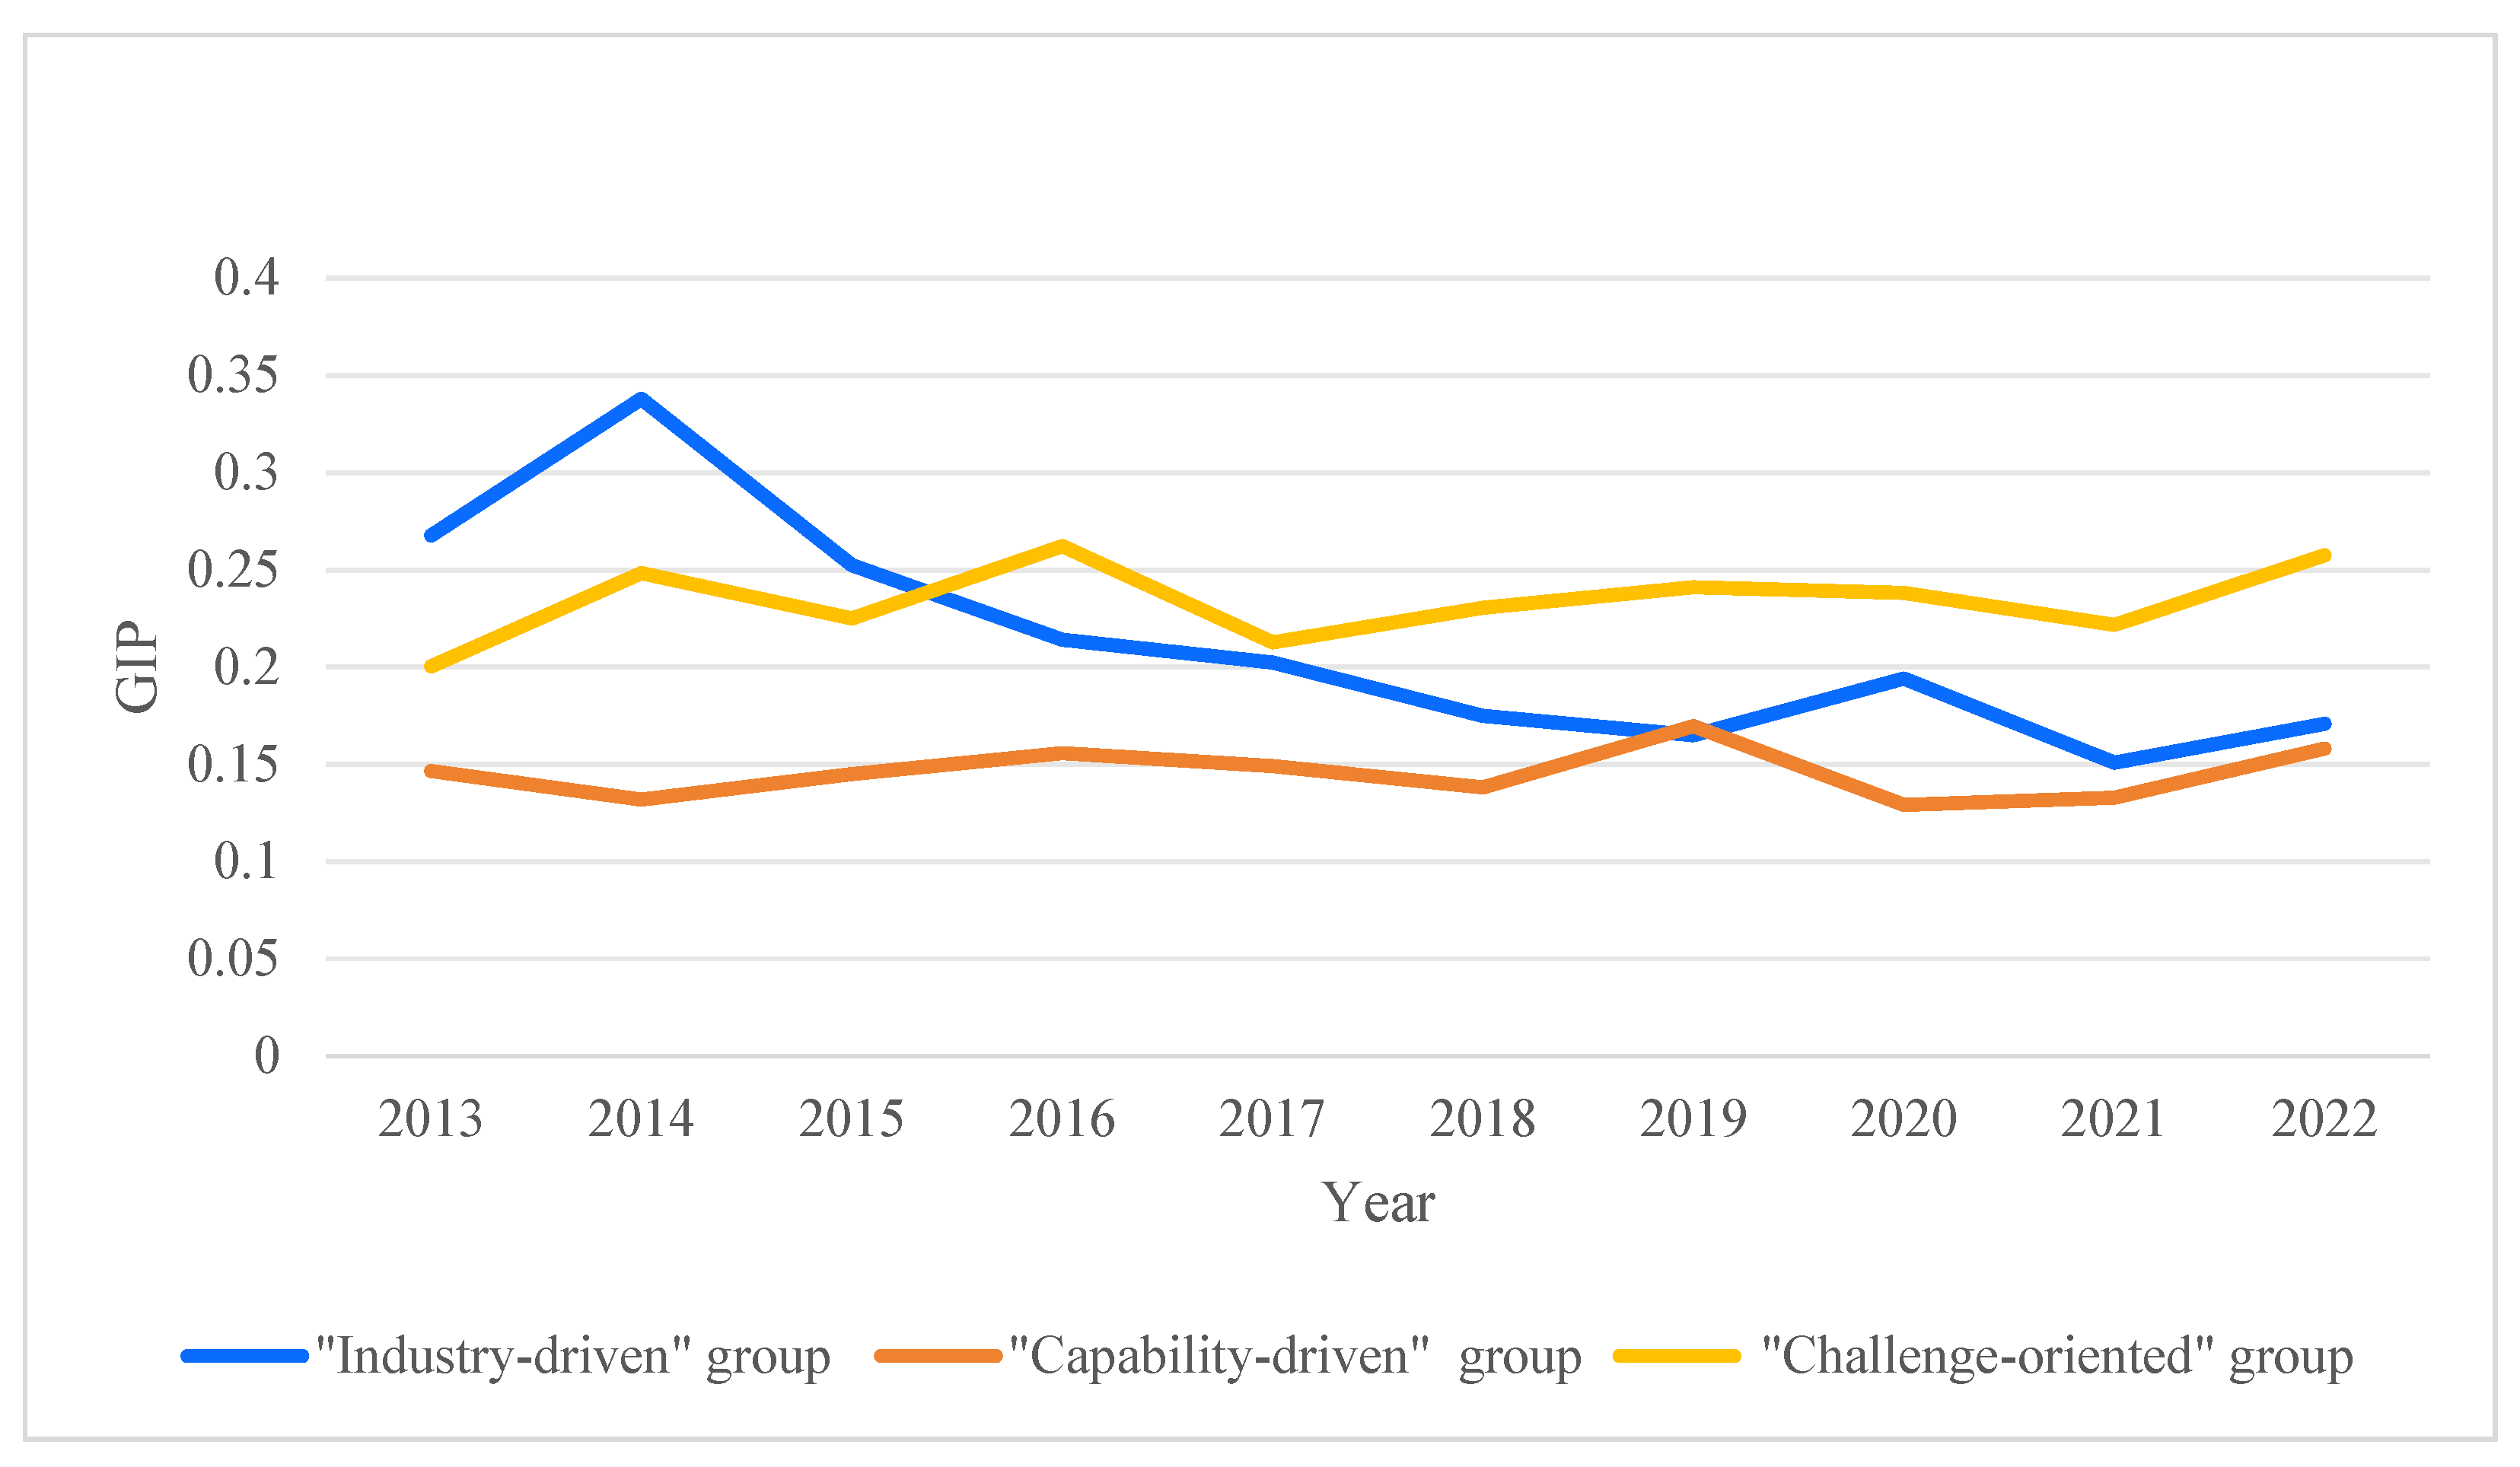
In addition, Figure 5 shows that from 2013 to 2015, the “industry-driven” group led in GIP, followed by the “challenge-oriented” and “capability-driven” groups. From 2015 onward, however, “challenge-oriented” group overtook and maintained leadership, with “industry-driven” group slipping to second and “capability-driven” group generally remaining third—despite occasional minor ranking shifts, the overall pattern held. The “industry-driven” group saw fluctuating declines in GIP. Given its weak R&D abilities and financial abilities, reliance on industrial environment advantages alone, without strong internal support, hindered long-term green innovation sustainability. In contrast, “capability-driven” group maintained stable, medium-low GIP with small fluctuations. While sufficient R&D investment and capital reserves provided a foundation, dual constraints from high coercive pressures and mimetic pressures, plus limited industrial conditions. The “challenge-oriented” group sustained medium-high GIP. High-intensity regulatory pressure offset weaknesses in enterprise capabilities and industry support, prompting gradual focus on key innovations and optimized resource allocation during passive adaptation—ultimately enabling late-stage overtaking and stable leadership.

6. Analysis of Influencing Factors on GIP

To further explore the influence of characteristics of manufacturing enterprises on GIP, six characteristic variables were selected as conditional attributes, and GIP is selected as the decision-making attribute. The CART algorithm is applied to three different types of manufacturing enterprises to obtain the final decision rules.
From the perspective of the overall decision-making rules shown in Table 4, (1) in the three different types of enterprise groups, different combinations of R&D ability, financial ability, industrial agglomeration, industrial structure upgrading, coercive pressure, and mimetic pressure have significantly different impacts on the GIP of each enterprise group. To a certain extent, this confirms the necessity of dividing enterprises into different groups and discussing their decision-making rules separately. (2) R&D ability affects enterprises in each group and is a key factor influencing GIP. Coercive pressure and industrial agglomeration do not play a role in each rule, indicating that their influencing effects are weakened by other characteristics. (3) The average confidence level of all decision-making rules reaches 73.1%, more than half of the rules have a confidence level of over 75%, and the highest confidence level reaches 100%. This fully demonstrates that the decision-making rules for the GIP of manufacturing enterprises obtained from the CART algorithm have high interpretability.

6.1. “Industry-Driven” Enterprises Cluster

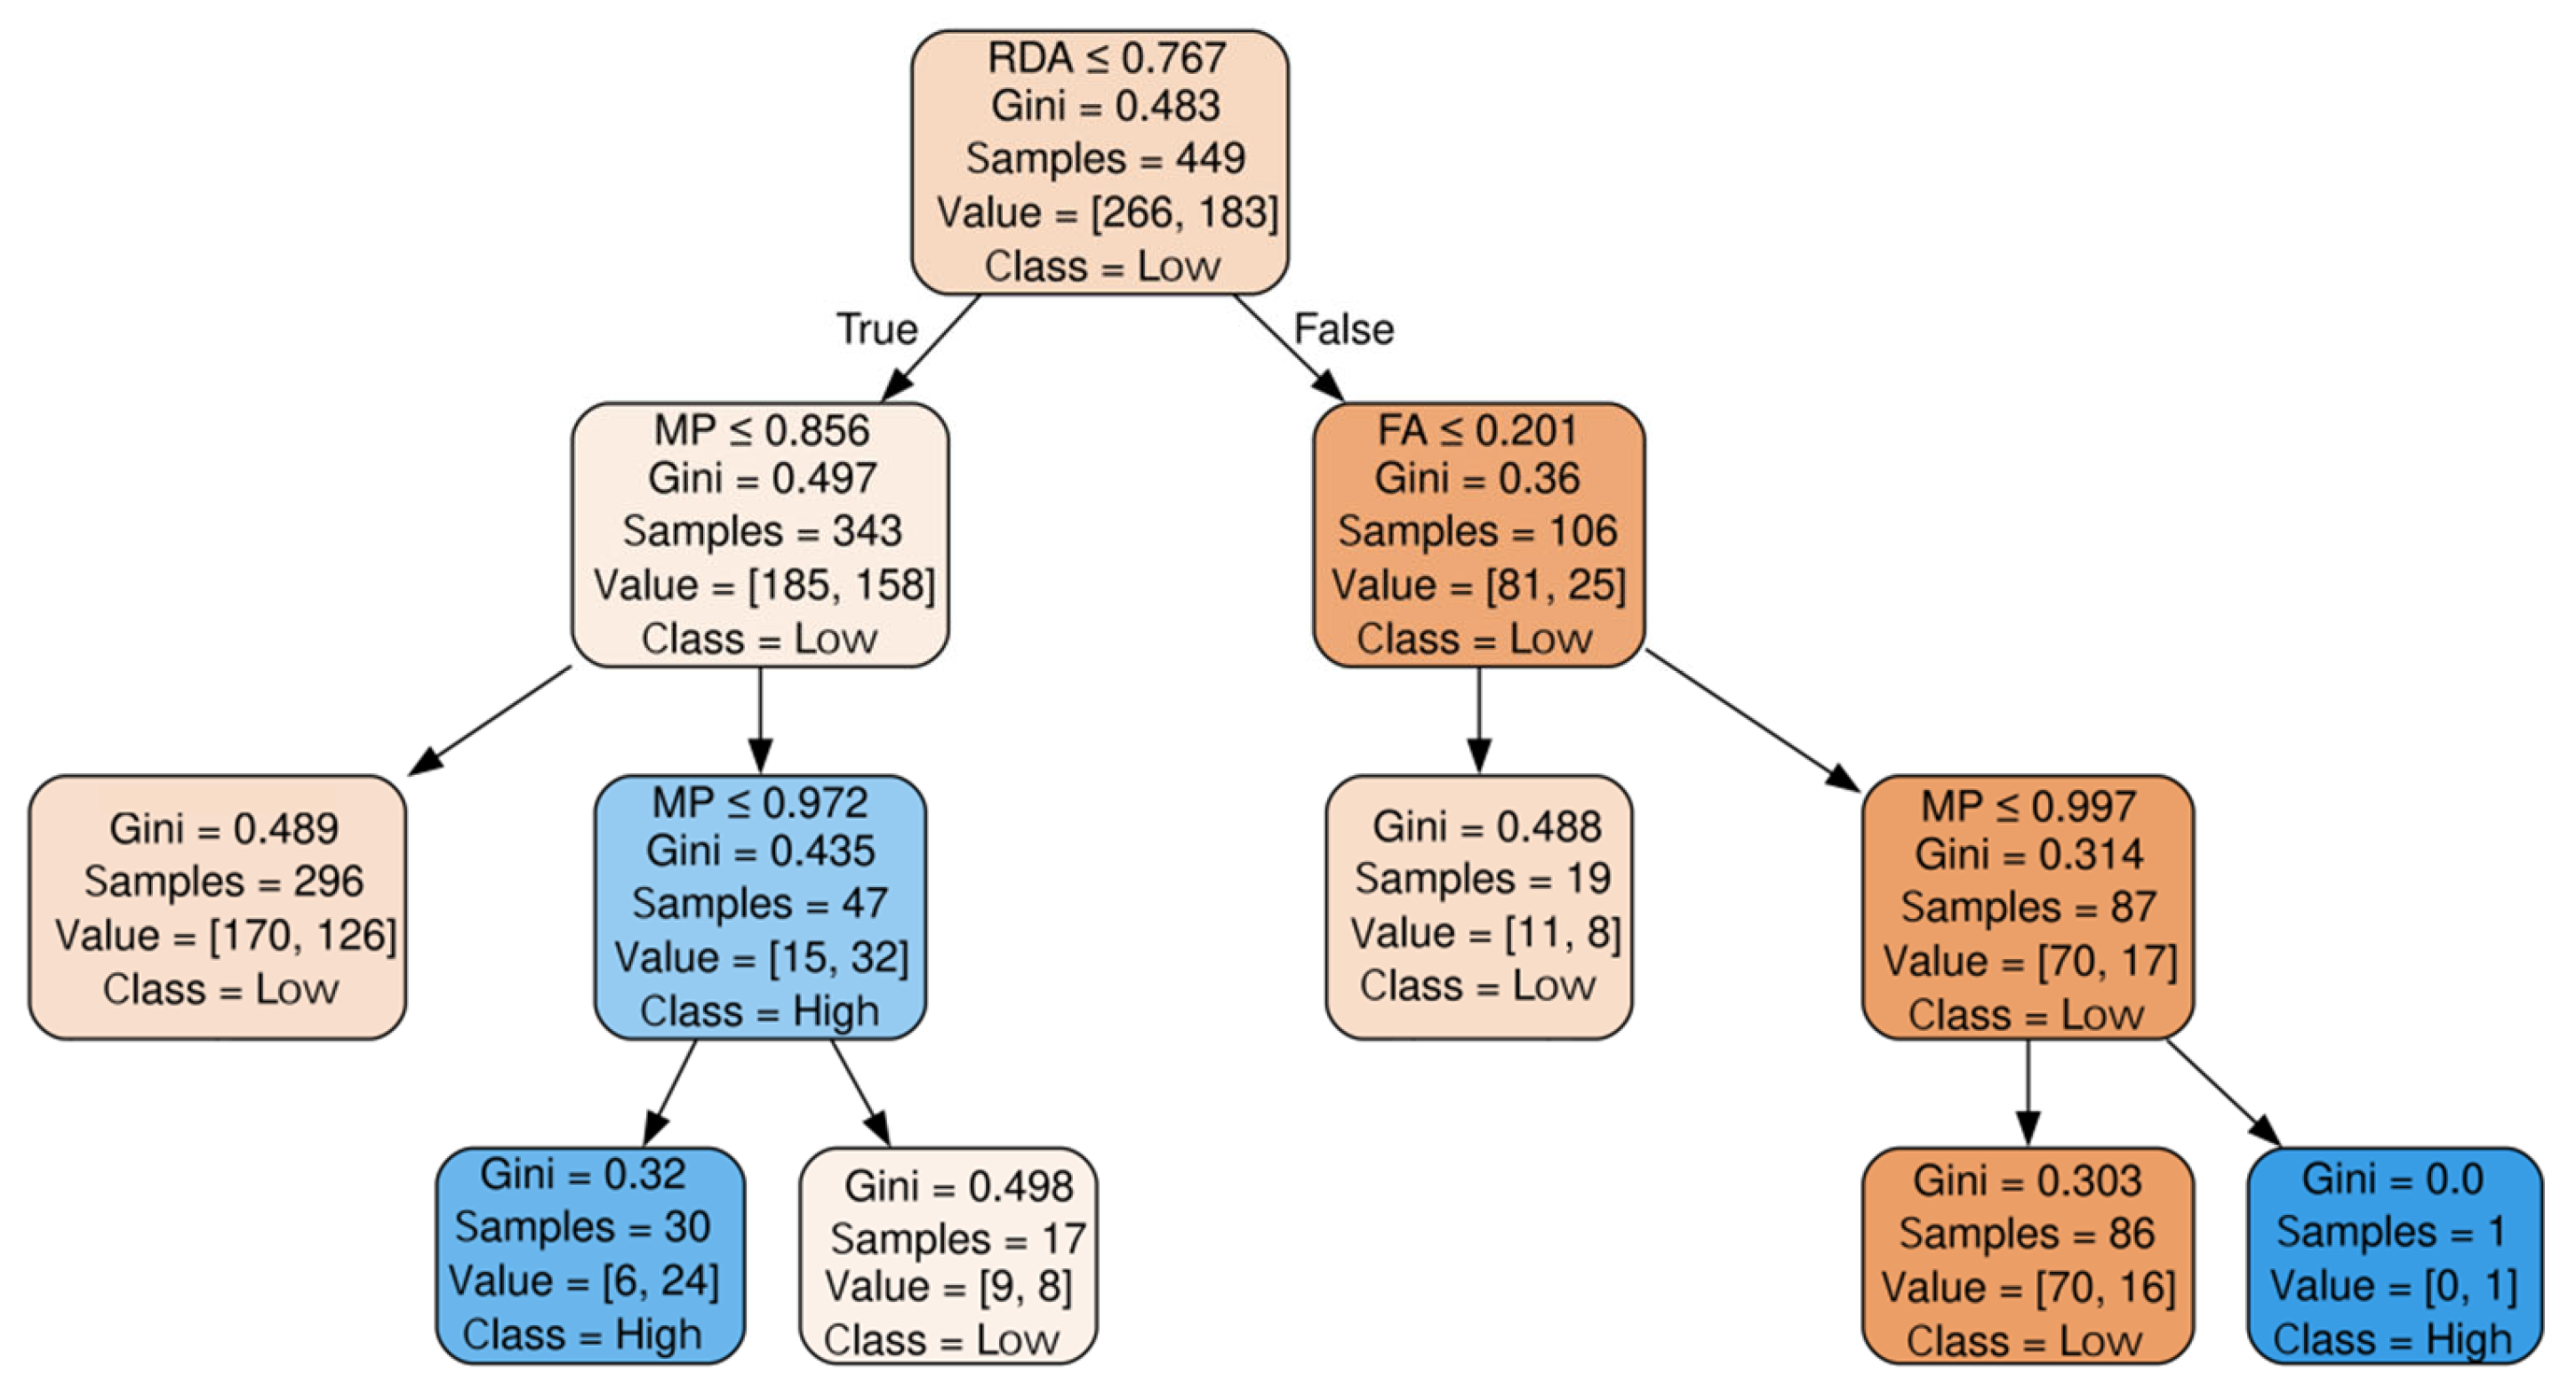
For “industry-driven” enterprises, GIP is collectively influenced by R&D ability, financial ability, and mimetic pressure, with outcomes varying across their specific configurations. Figure 6 shows that the left branch of the industry-driven decision tree is structured around R&D ability and mimetic pressure. Under low R&D ability and mimetic pressure conditions, despite high industrial agglomeration and industrial structure upgrading levels, “industry-driven” enterprises’ green innovation capacity remains limited due to weak external impetus. However, as mimetic pressure increases to a medium level, the characteristics of “industry-driven” enterprises begin to give play to the advantages of industrial agglomeration: Through upstream and downstream collaboration, they can quickly respond to the demand for green innovation and improve performance in the short term. When mimetic pressure surpasses enterprise tolerance thresholds, R&D ability deficiencies emerge as critical barriers. Resource constraints, time pressures, and technological gaps collectively drive GIP decline. The right branch integrates three nodes: R&D ability, financial ability, and mimetic pressure. When an enterprise has strong R&D ability but weak financial resources, its GIP is mediocre. By improving financial ability and mimetic pressure, although the performance is still at a low level, there is already potential for growth. If the mimetic pressure is further increased to a high level, its advantages of high industrial agglomeration and industrial structure upgrading can be fully activated, transforming the pressure into momentum. Strong R&D ability will support the accumulation of core technologies, reducing passive dependence on external pressure and push GIP increase. This result is also consistent with the research of Jiang [53].
In the “industry-driven” enterprise cluster, for enterprises with weaker R&D ability, mimetic pressure can effectively stimulate innovation vitality in an appropriate range. However, once mimetic pressure exceeds the reasonable range, that is, mimetic pressure is too large or too small, it will cause excessive anxiety or slack, thereby hindering GIP improvement. Under high mimetic pressure, enterprises should avoid blind imitation, maintain independent thinking, strengthen cross-boundary collaboration, deepen internal and external information exchange, and formulate green innovation strategies aligned with their positioning. Under low mimetic pressure, enterprises tend to be slow in adapting to external changes, making them more prone to innovation inertia. Therefore, they should actively build a sense of crisis and transmit the urgency of innovation through multiple channels to stimulate employees’ innovation consciousness. For enterprises with strong R&D ability, the lack of initial financial ability may become an obstacle to improvement in GIP. The primary strategy they should adopt is to strengthen financial ability and provide solid support for green innovation activities. However, with improvement in their financial ability to an industry-leading level, they should be vigilant against complacency weakening their innovation power, establish crisis awareness, and continue to promote green innovation.

6.2. “Capability-Driven” Enterprises Cluster

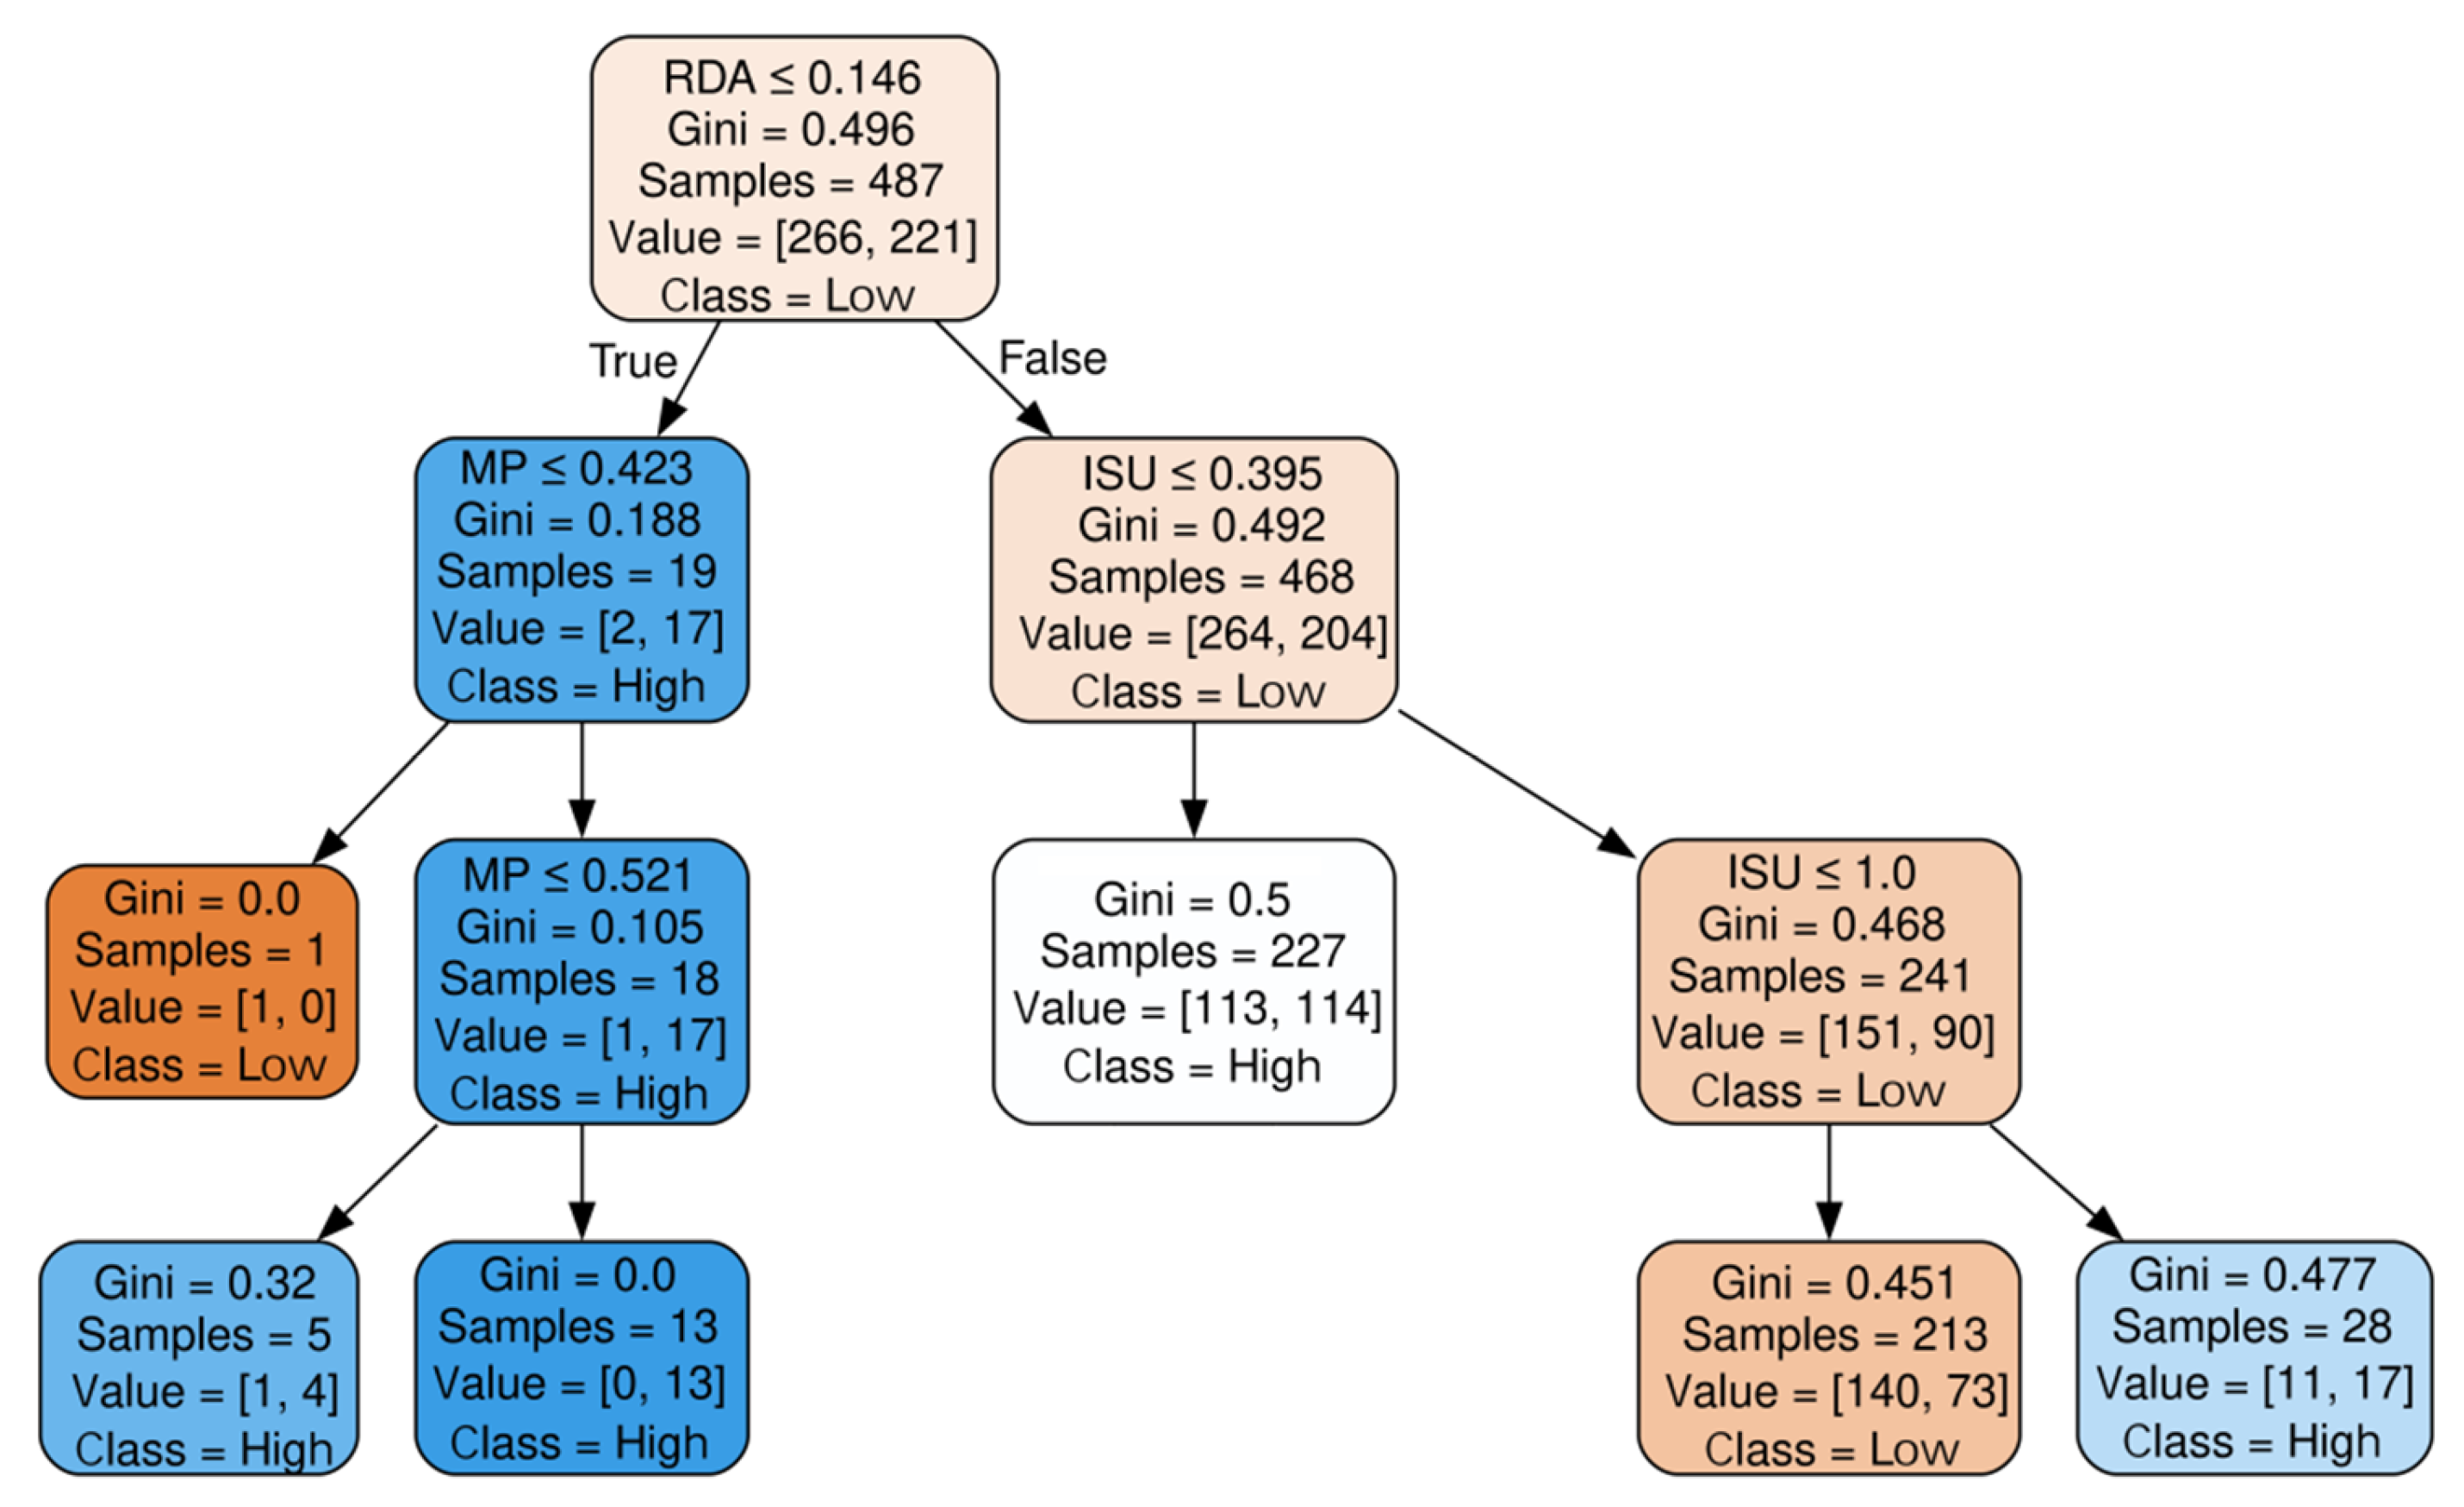
“Capability-driven” manufacturing enterprises’ GIP is primarily shaped by R&D ability, industrial structure upgrading, and mimetic pressure. Figure 7 shows that the left branch of the decision tree shows that low R&D ability and mimetic pressure correlate with low GIP. Once the mimetic pressure crosses the critical threshold, existing capacity reserves and knowledge integration efficiency convert pressure into momentum, leading to a stepped rise in high-GIP enterprises [53]. The right branch centers on R&D ability and interactions that upgrade industrial structure upgrading. During early-stage industrial structure upgrading, despite strong R&D ability and financial ability, “capability-driven” enterprises exhibit a bimodal GIP distribution: Some enterprises, relying on their strong independent R&D ability and financial resources, break through the development limitations in the early stage of industrial structure upgrading and successfully promote GIP, while others struggle with over-reliance on internal R&D, hampering commercialization and overall performance. As industrial structure upgrading progresses to the intermediate stage, enterprises generally push forward with transformation and upgrading. In this process, “capability-driven” enterprises must keep up with the pace of industrial upgrading. If they fail to use new means, such as digital technology, in a timely manner to keep up with the rhythm of industrial upgrading, their products may become out of touch with the needs of the times. However, when industrial structure upgrading reaches a higher level, the focus of competition between enterprises has shifted to a comprehensive competition of high quality, high efficiency, and high environmental protection standards. The technological pattern and market environment of the industry have undergone changes. Through the previous technological accumulation and R&D investment, a sound green innovation system and market mechanism have been established, which can lay a solid foundation for the continuous growth of green patent output and help enterprises achieve high GIP.
In the “capability-driven” enterprise cluster, for enterprises with weaker R&D ability, enhancing mimetic pressure perception is critical. Establishing mechanisms to capture such signals can drive recognition of external competition, shifting from passive response to proactive exploration and stimulating endogenous green innovation motivation. For enterprises with strong R&D ability and high GIP but in early industrial upgrading stages, vigilance and alignment with upgrading pace are essential. As upgrading progresses, most enterprises will experience mid-term performance decline. Enterprises need to have a clear understanding of this trend and pay close attention to the changes in market demand and the trends in the technological frontier. Additionally, enterprises should adjust their R&D direction and resource allocation according to the upgrading of their industrial structure. This alignment ensures consistency between green innovation outcomes and market demand.

6.3. “Challenge-Oriented” Enterprises Cluster

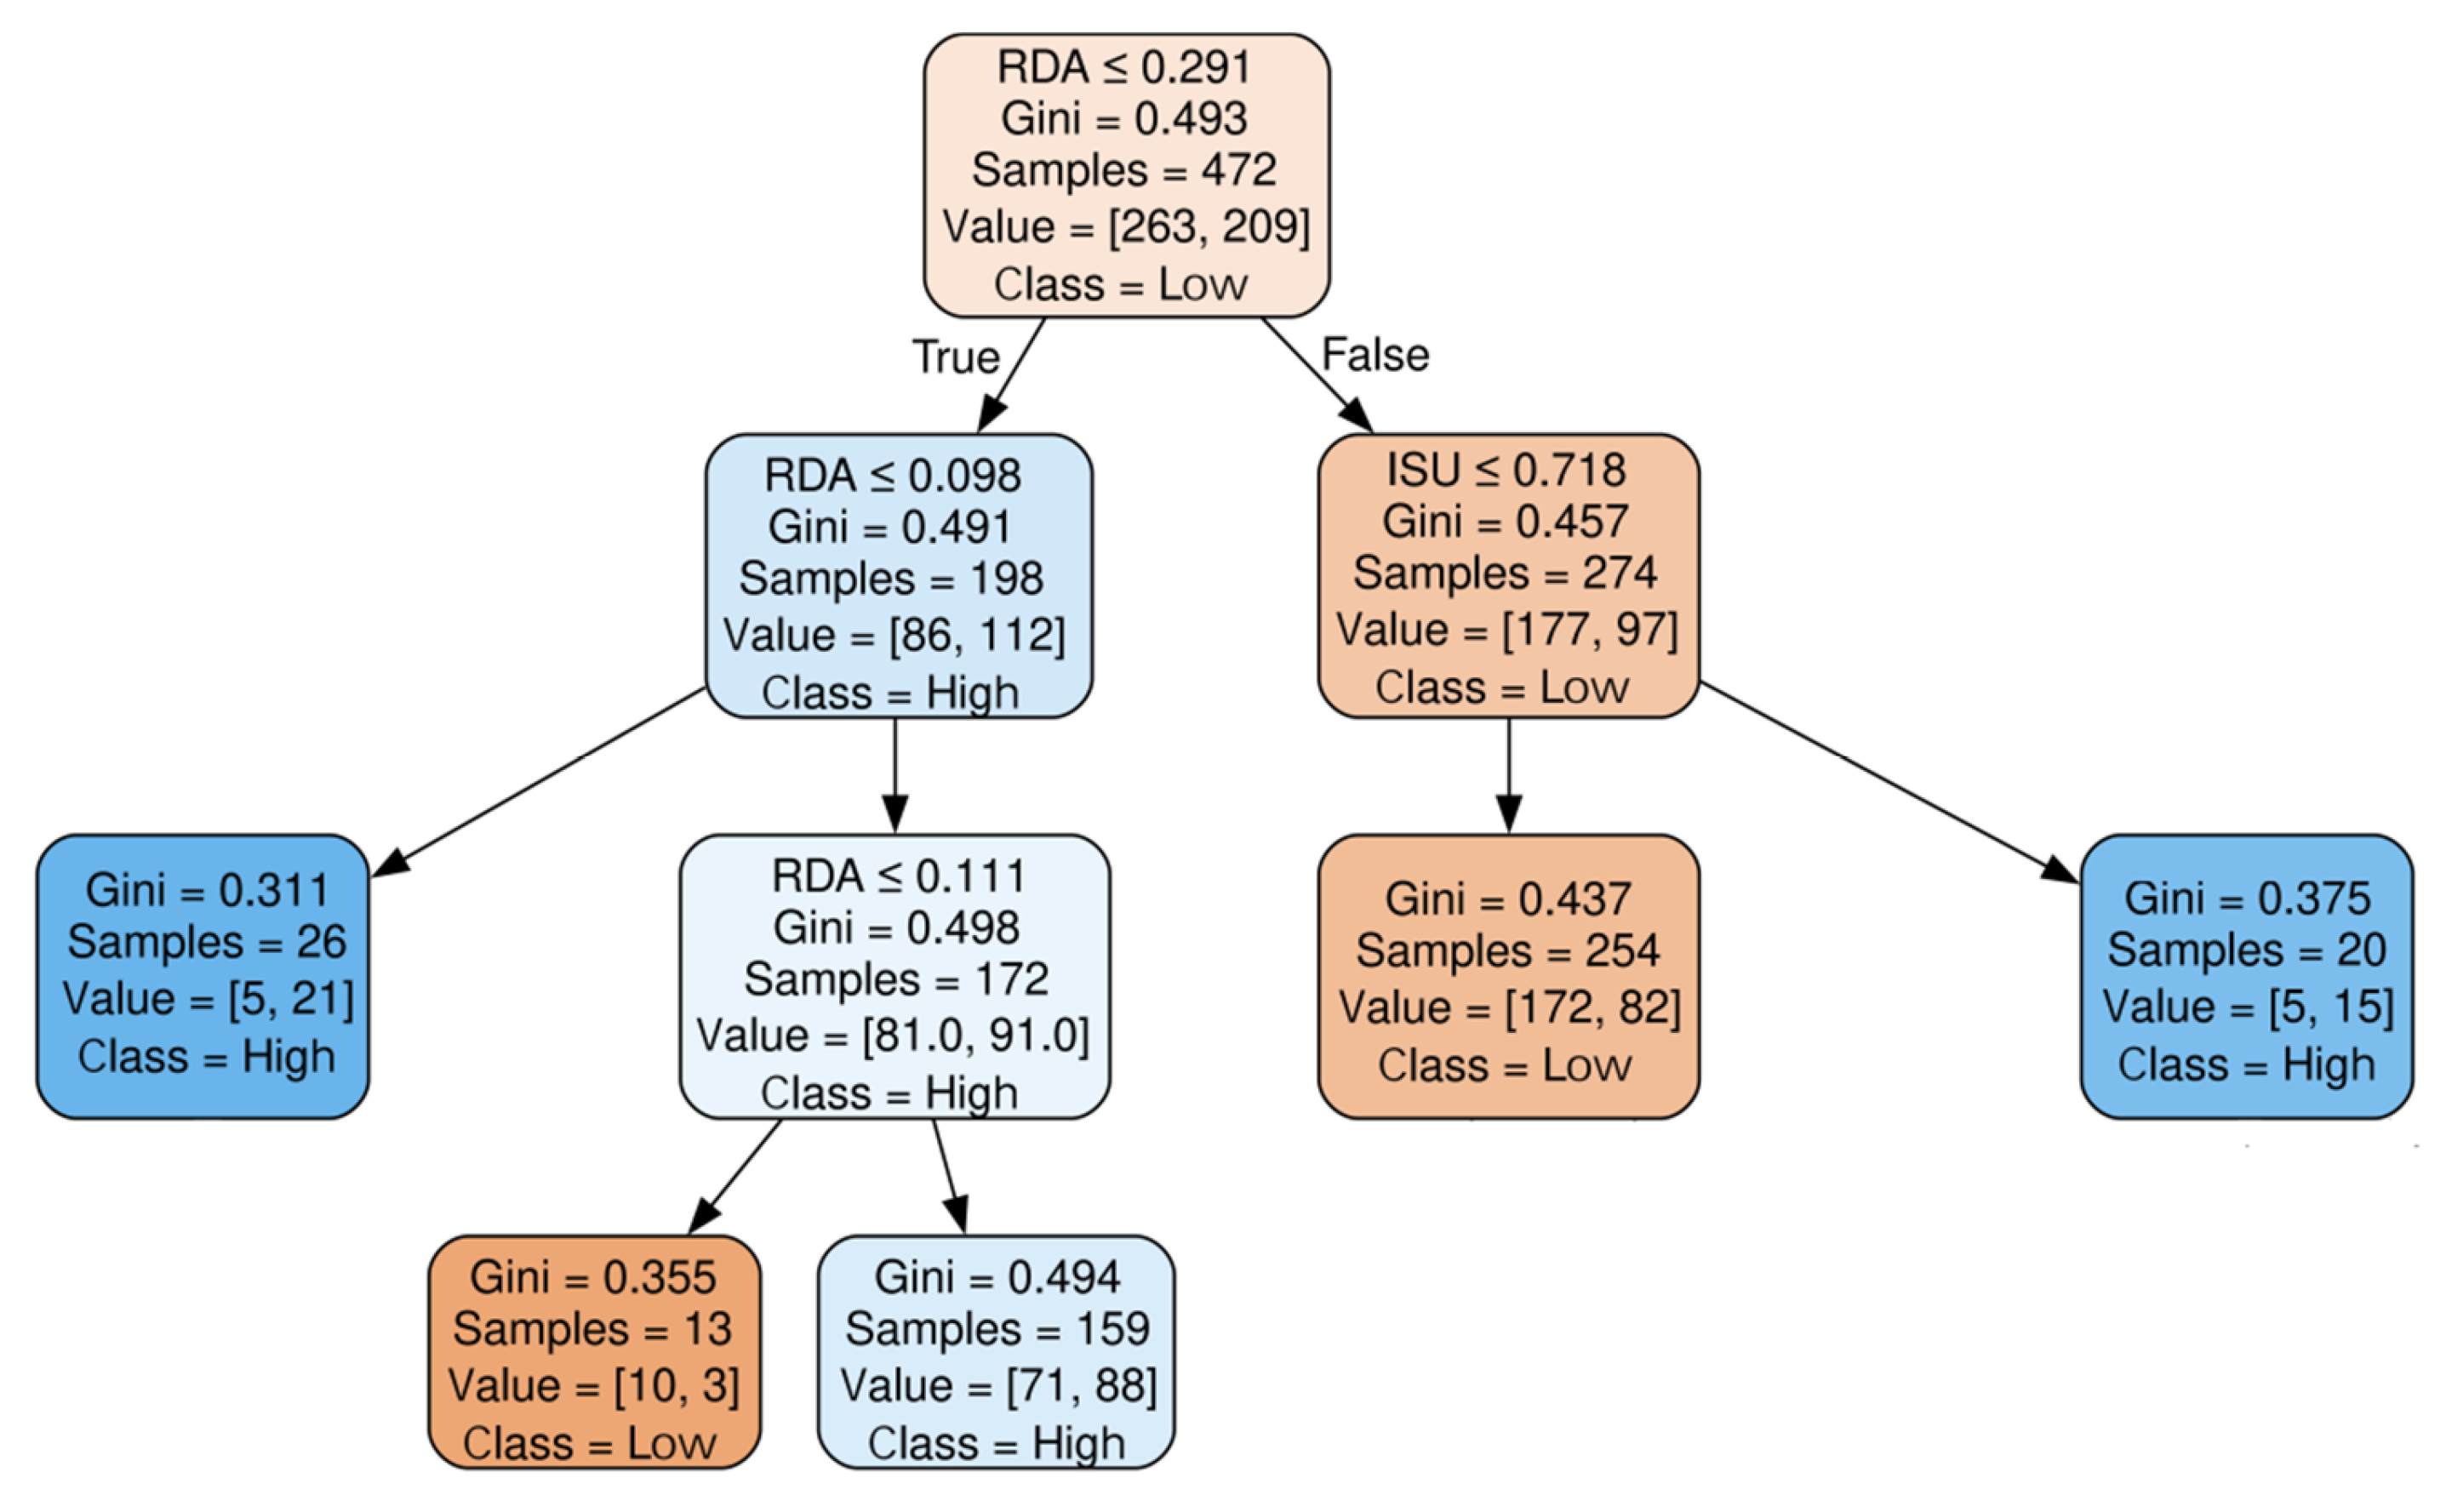
Enterprises in the “challenge-oriented” cluster are mainly influenced by R&D ability and industrial structure upgrading. Figure 8 shows that the left side of the decision tree of this group of enterprises contains only one leaf node, which is R&D ability. When R&D ability is low, enterprises tend to focus their limited resources on short-term effective green improvements rather than long-term technological breakthroughs, aiming to meet baseline performance standards. When enterprises begin to increase R&D investment, resource dispersion toward technological accumulation and capacity building increases short-term operational costs, while untransformed technical achievements lead to temporary performance declines. When R&D ability accumulates to a certain level, technological advantages can promote GIP to rise steadily, which also confirms Liu et al.’s [54] research on the U-shaped relationship between R&D ability and GIP. The right branch of the decision tree incorporates both R&D ability and industrial structure upgrading. For enterprises with strong R&D ability, the level of industrial structure upgrading becomes a key factor restricting GIP. Although the weak financial ability and the lack of mimetic pressure place enterprises in a dilemma of a vague innovation direction, industrial structure upgrading provides enterprises with a clear path for technological breakthroughs through “hard constraints” such as carbon emission caps and “incentive signals” such as subsidy policies. With their own strong R&D ability, these enterprises can achieve “precise innovation” and directly meet the core technological requirements for upgrading.
For “challenge-oriented” enterprises that currently have weak R&D ability but show high GIP, they should not be complacent about the current situation and need to realize that continuous improvement in R&D ability is the key to maintaining their competitive advantage. Enterprises should lock in the subdivisions with high demand potential and prioritize R&D-driven technological innovation as their strategic thrust in order to promote their odds of achieving a high level of GIP. For “challenge-oriented” enterprises with strong R&D ability, considering their shortcomings in financial ability, industrial agglomeration level, and mimetic pressure, only by capturing signals such as the government’s hard constraints and subsidy incentives, then clarifying the direction of technological breakthroughs, and closely following the changes in market demand brought about by industrial structure upgrading can they effectively improve GIP.

7. Conclusions and Discussion

7.1. Research Conclusions

Based on the strategic tripod framework, this paper employs K-means clustering and CART algorithms to identify paths for different types of manufacturing enterprises to improve GIP. The specific research conclusions are as follows:
(1) Among the A-share manufacturing listed enterprises in the Shanghai and Shenzhen Stock Exchanges, there exist three distinct types: “industry-driven”, “capability-driven”, and “challenge-oriented”. The characteristics of different types of enterprises show significant heterogeneity. “Industry-driven” enterprises are characterized by high industrial agglomeration and industrial structure upgrading, with GIP constrained by the dynamic interplay between R&D ability and mimetic pressure. “Capability-driven” enterprises demonstrate elevated organizational competencies under high-pressure environments. The improvement in their GIP is driven by the heterogeneity in R&D ability, presenting a dual-path pattern. In contrast, “challenge-oriented” enterprises face structural constraints: deficient R&D ability, financial ability, and industrial agglomeration. Their GIP exhibits a U-shaped relationship with R&D investment, where high coercive pressure interacts with incremental industrial upgrading to compound innovation challenges.
(2) Internal organizational abilities serve as the core driving force behind enterprises’ GIP. Among them, R&D ability has become a key factor for various enterprise groups to enhance GIP due to its universality, a finding which is also consistent with the research of Alkaraan et al. [55]. Through sustained technological accumulation and R&D investments, R&D ability can promote green innovation, which is applicable to different types of manufacturing enterprises. In contrast, the driving logic of mimetic pressure on GIP is differentiated: For enterprises with certain resources, the impact of mimetic pressure on GIP demonstrates an inverted U-shape, while for enterprises lacking resources, such as “challenge-oriented” enterprises, mimetic pressure exerts a positive influence on GIP. While external environmental factors exhibit limited direct influence, industrial structure maturity exerts disproportionate effects: underdeveloped industrial structures impose severe GIP constraints, whereas advanced structures enable innovation synergies.

7.2. Theoretical Contributions

The main contributions of this paper are as follows:
(1) Existing studies have explored the impact of organizational [9], industrial [33], and institutional [27] dimensions variables on GIP, but have not addressed what the key influencing factors of GIP are under the synergy of multiple dimensions. This study integrates the three dimensions to identify such factors, echoing Zhang et al. [56] that “enhancing GIP requires anchoring key factors” and supplementing research on “multi-dimensional collaborative identification”, thus providing theoretical support for enterprises and governments in precise regulation.
(2) Traditional econometric regression has limitations in handling the interaction mechanisms between variables [10,16]. Although existing studies have recognized this defect and attempted to make breakthroughs, relevant explorations remain relatively scattered. This study identifies multi-factor interaction effects through machine learning algorithms, offering a new attempt to alleviate the aforementioned methodological limitations. This approach is highly consistent with the view proposed by Wan et al. [42] that “machine learning can break through traditional analytical frameworks and accurately sort out complex interactive relationships among multiple factors”, thus expanding the application scenarios of this method in the research field of GIP.
(3) Previous studies often neglected firm heterogeneity [14,18], failing to reflect differences in GIP drivers across firms. This study uses the K-means algorithm to categorize manufacturing enterprises, addressing the flaw of previous “one-size-fits-all” research. It aligns with the view of Li et al. [46] that “the influence mechanism of corporate green innovation performance should be analyzed from a firm classification perspective” and enriches the methods and content of classification research.

7.3. Managerial Implications

The relevant research conclusions bring valuable management implications for how to promote manufacturing enterprises to achieve high-level GIP.

7.3.1. Enterprise Side

(1) When adapting to the green innovation market, enterprises should combine R&D investment with financial security. In the early R&D stage, green core technology directions should be clarified, special R&D funds linked to annual operating budgets should be delineated to secure stable sources, a dedicated R&D team should be set up to formulate phased technical attack points, and the financial department should allocate funds in installments, according to progress, to avoid idleness or shortage. In the middle stage of R&D, long-term technology reserves should be distinguished from short-term commercialization projects, and resource allocation ratios should be flexibly adjusted via regular potential value evaluations to balance long-term investment and short-term benefits. In the mature stage, special promotion funds should be planned from operating profits for market research, expansion should be channeled, and the production process of green products should be adapted to turn technological achievements into actual benefits, realizing synergistic improvement in environmental and economic value.
(2) In the early commercialization of green innovation achievements, enterprises should view mimetic pressure dialectically. If green products receive poor market feedback while peer products sell well, mimetic pressure may lead to abandoning original result optimization to imitate best-sellers, wasting early investment and missing niche growth opportunities. Countermeasures include transforming pressure into innovation drivers: pressure signals should be conveyed through meetings, and a pressure perception mechanism should be set up where designated departments collect information and form weekly briefings to shift from passive response to active exploration. In addition, a special innovation reward fund with clear standards should be established, providing proportional bonuses to teams that propose original green innovation ideas and successfully transform them based on achievement market value.
(3) When expanding into new fields, enterprises must measure if the target industry is in a critical stage of high-level industrial structure upgrading. If not, they should proceed cautiously, as medium-level structures rarely support high GIP, increasing investment return uncertainty. For enterprises that have entered industries at the medium development stage, on one hand, they should terminate incremental investment in this field, shrink existing resources in an orderly manner, and avoid continuous waste of resources; on the other hand, they can shift to high-value industries with green innovation potential. This involves selecting fields in line with the trend of industrial structure upgrading, formulating entry strategies based on their existing resources, or promoting the integration of accumulated green innovation achievements with scenario needs in other industries.

7.3.2. Government Side

(1) The government should establish a hierarchical mechanism for green innovation R&D subsidies: For enterprises with clear core technology directions included in key support catalogs, they must provide subsidies based on a certain proportion of actual R&D investment. They should appropriately increase the subsidy ratio in the initial R&D stage to ease start-up pressure and collaborate with financial institutions to set up special credit channels for green innovation; for enterprises advancing R&D as scheduled with remarkable results, they must coordinate preferential interest rates and extended repayment periods to ensure capital chain stability.
(2) The government should build an industry-wide information sharing platform for green technology achievement transformation, integrating market feedback, peer innovation trends, and policy interpretations. It must regularly release industry analysis reports to help enterprises accurately identify competitive patterns and reduce blind imitation caused by information asymmetry. Meanwhile, the government should establish demonstration projects for green innovation achievements, including providing special promotion funds for highly original, market-potential achievements to enhance market recognition through government endorsement, setting up rapid protection channels for green technology infringement, and strengthening crackdowns on malicious infringements to protect enterprises’ enthusiasm for independent R&D.
(3) Relevant departments and professional institutions are advised to conduct regular evaluations to identify industries lagging in upgrading and clarify policy targets. Preferential land prices and infrastructure subsidies may be used to attract industry peers and upstream supporting enterprises with a view to reducing costs via resource sharing, solving common problems through technical exchanges, and building collaborative platforms for industrial upgrading. Access and quality standards should be dynamically updated to force and guide transformation toward standardization, efficiency, and greenization, thereby boosting overall industrial levels.

7.4. Innovations and Limitations

The innovation of this paper lies in the following aspects: (1) Based on the strategic tripod framework, this study systematically integrates multi-dimensional factors such as R&D ability, financial ability, and industrial agglomeration. It not only reveals the synergistic interactions among framework factors to avoid countermeasure deviations due to ignoring inter-variable effects but also innovatively expands the framework from traditional strategic formulation to GIP influencing mechanisms, offering an exploratory approach to multi-factor synergies. (2) Breaking through the traditional “dichotomy” research paradigm, this study introduces big data analysis technologies such as clustering and classification into the research on GIP of manufacturing enterprises, systematically revealing the complex nonlinear relationships between organizational, industrial, and institutional factors and GIP. This provides a data-driven research paradigm innovation for breaking the “one-size-fits-all” analysis model.
However, this paper still has two shortcomings: First, despite reasonable and innovative use of machine learning methods here, such approaches focus on data description and correlation exploration and are unable to fully validate authentic causal associations between variables. Future studies will incorporate structural models to enhance causal analysis. Second, GIP is currently gauged by the proportion of green patent applications. While this indicator reflects basic input–output dynamics, it insufficiently portrays quality of green innovation. Subsequent work will study indicators, such as patent citation frequencies, to achieve systematic evaluation.

Author Contributions

Conceptualization, X.W.; methodology, X.W.; software, Y.X.; data curation, Y.X.; writing—original draft, Z.H.; writing—review and editing, Z.H. and X.W.; visualization, Y.X.; supervision, L.Z. All authors have read and agreed to the published version of the manuscript.

Funding

This research was supported by the Social Science Foundation Project of Fujian Province of China (FJ2023B109, FJ2024BF039) and the National-level Project of the College Students’ Innovation and Entrepreneurship Training Program of Huaqiao University (202410385042, 202510385011).

Data Availability Statement

The raw data supporting the conclusions of this research will be made available by the authors on request.

Conflicts of Interest

The authors declare no conflicts of interest.

Abbreviations

The following abbreviations are used in this manuscript:
GIPGreen innovation performance
RDAR&D ability
FAFinancial ability
IAIndustrial agglomeration
ISUIndustrial structure upgrading
CPCoercive pressure
MPMimetic pressure
CARTClassification and regression tree

References

  1. Matviienko, H.; Pylypenko, O.; Putintsev, A.; Chumak, O.; Gordiichuk, S. European Union policy on financing eco—Innovations in the transition to a green economy. Cuest. Polít. 2022, 40, 28–48. [Google Scholar] [CrossRef]
  2. Chen, G.C. The United States—China race for green transformation: Institutions, incentives, and green industrial policies. J. Chin. Polit. Sci. 2024, 29, 461–482. [Google Scholar] [CrossRef]
  3. Palmer, K.; Oates, W.E.; Portney, P.R. Tightening Environmental Standards; The Benefit-Cost or the No-Cost Paradigm? J. Econ. Perspect. 1995, 9, 119–132. [Google Scholar] [CrossRef]
  4. Porter, M.E.; Linde, C.D. Toward a New Conception of the Environment-Competitiveness Relationship. J. Econ. Perspect. 1995, 9, 97–118. [Google Scholar] [CrossRef]
  5. Li, T.; Shi, Z.; Han, D.; Zeng, J. Agglomeration of the New Energy Industry and Green Innovation Efficiency: Does the Spatial Mismatch of R&D Resources Matter? J. Clean. Prod. 2023, 383, 135453. [Google Scholar]
  6. Liu, J.; An, K.K.; Jang, S. Threshold Effect and Mechanism of Tourism Industrial Agglomeration on Green Innovation Efficiency: Evidence from Coastal Urban Agglomerations in China. Ocean Coast. Manag. 2023, 246, 106908. [Google Scholar] [CrossRef]
  7. Zeng, W.P.; Lin, L.; Huang, Y. Industrial Collaborative Agglomeration, Marketization, and Green Innovation: Evidence from China’s Provincial Panel Data. J. Clean. Prod. 2021, 279, 123598. [Google Scholar] [CrossRef]
  8. Qiu, Y.; Wang, H.; Wu, J. Impact of Industrial Structure Upgrading on Green Innovation: Evidence from Chinese Cities. Environ. Sci. Pollut. Res. 2023, 30, 3887–3900. [Google Scholar] [CrossRef]
  9. Wang, X.; Yang, Z.; Jin, S. Managerial Ability and Green Innovation: The Moderating Effect of Directors’ and Officers’ Insurance in China. J. Int. Trade Commer. 2024, 20, 17–36. [Google Scholar] [CrossRef]
  10. Fang, L.; Sheng, Z. Policy orientation, knowledge dynamic ability and green innovation: A mediation model based on China provincial panel data. Zb. Rad. Ekon. Fak. Rij. 2021, 39, 9–37. [Google Scholar] [CrossRef]
  11. Cao, Y.; Kou, F.R.; Zhuang, Y. Offensive or defensive? The influence of corporate strategic aggressiveness on corporate performance from the perspective of supply chain. Manag. Rev. 2025, 3, 1–18. [Google Scholar]
  12. Pan, X.; Chen, X.J. Meaningful green innovation: From the perspective of strategic tripod. Sci. Sci. Manag. Sci. Technol. 2022, 43, 3–16. [Google Scholar]
  13. Fussler, C.; James, P. Driving Eco-Innovation: A Breakthrough Discipline for Innovation and Sustainability; Pitman Publishing: London, UK, 1996. [Google Scholar]
  14. Wang, J.G.; Liu, F.H.; Wu, J. A Strategy Tripod Perspective on ISO 9001 Adoption: Evidence from Chinese Manufacturing Firms. IEEE Trans. Eng. Manag. 2023, 70, 3990–4004. [Google Scholar] [CrossRef]
  15. Wang, K.; Wu, S.L.; Gao, H.; Wang, C.Y. Research on the influence of air pollution on green technology innovation of listed companies in heavy pollution industries. Chin. J. Manag. 2023, 20, 400–410. [Google Scholar]
  16. Xu, Y.Z.; Chin, W.; Liu, Y.D.; He, K. Do institutional pressures promote green innovation? The effects of cross-functional coopetition in green supply chain management. Int. J. Phys. Distrib. Logist. Manag. 2022, 53, 743–761. [Google Scholar] [CrossRef]
  17. Huang, Y.C.; Chen, C.T. Exploring institutional pressures, firm green slack, green product innovation and green new product success: Evidence from Taiwan’s high-tech industries. Technol. Forecast. Soc. Chang. 2022, 174, 121196. [Google Scholar] [CrossRef]
  18. Sherazi, K.; Zhang, P.C.; Ghazanfar, F.; Khan, Q.T.A. Why is institutional pressure insufficient to develop green innovation in manufacturing firms? The role of green high-performance work systems and managerial environmental concern. J. Environ. Plan. Manag. 2023, 68, 1622–1647. [Google Scholar] [CrossRef]
  19. Qi, G.Y.; Jia, Y.H.; Zou, H.L. Is institutional pressure the mother of green innovation? Examining the moderating effect of absorptive capacity. J. Clean. Prod. 2021, 278, 123957. [Google Scholar] [CrossRef]
  20. Deltas, G.; Harrington, D.R.; Khanna, M. Oligopolies with (somewhat) environmentally conscious consumers: Market equilibrium and regulatory intervention. J. Econ. Manag. Strategy 2013, 22, 640–667. [Google Scholar] [CrossRef]
  21. Wang, X.L.; Pang, M.Y.; Jin, J.H.; Tao, X.Y.; Dong, H.M. Research on the influencing factors of green innovation performance of heavy polluting enterprises based on machine learning. Sci. Res. Manag. 2025. Available online: https://link.cnki.net/urlid/11.1567.G3.20250623.1329.004 (accessed on 20 August 2025).
  22. Riaz, M.; Jie, W.; Sherani, S.; Chang, S. Assessing the role of organizational strategic factors in stimulating green innovation performance: Moderating effects of green absorptive capacity. Bus. Process Manag. J. 2024, 30, 1013–1043. [Google Scholar] [CrossRef]
  23. Li, B.Z.; Zeng, J.W.; Wang, D.; Su, Y. Research on co-evolution of enterprise green innovation system based on knowledge behavior. J. Ind. Eng. Eng. Manag. 2020, 34, 42–52. [Google Scholar]
  24. Sun, Y.M. Digital transformation and corporates’ green technology innovation performance—The mediating role of knowledge sharing. Financ. Res. Lett. 2024, 62, 105105. [Google Scholar] [CrossRef]
  25. Peng, M.W.; Sun, L.S.; Pinkham, B.; Hao, C. The institution-based view as a third leg for a strategy tripod. Acad. Manag. Perspect. 2009, 23, 63–81. [Google Scholar] [CrossRef]
  26. Barney, J. Firm resources and sustained competitive advantage. J. Manag. 1991, 17, 99–120. [Google Scholar] [CrossRef]
  27. Porter, M.E. Competitive Strategy: Techniques for Analyzing Industries and Competitors; Free Press: New York, NY, USA, 1980. [Google Scholar]
  28. DiMaggio, P.J.; Powell, W.W. The iron cage revisited: Institutional isomorphism and collective rationality in organizational fields. Am. Sociol. Rev. 1983, 48, 147–160. [Google Scholar] [CrossRef]
  29. Rothwell, R. Successful industrial innovation: Critical factors for the 1990s. R&D Manag. 1992, 22, 221–239. [Google Scholar] [CrossRef]
  30. Jiang, W.; Luo, D.K.; Wang, L.W.; Zhou, T.Z. Foreign ownership and bribery in Chinese listed firms: An institutional perspective. J. Bus. Res. 2024, 174, 114530. [Google Scholar] [CrossRef]
  31. Dangelico, R.M.; Pujari, D.; Pontrandolfo, P. Green product innovation in manufacturing firms: A sustainability-oriented dynamic capability perspective. Bus. Strategy Environ. 2017, 26, 490–506. [Google Scholar] [CrossRef]
  32. Jiang, W.B.; Chai, H.Q.; Shao, J.; Feng, T.; Newman, A. Green entrepreneurial orientation for enhancing firm performance: A dynamic capability perspective. J. Clean. Prod. 2018, 198, 1311–1323. [Google Scholar] [CrossRef]
  33. Liu, S.C.; Wu, P.J. The impact of high-tech industrial agglomeration on China’s green innovation efficiency: A spatial econometric analysis. Environ. Sci. Pollut. Res. 2023, 11, 1167918. [Google Scholar] [CrossRef]
  34. Peng, Y.; Ji, Y. Can Informal Environmental Regulation Promote Green Innovation? A Quasi-Natural Experiment Based on Environmental Information Disclosure Policy. Pol. J. Environ. Stud. 2022, 31, 2795–2809. [Google Scholar] [CrossRef]
  35. Carter, C.R.; Rogers, D.S. A framework of sustainable supply chain management: Moving toward new theory. Int. J. Phys. Distrib. Logist. Manag. 2008, 38, 360–387. [Google Scholar] [CrossRef]
  36. Stucki, T.; Woerter, M. Competitive pressure and diversification into green R&D. Rev. Ind. Organ. 2018, 55, 301–325. [Google Scholar] [CrossRef]
  37. Mangi, T.A.; Wei, Z.L.; Zhang, L.Q.; Bao, Y.C.; Khoso, W.M. Profiting from Frugal Innovation: A Strategy-Tripod-View and Evidence from China. Creat. Innov. Manag. 2025, 34, 579–593. [Google Scholar] [CrossRef]
  38. Punhani, A.; Faujdar, N.; Mishra, K.K.; Subramanian, M. Binning-Based Silhouette Approach to Find the Optimal Cluster Using K-Means. IEEE Access 2022, 10, 115025–115032. [Google Scholar] [CrossRef]
  39. Zhou, W.H.; Li, H.L. R&D team network configurations, knowledge diversity and breakthrough innovation: A combined effect framework. Eur. J. Innov. Manag. 2024, 28, 2285–2303. [Google Scholar]
  40. Zhang, L.P.; Li, H.L.; Lin, C.P.; Wan, X.J. The Influence of Knowledge Base on the Dual-Innovation Performance of Firms. Front. Psychol. 2022, 13, 879640. [Google Scholar] [CrossRef]
  41. Lv, Z.H.; Qiao, L.; Singh, A.K. Advanced machine learning on cognitive computing for human behavior analysis. IEEE Trans. Comput. Soc. Syst. 2021, 8, 1194–1202. [Google Scholar] [CrossRef]
  42. Wan, X.J.; Li, J.M.; Lai, J.; Zhang, L.P. Technological Catch-Up Performance: The Interplay Between Collaboration Networks and Knowledge Networks. Systems 2025, 13, 363. [Google Scholar] [CrossRef]
  43. Liu, Y.-T.; Rhee, S.-Y.; Hyun, E.-J. Knowledge Exploitation, Inventor Characteristics, and Green Innovation Performance in Automotive Firms. Systems 2025, 13, 6. [Google Scholar] [CrossRef]
  44. Guo, G.Y.; Hu, D.M.; Wang, X.H. Climate disasters and processing of green patents. J. Econ. Surv. 2024, 38, 1983–2010. [Google Scholar] [CrossRef]
  45. Hao, Y.; Zhao, M.; Wang, W.N.; Han, D.N. The Impact of Female Executives’ Cognitive Imprints on Corporate Green Innovation. Sci. Res. Manag. 2025. Available online: https://link.cnki.net/urlid/11.1567.G3.20250701.1409.004 (accessed on 20 August 2025).
  46. Li, H.Y.; Liu, Q.Y.; Li, S.Y.; Fu, S.Y. Environmental, Social and Governance Information Disclosure and Corporate Green Innovation Performance. Stat. Res. 2022, 39, 38–54. [Google Scholar]
  47. Zhang, L.I.; Zuo, X. Credit of small and medium sized scientific and technological enterprises based on BP neural network Evaluation research. MATEC Web Conf. 2021, 336, 09010. [Google Scholar] [CrossRef]
  48. He, X.L.; Wang, C.Y.; Yang, X.W.; Lai, Z.J. Do enterprise ownership structures affect financial performance in China’s power and gas industries? J. Util. Policy 2021, 73, 101303. [Google Scholar] [CrossRef]
  49. Bergman, E.M.; Feser, E.J. Industrial and Regional Clusters: Concepts and Comparative Applications; Regional Research Institute: Morgantown, WV, USA, 2020. [Google Scholar]
  50. Shi, L.L.; Zhao, J. Environmental regulation, technological innovation and industrial structure upgrading. Sci. Res. Manag. 2018, 39, 119–125. [Google Scholar]
  51. Scott, W.R. Institutions and Organizations: Ideas, Interests, and Identities; Sage Publications: Thousand Oaks, CA, USA, 1995. [Google Scholar]
  52. Shen, H.T.; Su, L.D. A study on the imitation in corporate information disclosure: Based on institutional theory. Nankai Bus. Rev. 2012, 15, 82–99. [Google Scholar]
  53. Jiang, Y.G. A research on the dynamic mechanism of intellectual transformation among industrial enterprises. Sci. Res. Manag. 2020, 41, 104–114. [Google Scholar]
  54. Liu, Y.; Huang, H.Y.; Mbanyele, W.; Wei, Z.X.; Li, X. How does green industrial policy affect corporate green innovation? Evidence from the green factory identification in China. Energy Econ. 2025, 141, 108047. [Google Scholar] [CrossRef]
  55. Alkaraan, F.; Elmarzouky, M.; Hussainey, K.; Venkatesh, V.G.; Shi, Y.Y.; Gulko, N. Reinforcing green business strategies with industry 4.0 and governance towards sustainability: Natural-resource-based view and dynamic capability. Bus. Strategy Environ. 2024, 3, 3588–3606. [Google Scholar] [CrossRef]
  56. Zhang, L.P.; Qiu, H.H.; Chen, J.Y.; Li, H.L.; Wan, X.J. How to enhance enterprises’ radical innovation performance through multiple pathways—A machine learning analysis of SRDI enterprises in China. Systems 2025, 13, 198. [Google Scholar] [CrossRef]
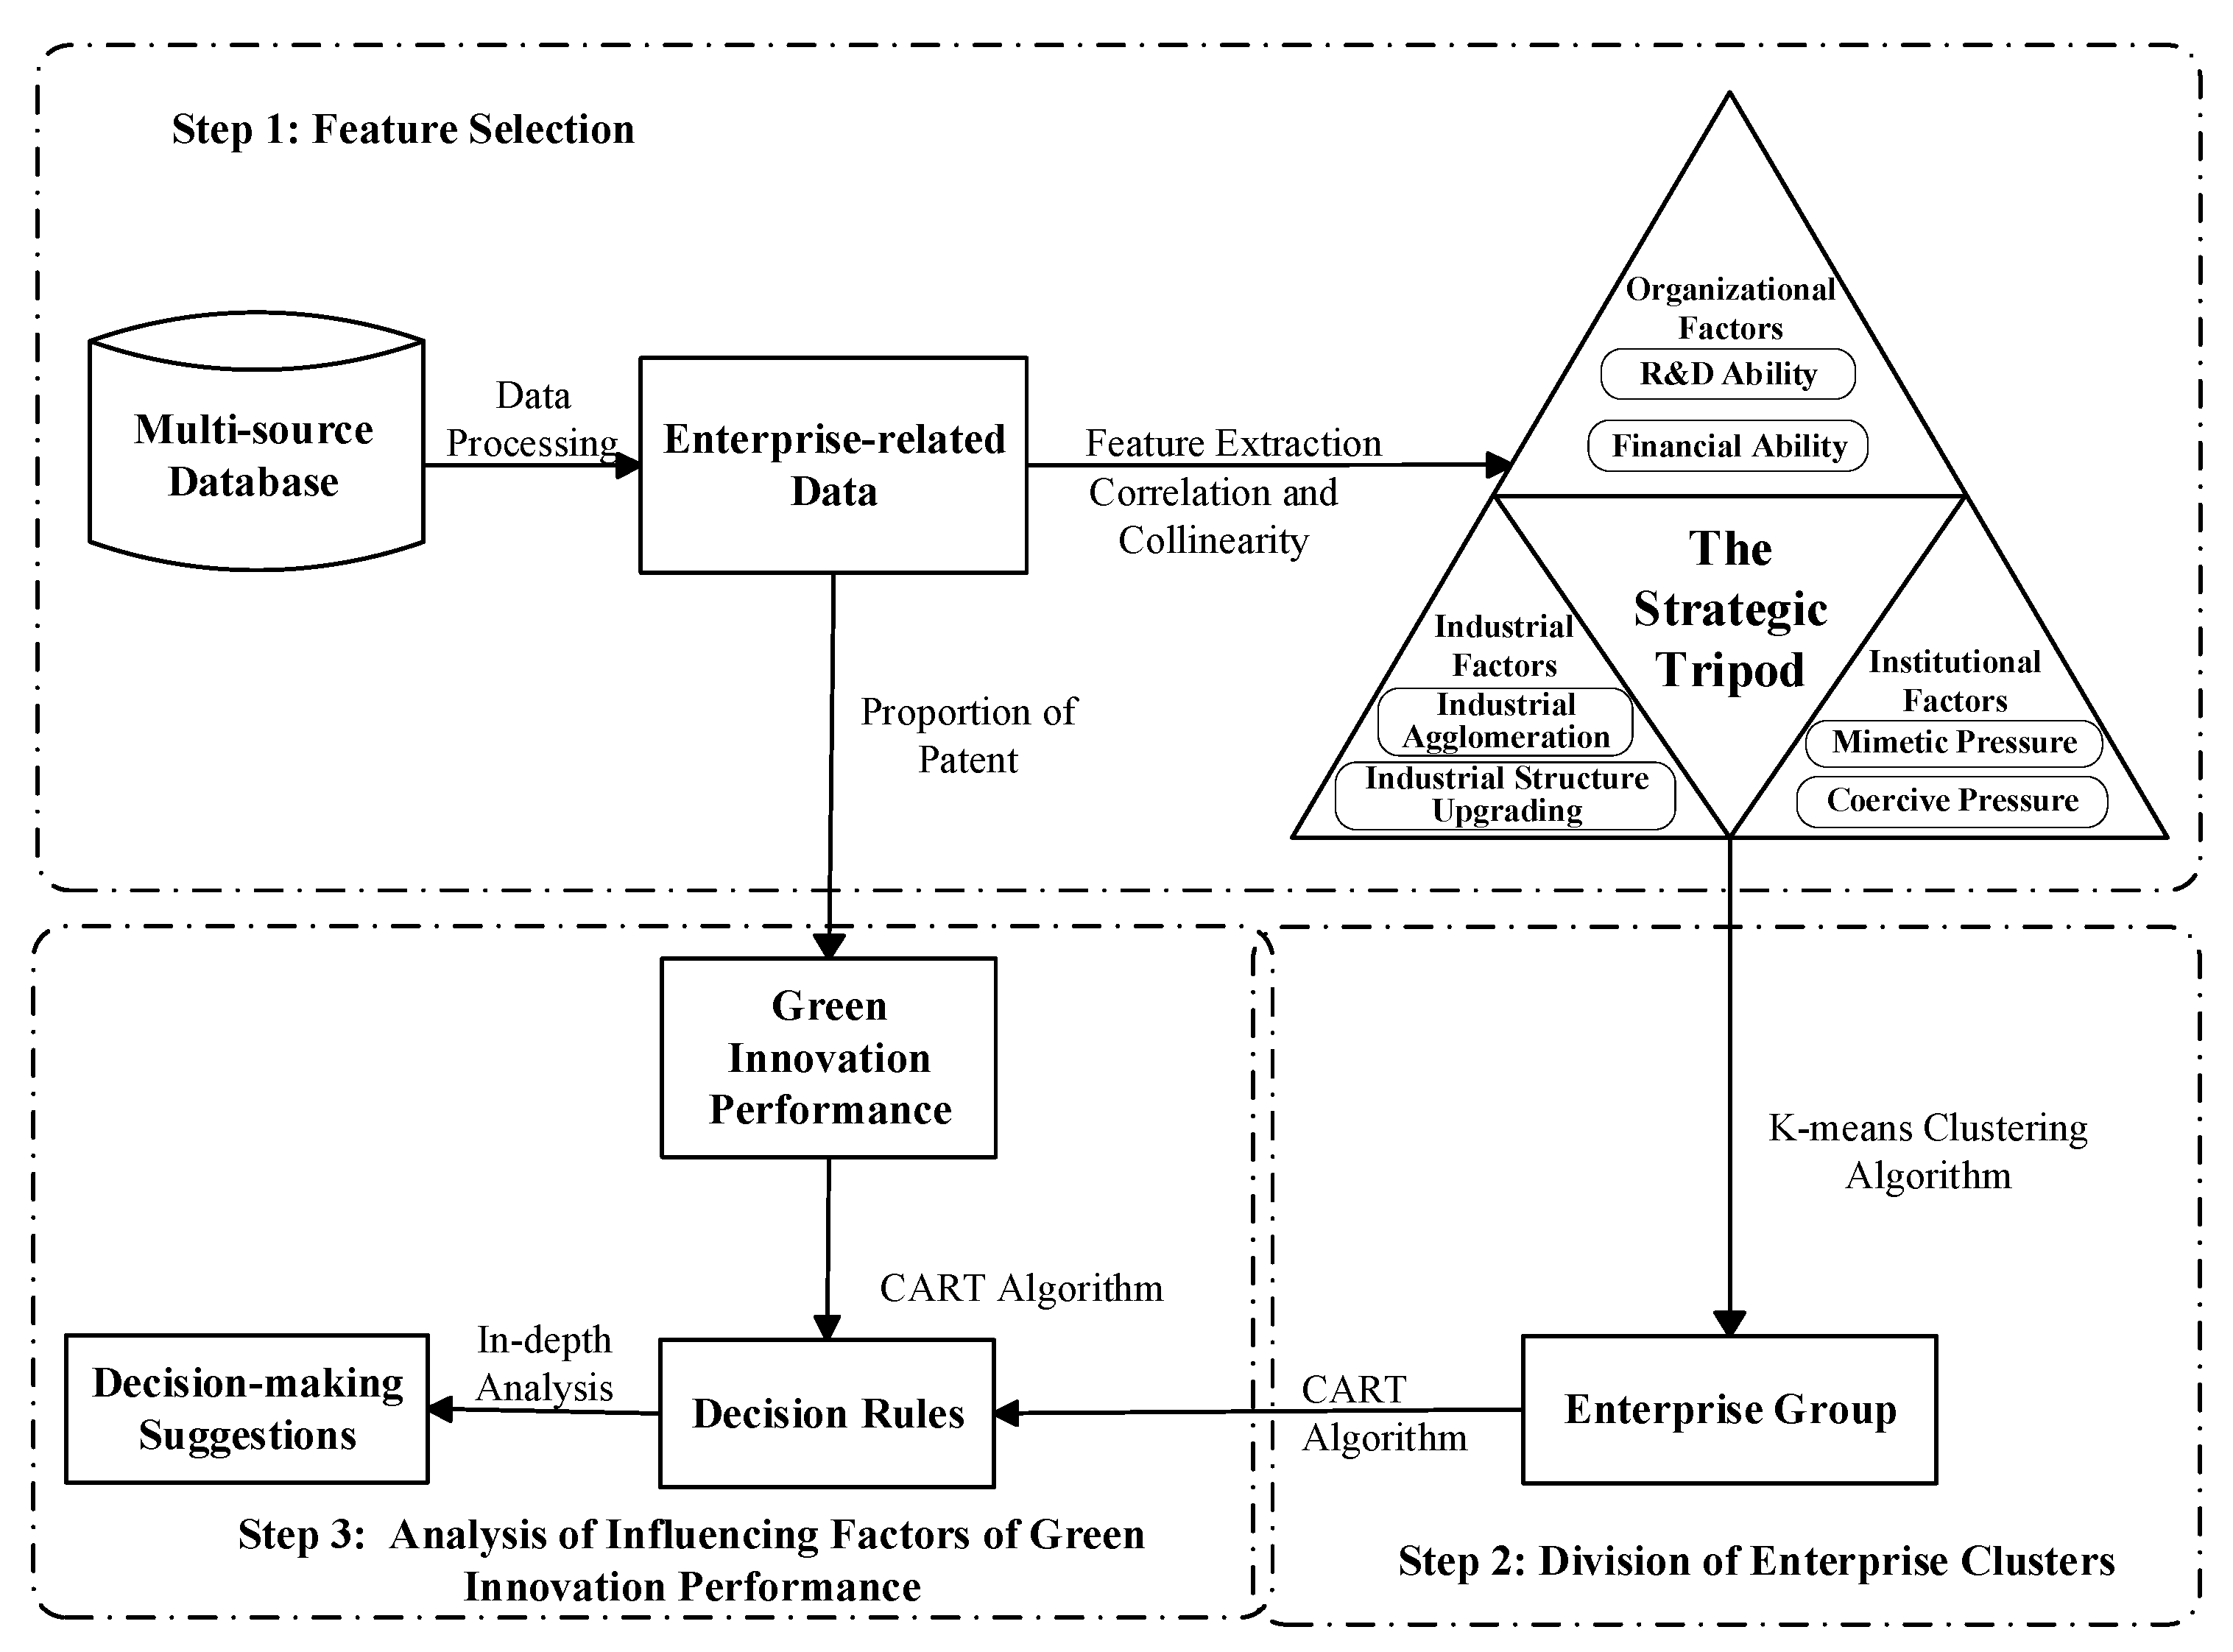
Figure 1. Research framework.
Systems 13 00736 g001
Figure 2. Results of Pearson correlation analysis between variables.
Systems 13 00736 g002
Figure 3. Number of enterprise clusters.
Systems 13 00736 g003
Figure 4. Plots of Silhouette coefficient and Calinski-Harabasz index. (a) Silhouette coefficient (b) Calinski-Harabasz index.
Systems 13 00736 g004
Figure 5. Dynamic evolution of GIP.
Systems 13 00736 g005
Figure 6. Decision tree for “industry-driven” enterprise cluster.
Systems 13 00736 g006
Figure 7. Decision tree for “capability-driven” enterprise cluster.
Systems 13 00736 g007
Figure 8. Decision tree for “challenge-oriented” enterprise cluster.
Systems 13 00736 g008
Table 1. Financial indicators.
Primary-Level IndicatorSecondary-Level IndicatorCalculation Formula
Debt-paying abilityCurrent ratioCurrent assets/current liabilities
Quick ratio(Current assets—inventory)/current liabilities
Equity-to-liability ratioOwner’s equity/liabilities
ProfitabilityReturn on assets(Gross profit + finance expenses)/[(closing balance of total assets + opening balance of total assets)/2]
Net profit margin on total assetsNet profit/[(closing balance of total assets + opening balance of total assets)/2]
Net operating marginNet profit/operating income
Earnings per shareNet profit/total shares
Operating abilityTotal asset turnoverOperating income/[(total assets closing balance + total assets opening balance)/2]
Turnover of current assetsOperating income/[(closing balance of current assets + beginning balance of current assets)/2]
Development abilityGrowth rate of total assets(Total assets at the end of the current period—total assets at the end of the previous period)/total assets at the end of the previous period
Growth rate of operating profit(Operating profit for the current period-operating profit for the previous period)/operating profit for the previous period
Table 2. Information about variables.
Variable TypeLayersVariable NamesVariable
Abbreviations
Measurement
Result variable Green innovation performanceGIPNumber of green innovation patent applications as a percentage of total innovation patent applications
Conditional variableOrganizationR&D abilityRDAAmount of R&D investment
Financial abilityFAComprehensive evaluation index system of financial ability
IndustryIndustrial agglomerationIAThe ratio of manufacturing population to employment in each region
Industrial structure upgradingISUThe ratio of output value of high-end technology industries to that of mid-range technology industries
InstitutionCoercive pressureCPPollution control cost per thousand CNY of industrial output value
Normative pressureNPTotal company news coverage for the year
Mimetic pressureMPIndustry averages for environmental disclosures
Table 3. Characteristic information of manufacturing enterprises by type.
ClusterNumberCharacteristic VariableGIP (%)
MPCPRDAFAIAISU
Industry-driven4490.3570.2260.4830.4690.7120.862H: 40.8
L: 59.2
Capability-driven4870.7710.6130.7240.7950.3360.438H: 45.4
L: 54.6
Challenge-oriented4720.3380.6450.4170.2330.2370.321H: 44.3
L: 55.7
Table 4. Decision rules for GIP of manufacturing enterprises.
ClusterRDAFAIAISUCPMPSup
(%)
Con
(%)
GIP
Industry-
driven
≤0.767----≤0.85665.957.4L
≤0.767----(0.856, 0.972]6.780.0H
≤0.767---->0.9723.852.9L
>0.767≤0.201----4.257.9L
>0.767>0.201-- ≤0.99719.281.4L
>0.767>0.201--->0.9970.2100H
Capability-
driven
≤0.146----≤0.4230.2100L
≤0.146----(0.423, 0.521]1.080H
≤0.146---->0.5212.7100H
>0.146--≤0.395--46.650.2H
>0.146--(0.395, 1.0]--43.765.7L
>0.146-->1.0--5.760.7H
Challenge-
oriented
≤0.098-----5.580.8H
(0.098, 0.111]-----2.876.9L
(0.111, 0.291]-----33.755.3H
>0.291--≤0.718--53.867.7L
>0.291-->0.718--4.275.0H
Disclaimer/Publisher’s Note: The statements, opinions and data contained in all publications are solely those of the individual author(s) and contributor(s) and not of MDPI and/or the editor(s). MDPI and/or the editor(s) disclaim responsibility for any injury to people or property resulting from any ideas, methods, instructions or products referred to in the content.