Article

Study on the Technological Innovation Supply–Demand Matching Mechanism for Major Railway Projects Based on a Tripartite Evolutionary Game

1
School of Economics and Management, Beijing Jiaotong University, Beijing 100044, China
2
Law School, Hebei University, Baoding 071002, China
*
Author to whom correspondence should be addressed.
Systems 2025, 13(6), 434; https://doi.org/10.3390/systems13060434
Submission received: 21 April 2025 / Revised: 22 May 2025 / Accepted: 29 May 2025 / Published: 3 June 2025
(This article belongs to the Special Issue Research and Practices in Technological Innovation Management Systems)

Abstract

:
Current technological innovation in mega projects faces the problem of mismatch between supply and demand, where technology demand-side entities struggle to translate engineering problems into precise scientific research language, while technology supply-side entities fail to capture authentic scenario parameters from engineering sites. This study employs an evolutionary game model to thoroughly investigate behavioral interaction processes among governance entities, demand-side entities, and intermediary collaborative innovation platforms during technological innovation supply–demand matching. By constructing and deriving a tripartite evolutionary game model, this research analyzes the impacts of initial states, the matching effort coefficient, the innovation risk coefficient, and other factors on the evolution of scientific technological innovation supply–demand matching. Additionally, this study simulates the dynamic evolutionary processes of strategic selection. The findings reveal that the initial states of the three parties do not influence behavioral evolution. Furthermore, the subsidy coefficient, additional benefits, and risk coefficient emerge as the most significant parameters affecting tripartite strategy selection. The research outcomes and managerial implications provide crucial reference value for enhancing the alignment between scientific research supply and demand in mega projects, thereby promoting the transformation of scientific and technological achievements in major railway engineering projects.

1. Introduction

Major railway projects have become core vehicles in national infrastructure development, demonstrating deep integration between technological innovation and national mega projects through overcoming construction complexities and uncertainties via technical breakthroughs [1,2]. Represented by “super projects”, such as the Qinghai–Tibet Railway and Beijing–Shanghai High-Speed Rail, China’s groundbreaking achievements in plateau permafrost engineering and long-span deep-water bridge construction not only represent the institutional advantage of “concentrating resources for major undertakings” but also reveal the inherent logic of technology-driven high-quality development in mega projects. The national science and technology management plan explicitly proposes “accelerating the construction of a technologically powerful nation” and “implementing major technical equipment research initiatives”, positioning mega projects as critical battlefields for achieving high-level technological self-reliance.
According to the 2024 patent survey report from the China National Intellectual Property Administration, enterprises’ dominant position in industry–university–research collaboration has significantly strengthened, with cooperation ratios in strategic emerging industries far exceeding average levels, reflecting the effectiveness of the “enterprise-driven research paradigm”. However, the railway engineering sector still faces prominent mismatches between research supply and demand [3]: from the demand side, construction contractors constrained by ambiguous functional boundaries, pronounced risk aversion tendencies, rigid resource allocation mechanisms, underdeveloped innovation cultures, and interdisciplinary collaboration barriers exhibit marginalized perceptions of their role as core innovation entities [4]. This principal–agent vacuum directly impedes the effective transmission of practice-driven innovation demands, preventing technically significant challenges from transforming into systematic research propositions [5]. On the supply side, research institutes and universities confront functional alignment challenges within the innovation ecosystem: the former suffer from misaligned R&D directions due to inefficient technology transfer mechanisms [6,7], while the latter demonstrate inadequate applied research depth and weak interdisciplinary engineering capabilities stemming from distorted evaluation systems [8]. These institutional barriers on both the supply and demand sides hinder the effective operation of the “problem-oriented” innovation model unique to mega-railway projects, resulting in disconnected trajectories between technological development and engineering practice [9].
To address this predicament, this paper establishes a supply–demand matching system for technological innovation in major railway engineering projects, primarily involving railway industry governance entities, technological innovation demand-side entities, and collaborative innovation platforms. Building upon mega project innovation scenarios, this study further delineates the dynamic processes of decision-making behaviors among key stakeholders through evolutionary game theory. Specifically, this research aims to answer the following questions: (1) Which factors influence the motivation of these key stakeholders, and what are the nature of their impacts? (2) How do these innovation entities interact with and influence each other? (3) How can we enhance the alignment between scientific research supply and demand in major railway engineering projects?
This research makes three primary contributions: (1) Diverging from existing static matching decision models in supply–demand research, this research focuses on dynamic interactions among core stakeholders by constructing and solving a tripartite evolutionary game model involving governance entities, demand-side entities, and platform intermediaries. (2) Through analyzing three critical phases of research alignment evolution, this research achieves the dynamic simulation of strategic choices across stages, clarifying that the matching mechanism essentially evolves from rigid matching through transient matching to steady-state matching under tripartite gaming. (3) Building on this framework, this research proposes optimal parameter-based enhancement strategies for research alignment. This research extends evolutionary game applications in mega-railway project management and technological innovation.

2. Literature Review

2.1. Research on Technological Innovation in Major Infrastructure Projects

In recent years, we have witnessed a paradigm shift in technological innovation studies on major infrastructure projects, transitioning from singular technical perspectives to multidimensional systemic analyses [10,11,12]. Scholars broadly emphasize synergistic mechanisms between social responsibility and innovation capabilities, revealing that project entities can significantly enhance stakeholders’ acceptance of technological transformations through fulfilling social responsibilities such as environmental governance and community engagement [13]. This synergistic effect proves particularly pronounced in exploratory innovation contexts—for instance, breakthrough technological applications in cross-regional projects often necessitate deep integration with local cultural values [14].
Notably, a dynamic alignment exists between innovation typology selection and project phases: early conceptual design stages predominantly rely on breakthrough innovations, whereas construction phases emphasize the incremental optimization of existing technologies [15]. The structural characteristics of stakeholder networks profoundly influence innovation efficacy [16]. Research indicates that while highly centralized organizational architectures facilitate rapid decision-making, they may suppress grassroots innovation vitality [12]. The Hong Kong–Zhuhai–Macao Bridge project demonstrates that establishing cross-hierarchical collaborative innovation platforms effectively balances centralized control and decentralized innovation [17], achieving the continuous iteration of core technologies through specialized technical committees and open patent pools [18].
Furthermore, the quality of knowledge-sharing mechanisms directly determines innovation commercialization efficiency [19]. Insufficient tacit knowledge transfer may engender technological discontinuities [20], underscoring the necessity to develop hybrid knowledge management systems integrating digital platforms with offline workshops [21]. The institutional environment’s role in shaping innovation ecosystems has gained prominence. Comparative studies reveal flexible regulatory frameworks more readily foster disruptive innovations, whereas rigid institutional systems—while ensuring execution efficiency—may impede technological breakthroughs [22].
The open innovation agreement model in European high-speed rail projects substantiates that establishing shared intellectual property risk mechanisms significantly enhances transnational technological collaboration [23]. In developing country contexts, government-led innovation incentive policies must complement market mechanisms [24], as excessive administrative intervention risks distorting corporate innovation incentives [25].

2.2. Research on Supply–Demand Matching

Matching theory originated from the Gale–Shapley stable matching model, whose core contribution lies in proving that the core matching set constitutes a lattice structure [26]. As decision environments have become increasingly complex, scholars have successively proposed intuitionistic fuzzy bilateral matching models [27], cloud manufacturing dynamic matching frameworks [28], and intelligent matching architectures based on environmental design theory [29]. Through the interdisciplinary integration of fuzzy mathematics, swarm intelligence, and natural language processing technologies, these advancements have effectively addressed core challenges, including criterion ambiguity and dynamic interdependencies. These breakthroughs collectively drive a paradigm shift in matching theory from static deterministic analysis to dynamic uncertain decision-making.
To address behavioral heterogeneity among supply–demand agents, academia has developed multidimensional decision frameworks. Zhang et al.’s self-confidence fuzzy preference model enhances knowledge matching accuracy through cognitive bias correction mechanisms [30], while Cai et al.’s probabilistic linguistic dynamic network achieves breakthroughs in trust propagation modeling within virtual power plant scenarios [31]. Notably, Liu et al.’s pioneering research incorporates carbon pricing mechanisms and investment risks into green technology matching games, revealing the dual regulatory effects of environmental regulation and market risks through Monte Carlo simulations [32]. These innovative methodologies significantly improve model robustness and interpretability in complex environments by introducing probabilistic linguistics and social network analysis tools.
The integration of evolutionary game theory has opened new dimensions for matching mechanism research. Jia’s investigation of Nash bargaining solutions [33] and Pan’s economic analysis of matching timing [34] unveil evolutionary patterns in matching processes from micro-behavioral perspectives. Aouad et al.’s preference-aware equilibrium algorithm achieves breakthrough progress in dynamic matching efficiency, where the proposed competitive ratio validates the evolutionary algorithm’s superiority in real-time decision-making [35].
In engineering practice, multi-attribute decision models demonstrate substantial application value. Yin et al.’s intuitionistic fuzzy group decision-making model successfully resolves standardization interoperability challenges in green building technology transfer [36], while Jiang et al.’s lifecycle assessment system provides environmentally friendly matching solutions for complex product systems [37]. Particularly in railway engineering, Liang et al.’s hesitant fuzzy bidirectional matching model achieves effective public–private interest coordination in PPP project practice through constructing a social benefit–cost efficiency Pareto frontier [38]. These practical cases verify the feasibility of theoretical models in addressing complex matching problems in mega projects, offering methodological references for research on railway R&D supply–demand matching mechanisms.

3. Materials and Methods

3.1. Connotations of Technological Innovation Supply–Demand Matching Mechanisms

In mega-railway projects, the effective alignment between on-site technological demands, research needs, and the output of academic institutions constitutes a critical enabler for project advancement [39,40]. However, this matching process confronts multifaceted challenges, including tensions between the rigid standardization of engineering operations and the inherent uncertainty of technological innovation [40], coupled with knowledge gradients and divergent risk preferences between construction entities and research institutions [41,42,43]. These factors collectively contribute to suboptimal research alignment efficacy.
The existing literature predominantly focuses on static matching decision models while neglecting dynamic evolutionary interactions among stakeholders [44,45]. The complexity and dynamism of technological innovation supply–demand matching behaviors in mega projects stem from their multistakeholder nature, pronounced interest conflicts, and evolving construction environments [14]. At its essence, this mechanism represents a cross-organizational knowledge reconstruction and value co-creation process [46,47], involving epistemic coupling between engineering practice and scientific innovation [48]. Its key functions include (1) codifying tacit experiential knowledge into storable, operational engineering protocols; (2) abstracting universal principles from case-specific technical challenges; and (3) deriving fundamental scientific questions from empirical engineering scenarios. The core mechanism lies in developing translational frameworks that convert discipline-specific terminologies into mutually intelligible languages [49], thereby enabling precise bidirectional knowledge flow between research outputs and engineering applications to form closed-loop innovation cycles [50]. Consequently, the systematic analysis and computational simulation of these alignment processes prove indispensable for the mechanistic exploration of operational dynamics, the formulation of evidence-based matching strategies, and the enhancement of research–practice integration efficacy.

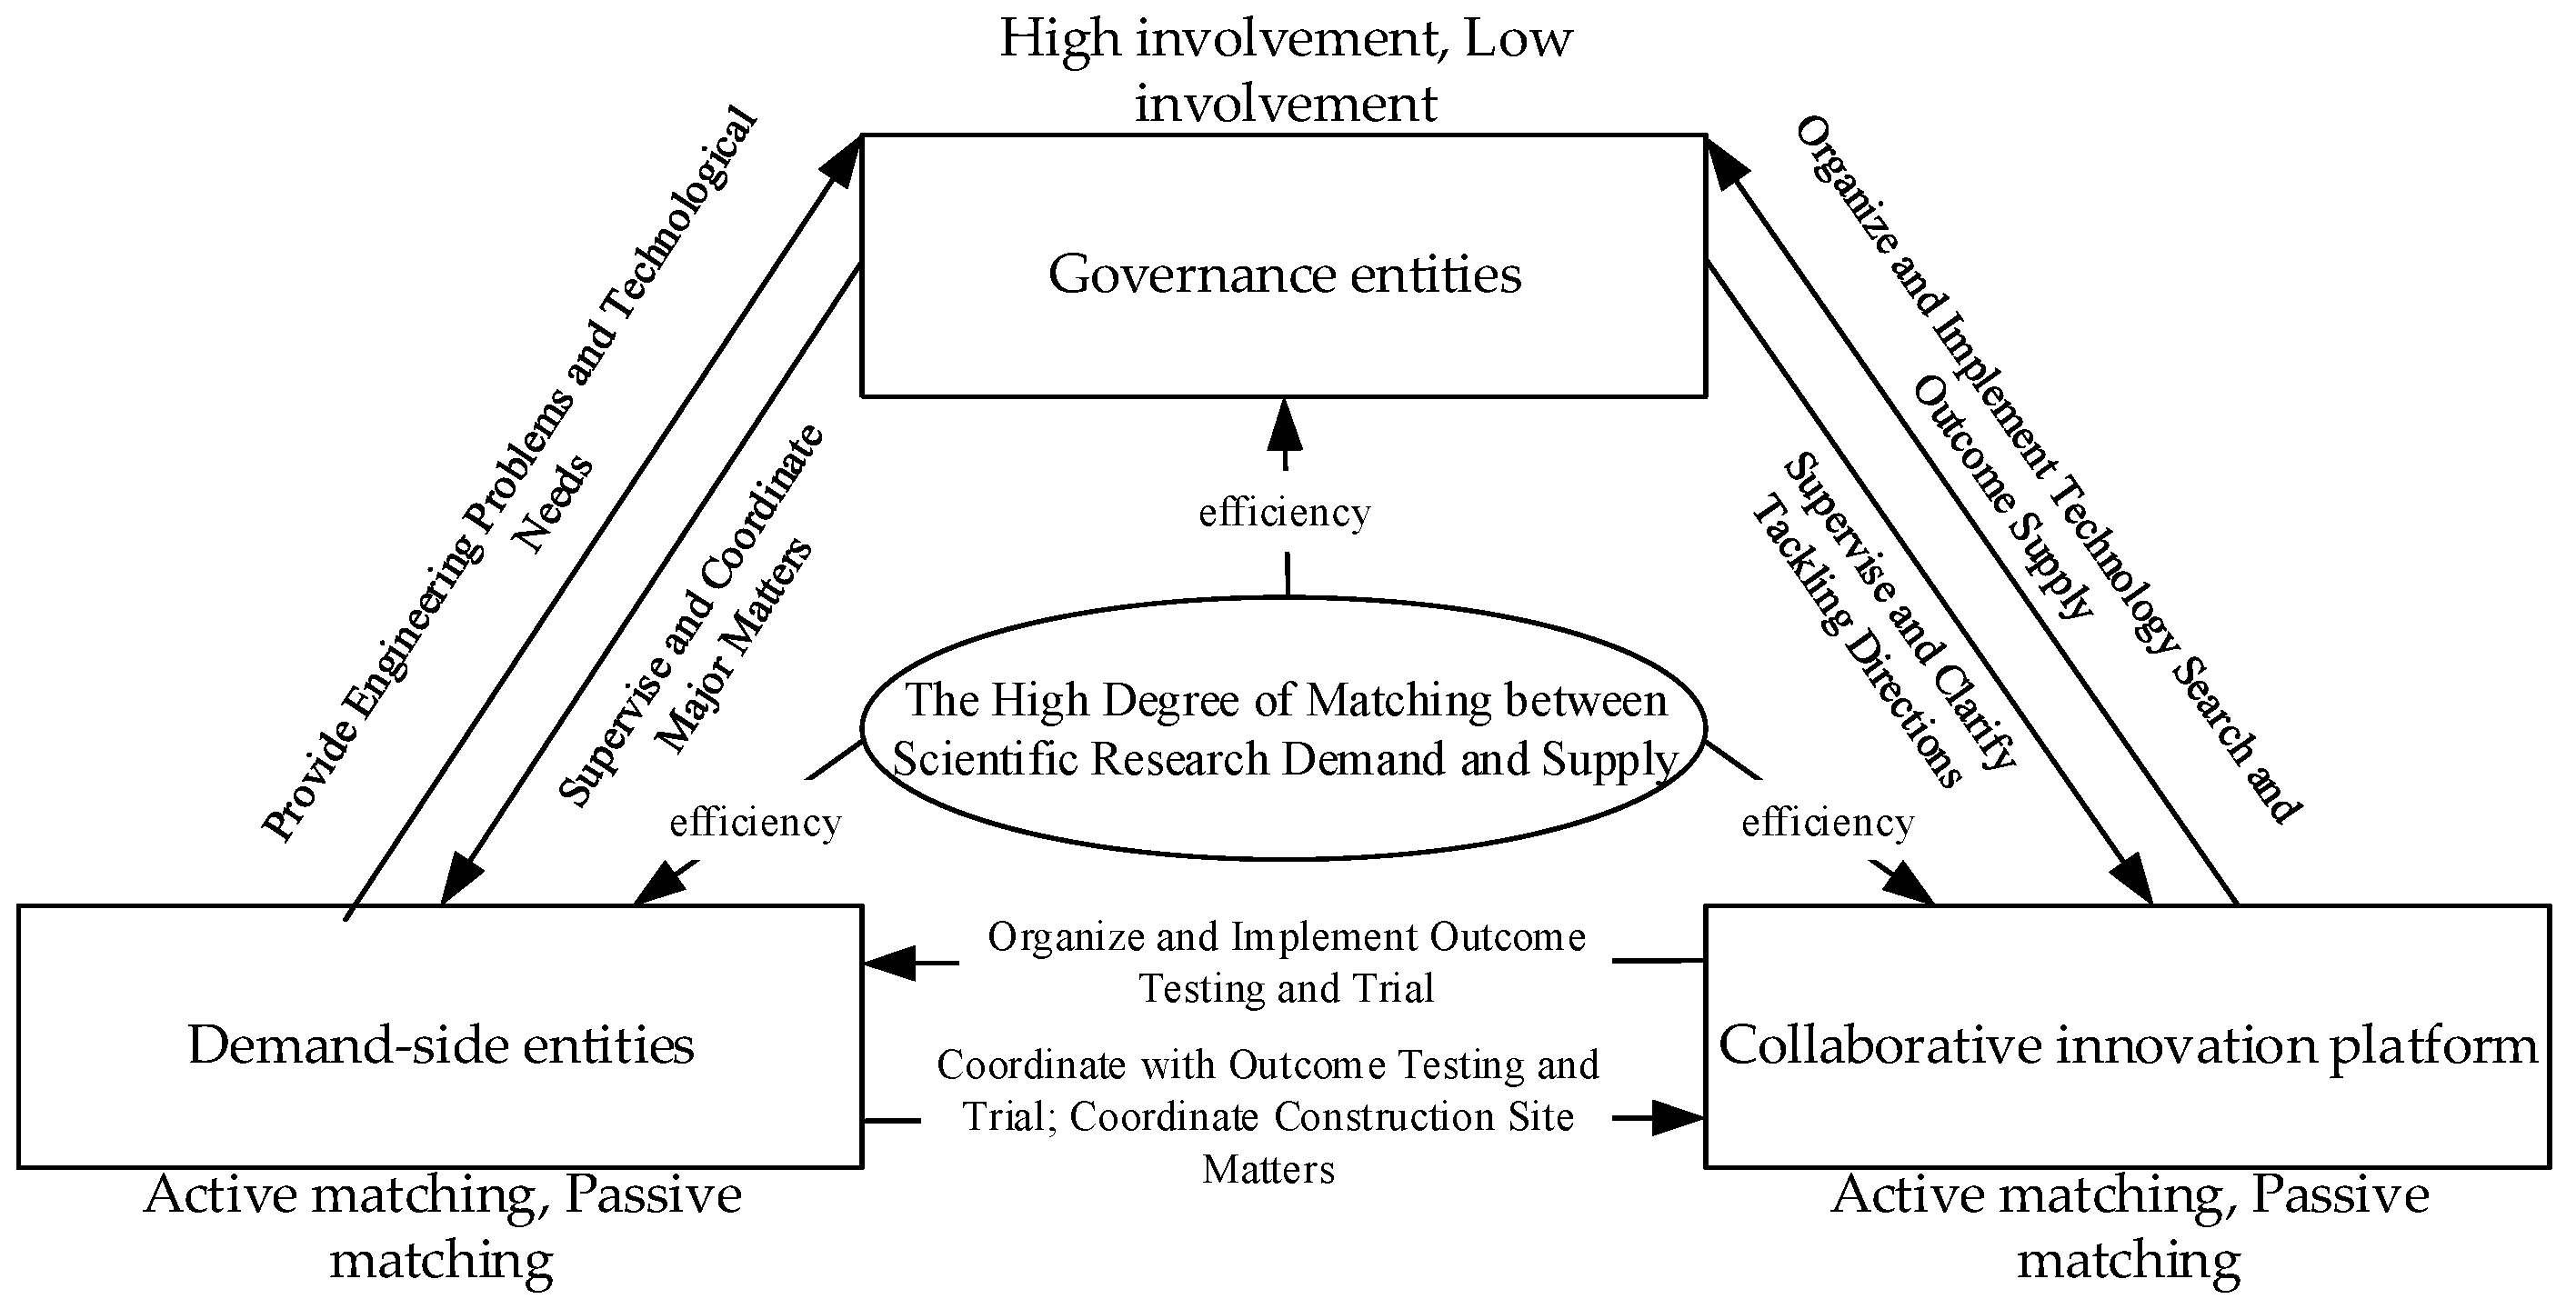
3.2. Key Stakeholders and Behavioral Analysis in Technological Innovation Supply–Demand Matching Mechanisms

Within the technological innovation supply–demand matching mechanism of mega-railway projects, governance entities, demand-side entities, and collaborative innovation platforms form the tripartite core stakeholders [51]. This structural logic originates from their differentiated functional roles and dynamic equilibrium, sustained through continuous interactions.
As industry leaders and resource coordinators in railway construction projects, governance entities execute top-down regulatory functions through strategic planning and institutional design, resulting in technical standard formulation, R&D budget allocation, and performance target setting [18]. Their essential role addresses positive externalities and market failures in research activities, ensuring alignment between railway engineering development, technological innovation trajectories, and national strategic priorities [52]. When prioritizing plateau railway construction technologies, governance entities not only channel financial and human capital toward this domain but also enforce technological diffusion through administrative authority to dismantle industrial barriers. This centralized governance model prevents redundant R&D expenditures while reducing the marginal costs of technology transfer through economies of scale.
Primarily serving governance entities, these platforms constitute innovation consortia comprising diversified heterogeneous resources—including research institutes, universities, equipment suppliers, and material enterprises (existing as virtual networks or physical entities) [12]. Functioning as third-party intermediaries, their fundamental role bridges the “valley of death” between knowledge production and engineering applications [53,54]. The platforms’ core value lies in matching fragmented technological supplies (e.g., academic basic research, corporate product development) with complex engineering demands through heterogeneous professional capabilities. This process not only compensates for demand-side innovation capacity limitations but also accelerates technology commercialization efficiency.
Centered around mega-railway project companies, demand-side stakeholders encompass on-site design, construction, and supervision entities. Representing frontline engineering practitioners, they serve as problem identifiers, technology demand generators, and innovation adoption facilitators. The specific technical challenges identified during construction practices constitute important drivers for research initiatives [55]. Distinct from conventional market demands, railway technological requirements exhibit strong context dependency, high customization, and long-cycle characteristics, necessitating transformation into actionable research propositions through demand-side experiential knowledge and data accumulation.
As illustrated in Figure 1, governance entities’ institutional constraints define operational boundaries for supply–demand matching activities and demand-side entities’ field feedback provides dynamic calibration benchmarks, while collaborative innovation platforms enhance process efficiency through technology scouting and commercialization services. This architecture preserves administrative authority over strategic technological directions while activating grassroots innovation vitality through frontline demands, ultimately forming an evolutionary framework characterized by “top-level guidance and supervision, field practice and verification, and platform-enabled empowerment”.

3.3. Tripartite Game Model Construction for Technological Innovation Supply–Demand Matching Mechanisms

3.3.1. Basic Assumptions and Parameter Settings of Evolutionary Game

The preceding section delineates complex interactions among key stakeholders in integrating engineering construction into technological innovation through technological innovation supply–demand matching. To quantitatively investigate this process, this research constructs an analytical framework using evolutionary game theory. Grounded in bounded rationality assumptions, evolutionary game theory establishes a controlled hypothetical environment for comprehensive analysis, enabling conclusions to closely align with real-world scenarios and enhancing research validity. To ensure theoretical coherence and model robustness, semi-structured interviews were conducted with experts and professors in mega-railway projects, from which the following assumptions were derived (Table 1).
Assumption 1: In technological innovation supply–demand matching for integrating railway mega projects with technological innovation, governance entities primarily act as supervisors and behavioral correctors. They implement incentive–penalty mechanisms to ensure demand-side entities and collaborative innovation platforms align their matching behaviors with optimal industry resource allocation. Demand-side entities hold dual roles as “demand initiators” and “risk bearers”: their technical demands originate from immediate construction challenges while facing a “double lock-in” effect in innovation investment. New technology trials may induce construction delays, whereas technological conservatism risks long-term accountability pressures from quality defects and administrative requirements. Collaborative innovation platforms functionally reconstruct “trust chains” and “value networks” in technology transfer, bridging matching gaps between demand-side pragmatism and external heterogeneous knowledge through institutionalized intermediation.
Assumption 2: In mega-railway projects, governance entities’ strategic options include a high-involvement strategy and low involvement strategy. Demand-side entities and collaborative innovation platforms adopt either active or passive matching strategies. Active matching entails proactive technology/resource sharing, achieving high alignment that enables successful technological iteration when mutually adopted. Passive matching involves resource retention and potential negative externalities. Thus, governance strategy set = {High involvement, Low involvement}; demand-side/platform strategy set = {Active matching, Passive matching}. Key actors continuously adjust strategies based on individual aspirations and peer behaviors. Let x , y , and z denote the probabilities of governance entities selecting high, platforms selecting active, and demand-side entities selecting active strategies, respectively.
Assumption 3: Matching effort coefficients. Demand-side effort a and platform effort b (baseline = 1) quantify collaborative/sharing frequency in matching processes. Higher coefficients indicate greater engagement.
Assumption 4: Technological innovation benefits. Governance entity gains derive from consolidating industry leadership through technological breakthroughs and advancing national strategic imperatives. Platforms obtain service revenues from enhanced matching efficiency and strengthen industry hub status via technology transfer case accumulation. Demand-side benefits include mitigated engineering challenges, improved project performance, and competitive advantages from technological growth. When both demand-side entities and platforms adopt active strategies, they secure additional benefits, a L and b L , with governance gaining G 3 .
Assumption 5: Innovation risks and costs. Mismatched efforts (single-party active strategy) incur innovation risks and additional costs. Let risk coefficients c 1 (demand-side entities) and c 2 (platforms) quantify these exposures, with corresponding risk costs c 1 U 2   a n d   c 2 P 2 .
Assumption 6: Subsidies and penalties. Under high-involvement strategies, governance provides subsidies proportional to matching efforts ( a R ,   b R ) to incentivize participation. Subsidy intensity increases with effort coefficients. Concurrently, governance entities impose a penalty F on passive actors to deter free-riding behaviors.

3.3.2. Evolutionary Game Payoff Matrix

Based on the behavioral strategies of governance entities, demand-side entities, and collaborative innovation platforms, multiple game combinations and the payoff matrix among the three parties are systematically categorized, as detailed in Table 2 and Table 3.

3.3.3. Replicator Dynamics Equation

Assume that the expected return for the governance entities adopting a high-involvement strategy is denoted as E 1 , whereas the expected return under a low involvement strategy is represented by E 2 . The average return is expected to be d x . The specific formulae are Equations (1)–(3).
E 1 = y z ( G 1 + G 3 G 2 a R b R ) + y ( 1 z ) ( G 1 + F G 2 b R ) + z ( 1 y ) ( G 1 + F G 2 a R ) + ( 1 y ) ( 1 z ) ( G 1 + F + F G 2 G 4 )
E 2 = y z G 3 + y ( 1 z ) + z ( 1 y ) + ( 1 y ) ( 1 z ) ( G 4 )
d x = x ( 1 x ) ( E 1 E 2 ) = x ( x 1 ) ( G 2 G 1 2 F + F y + F z + R a z + R b y )
Let E 3 signify the expected return when the collaborative innovation platform employs a proactive matching strategy and E 4 denote the corresponding value under a passive matching strategy. The expected return at equilibrium is denoted as d y . The specific formulae are Equations (4)–(6).
E 3 = x z ( P 1 + b L + b R P 2 c 2 P 2 ) + x ( 1 z ) ( P 1 + b R P 2 c 2 P 2 ) + z ( 1 x ) ( P 1 + b L P 2 c 2 P 2 ) + ( 1 x ) ( 1 z ) ( P 1 P 2 c 2 P 2 )
E 4 = x z ( P 1 P 2 F ) + x ( 1 z ) ( P 1 P 2 F ) + z ( 1 x ) ( P 1 P 2 ) + ( 1 x ) ( 1 z ) ( P 1 P 2 )
d y = y ( 1 y ) ( E 3 E 4 ) = y y 1 F x c 2 P 2 + L b z + R b x
Let E 5 signify the expected return when the demand-side entities employs a proactive matching strategy and E 6 denote the corresponding value under a passive matching strategy. The expected return at equilibrium is denoted as d z . The specific formulae are Equations (7)–(9).
E 5 = x y ( U 1 + a L + a R U 2 c 1 U 2 ) + x ( 1 y ) ( U 1 + a R U 2 c 1 U 2 ) + y ( 1 x ) ( U 1 + a L U 2 c 1 U 2 ) + ( 1 x ) ( 1 y ) ( U 1 U 2 c 1 U 2 )
E 6 = x y ( U 1 U 2 F ) + x ( 1 y ) ( U 1 U 2 F ) + y ( 1 x ) ( U 1 U 2 ) + ( 1 x ) ( 1 y ) ( U 1 U 2 )
d z = z ( 1 z ) ( E 5 E 6 ) = z ( z 1 ) ( F x c 1 U 2 + L a y + R a x )

4. Results

4.1. The Stability Analysis of Key Entities

4.1.1. Stability Analysis of Governance Entities

The replicator dynamics equations of governance entities are Equations (10) and (11):
F ( x ) = x ( x 1 ) G 2 G 1 2 F + F y + F z + R a z + R b y
( d F ( x ) ) / d x = ( 1 2 x ) G 2 G 1 2 F + F y + F z + R a z + R b y
To streamline the computational process, this research sets the parameter G ( z ) as follows:
G ( z ) = G 2 G 1 2 F + F y + F z + R a z + R b y
Then, the original equation simplifies to
( d F ( x ) ) / d x = ( 1 2 x ) G ( z )
According to the stability theorem of differential equations, the probability that governance entities adopt a high-involvement strategy in a steady state needs to satisfy the condition F ( x ) = 0 ,   d F ( x ) d x < 0 .
From G ( z ) = 0 , it can be obtained that z = z 1 * = G 1 G 2 + 2 F F y R b y F + R a . It can be seen that G ( z ) is a decreasing function with respect to z , as shown in Figure 2. (1) z = z 1 * represents the cross section of the shaded portion of Figure 2a, and G z 1 * = 0 ,   F x = 0 , and d F ( x ) d x = 0 , where all x variables are in a stable state; see Figure 2a. (2) z < z 1 * represents the space V 1 under the cross section of Figure 2b. where the direction of the arrow represents the direction of strategy evolution for that entity. G z 1 * > 0 ,   F ( 1 ) = 0 , and d F ( 0 ) d x < 0 , with x = 1 , represent a stable evolutionary strategy; i.e., the governance entities adopt a low-involvement strategy as the optimal strategy; see Figure 2b. (3) z > z 1 * represents the space V 2 on the cross section of Figure 2c, where the direction of the arrow represents the direction of strategy evolution for that entity. G z 1 * < 0 ,   F ( 0 ) = 0 , and d F ( 0 ) d x < 0 , so x = 0 , which is a stable evolutionary strategy; i.e., the governance entities adopt a high-involvement strategy as the optimal strategy; see Figure 2c.

4.1.2. Stability Analysis of Collaborative Innovation Platforms

The replicator dynamics equations of collaborative innovation platforms are Equations (14) and (15):
F ( y ) = y ( y 1 ) F x c 2 P 2 + L b z + R b x
( d F ( y ) ) / d y = ( 1 2 y ) F x c 2 P 2 + L b z + R b x
To streamline the computational process, this research sets the parameter J ( z ) as follows Equations (16):
J ( z ) = F x c 2 P 2 + L b z + R b x
Then, the original equation simplifies to Equation (17)
( d F ( y ) ) / d y = ( 1 2 x ) J ( z )
According to the stability theorem of differential equations, the probability that collaborative innovation platforms adopt an active matching strategy in a steady state needs to satisfy the condition F ( y ) = 0 , d F ( y ) d y < 0 .
From J ( z ) = 0 , it can be obtained that z = z 2 * = c 2 P 2 F x R b x L b . It can be seen that J ( z ) is a decreasing function with respect to z , as shown in Figure 3. (1) z = z 2 * represents the cross section of the shaded portion of Figure 3a, and J z * = 0 ,   F ( y ) = 0 , d F ( y ) d y = 0 , with all y variables in a stable state; see Figure 3a. (2) z < z 2 * represents the space V 1 under the cross section of Figure 3b, where the direction of the arrow represents the direction of strategy evolution for that entity. J z * > 0 ,   F ( 1 ) = 0 , and d F ( 1 ) d y < 0 , with y = 1 , represent a stable evolutionary strategy; i.e., the collaborative innovation platforms adopt a passive matching strategy as the optimal strategy; see Figure 3b. (3) z > z 2 * represents the space V 2 on the cross section of Figure 3c, where the direction of the arrow represents the direction of strategy evolution for that entity. J z * < 0 ,   F ( 0 ) = 0 , and d F ( 1 ) d y > 0 , so y = 0 , which is a stable evolutionary strategy; i.e., the collaborative innovation platforms adopt an active matching strategy as the optimal strategy; see Figure 3c.

4.1.3. Stability Analysis of Demand-Side Entities

The replicator dynamics equations of demand-side entities are Equations (18) and (19):
F ( z ) = z ( z 1 ) F x c 1 U 2 + L a y + R a x
( d F ( z ) ) / d z = ( 1 2 z ) F x c 1 U 2 + L a y + R a x
To streamline the computational process, this research sets the parameter H ( y ) as follows:
H ( y ) = F x c 1 U 2 + L a y + R a x
Then, the original equation simplifies as follows:
According to the stability theorem of differential equations, the probability that demand-side entities adopt an active matching strategy in a steady state needs to satisfy the condition F z = 0 ,   d F ( z ) d z < 0 .
From H y = 0 , it can be obtained that y = y * = c 1 U 2 F x R a x L a . It can be seen that H ( y ) is a decreasing function with respect to y , as shown in Figure 4. (1) y = y * represents the cross section of the shaded portion of Figure 4a, and H y * = 0 ,   F ( z ) = 0 , and d F ( z ) d z = 0 , with all z variables in a stable state; see Figure 4a. (2) y < y * represents the space V 1 behind the cross section of Figure 4b, where the direction of the arrow represents the direction of strategy evolution for that entity. H y * > 0 ,   F ( 1 ) = 0 , and d F ( 1 ) d z < 0 , with z = 1 , represent a stable evolutionary strategy; i.e., the demand-side entities adopt a passive matching strategy as the optimal strategy; see Figure 4b. (3) y > y * represents the space V 2 in front of the cross section of Figure 4c, where the direction of the arrow represents the direction of strategy evolution for that entity. H y * < 0 ,   F ( 0 ) = 0 , and d F ( 1 ) d z > 0 , so z = 0 , which represents a stable evolutionary strategy; i.e., the demand-side entities adopt an active matching strategy as the optimal strategy; see Figure 4c.

4.2. Stability Analysis of the Technological Innovation Supply–Demand Matching Mechanism

Given that the incompatibility between mixed-strategy equilibria and evolutionarily stable equilibria in asymmetric dynamic game theory has been established in prior research [32], this investigation focuses on a comprehensive examination of pure-strategy equilibrium points within evolutionary game-theoretic systems. Through the rigorous configuration of analytical constraints ( F ( x ) = 0 ,   F ( y ) = 0 ,   F ( z ) = 0 ), we systematically identify eight distinct pure-strategy equilibrium points within this game-theoretic framework, sequentially designated as follows:
E 1 0 , 0 , 0 , E 2 0 , 1 , 0 , E 3 0 , 0 , 1 , E 4 0 , 1 , 1 , E 5 ( 1 , 0 , 0 ) , E 6 ( 1 , 1 , 0 ) , E 7 ( 1 , 0 , 1 ) , E 8 ( 1 , 1 , 1 )
A system has stable strategies when all eigenvalues of the Jacobian matrix exhibit negative real parts. To analyze evolutionarily stable strategies (ESSs), this research computes the Jacobian matrices and eigenvalues for pure-strategy equilibrium points. The Jacobian matrix J of this dynamic system is formulated as Equation (21):
J = F ( x ) / x F ( x ) / y F ( x ) / z F ( y ) / x F ( y ) / y F ( y ) / z F ( z ) / x F ( z ) / y F ( z ) / z = x ( G 2 G 1 2 F + F y + F z + R a z + R b y ) ( x 1 ) ( G 2 G 1 2 F + F y + F z + R a z + R b y ) x ( F + R b ) ( x 1 ) x ( F + R a ) ( x 1 ) y ( F + R b ) ( y 1 ) y ( F x P 2 c 2 + L b z + R b x ) ( y 1 ) ( F x P 2 c 2 + L b z + R b x ) L b y ( y 1 ) z ( F + R a ) ( z 1 ) L a z ( z 1 ) z ( F x U 2 c 1 + L a y + R a x ) ( z 1 ) ( F x U 2 c 1 + L a y + R a x )
A stability analysis of the aforementioned equilibrium points is conducted via Equation (21). By substituting the values of the previously derived local equilibrium points into the Jacobian matrix, this research computationally derives the Jacobian matrices and corresponding eigenvalues for each local equilibrium point (Table 4 and Table 5).
(1) Scenario 1: Stability analysis of E 4 ( 0 , 1 , 1 ) :
When G 1 G 2 < R a + R b P 2 c 2 < L b U 2 c 1 < L a , the system converges to a stable evolutionary strategy, as demonstrated in Figure 5. The parameter configuration adheres to the following specifications: G 1 = 100, G 2 = 50, G 3 = 100, G 4 = 50, U 1 = 150, U 2 = 50, P 1 = 100, P 2 = 50, R = 40, F = 30, L = 100, a = 1, b = 1, c 1 = 0.5, and c 2 = 0.2.
Figure 5 shows that all the curves in the graph converge to (0,1,1), which illustrates the direction of the evolution of the game when the conditions G 1 G 2 < R a + R b , P 2 c 2 < L b , and U 2 c 1 < L a are met. In addition, the different colored curves in the figure represent different initial values of x, y and z. The governance entity adopts a low-intervention strategy, while both the co-innovation platform and the demand-side entity adopt an active matching strategy. Governance entities tend to adopt low-intervention strategies in coordinating supply–demand matching activities between the collaborative innovation platform and demand-side entities when the subsidies allocated based on their mutual matching efforts exceed the net benefit differential ( G 1 G 2 < R a + R b ) for the governance party. This behavioral pattern emerges when both the platform and demand-side entities exhibit high fusion commitment in resource integration efforts. Collaborative innovation platforms and demand-side entities exhibit a predominant preference for proactive supply–demand matching strategies when the technological innovation risk costs incurred by these parties fall below the aggregate economic surplus and reputational dividends generated through the successful alignment of research supply and demand ( P 2 c 2 < L b , U 2 c 1 < L a ).
(2) Scenario 2: Stability analysis of E 6 1 , 1 , 0 :
When G 2 + R b < G 1 + F P 2 c 2 < F + R b F + L a + R a < U 2 c 1 , the system converges to a stable evolutionary strategy, as demonstrated in Figure 6. The parameter configuration adheres to the following specifications: G 1 = 100, G 2 = 50, G 3 = 100, G 4 = 50, U 1 = 250, U 2 = 200, P 1 = 100, P 2 = 50, R = 20, F = 30, L = 100, a = 1, b = 1, c 1 = 0.9, and c 2 = 0.2.
Figure 6 shows that all curves in the graph converge to (1,1,0) when the conditions G 2 + R b < G 1 + F , P 2 c 2 < F + R b , and F + L a + R a < U 2 c 1 are satisfied, which indicates the direction of the evolution of the game. In addition, the different colored curves in the figure represent different initial values of x, y and z. At this point, governance entities adopt high-involvement strategies, collaborative innovation platforms adopt positive matching strategies, and demand side entities adopt negative matching strategies. Governance entities prioritize high-involvement strategies when their baseline returns and penalty revenues exceed participation costs and subsidies allocated to the collaborative innovation platforms ( G 2 + R b < G 1 + F ), indicating the predominance of regulatory incentives over fiscal expenditures. The platform exhibits proactive matching behavior when technological innovation risk costs fall below the differential between governance-imposed fines and subsidies, a condition reflecting the effective alignment of punitive disincentives with fiscal inducements under intensive regulatory oversight. Demand-side entities adopt passive matching strategies when confronting innovation risks surpassing the net value of governmental entities, successful matching premiums, and subsidy differentials, a scenario typifying risk-averse responses to asymmetric technological uncertainty.
(3) Scenario 3: Stability analysis of E 7 ( 1 , 0 , 1 ) :
When G 2 + R b < G 1 + F F + L b + R b < P 2 c 2 U 2 c 1 < F + R a , the system converges to a stable evolutionary strategy, as demonstrated in Figure 7. The parameter configuration adheres to the following specifications: G 1 = 100, G 2 = 50, G 3 = 100, G 4 = 50, U 1 = 150, U 2 = 50, P 1 = 250, P 2 = 200, R = 20, F = 30, L = 100, a = 1, b = 1, c 1 = 0.5, and c 2 = 0.9.
Figure 7 shows that all curves in the graph converge to (1,0,1) when the conditions G 2 + R b < G 1 + F , F + L b + R b < P 2 c 2 , and U 2 c 1 < F + R a are satisfied, which indicates the direction of the evolution of the game. In addition, the different colored curves in the figure represent different initial values of x, y and z. At this point, governance entities adopt high-involvement strategies, collaborative innovation platforms adopt negative matching strategies, and demand entities adopt positive matching strategies. Governance entities prefer to adopt a high-involvement strategy in aligning research supply and demand when their baseline returns and penalty revenues exceed participation costs and subsidies granted to collaborative innovation platforms ( G 2 + R b < G 1 + F ). Collaborative innovation platforms tend to pursue passive matching strategies when technological innovation risk costs outweigh the sum of governance-imposed fines, successful matching premiums, and subsidy differentials ( F + L b + R b < P 2 c 2 ), a scenario reflecting the platforms’ exposure to substantial risks induced by emerging technologies. Conversely, demand-side entities exhibit proactive matching behavior when innovation risk costs fall below the net value of governance penalties and subsidy gaps ( U 2 c 1 < F + R a ), a condition signifying governance entities’ high-involvement intervention in resource allocation alongside substantial subsidy incentives.
(4) Scenario 4: Stability analysis of E 8 ( 1 , 1 , 1 ) :
When G 2 + R a + R b < G 1 P 2 c 2 < F + L b + R b U 2 c 1 < F + L a + R a , the system converges to a stable evolutionary strategy, as demonstrated in Figure 8. The parameter configuration adheres to the following specifications: G 1 = 100, G 2 = 50, G 3 = 100, G 4 = 50, U 1 = 150, U 2 = 50, P 1 = 100, P 2 = 50, R = 20, F = 30, L = 100, a = 1, b = 1, c 1 = 0.5, and c 2 = 0.2.
Figure 8 shows that all curves in the graph converge to (1,1,1) when the conditions G 2 + R a + R b < G 1 , P 2 c 2 < F + L b + R b , and U 2 c 1 < F + L a + R a are satisfied, which indicates the direction of the evolution of the game. In addition, the different colored curves in the figure represent different initial values of x, y and z. At this point, governance entities adopt high-involvement strategies, collaborative innovation platforms adopt positive matching strategies, and demand entities adopt positive matching strategies. (1) Governance entities demonstrate stronger propensity to adopt a high-involvement strategy in coordinating technological innovation supply–demand matching when their baseline returns exceed the aggregate costs comprising participation expenditures and subsidies allocated to both collaborative innovation platforms and demand-side entities ( G 2 + R a + R b < G 1 ). (2) Collaborative innovation platforms and demand-side entities exhibit greater willingness to implement proactive matching strategies when technological innovation risk costs fall below the differential between governance-imposed penalties, subsidies, and the incremental benefits derived from successful technological innovation supply–demand alignment ( P 2 c 2 < F + L b + R b ), a condition reflecting risk–cost optimization under incentive-compatible governance frameworks.
This research conceptualizes the evolution of technological innovation supply–demand matching mechanisms into three phases (Figure 9). (1) The initial phase ( E 6 ,   E 7 ) embodies rigid matching under administrative coercion. At this stage, the technological innovation supply–demand matching mechanism exhibits administration-driven rigid coordination, where collaborative innovation platforms and demand-side entities exhibit pronounced risk-aversion tendencies. Governance entities enforce the alignment between technological demands and supplies in projects through administrative directives and dynamic subsidy instruments, creating path-dependent institutional lock-ins. (2) The developmental phase ( E 4 ) reflects transient matching driven by urgent field demands. Market mechanisms temporarily supersede institutional regulation as on-site engineering urgencies reshape stakeholder behaviors. Escalating the implicit costs of passive matching elevates the relative returns of proactive strategies. Demand-side entities establish incentive-compatible mechanisms through offering credible “profit-concession commitments” to collaborative platforms. Paradoxically, governance entities’ high-involvement interventions during emergent bilateral positive feedback may induce institutional redundancy due to regulatory lags, thereby undermining self-organized efficiency. (3) The mature phase ( E 8 ) achieves stable matching through risk–reward equilibrium. The system attains Pareto-optimal efficiency with perfected institutional safeguards from governance entities’ high-involvement strategies, dramatically reducing collaboration risks. Passive matching now incurs prohibitive opportunity costs: demand-side entities face resource misallocation penalties, while platforms risk user attrition and reputational depreciation. Tripartite proactive strategies generate synergistic value (1+1+1 > 3 effects), sustained through governance entities’ dynamic incentive mechanisms that convert social gains from matching efficiency into economic rewards, establishing a virtuous cycle of high alignment, high returns, and high engagement.
The evolutionary trajectory progresses from rigid to transient and ultimately to stable matching through coordinated efforts. The equilibrium ultimately rests on an implicit rule established through repeated games where long-term compliance benefits dominate short-term defection gains. Risk-sharing protocols, benefit distribution mechanisms, and information transparency collectively render proactive strategies the dominant equilibrium. This stable configuration exhibits disturbance-resistant properties: temporary strategic fluctuations self-correct through accumulated credibility records and experiential learning embedded into the mechanism, ensuring systemic resilience.

5. Discussions

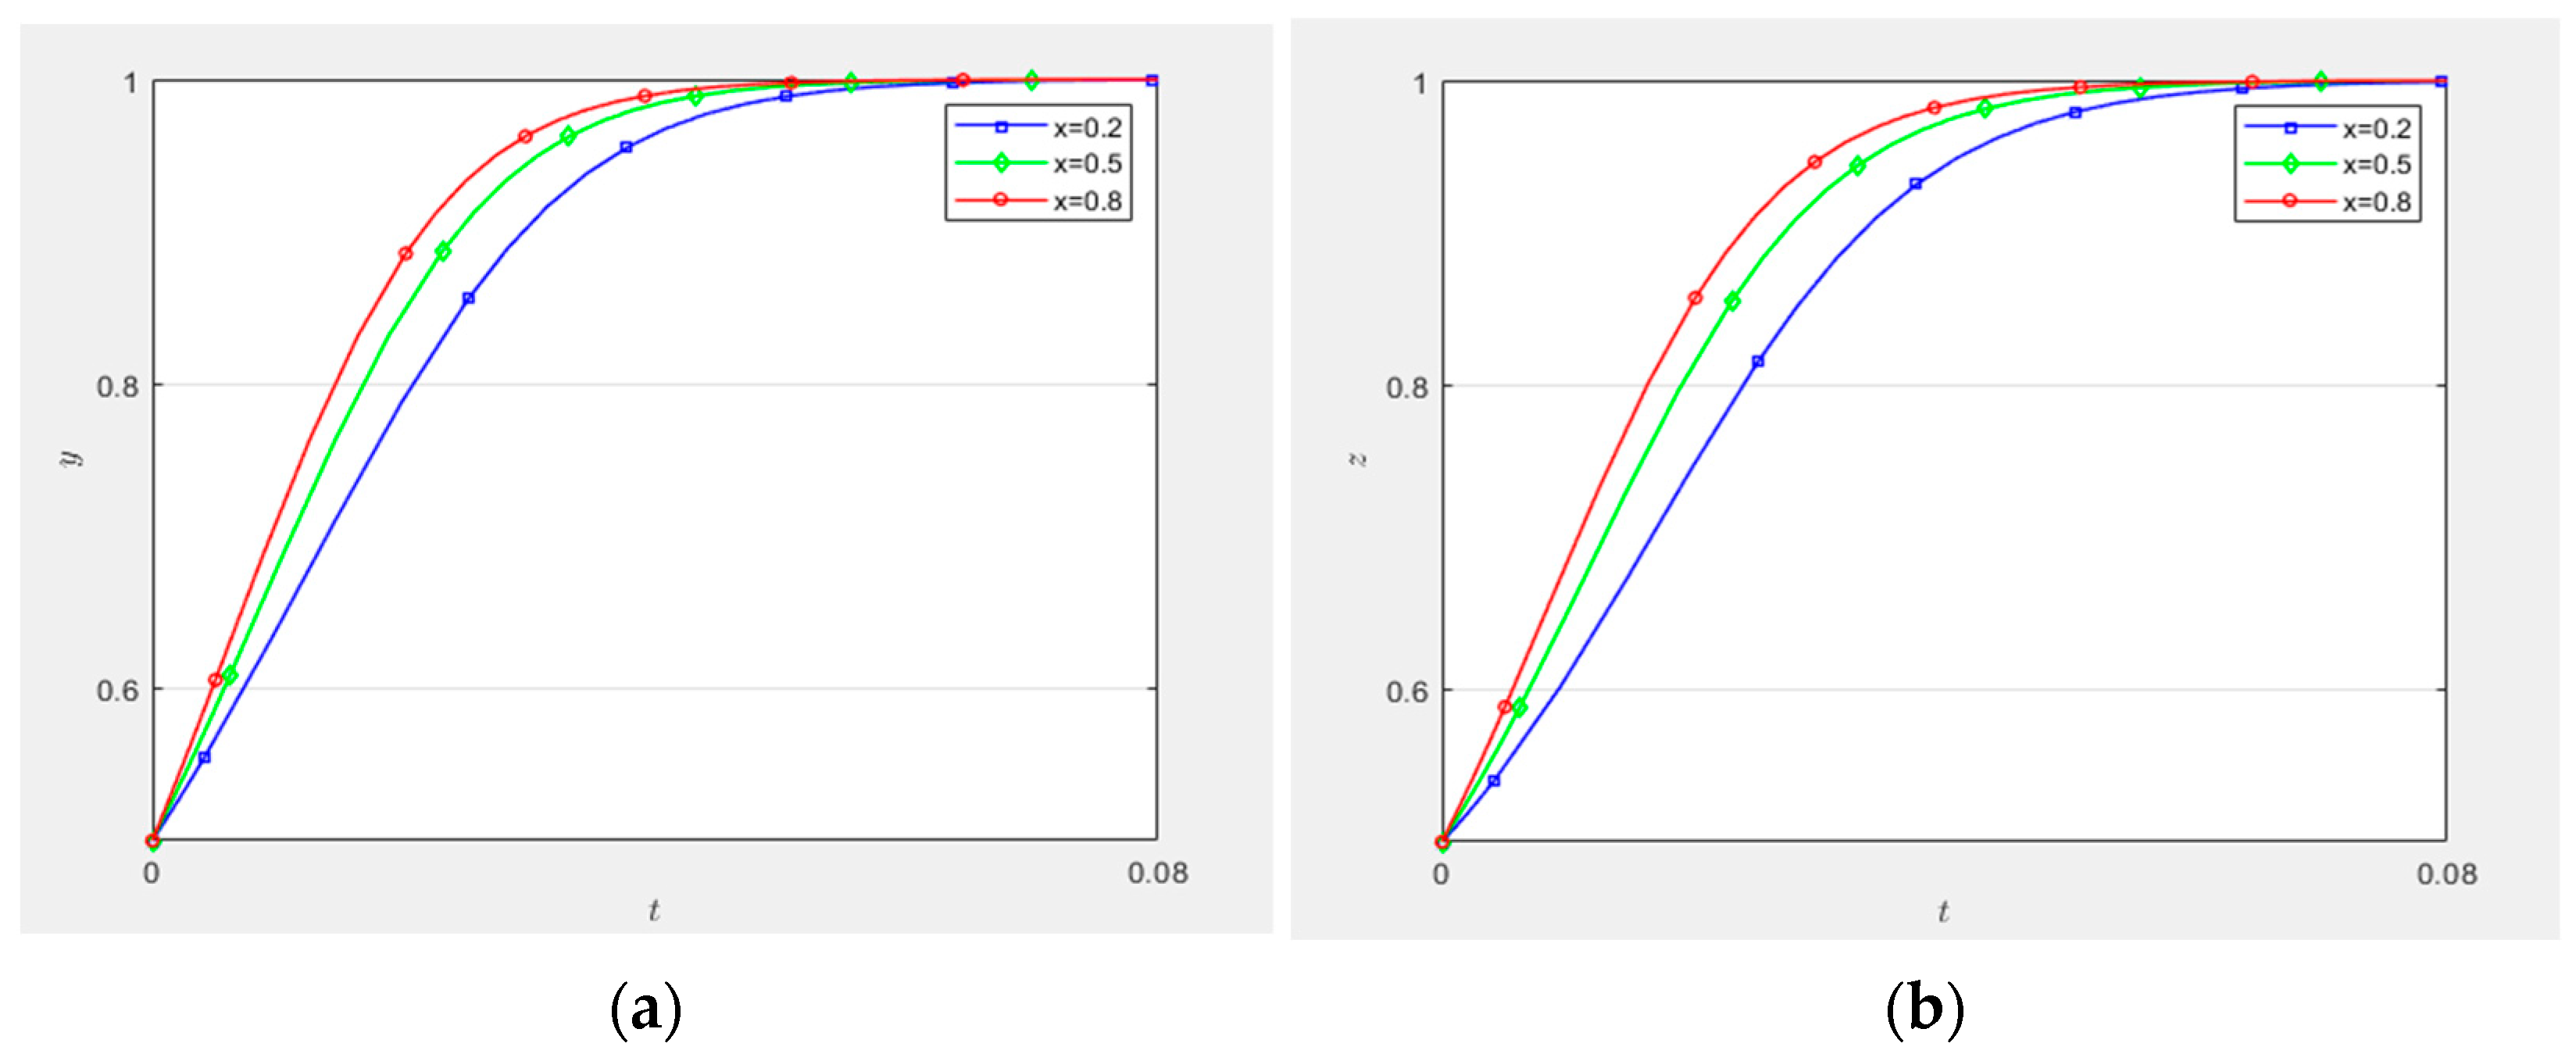
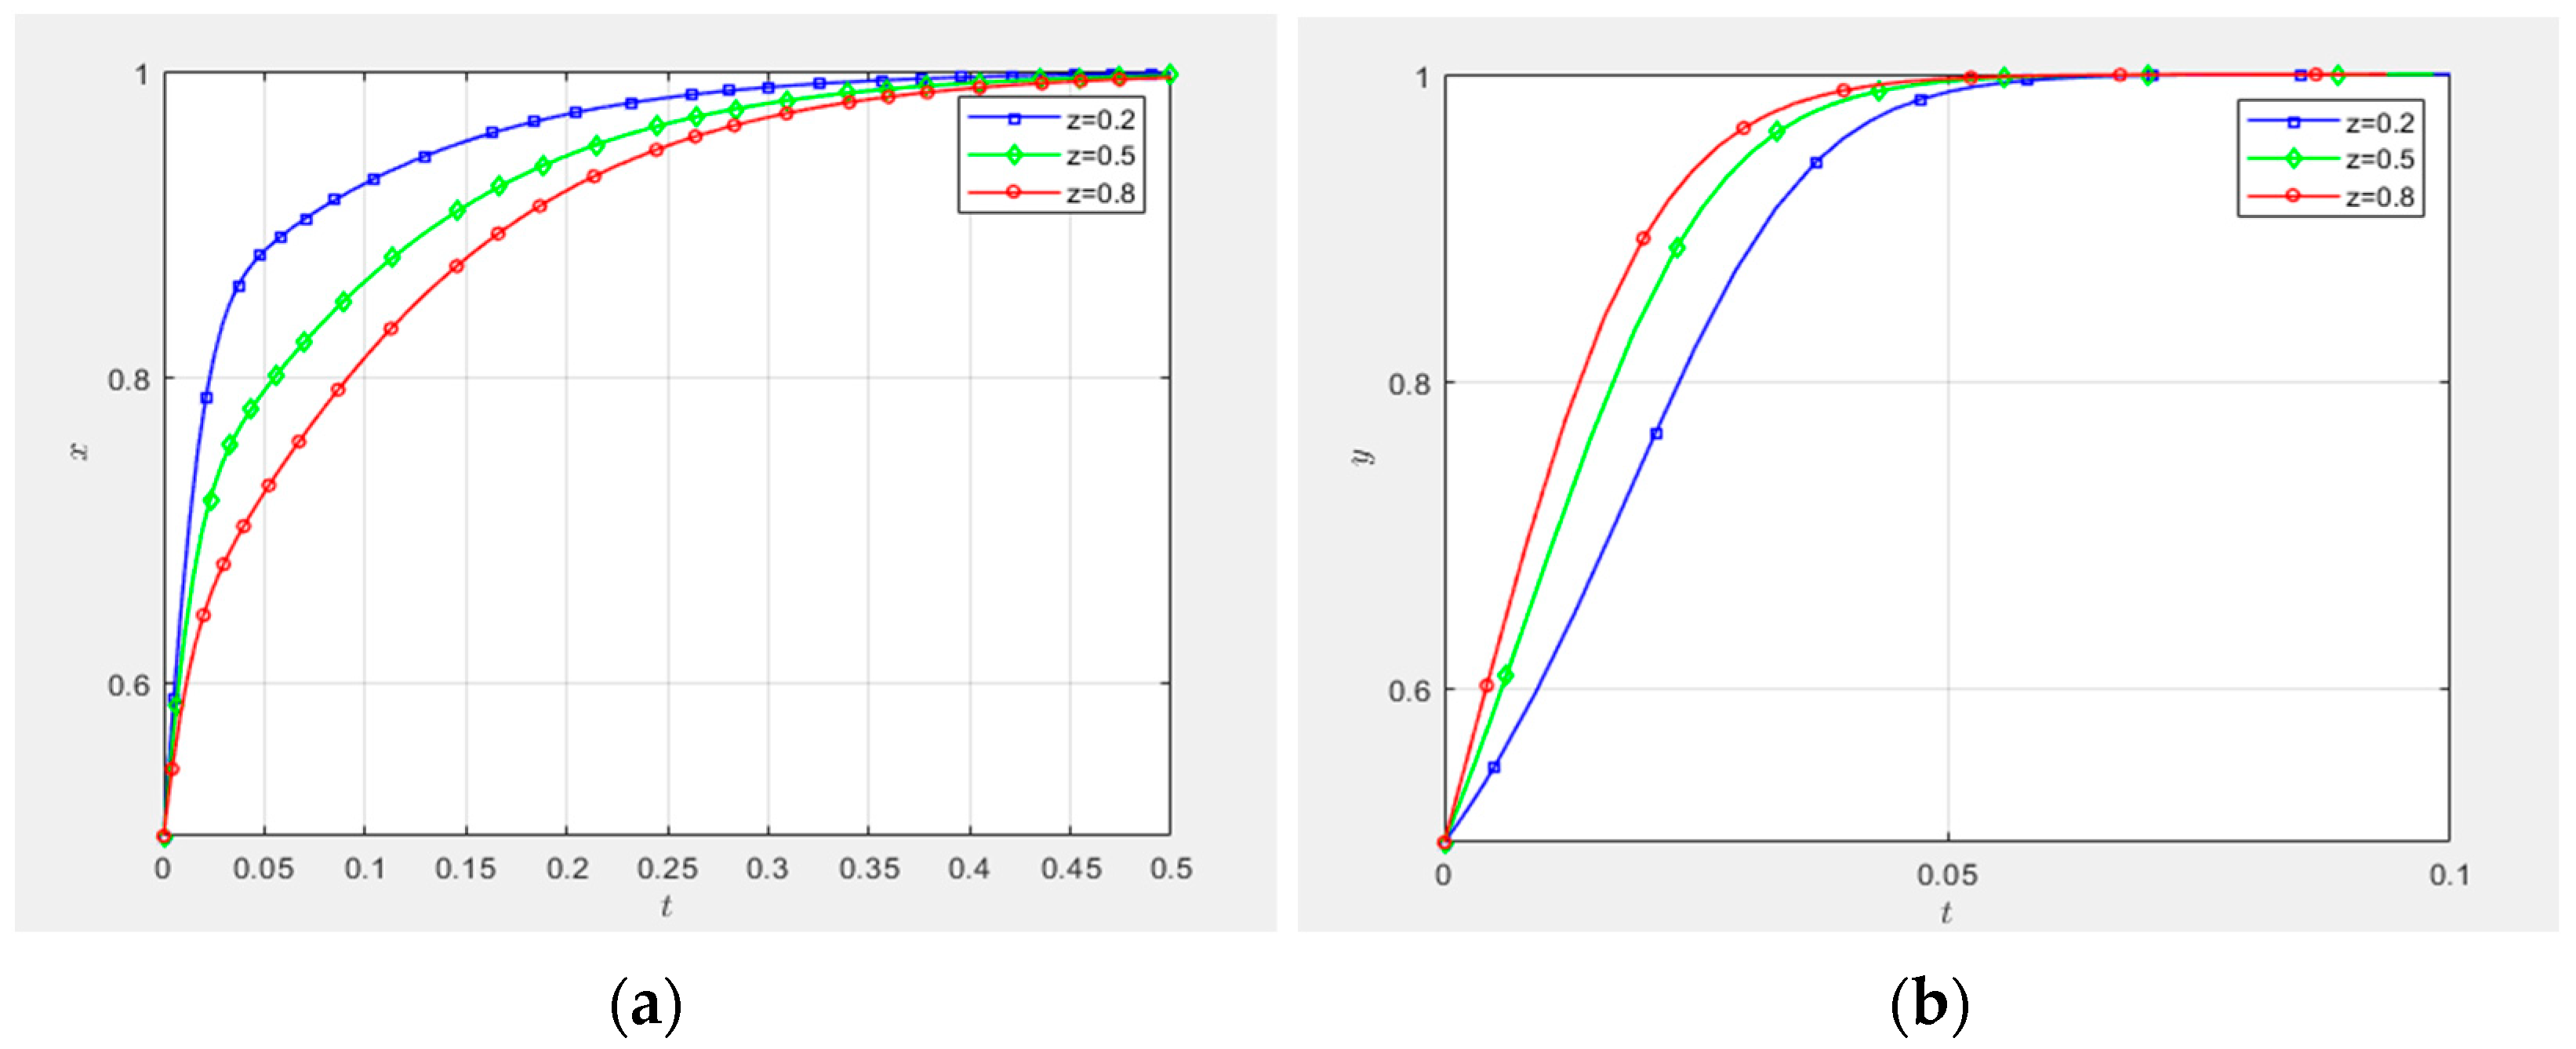
5.1. The Impact of Key Entities’ Initial Willingness on Mechanism Evolution

To simulate the impact of initial strategic propensities among tripartite game-theoretic actors on system evolution, parameterization was implemented as follows: governance entities’ initial propensity for high-involvement strategies was set at x 0.2 , 0.5 , 0.8 ; collaborative innovation platforms’ initial propensity for proactive matching strategies was set at y 0.2 , 0.5 , 0.8 ; and demand-side entities’ initial propensity for proactive matching strategies was set at z 0.2 , 0.5 , 0.8 . These values represent low-, medium-, and high-level initial strategic inclinations for each key actor, enabling systematic analysis of how foundational willingness configurations influence the evolutionary trajectory of technological innovation supply–demand matching mechanisms.
(1) The impact of governance entities’ initial strategic propensity on behavioral strategy evolution in collaborative innovation platforms and demand-side entities:
As demonstrated in Figure 10a, when y = z = 0.5 (ceteris paribus), the increased initial strategic propensity of governance entities accelerates the convergence rate of collaborative innovation platforms’ behavioral trajectories toward equilibrium state 1. This indicates that governance entities’ initial adoption of high-involvement strategies exerts a positive catalytic effect on platforms’ proactive engagement in technological innovation supply–demand matching. Correspondingly, Figure 10b reveals that under identical parameter constraints (y = z = 0.5), the heightened initial strategic propensity of governance entities induces faster asymptotic stabilization of demand-side entities’ strategy trajectories to state 1, thereby empirically validating the existence of strategic complementarity between governance entities’ high-involvement strategies and demand-side entities’ active matching behaviors.
(2) The impact of collaborative innovation platforms’ initial strategic propensity on behavioral strategy evolution in governance entities and demand-side entities:
As illustrated in Figure 11a, under the parameter constraint x = z = 0.5, the heightened initial strategic propensity of collaborative innovation platforms induces decelerated convergence of governance entities’ behavioral trajectories toward equilibrium state 1. This empirically demonstrates an inverse relationship between platforms’ proactive technological innovation supply–demand matching propensity and governance entities’ strategic engagement intensity, indicating that platforms’ initial commitment to active matching exerts a negative moderating effect on governance entities’ high-involvement strategy adoption. Conversely, Figure 11b reveals that under identical experimental conditions, the increased initial strategic propensity of collaborative innovation platforms accelerates the asymptotic stabilization rate of demand-side entities’ strategy trajectories to state 1, thereby confirming strategic spillover effects wherein platforms’ proactive matching behaviors positively amplify demand-side entities’ participation incentives.
(3) The impact of demand-side entities’ initial strategic propensity on behavioral strategy evolution in governance entities and collaborative innovation platforms.
As evidenced in Figure 12a, under the parametric condition x = y = 0.5, the enhanced initial strategic propensity of demand-side entities leads to retarded convergence of governance entities’ behavioral trajectories toward equilibrium state 1. This empirically verifies a strategic substitution effect where demand-side entities’ proactive technological innovation supply–demand matching propensity inversely constrains governance entities’ adoption intensity of high-involvement strategies. Conversely, Figure 12b demonstrates that under identical experimental configurations, the amplified initial strategic propensity of demand-side entities accelerates the evolutionary stabilization rate of collaborative innovation platforms’ strategy trajectories to state 1, establishing a positive feedback mechanism wherein demand-side engagement catalyzes platforms’ operational efficiency in supply–demand coordination.

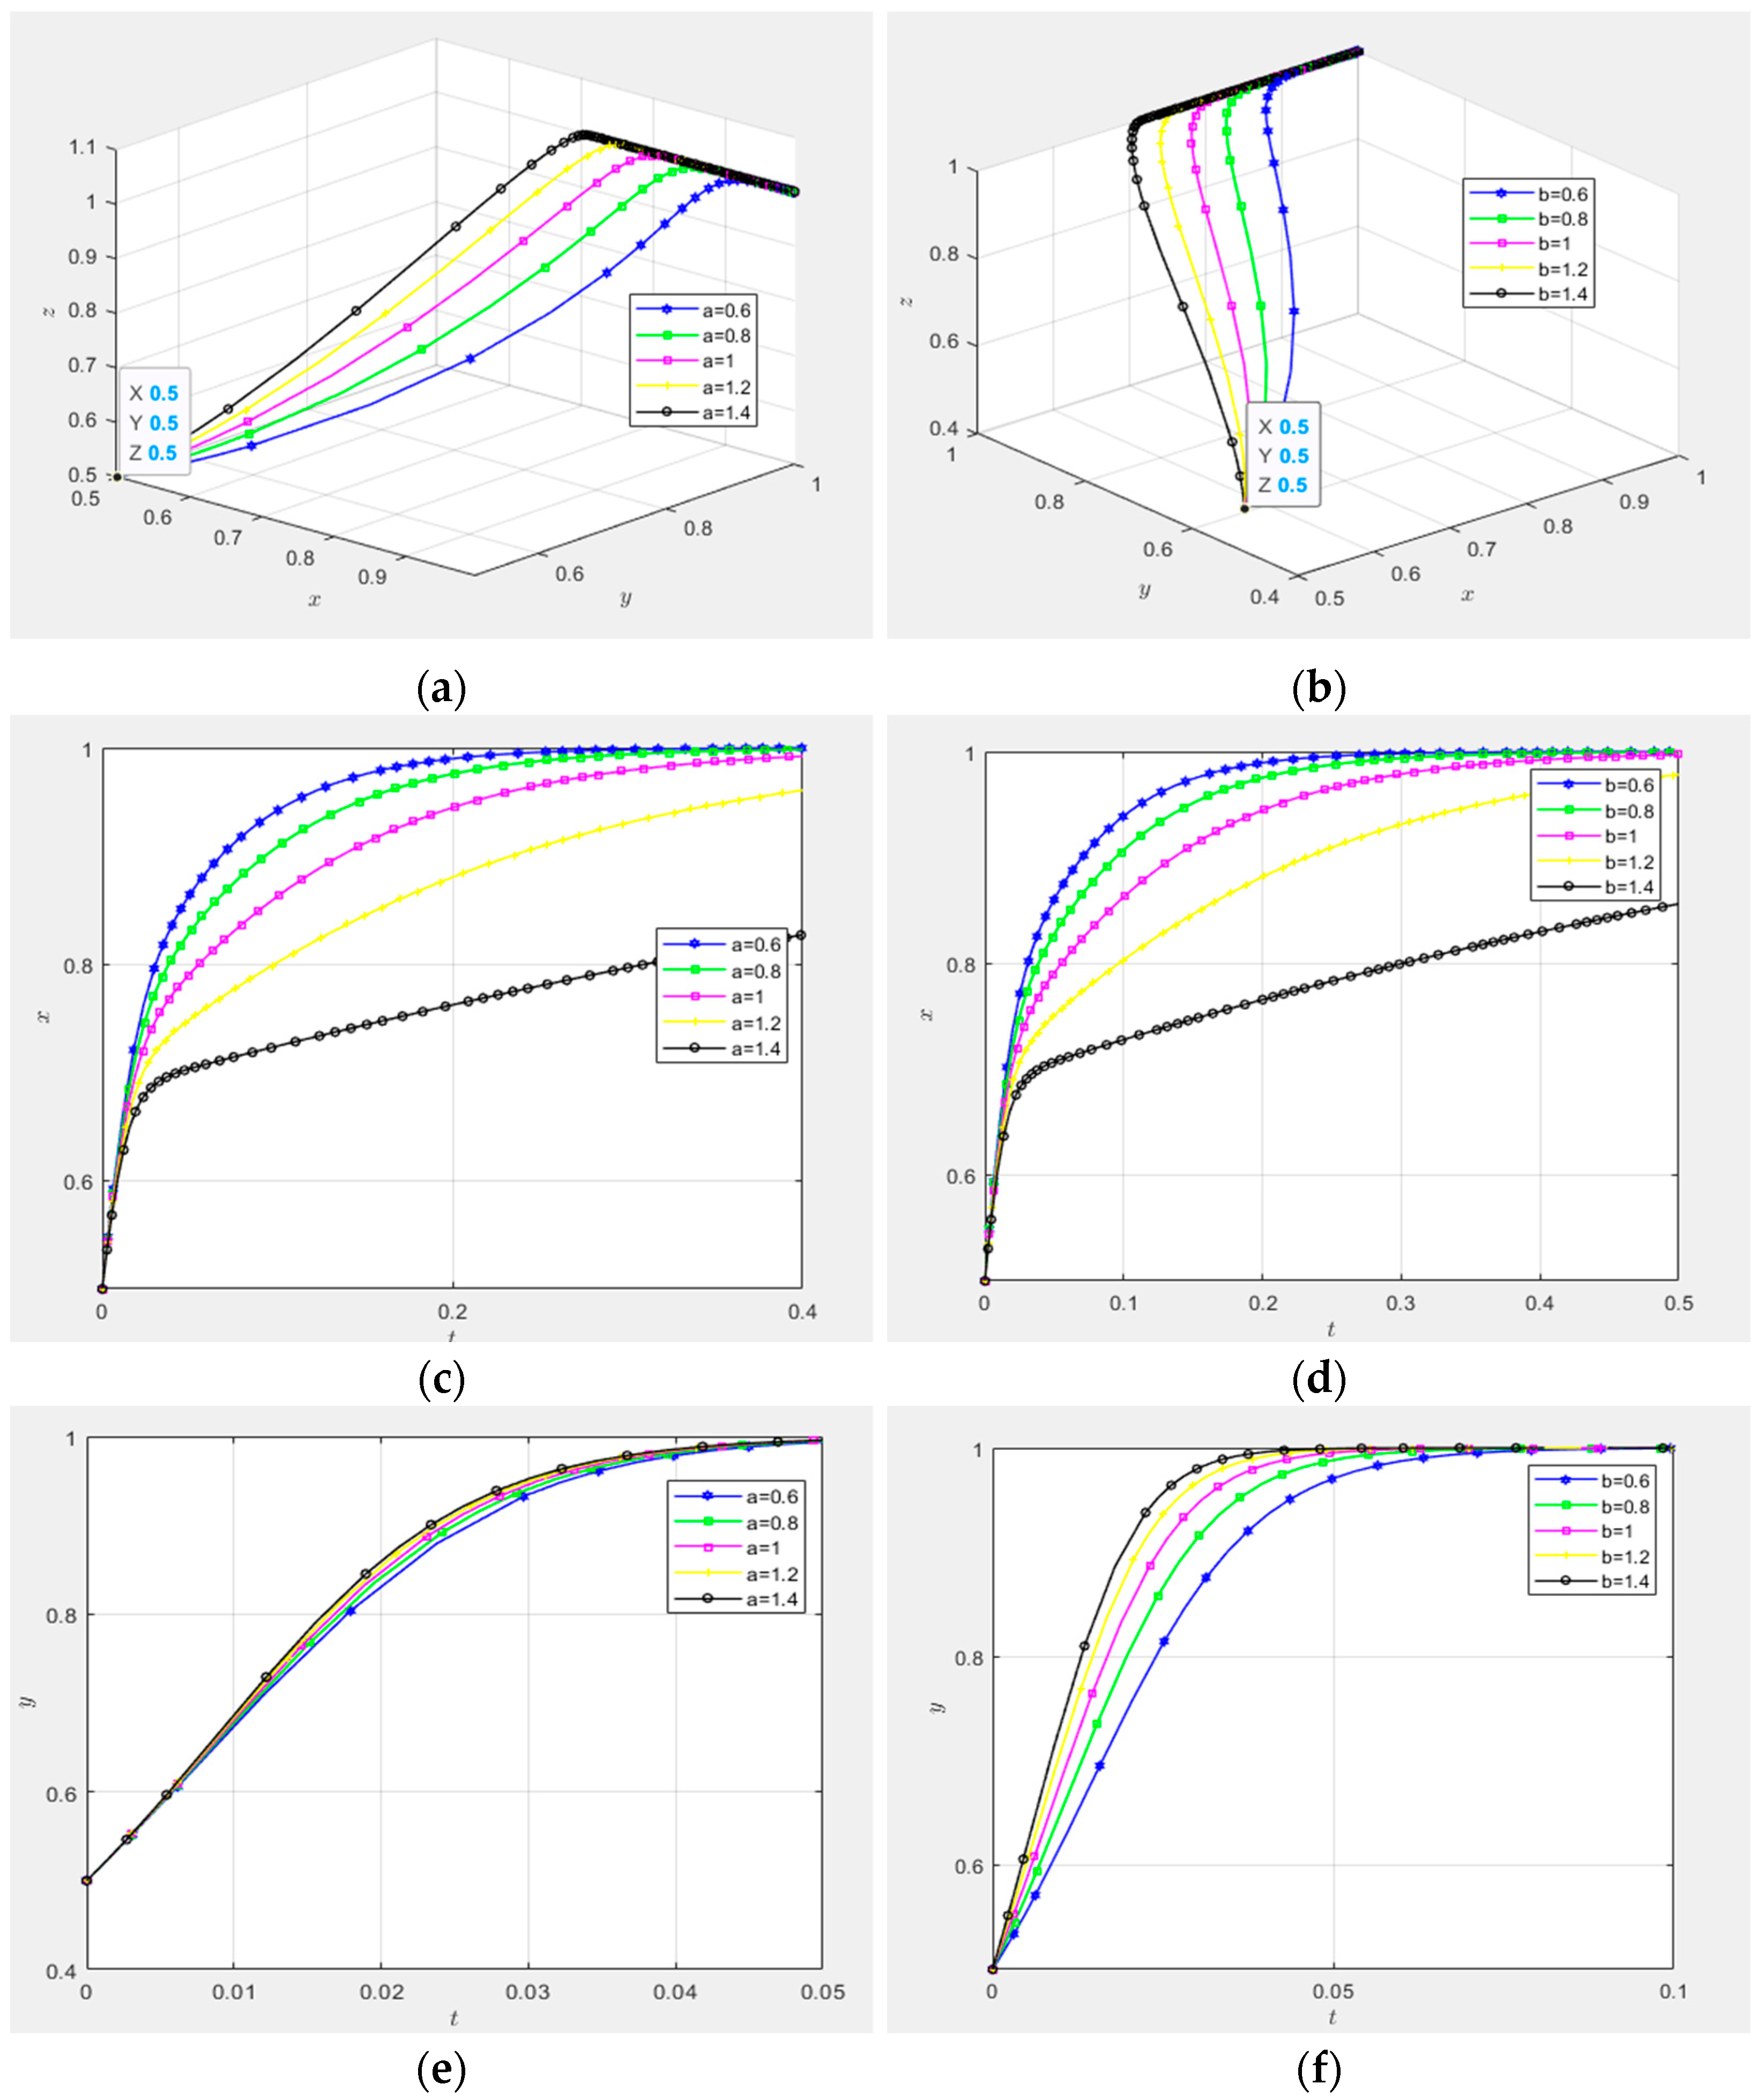
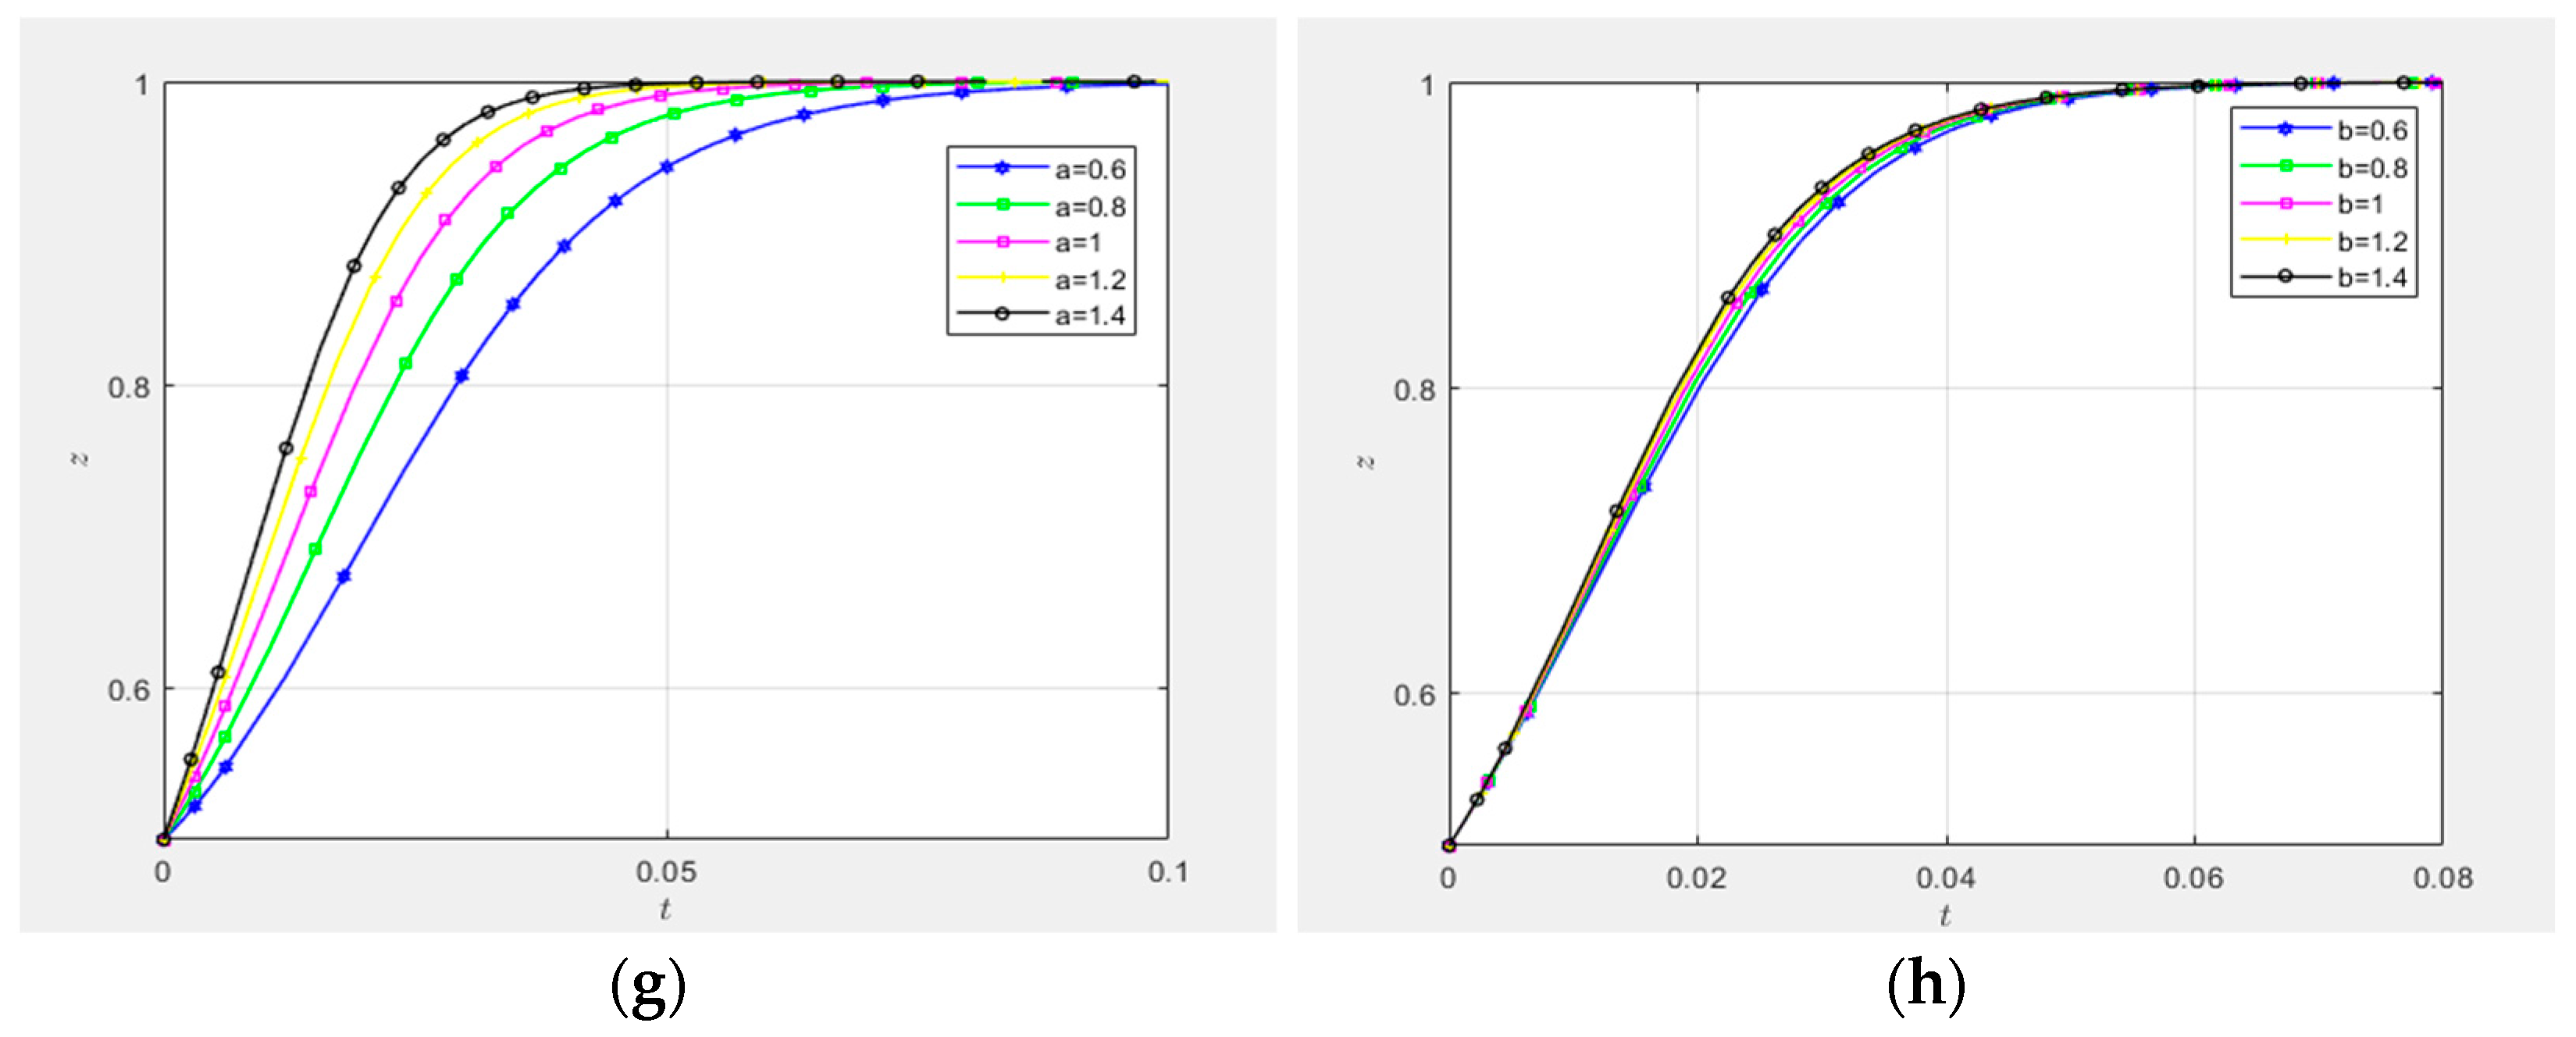
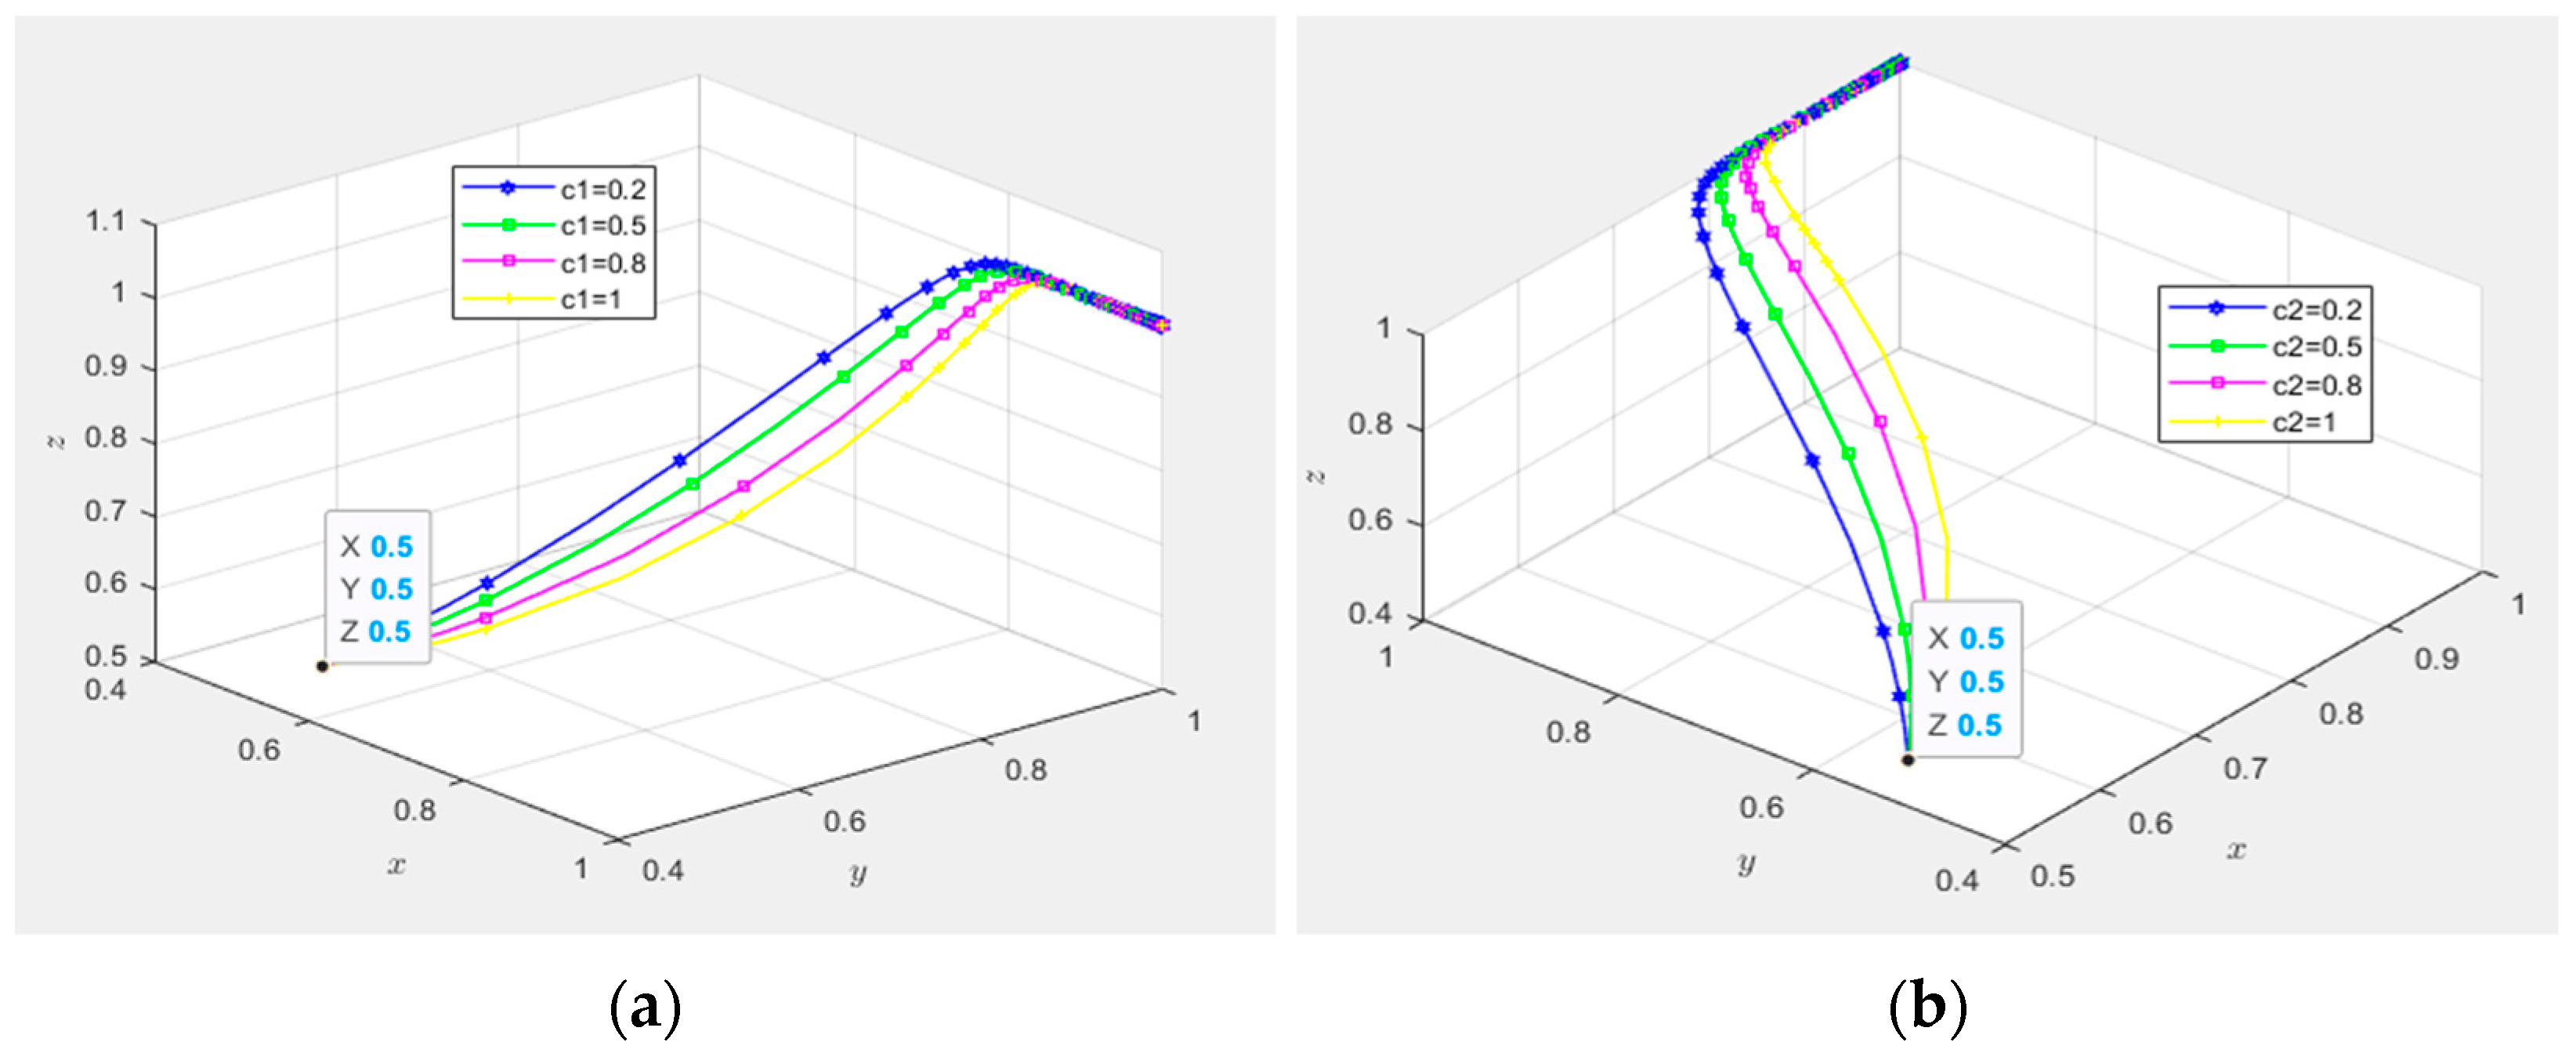
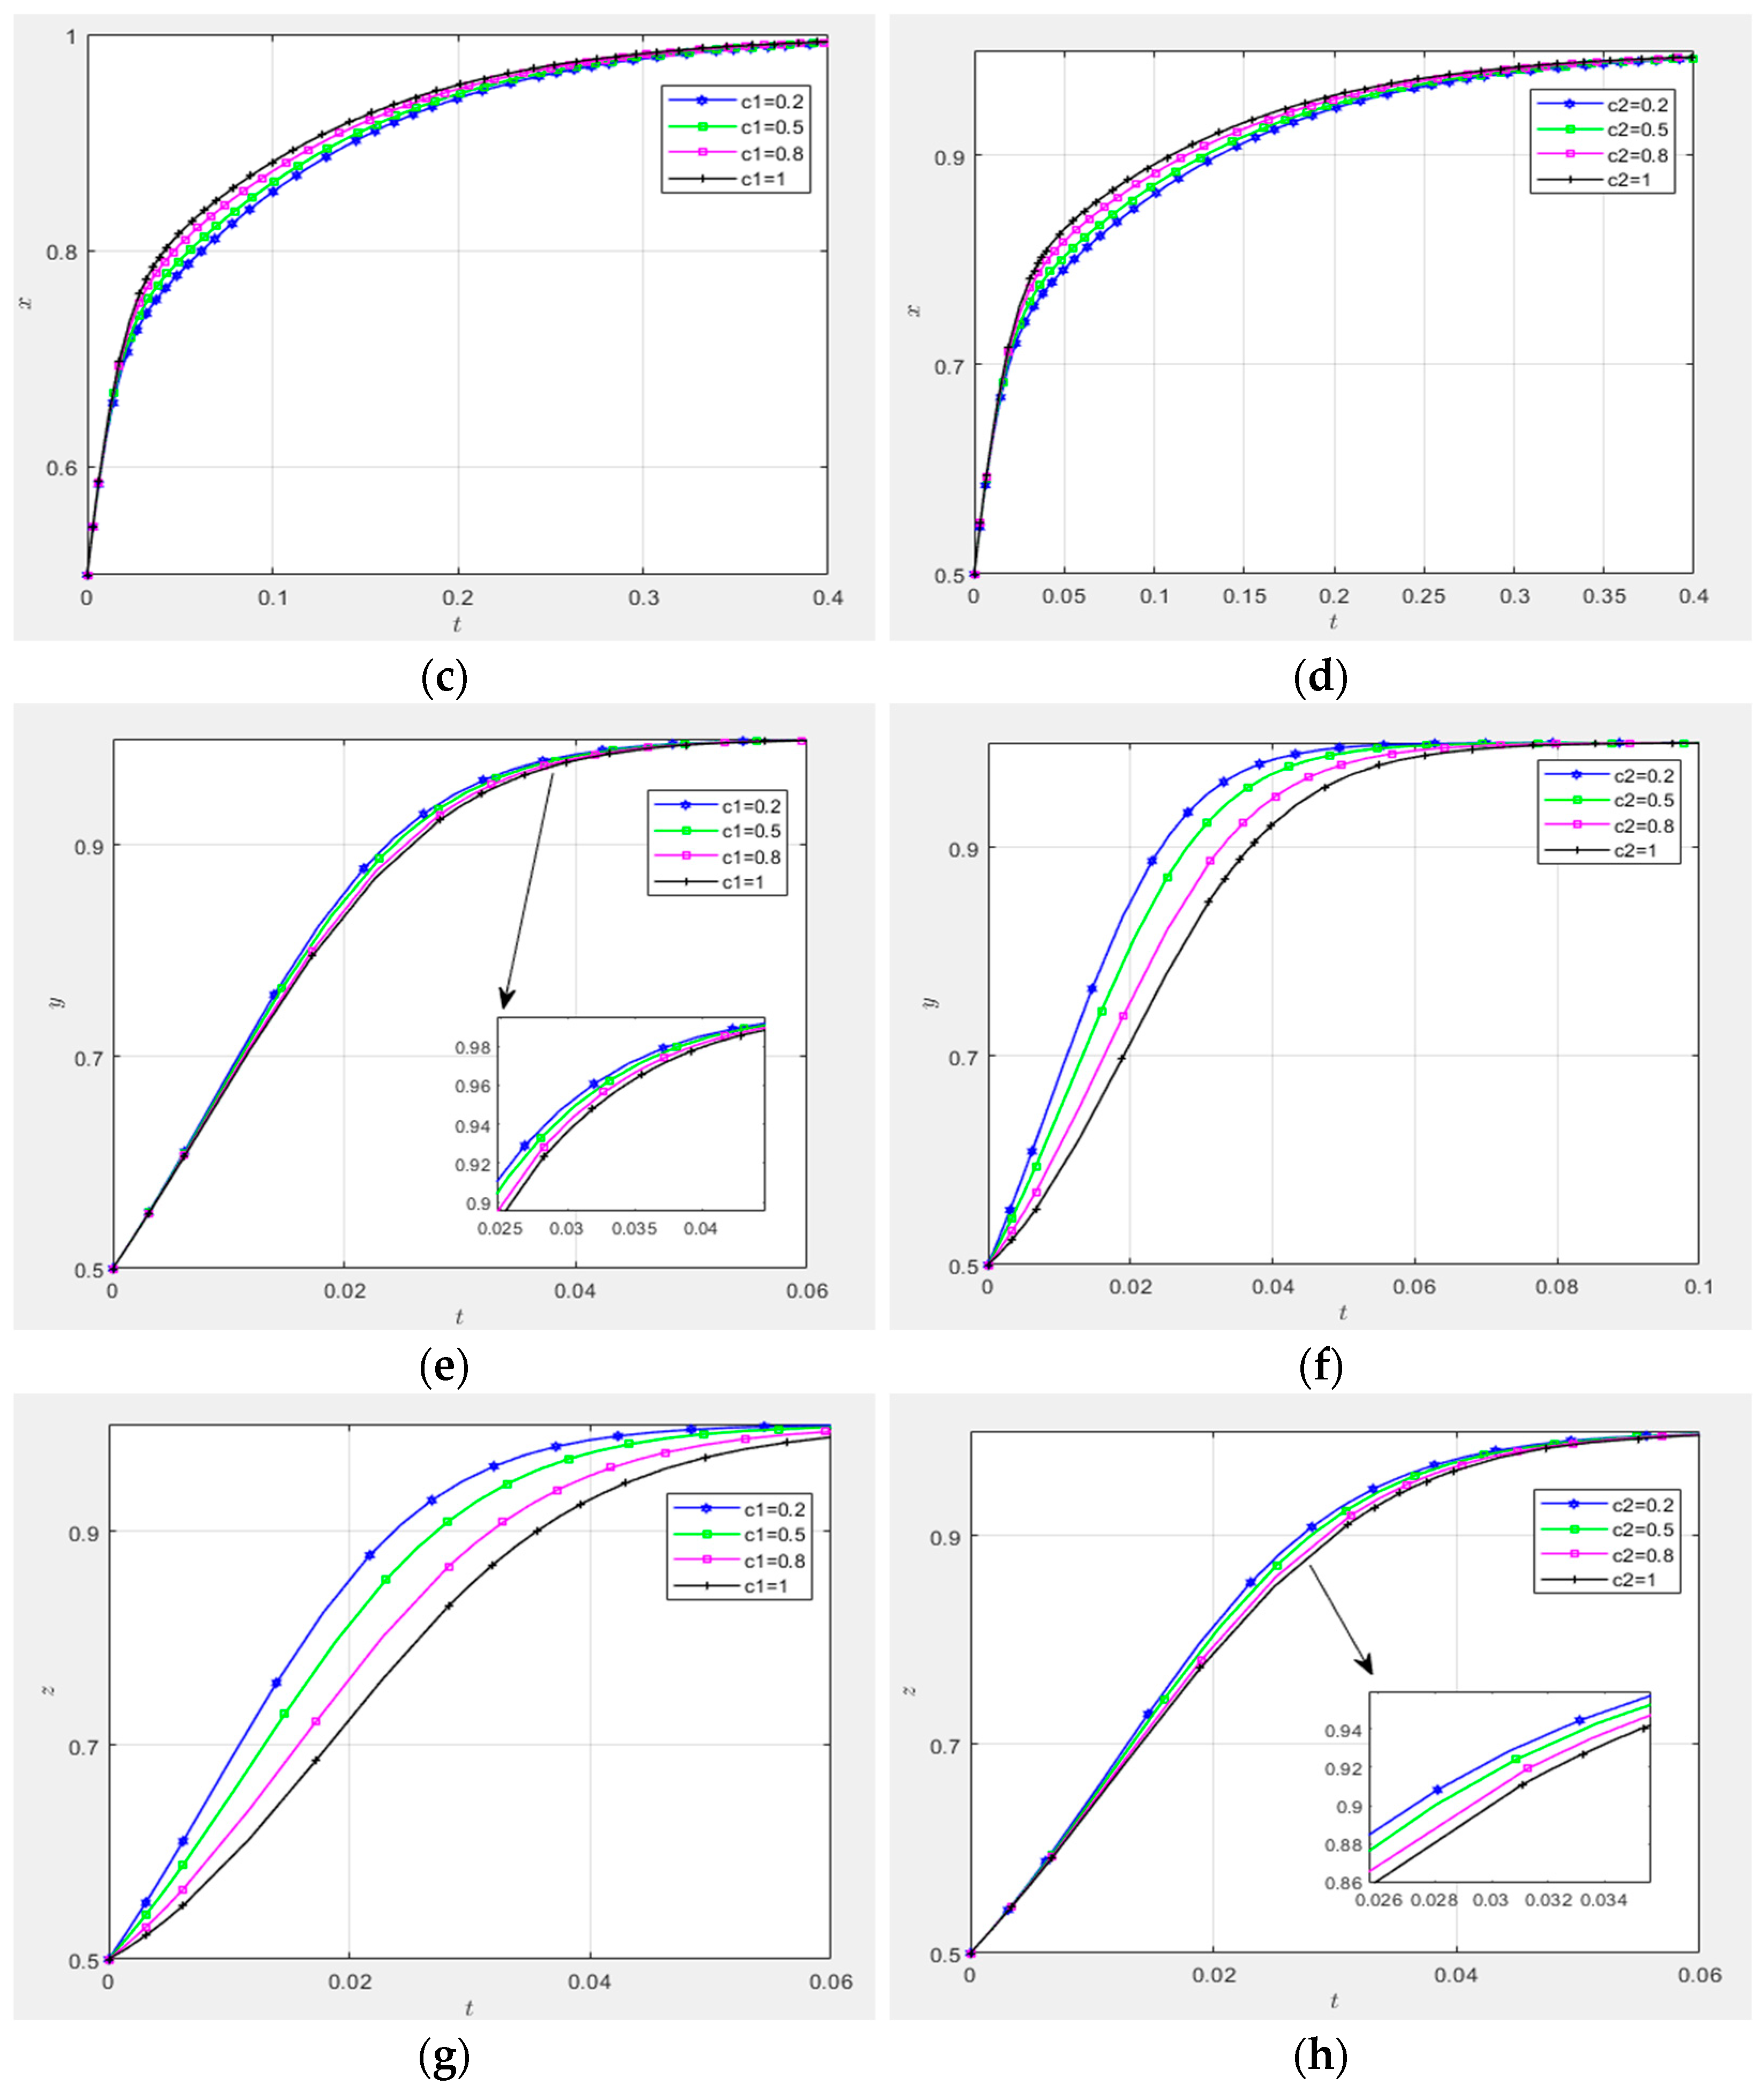
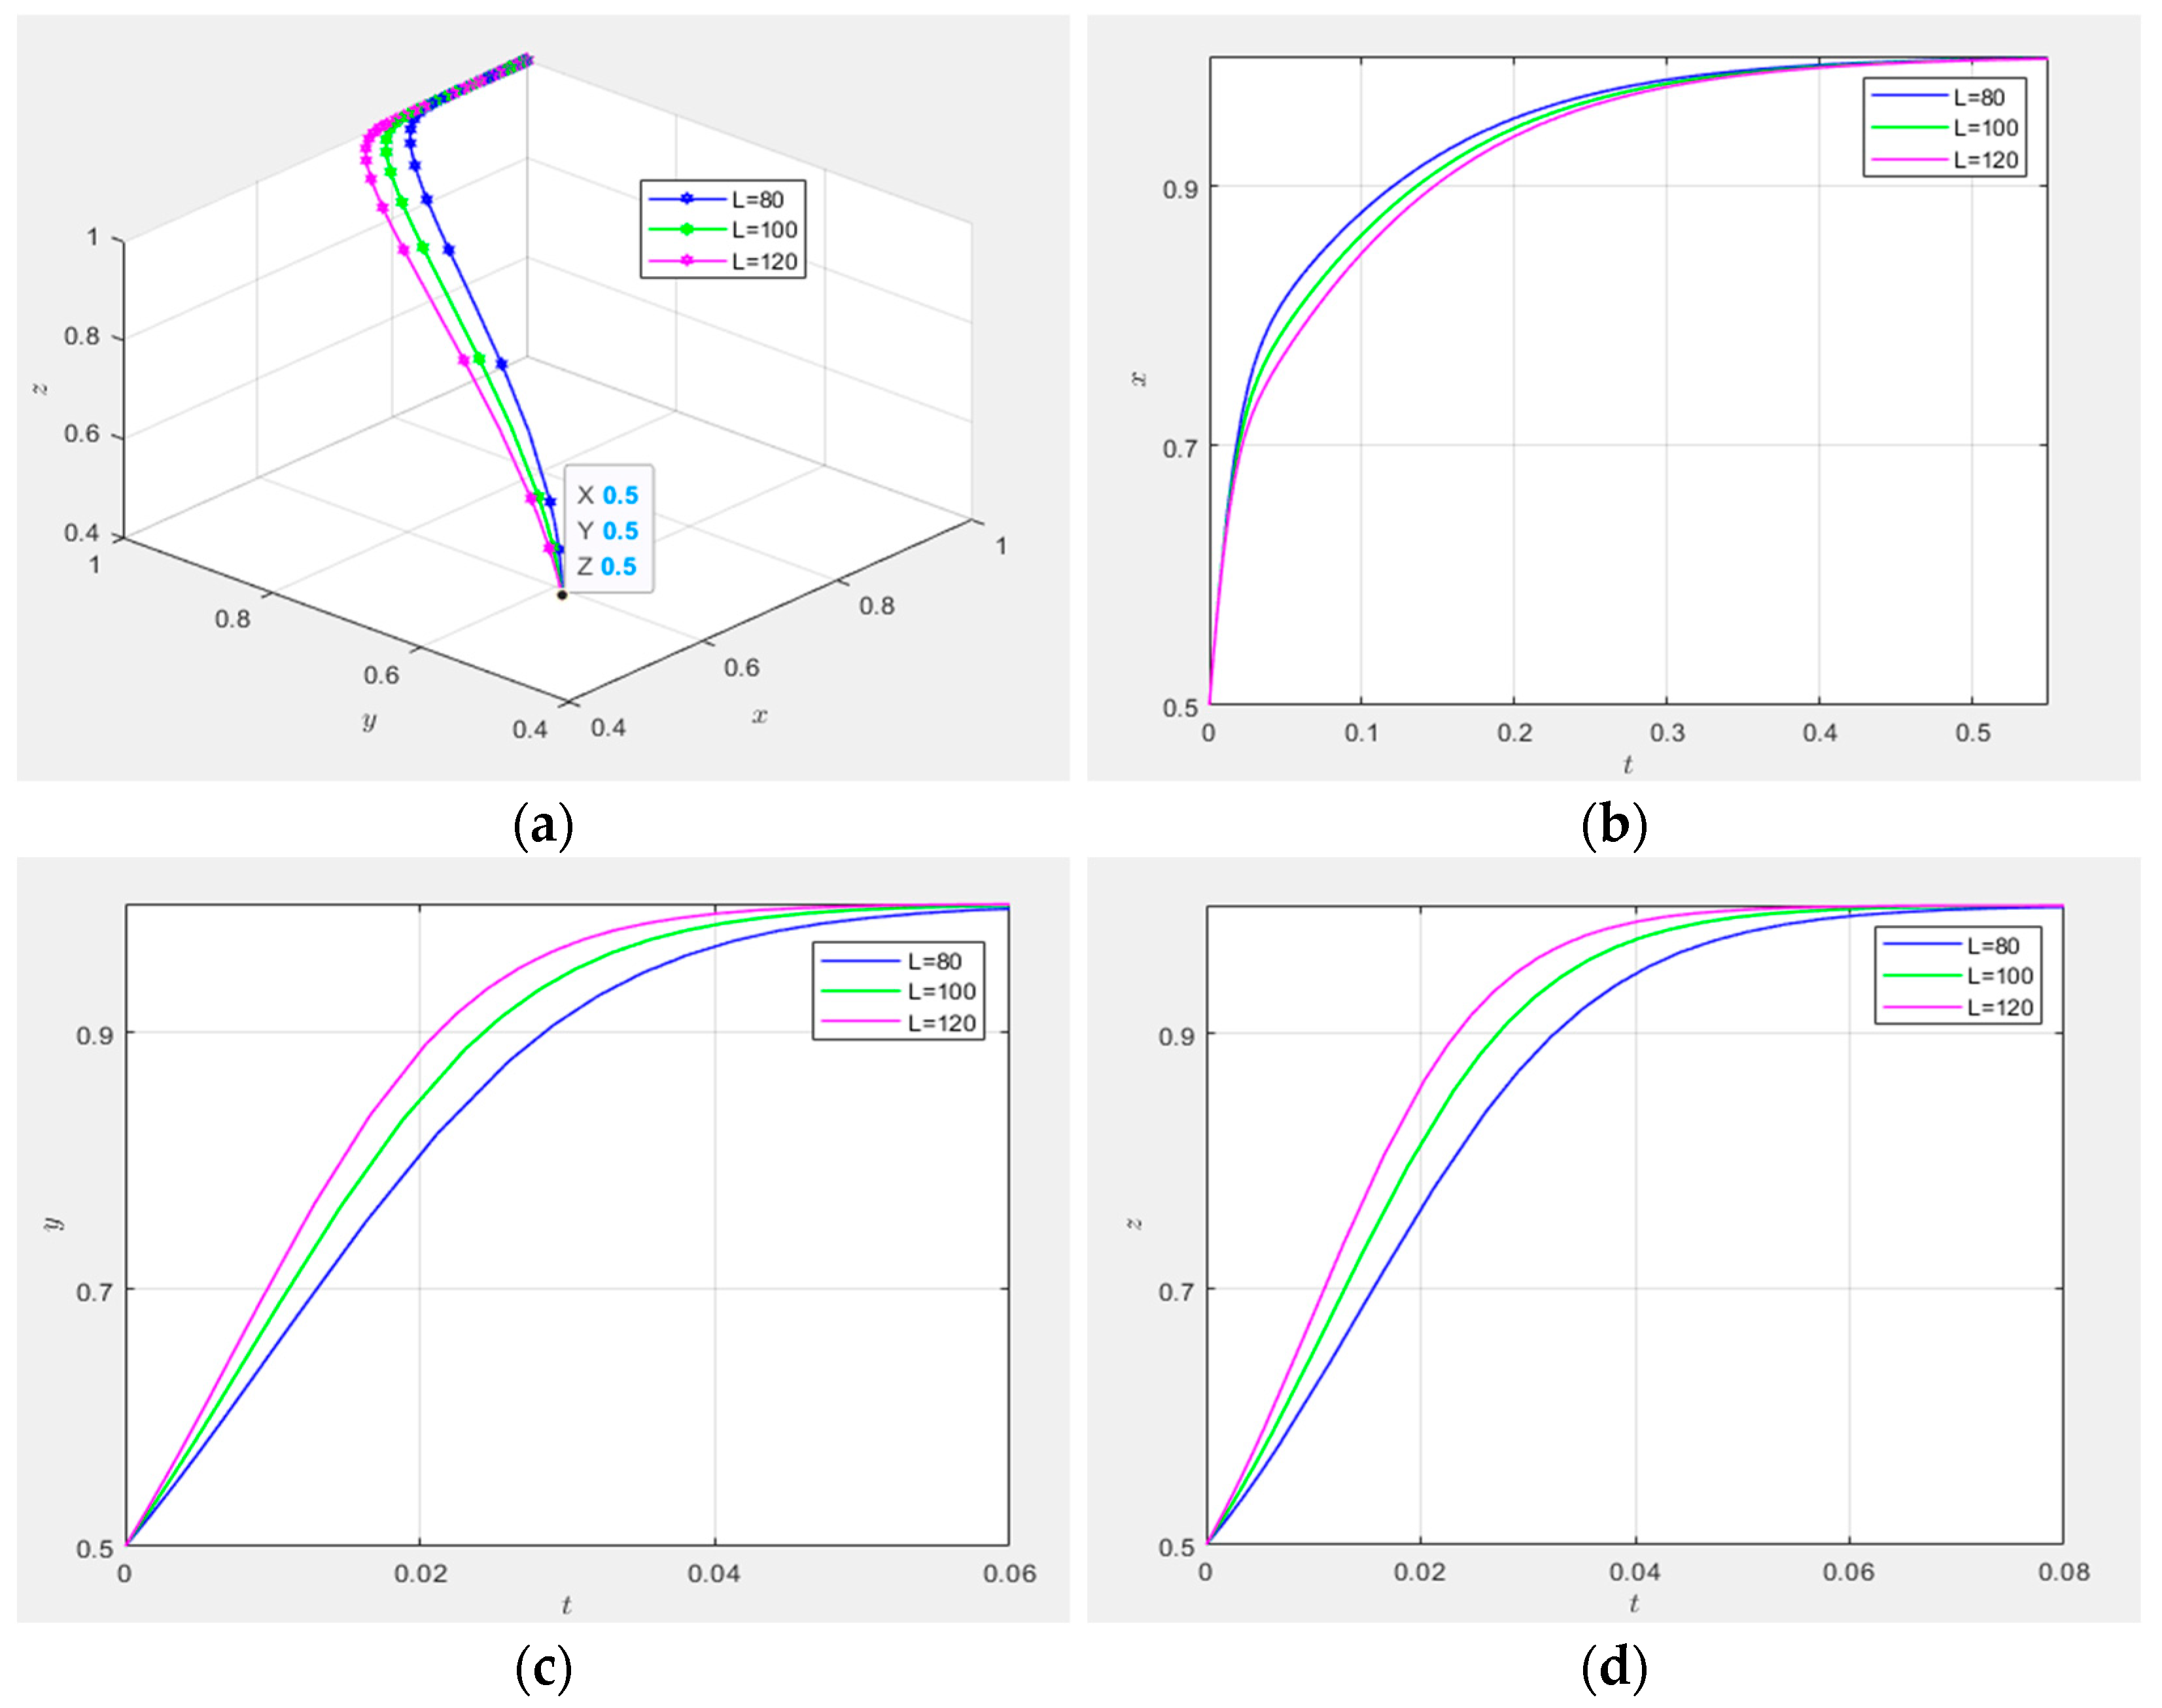
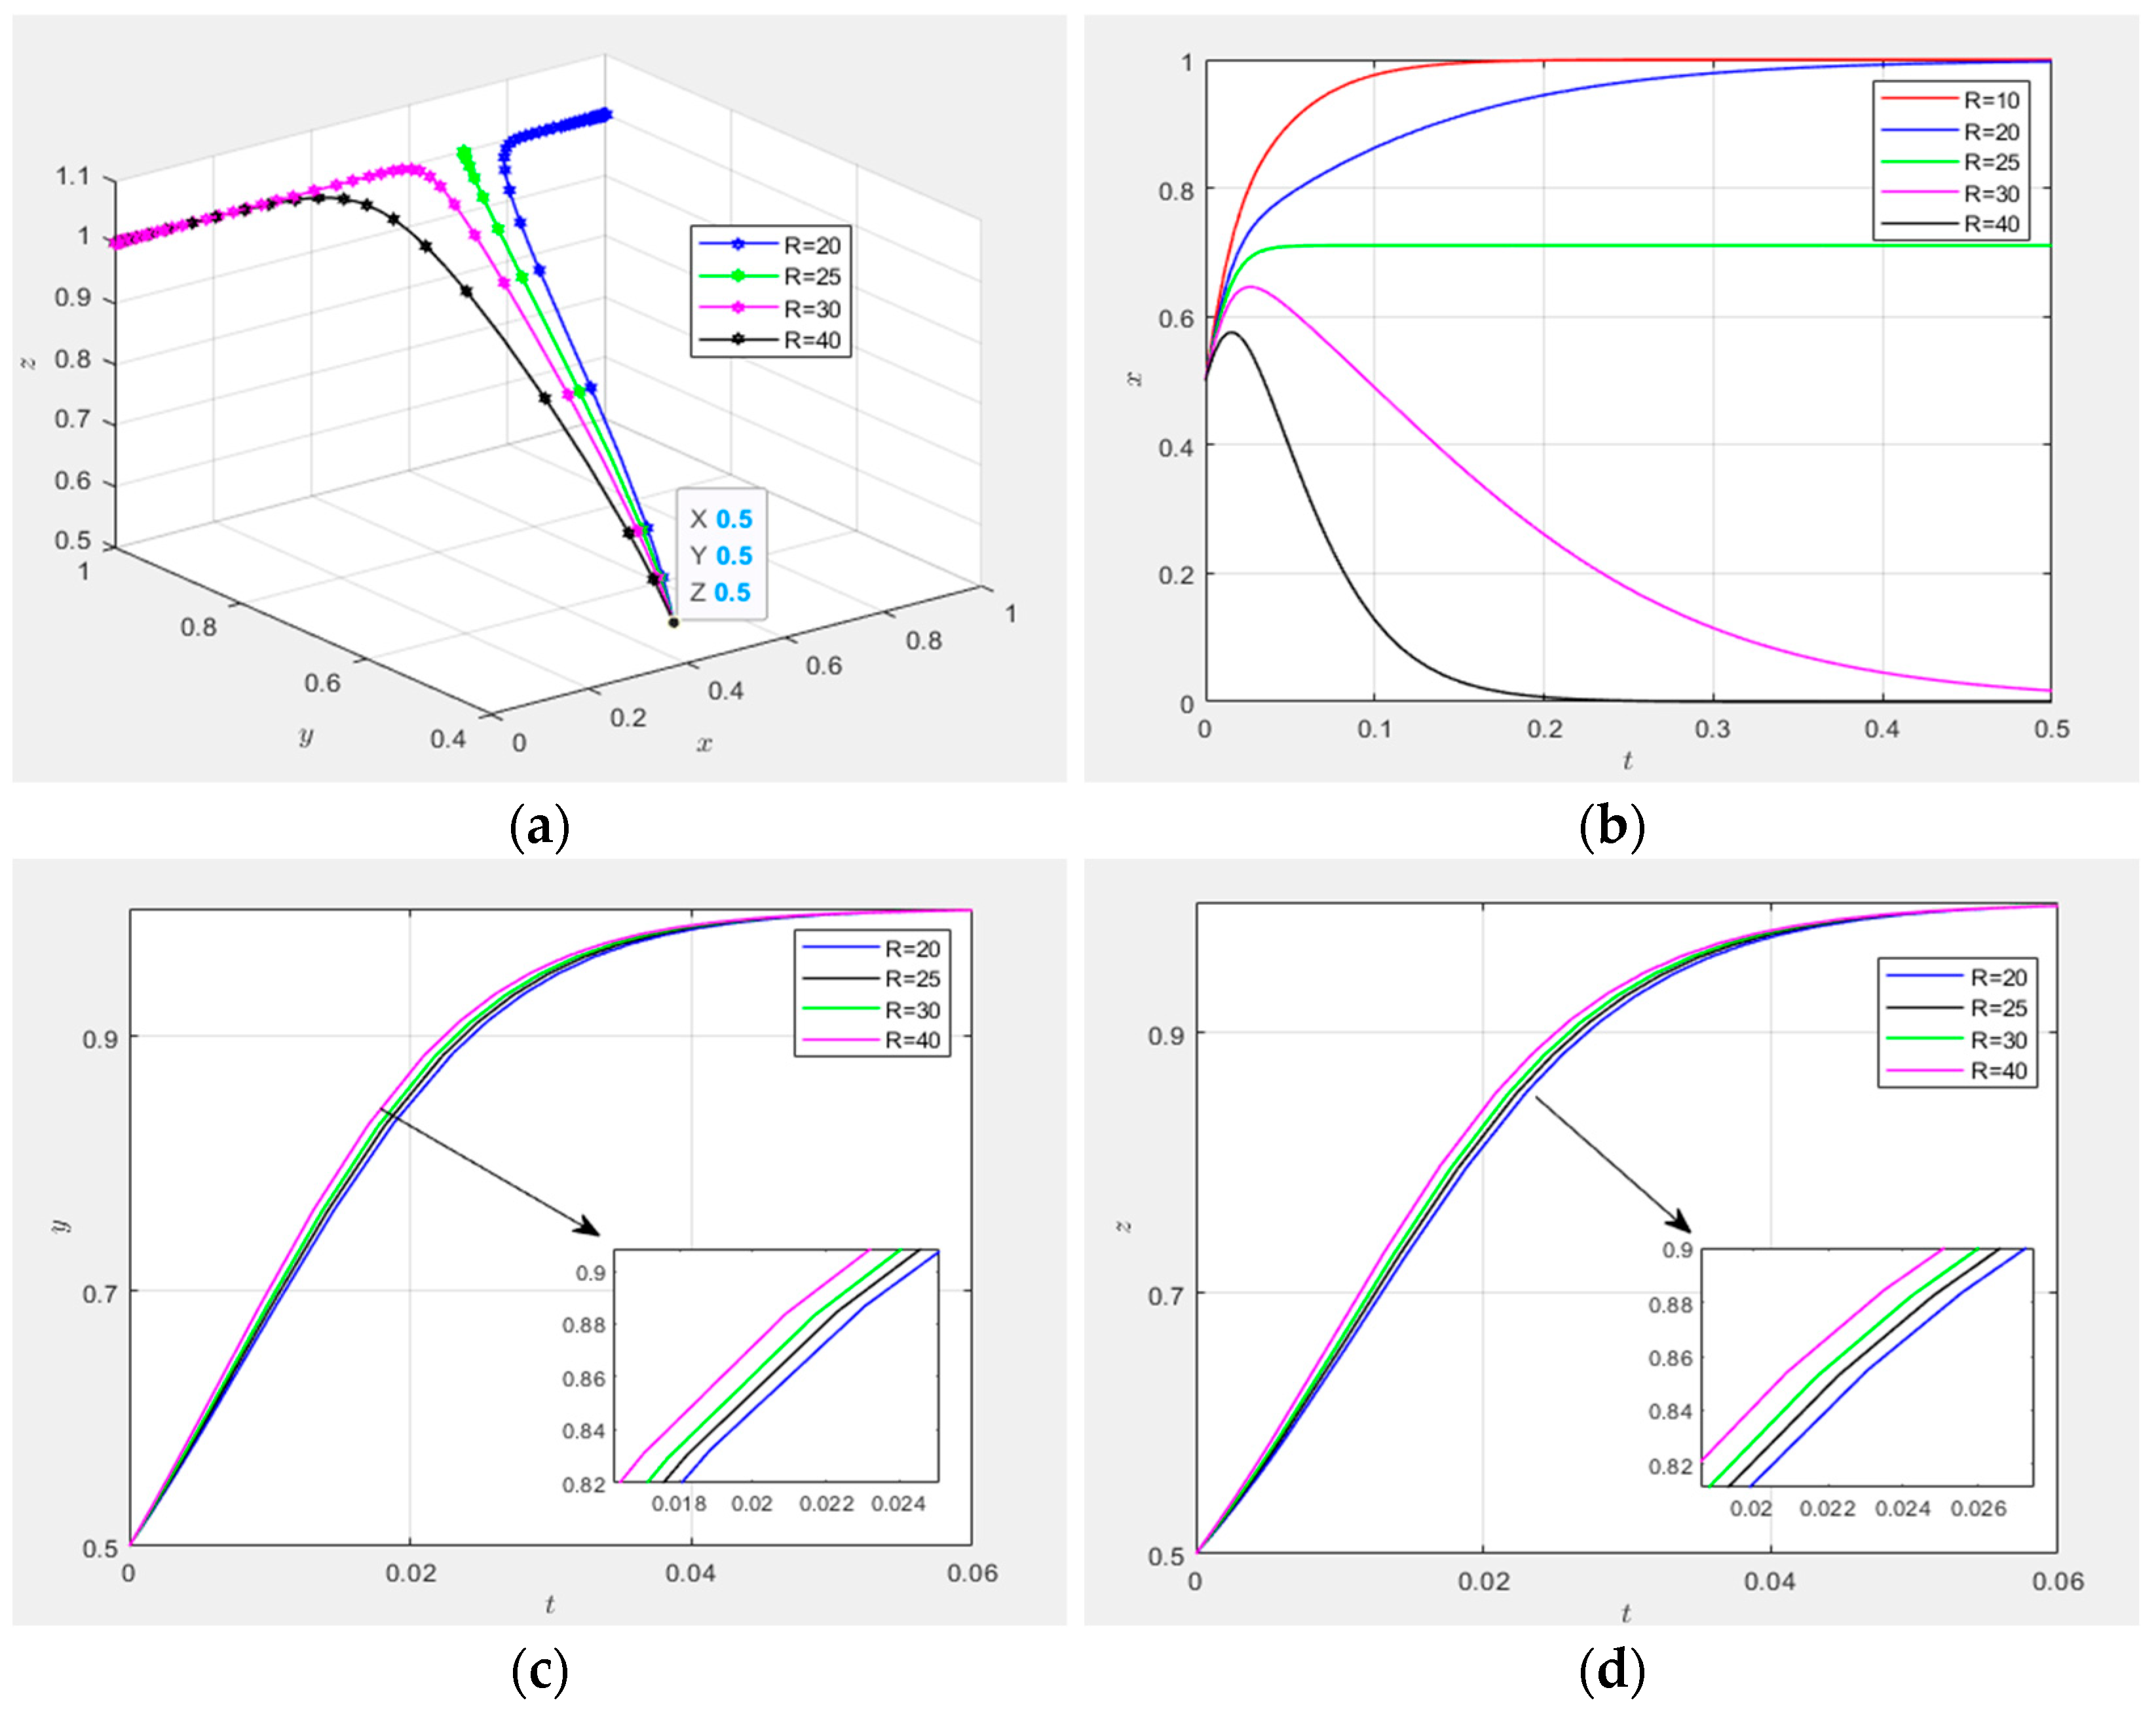
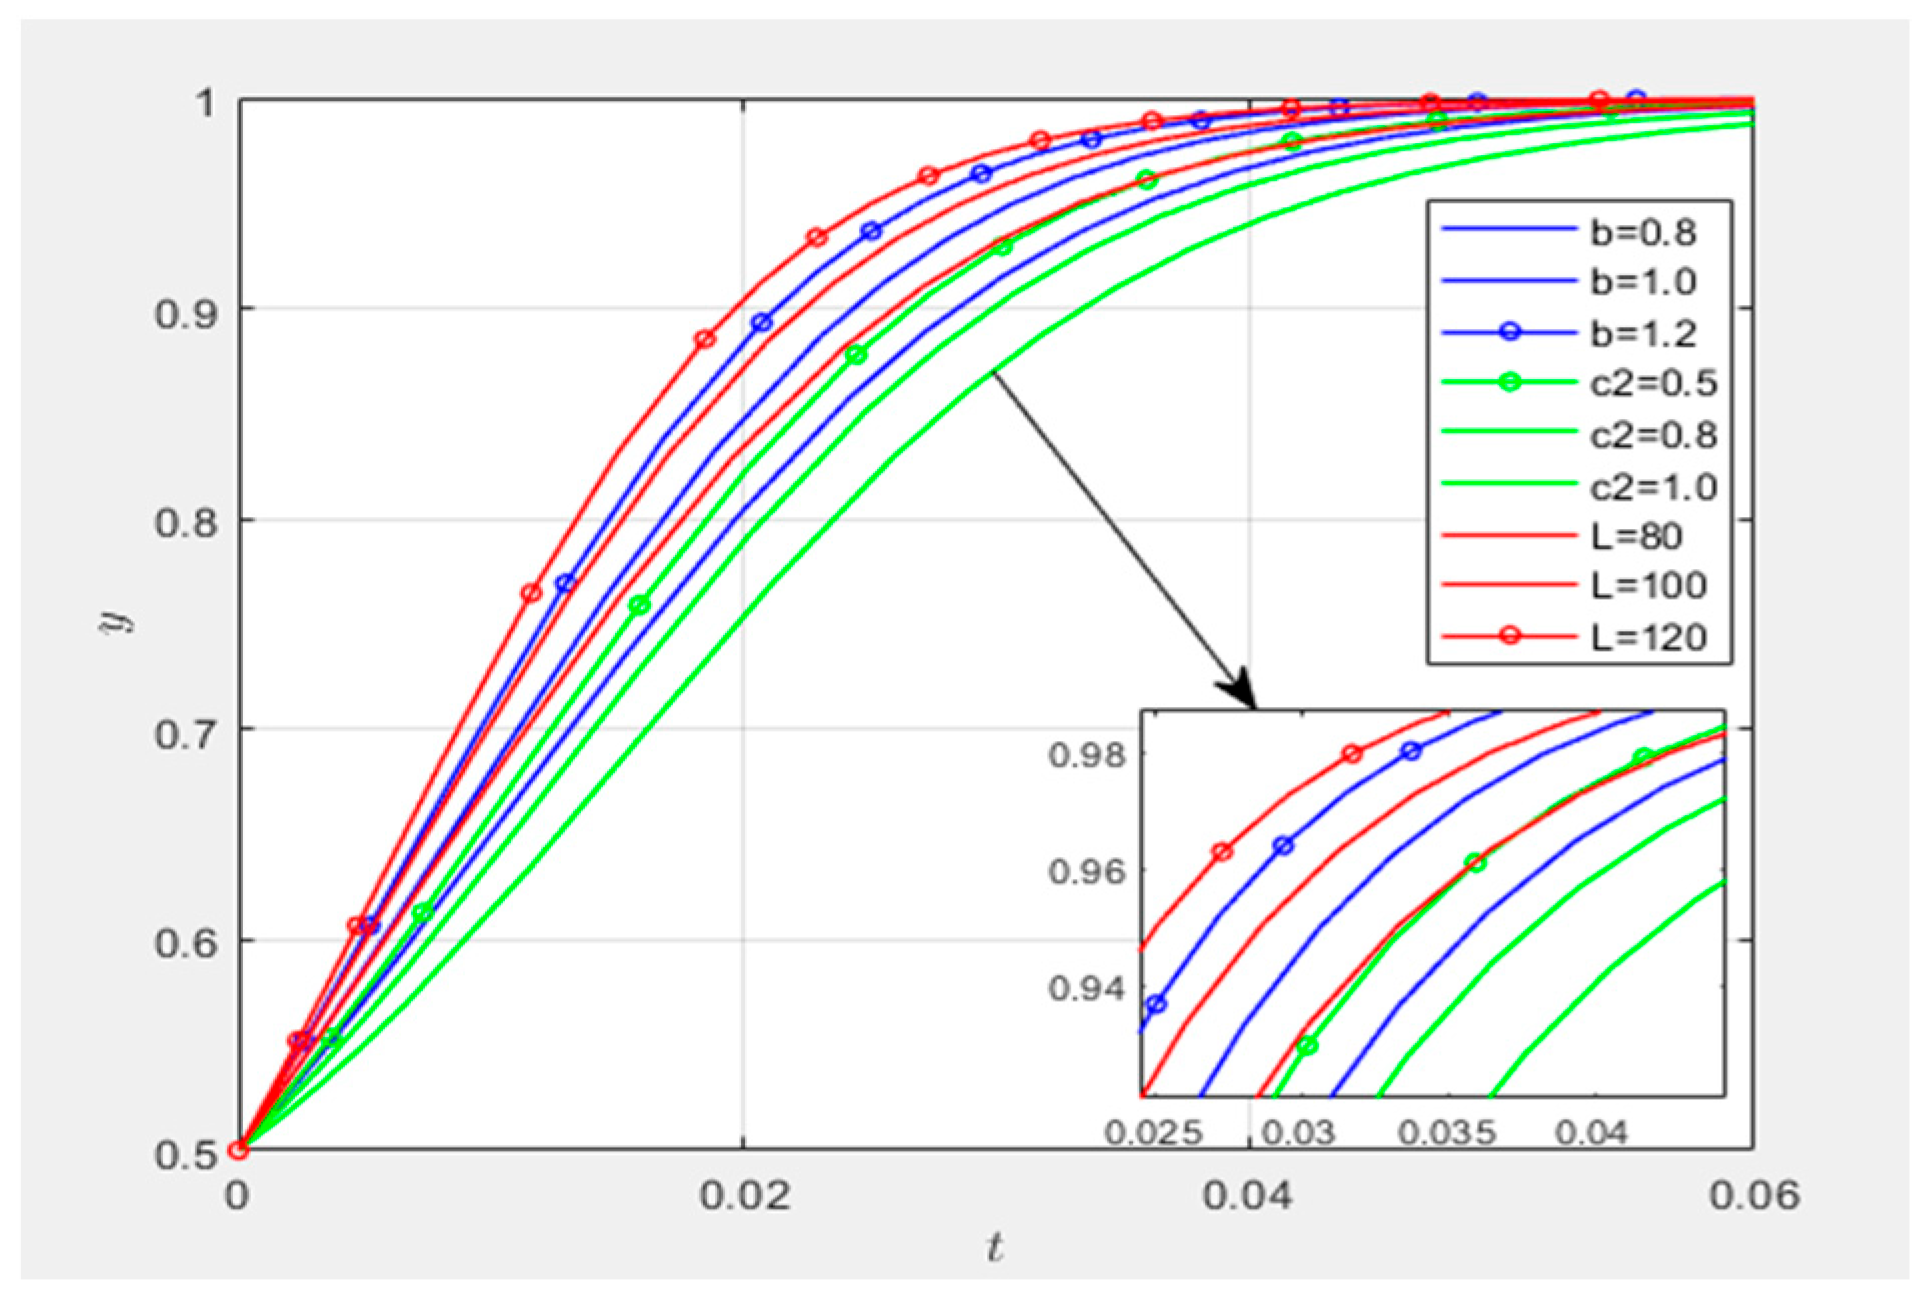
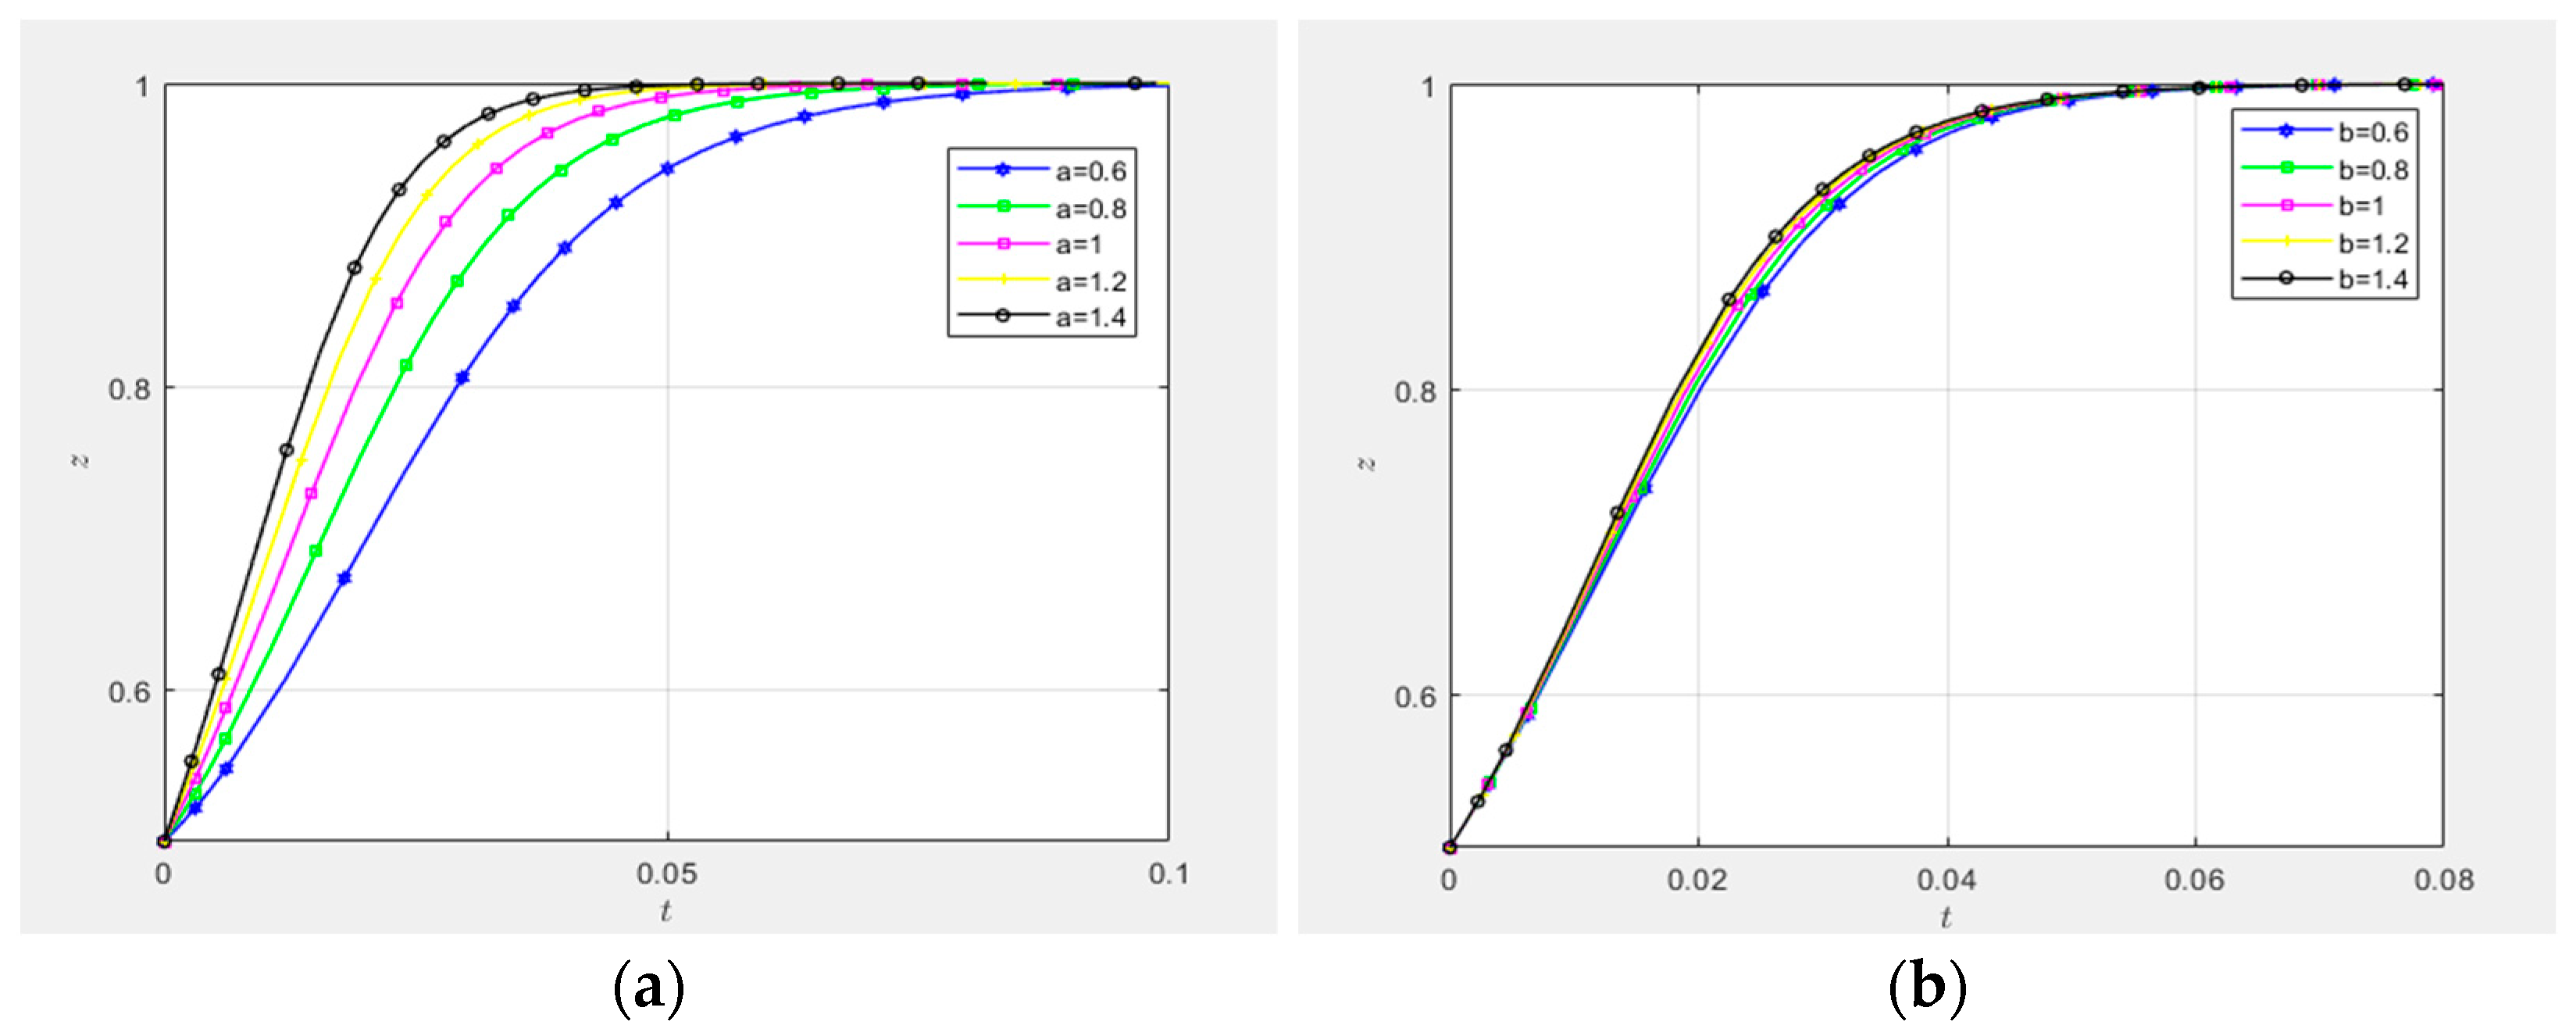
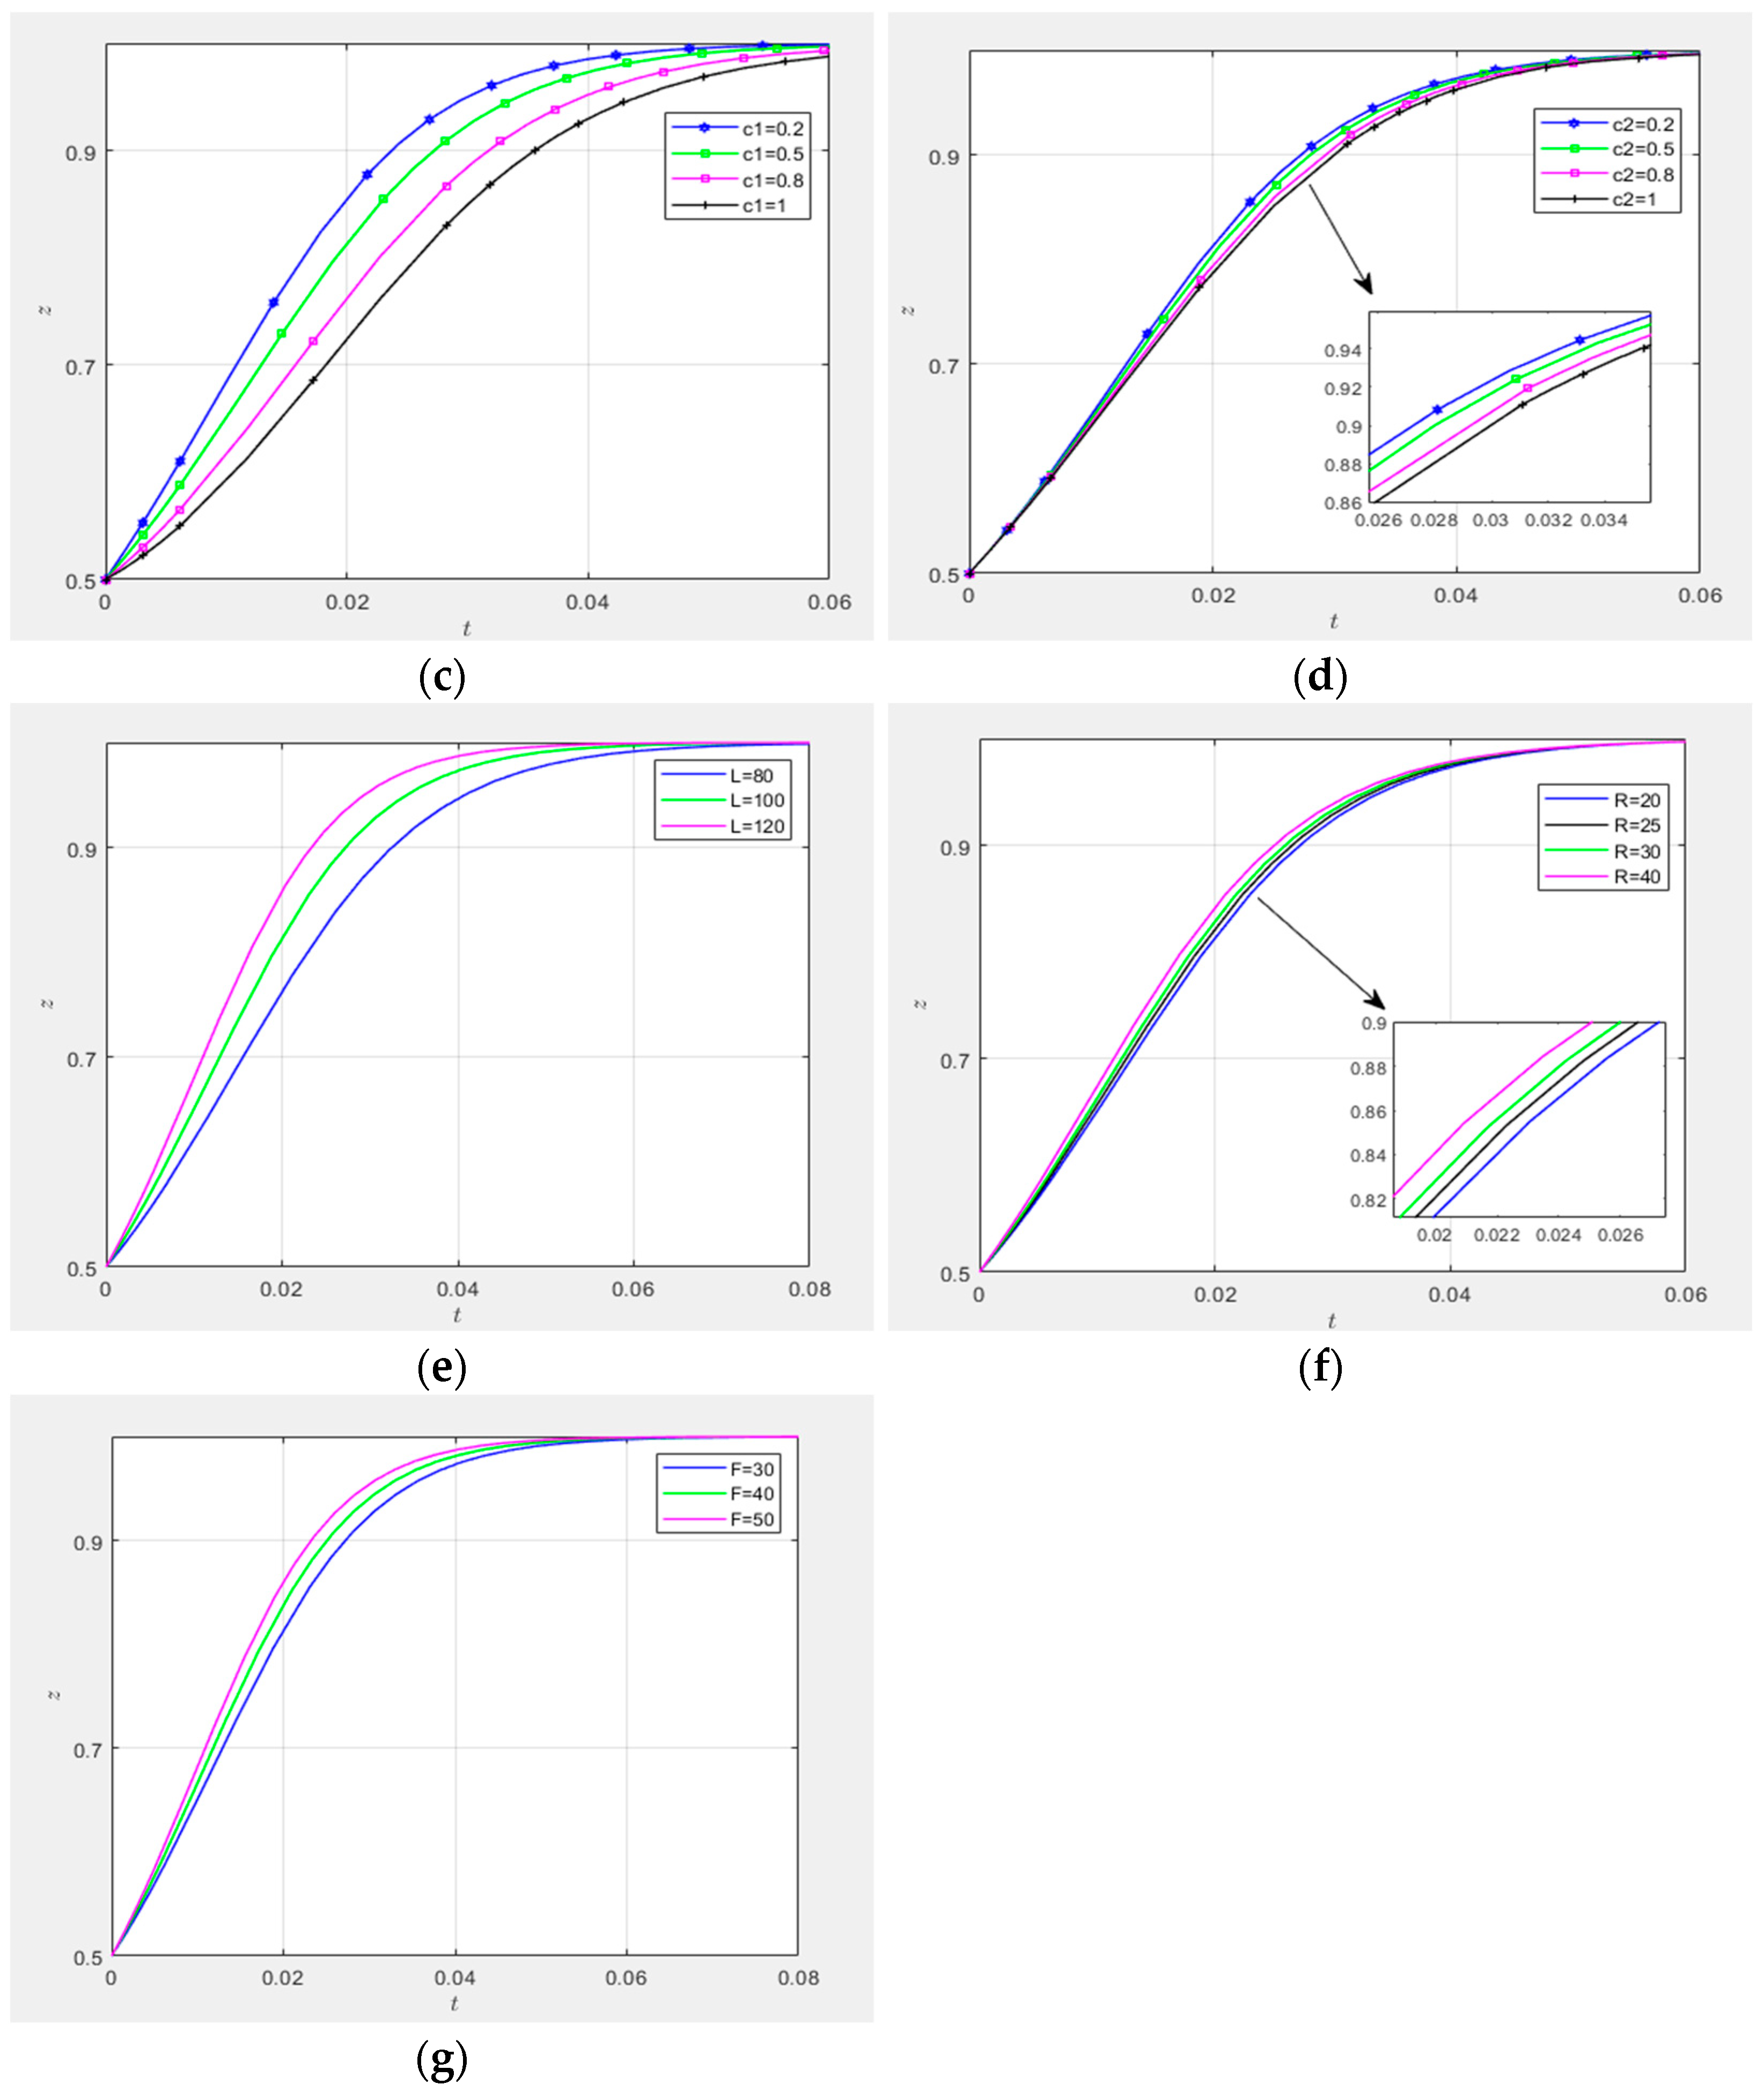
5.2. Tripartite Game Parameter Sensitivity Analysis

(1) Impact of technological innovation supply–demand matching effort coefficients a and b :
As illustrated in Figure 13, the strategic evolutionary pathways are analyzed under varying values of the technological innovation supply–demand matching effort coefficients for demand-side entities and collaborative innovation platforms, specifically a = b = 0.6 , a = b = 0.8 , a = b = 1.0 , a = b = 1.2 , and a = b = 1.4 . Figure 13a,b present three-dimensional diagrams depicting the influence of a and b on the evolution of the supply–demand matching mechanism, assuming initial propensities for high-involvement or proactive strategies ( x = y = z = 0.5 ) among all three parties. The results demonstrate that the trajectories for a = b = 0.6 , a = b = 0.8 , a = b = 1.0 , a = b = 1.2 , and a = b = 1.4 uniformly converge to the equilibrium ( 1,1 , 1 ), as predicted by evolutionary game theory [56].
Figure 13c,d quantify the impact of a and b on governance entities’ adoption of high-involvement strategies under identical initial conditions ( x = y = z = 0.5 ). The analysis reveals the symmetric influence of a and b : increasing these coefficients significantly decelerates the convergence rate toward 1, particularly when a or b exceeds 1.2; this indicates a nonlinear negative correlation [57] between effort coefficients and governance entities’ strategic intensity, with diminishing marginal regulatory incentives beyond a , b > 1.2 . Figure 13e,g isolate the effect of coefficient a on proactive strategy adoption by collaborative innovation platforms and demand-side entities, respectively. Figure 13e shows negligible variation in evolutionary trajectories with increasing a , suggesting the statistical insignificance of a on platform strategy selection. Conversely, Figure 13g demonstrates a positive monotonic relationship between a and demand-side entities’ convergence speed, with higher a values accelerating equilibrium attainment. Similarly, Figure 13f,h evaluate the impact of coefficient b . Figure 13f confirms a robust positive correlation between b and collaborative innovation platforms’ proactive strategy adoption, aligning with principal–agent theory predictions [58]. Figure 13h, however, reveals no statistically meaningful influence of b on demand-side entities’ strategic evolution.
(2) Impact of risk coefficients c 1 and c 2
As illustrated in Figure 14, the strategy evolution paths were simulated under four configurations of risk coefficients: c 1 = 0.2 and c 2 = 0.2; c 1 = 0.5 and c 2 = 0.2; c 1 = 0.8 and c 2 = 0.2; and c 1 = 1 and c 2 = 0.2. Figure 14a,b present three-dimensional phase diagrams of the technological innovation supply–demand matching mechanism under the initial willingness x = y = z = 0.5 , where all three parties adopt high-involvement or proactive strategies. The trajectories under all c 1 c 2 combinations exhibit global convergence to the equilibrium ( 1,1 , 1 ).
Figure 14c,e,g demonstrate the sensitivity of c 1 to strategic engagement levels when x = y = z = 0.5 . As shown in Figure 14c,e, c 1 demonstrates limited sensitivity to the governance entities’ high-involvement strategies and the collaborative innovation platforms’ proactive matching strategies. However, Figure 14g reveals a significant negative correlation: increasing c 1 decelerates the convergence rate of the demand-side entities’ proactive strategy adoption toward 1.
Figure 14d,f,h quantify the effects of c 2 under identical initial conditions. Figure 14d,h indicate the negligible sensitivity of c 2 to the governance entities’ high-involvement strategies and the demand-side entities’ proactive engagements. Conversely, Figure 14f identifies a robust negative impact: higher c 2 values reduce the convergence speed of collaborative innovation platforms’ proactive strategy selection.
(3) Impact of additional benefit L
As demonstrated in Figure 15, strategy evolution trajectories were simulated under three configurations of the additional benefit coefficient: L = 80 ,   L = 100 ,   a n d L = 120 . Figure 15a displays the three-dimensional phase diagram of the supply–demand matching mechanism under the initial willingness x = y = z = 0.5 , where all three parties adopt high-involvement or proactive strategies. The trajectories for all L values globally converged to the equilibrium ( 1,1 , 1 ), indicating system stability under parametric variations.
Figure 15b–d quantify the heterogeneous effects of L on strategic engagements. Figure 15b reveals a marginally negative correlation between L and governance entities’ adoption of high-involvement strategies, suggesting limited policy sensitivity. Conversely, Figure 15c,d establish statistically significant positive impacts: increasing L accelerated the convergence rates of both collaborative innovation platforms and demand-side entities toward proactive matching strategies.
(4) Impact of subsidy R :
As depicted in Figure 16, the strategy evolution trajectories were computed under four subsidy levels: R = 20 ,   R = 25 ,   R = 30 ,   a n d   R = 40 . Figure 16a presents the three-dimensional phase diagram of the supply–demand matching mechanism under initial conditions x = y = z = 0.5 , where all parties adopt high-involvement or proactive strategies. The system exhibits bifurcation behavior: trajectories with R = 20 converge to ( 1,1 , 1 ), while those with R 30 evolve toward ( 0,1 , 1 ). The critical threshold R = 25 demarcates these dual equilibrium regimes.
Figure 16b–d quantify the differential impacts of R . As evidenced by Figure 16b, the subsidy R exerts a non-monotonic bidirectional impact on governance entities’ adoption of high-involvement strategies. When R < 25 , the trajectory evolves toward x = 1 but demonstrates a negative marginal effect where increased subsidies paradoxically reduce strategic engagement. Conversely, when R > 25 , the system bifurcates toward x = 0 , revealing a positive policy elasticity as higher subsidies incentivize governance entities to transition toward low-involvement strategies.
Figure 16c,d reveal weakly positive correlations between R and the proactive strategies of collaborative innovation platforms and demand-side entities. These statistically insignificant coefficients suggest limited incentive effects under current low-subsidy parameterization ( R 25 ), consistent with the theory of diminishing marginal returns.
(5) Impact of penalty F :
Figure 17 illustrates the strategy evolution trajectories under three penalty configurations: F = 30 , F = 40 , and F = 50 . Figure 17a displays the three-dimensional phase diagram of the innovation supply–demand matching dynamics, initialized at x = y = z = 0.5 (uniform propensity for high-involvement strategies). All trajectories exhibit strong convergence to the equilibrium ( 1,1 , 1 ), indicating system robustness across penalty magnitudes. This monostable behavior contrasts with the bifurcation patterns observed under subsidy interventions (cf. Figure 17), suggesting penalty mechanisms induce strategy alignment through coercive coordination.
Figure 17b–d decompose the directional effects of F . Figure 17b reveals the weakly negative elasticity of governance entities’ high-involvement strategy adoption to penalty escalation. In contrast, Figure 17c,d demonstrate positive yet inelastic responses from collaborative innovation platforms and demand-side entities. These low-sensitivity coefficients align with institutional theory predictions, where formal penalties exhibit limited efficacy in enhancing voluntary cooperation compared to normative pressures.

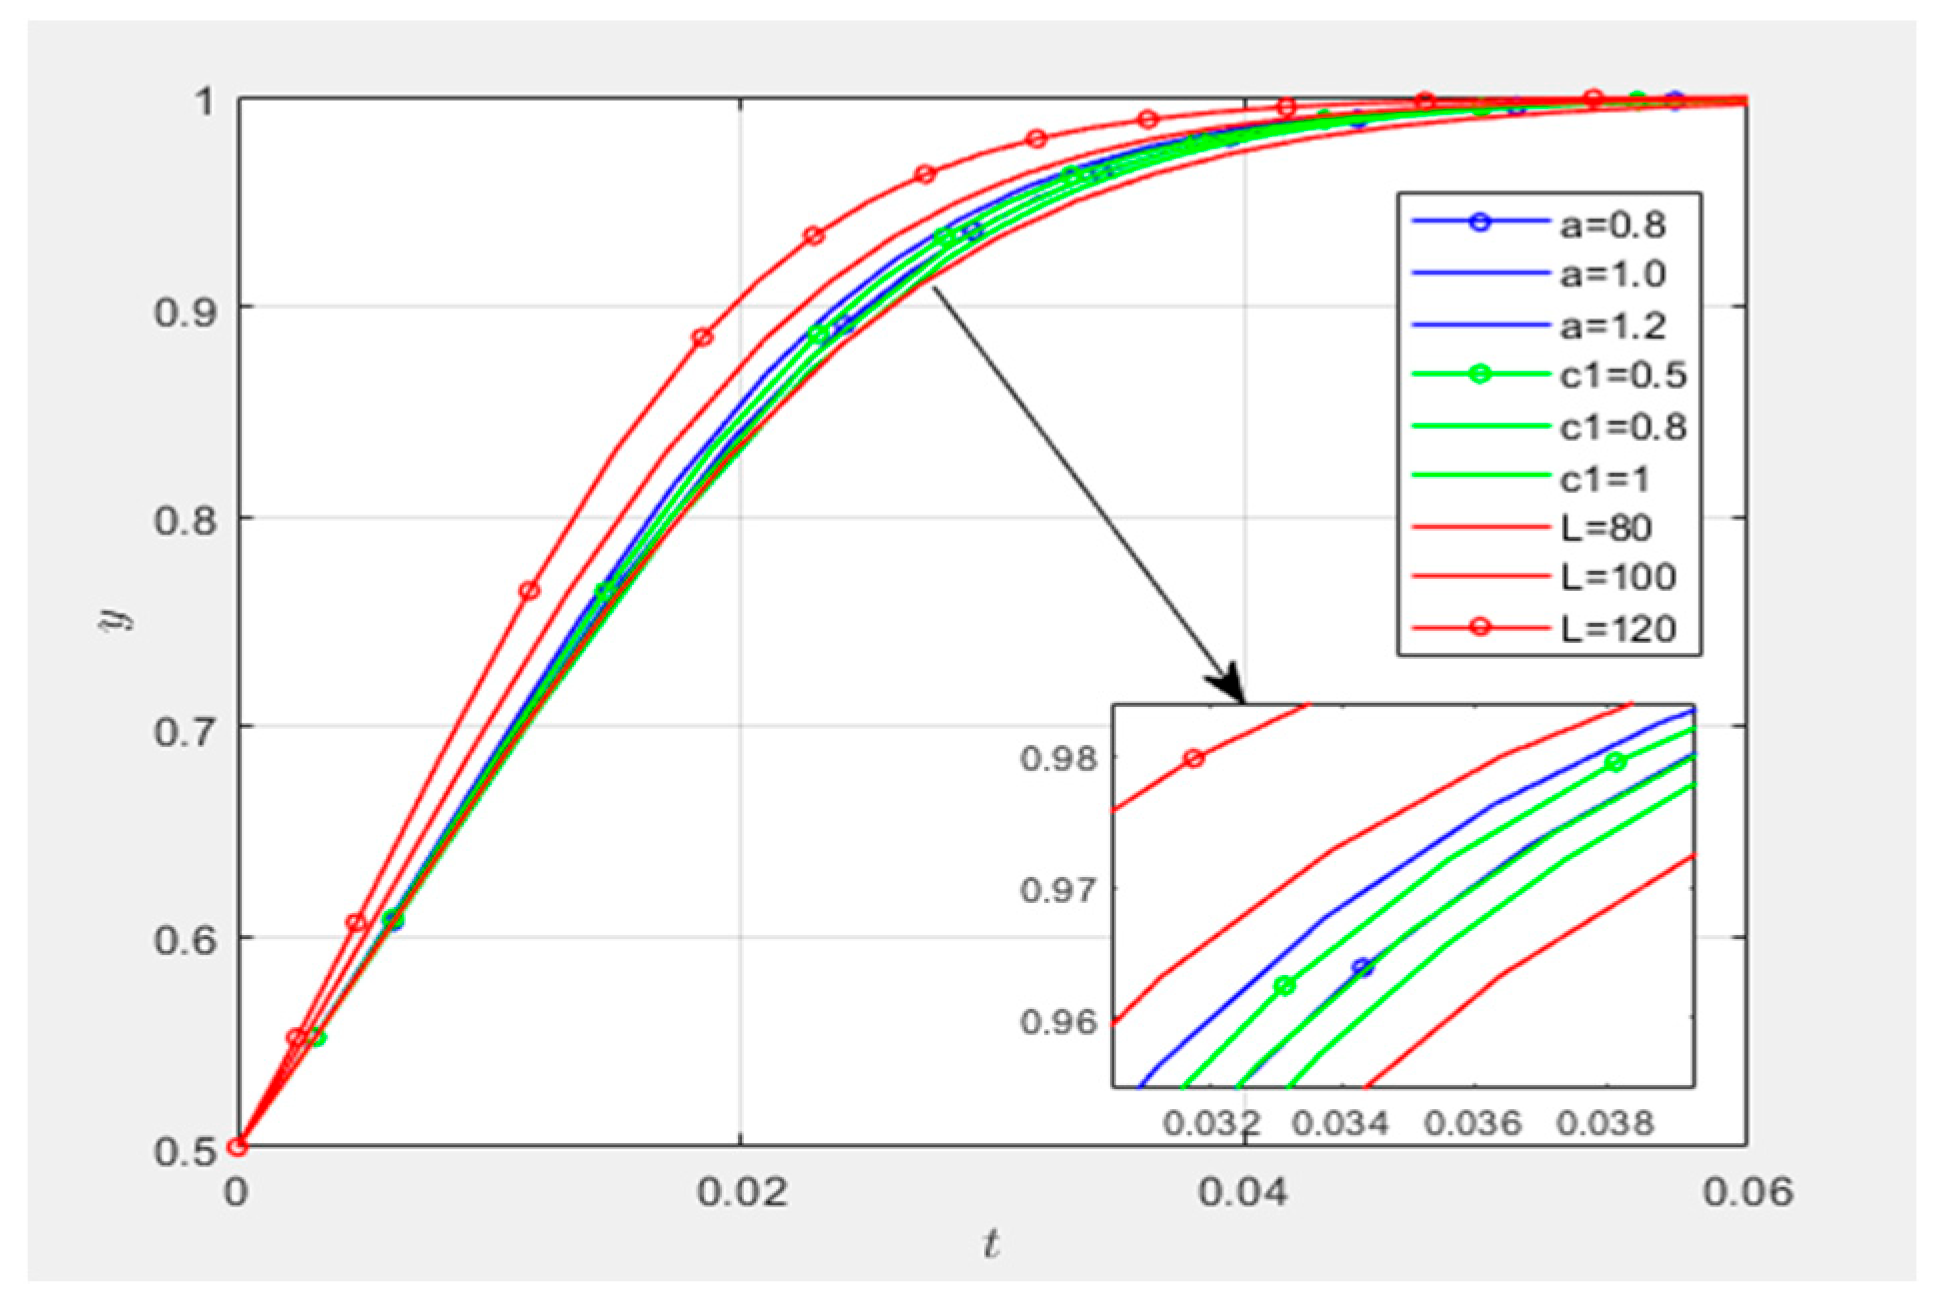
5.3. Comparative Sensitivity Analysis of Key Agents’ Game-Theoretic Parameters

Building upon the preceding entity-specific sensitivity analyses, this section conducts a systematic cross-entity comparative analysis of parameter elasticities among governance entities, collaborative innovation platforms, and demand-side entities. The objective is to elucidate the entity-differentiated pathways for optimizing the innovation supply–demand matching mechanism, thereby identifying the equilibrium-refined parameter configurations that maximize coordination efficiency under heterogeneous institutional logics.
(1) Determination of optimal parameters for governance entity-centric innovation supply–demand matching:
Figure 18 synthesizes all parameters influencing governance entities’ adoption of high-involvement strategies in innovation supply–demand matching, accompanied by longitudinal sensitivity comparisons. Figure 18a,b demonstrate negative correlations between matching effort coefficients a and b and governance entities’ strategic engagement intensity. Figure 18c–e,g demonstrate the positive impacts of risk coefficients c1 and c2, additional benefit L, and penalty intensity (F) on governance entities’ adoption of high-involvement strategies. Figure 18f exhibits threshold-dependent subsidy effects: subsidies below 25 units (R < 25) suppress high-involvement strategy adoption, whereas those exceeding 25 units (R > 25) incentivize strategic disengagement.
Parametric sensitivity analysis identifies matching effort coefficients a and b and subsidy threshold R as dominant control variables. These key variables were subsequently simulated within a unified phase space to quantify their differential convergence rates toward evolutionary stable strategies (ESSs).
Figure 19 compares the evolutionary convergence rates of matching effort coefficients (a, b) and subsidies (R) under unified parametric simulation. When the initial strategic engagement propensities of all three parties are set at x = y = z = 0.5, coefficients a and b exhibit symmetric negative elasticity on governance entities’ high-involvement strategy adoption. This aligns with real-world dynamics: when collaborative innovation platforms and demand-side entities actively engage in research matching, governance entities’ intensive intervention becomes redundant. Market-driven self-organization between demand-side entities and platforms creates bidirectional positive feedback, where excessive governance involvement may induce institutional inertia, undermining emergent efficiency. Subsidy R demonstrates an amplified influence on strategic orientation. Under baseline conditions (initial revenue G1 = 100, participation cost G2 = 50), R < 25 (i.e., below 50% cost threshold) negatively correlates with governance engagement intensity. Curves with R = 10/20 show decelerated convergence toward full engagement (state 1), indicating diminishing marginal returns. Market actors’ self-regulating capacities explain this phenomenon: sub-R25 subsidies signal mature market alignment, rendering governance intervention counterproductive through efficiency erosion. The critical threshold emerges at R = 25, where governance entities achieve zero net benefit from high-involvement strategies regardless of other parties’ engagement levels. Beyond R > 25, subsidy escalation accelerates strategic disengagement (curves with R = 30/40 rapidly converge to state 0). This reflects two mechanisms: (i) resource reallocation calculus redirects governance resources to higher social-return projects and (ii) subsidy dependency undermines market actors’ innovation incentives, necessitating governance restraint to preserve organic innovation ecosystems.
(2) Optimal parameter determination for technological innovation supply–demand matching centered on collaborative innovation platforms:
Figure 20 synthesizes all parameters influencing collaborative innovation platforms’ adoption of proactive matching strategies, conducting longitudinal sensitivity analysis. Subfigures (a), (b), (e), (f), and (g) illustrate the positive correlations between matching effort coefficients (a, b), additional benefits (L), subsidies (R), and platforms’ strategic proactivity. Conversely, subfigures (c) and (d) reveal the negative impacts of risk coefficients (c1, c2) on strategic activation. As evidenced by subplots (b), (d), and (e), the matching effort coefficient b, risk coefficient c2, and additional benefit L exhibit notably higher parametric sensitivity compared to the other variables, necessitating their comparative evolutionary rate analysis under unified parametric simulation.
Figure 21 presents a comparative analysis of evolutionary rates for collaborative innovation platforms’ matching effort coefficient ( b ), risk coefficient ( c 2 ), and additional benefits ( L ) within a unified parametric framework. (1) When the tripartite entities (governance entities, collaborative innovation platforms, and demand-side entities) adopt high-involvement or proactive strategies with initial willingness parameters x = y = z = 0.5 , the three evolutionary trajectories of L demonstrate the fastest convergence rates, followed by coefficient b , with c 2 exhibiting the slowest progression. This hierarchy confirms L as the most significant enabler for platforms’ proactive adoption of supply–demand matching strategies in technological innovation, while c 2 emerges as the primary inhibitor. (2) Empirical validation reveals dual mechanisms: the prominence of L derives from its capacity to deliver substantial incentives that enhance platforms’ academic–industrial reputation capital, thereby attracting high-quality research teams and resources. Anticipated additional benefits motivate increased resource allocation (financial, human, temporal) to optimize research matching processes while also serving as competitive differentiators that improve institutional participation elasticity and team retention rates.
Conversely, the reason why c 2 acts as the most significant inhibitory parameter is that the high uncertainty in research demand matching makes collaborative innovation platforms apprehensive about failing to achieve expected returns after resource investments. High-precision supply–demand matching necessitates resource inputs—including human, technological, and financial resources—that far exceed routine levels, which deters collaborative innovation platforms from proactive engagement. Most critically, if the final outcome of research demand matching remains mediocre even with substantial resource commitments, collaborative innovation platforms not only incur heavy resource expenditures but also face accountability pressures from governance entities or national regulatory authorities.
(3) Determination of optimal parameters for technological innovation supply–demand matching centered on demand-side entities:
All parameters influencing demand-side entities’ adoption of proactive matching strategies are shown in Figure 22 for longitudinal comparative sensitivity analysis. Figure 22a,b,e–g illustrate the positive impacts of matching effort coefficients a and b, additional benefit L, and subsidy R on demand-side entities’ proactive matching strategies. Figure 22 c,d demonstrate the negative impacts of risk coefficients c1 and c2 on such strategies. As shown in Figure 22a,c,e, the curve sensitivities of matching effort coefficient a, risk coefficient c1, and additional benefit L are significantly higher than those of the other curves; thus, they were simulated within the same parametric diagram to re-compare their evolutionary rates.
Figure 23 compares the evolutionary rates of demand-side entities’ matching effort coefficient a , risk coefficient c 1 , and additional benefit L simulated within the same parametric diagram.
When the initial willingness of all three parties to adopt high-involvement or proactive strategies is x = y = z = 0.5, the two curves of the additional benefit parameter L ( L = 120 ,   L = 100 ) exhibit the highest evolutionary rates, followed by the curve of the demand-side matching effort coefficient a , and finally the curve of the demand-side risk coefficient c 1 . This indicates that the strategic choices of demand-side entities and collaborative innovation platforms are broadly aligned, with L being the most significant factor promoting demand-side entities’ adoption of proactive matching strategies, while the risk coefficient c 1 is the most significant inhibitory factor. Notably, for demand-side entities, the evolutionary rate of the L = 80 curve is far lower than that of all other curves, suggesting that L = 100 may represent a threshold for strategic choice. When L < 100 , demand-side entities’ willingness to adopt proactive matching strategies decreases significantly. Based on this, the research concludes that, compared to collaborative innovation platforms, demand-side entities place greater emphasis on the additional benefit gained from successful sci-tech innovation matching. This conclusion aligns with real-world observations.
On one hand, L acts as the most significant promotive parameter because the additional benefit provides direct economic incentives for demand-side entities, motivating them to engage in proactive research demand matching. These benefits serve as drivers for demand-side entities to pursue scientific innovation and exploration, particularly when research success yields substantial economic returns. Anticipated additional benefits may lead demand-side entities to allocate necessary resources—such as time, effort, and funding—to increase the success rate of technological innovation supply–demand matching. L = 100 likely represents a psychological threshold for demand-side entities’ expected returns from successful matching. Below this value, demand-side entities may perceive the returns as insufficient to justify the costs and efforts of participation. This threshold could be a critical decision point for adopting proactive strategies. When L < 100 , demand-side entities may opt for passive matching and reduce investments, deeming proactive strategies inadequately rewarding. On the other hand, c 1 acts as the most significant inhibitory parameter because demand-side entities may avoid proactive strategies due to perceived risks in the matching process. A high risk coefficient reflects low risk tolerance, prompting conservative decision-making. Elevated c 1 values may deter entities from adopting proactive strategies over fears that the costs outweigh the benefits. Additionally, demand-side entities may experience anxiety about uncertainties in the matching process, further inhibiting proactive engagement, as they prioritize avoiding scenarios with potential failure or losses.

6. Conclusions and Recommendations

6.1. Conclusions

This study constructs an evolutionary game model for the supply–demand matching of technological innovation in major railway projects and analyzes the impacts of critical factors, including matching effort coefficients, subsidy coefficients, additional benefits, and risk coefficients, on strategy selection by key stakeholders. Through numerical simulations, the influences of initial states and related factors were more intuitively illustrated. The principal findings are summarized as follows:
(1) The technological innovation supply–demand matching mechanism evolves through three phases: the initial phase, the development phase, and the maturity phase. It transitions from rigid matching to short-term matching and ultimately achieves steady-state matching through the joint efforts of governance entities, demand-side entities, and collaborative innovation platforms. The steady-state balance of risks and benefits in the mechanism relies on key stakeholders establishing an implicit rule through repeated games: “long-term gains from compliance significantly outweigh short-term gains from defection”. Through risk sharing, benefit sharing, and information transparency, proactive strategies become dominant equilibria. This stability exhibits disturbance resistance; even short-term strategic fluctuations are corrected as accumulated credibility records and experiential knowledge within the mechanism guide stakeholders back to equilibrium. (2) In the technological innovation supply–demand matching process, the initial probability states of governance entities adopting “high-involvement” strategies, collaborative innovation platforms adopting “proactive matching” strategies, and demand-side entities adopting “proactive matching” strategies do not affect the final strategic choices of the three parties but only influence the time required to reach stability. (3) Among parameters influencing the mechanism, subsidy R is the most significant factor affecting governance entities’ adoption of high-involvement strategies. (4) For collaborative innovation platforms, additional benefit L is the strongest promotive factor for adopting proactive matching strategies, while risk coefficient c2 is the most significant inhibitory factor. (5) For demand-side entities, the effects of additional benefit L and risk coefficient c1 mirror those observed for collaborative innovation platforms. Notably, compared to collaborative innovation platforms, demand-side entities place greater emphasis on additional benefits derived from successful sci-tech innovation matching.

6.2. Research Implications

This study differentiates itself from existing supply–demand research predominantly focused on static matching decision-making models. By concentrating on the dynamic evolution among core matching entities, we develop and solve a tripartite evolutionary game model encompassing governance entities, demand-side entities, and collaborative innovation platforms. Through systematic analysis of three critical phases in technological innovation supply–demand matching evolution, this research creates dynamic simulations of strategic selections across different stages. This work significantly expands the application scope of evolutionary game theory in mega-railway engineering construction and technological innovation systems.
The findings of this study can provide references for administrative departments involved in technological innovation activities within mega projects, aiming to enhance the conversion rate of scientific and technological innovations and promote breakthroughs in core technologies. The following recommendations are proposed: (1) Given the significant impact of the subsidy coefficient, we recommend designing a dynamic subsidy regulation mechanism to balance policy rigidity and flexibility. (2) Considering the significant impact of the additional benefit coefficient, it is advised to optimize existing value-added designs targeting additional benefits, L, to activate proactive matching tendencies on collaborative innovation platforms. (3) In response to the significant impact of the risk coefficient, multi-level risk-sharing mechanisms should be established. Institutional designs should deeply combine demand-side research objectives with platform resource investments, transforming innovation risks borne by single entities into shared risk pools.

6.3. Limitations and Future Research Directions

The parameter settings of the model exhibit certain subjectivity. On the one hand, the core parameters in the evolutionary game model require calibration based on real-world data, yet practical data acquisition faces barriers, leading to excessive reliance on expert empirical methods or historical case derivation for parameter determination, which may compromise the universality of model conclusions. On the other hand, to simplify complex system analysis, the model fails to fully consider knowledge demand disparities across different phases of mega-railway projects, including survey and design, construction, and operation/maintenance. Future research should introduce machine learning technologies to optimize multi-agent matching algorithms through demand feature extraction and pattern recognition under asymmetric information. Simultaneously, a “phase–module”-coupled evolutionary game framework could be developed, integrating knowledge flow mapping throughout the whole engineering lifecycle, to achieve precise allocation and dynamic tracking of differentiated scientific research resources.

Author Contributions

Conceptualization, methodology, validation, writing—original draft, writing—reviewing and editing, X.Z.; supervision, resources, project administration, Y.L.; investigation, data curation, visualization, software, formal analysis, X.L. All authors have read and agreed to the published version of the manuscript.

Funding

This research was funded by Fundamental Research Funds for the Central Universities (Contract No. 2022YJS050).

Data Availability Statement

The data that support the findings of this study were collected by the author through the questionnaire.

Acknowledgments

The authors express their sincere gratitude to the State Key Laboratory for Track Technology of High-speed Railway for assistance in the observation of the relevant processes and in conducting on-site interviews. Special appreciation also goes to the editors and reviewers whose constructive and invaluable comments and suggestions played a decisive role in significantly improving the quality of this article.

Conflicts of Interest

The authors declare no conflicts of interest. The funders had important coordination roles in the data collection.

References

  1. Davies, A.; Gann, D.; Douglas, T. Innovation in Megaprojects: Systems Integration at London Heathrow Terminal 5. Calif. Manag. Rev. 2009, 51, 101–125. [Google Scholar] [CrossRef]
  2. Cantarelli, C.C.; Genovese, A. Innovation potential of megaprojects: A systematic literature review. Prod. Plan. Control 2023, 34, 1350–1370. [Google Scholar] [CrossRef]
  3. Jia, F.; Wang, D. Research on innovation decisions in industry-university-research cooperation based on differential games. Technol. Anal. Strateg. Manag. 2023, 1–20. [Google Scholar] [CrossRef]
  4. Wu, Y.; Gu, X.; Tu, Z.; Zhang, Z. System dynamic analysis on industry-university-research institute synergetic innovation process based on knowledge flow. Scientometrics 2022, 127, 1317–1338. [Google Scholar] [CrossRef]
  5. Chen, D.; Yan, G. Evolutionary Model and Countermeasures of Industry-University-Research Collaborative Innovation in Local Engineering College from the Perspective of Game Theory. J. Coast. Res. 2020, 104 (Suppl. 1), 951–955. [Google Scholar] [CrossRef]
  6. Song, Y.; Zhang, J.; Song, Y.; Fan, X.; Zhu, Y.; Zhang, C. Can industry-university-research collaborative innovation efficiency reduce carbon emissions? Technol. Forecast. Soc. Change 2020, 157, 120094. [Google Scholar] [CrossRef]
  7. Xu, A.; Qiu, K.; Zhu, Y. The measurements and decomposition of innovation inequality: Based on Industry∓University∓Research perspective. J. Bus. Res. 2023, 157, 113556. [Google Scholar] [CrossRef]
  8. Chen, K.; Zhang, Y.; Zhu, G.; Mu, R. Do research institutes benefit from their network positions in research collaboration networks with industries or/and universities? Technovation 2020, 94–95, 102002. [Google Scholar] [CrossRef]
  9. Bai, X.-J.; Li, Z.-Y.; Zeng, J. Performance evaluation of China’s innovation during the industry-university-research collaboration process—An analysis basis on the dynamic network slacks-based measurement model. Technol. Soc. 2020, 62, 101310. [Google Scholar] [CrossRef]
  10. He, Q.; Chen, X.; Wang, G.; Zhu, J.; Yang, D.; Liu, X.; Li, Y. Managing social responsibility for sustainability in megaprojects: An innovation transitions perspective on success. J. Clean. Prod. 2019, 241, 118395. [Google Scholar] [CrossRef]
  11. Zhu, J.; Chen, J.; Jin, W.; Li, Q. Developing incentive mechanisms for long-term and short-term technological innovation in major engineering projects using principal-agent theory. Eng. Constr. Archit. Manag. 2023, 32, 1947–1969. [Google Scholar] [CrossRef]
  12. Zhao, N.; Fan, D.; Chen, Y.; Wu, C. Impact of innovation organization network on the synergy of cross-organizational technological innovation: Evidence from megaproject practices in China. J. Civ. Eng. Manag. 2023, 29, 50–66. [Google Scholar] [CrossRef]
  13. Tang, Q.; Wang, C.; Feng, T. Research on the Group Innovation Information-Sharing Strategy of the Industry–University–Research Innovation Alliance Based on an Evolutionary Game. Mathematics 2023, 11, 4161. [Google Scholar] [CrossRef]
  14. Chen, X.; Liu, Y.; Locatelli, G.; He, Q.; Zhang, X. Exploring dynamics of stakeholder salience and functional roles in megaproject collaborative innovation system: Insights from the Hong Kong-Zhuhai-Macao Bridge. Eng. Constr. Archit. Manag. 2024; epub ahead of printing. [Google Scholar] [CrossRef]
  15. Jin, Z.; Zeng, S.; Chen, H.; Shi, J.J. Creating value from diverse knowledge in megaproject innovation ecosystems. Int. J. Proj. Manag. 2022, 40, 646–657. [Google Scholar] [CrossRef]
  16. Robertson, J.; Caruana, A.; Ferreira, C. Innovation performance: The effect of knowledge-based dynamic capabilities in cross-country innovation ecosystems. Int. Bus. Rev. 2023, 32, 101866. [Google Scholar] [CrossRef]
  17. Guo, Z.; Wang, Q.; Jing, H.; Gao, Q. How to promote the technological innovation cooperation in mega construction projects at the project level? Eng. Constr. Archit. Manag. 2025. [Google Scholar] [CrossRef]
  18. Chen, H.; Jin, Z.; Su, Q.; Yue, G. The roles of captains in megaproject innovation ecosystems: The case of the Hong Kong-Zhuhai-Macau Bridge. Eng. Constr. Arch. Manag. 2020, 28, 662–680. [Google Scholar] [CrossRef]
  19. Wiesweg, N.; Schäpers, P.; Bernhold, T.; Hartmann, T. On the challenges of inter-organisational data in real estate: The role of knowledge sharing. Eng. Constr. Arch. Manag. 2024, 31, 247–263. [Google Scholar] [CrossRef]
  20. Xue, S.; Chen, S. The acceptance of digital intelligence technology in megaproject organisations from the perspective of innovation diffusion. Technol. Anal. Strateg. Manag. 2023, 1–16. [Google Scholar] [CrossRef]
  21. He, Z.; Wang, H.; Hu, Y.; Ma, X.; Zhao, H. Dynamic analysis and optimal control of knowledge diffusion model in regional innovation ecosystem under digitalization. Sci. Rep. 2024, 14, 13124. [Google Scholar] [CrossRef]
  22. Qiu, Y.; Chen, H.; Sheng, Z.; Cheng, S. Governance of institutional complexity in megaproject organizations. Int. J. Proj. Manag. 2019, 37, 425–443. [Google Scholar] [CrossRef]
  23. Papadonikolaki, D.E.; Morgan, D.B.; Papachristos, D.G. Megaprojects as niches of sociotechnical transitions: The case of digitalization in UK construction. Environ. Innov. Soc. Transition 2023, 48, 100728. [Google Scholar] [CrossRef]
  24. Liu, H.; Wu, Q. Evolutionary game analysis on technological innovation strategies of marine ranching enterprises considering government’s incentive policies and consumer preferences. Front. Mar. Sci. 2024, 11, 1470846. [Google Scholar] [CrossRef]
  25. Ali, A.; Ma, L.; Shahzad, M.; Hussain, S. Managing stakeholder pressure for megaproject success and green innovation: The key role of social responsibility. Eng. Manag. J. 2024, 36, 366–377. [Google Scholar] [CrossRef]
  26. Quint, T. The Lattice of Core (Sub)Matchings in a Two-Sided Matching Market. Math. Oper. Res. 1994, 19, 603–617. [Google Scholar] [CrossRef]
  27. Yu, D.; Xu, Z. Intuitionistic fuzzy two-sided matching model and its application to personnel-position matching problems. J. Oper. Res. Soc. 2020, 71, 312–321. [Google Scholar] [CrossRef]
  28. Han, T.; Lu, J.; Zhang, H. Two-sided matching model of service providers and demanders considering peer and synergy effects. Heliyon 2023, 9, e14732. [Google Scholar] [CrossRef]
  29. Tozlu, B.; Akgunduz, A.; Zeng, Y. Unbiased criteria identification for two-sided matching: An environment-based design approach. Expert Syst. Appl. 2025, 277, 127233. [Google Scholar] [CrossRef]
  30. Zhang, Z.; Kou, X.; Yu, W.; Gao, Y. Consistency improvement for fuzzy preference relations with self-confidence: An application in two-sided matching decision making. J. Oper. Res. Soc. 2021, 72, 1914–1927. [Google Scholar] [CrossRef]
  31. Cai, M.; Hu, S.; Wang, Y.; Xiao, J. A Dynamic Social Network Matching Model for Virtual Power Plants and Distributed Energy Resources with Probabilistic Linguistic Information. Sustainability 2022, 14, 14920. [Google Scholar] [CrossRef]
  32. Liu, L.; Zhang, C.; Wang, Z.; Liu, Y. Green technology investment selection with carbon price and competition: One-to-many matching structure. J. Clean. Prod. 2024, 434, 139893. [Google Scholar] [CrossRef]
  33. Jia, H. The even split rule in positive assortative matching. J. Math. Econ. 2019, 81, 57–61. [Google Scholar] [CrossRef]
  34. Pan, S. Exploding offers and unraveling in two-sided matching markets. Int. J. Game Theory 2018, 47, 351–373. [Google Scholar] [CrossRef]
  35. Aouad, A.; Saban, D. Online Assortment Optimization for Two-Sided Matching Platforms. Manag. Sci. 2023, 69, 2069–2087. [Google Scholar] [CrossRef]
  36. Yin, S.; Li, B. Matching management of supply and demand of green building technologies based on a novel matching method with intuitionistic fuzzy sets. J. Clean. Prod. 2018, 201, 748–763. [Google Scholar] [CrossRef]
  37. Jiang, P.; Guo, S.; Du, B.; Guo, J. Two-sided matching decision-making model for complex product system based on life-cycle sustainability assessment. Expert Syst. Appl. 2022, 208, 118184. [Google Scholar] [CrossRef]
  38. Liang, R.; Wu, C.; Sheng, Z.; Wang, X. Multi-Criterion Two-Sided Matching of Public–Private Partnership Infrastructure Projects: Criteria and Methods. Sustainability 2018, 10, 1178. [Google Scholar] [CrossRef]
  39. Ivascu, L.; Cirjaliu, B.; Draghici, A. Business Model for the University-industry Collaboration in Open Innovation. Procedia Econ. Financ. 2016, 39, 674–678. [Google Scholar] [CrossRef]
  40. Zhao, X.; Liu, Y.; Lang, X.; Liu, K.; Yang, X.; Liu, L. Study on the Characteristics and Operational Mechanisms of Industry–University–Research Collaborative Innovation in Megaprojects: The Case from China. Systems 2024, 12, 553. [Google Scholar] [CrossRef]
  41. Xiao, T.; Wang, H.; Chen, J. Evaluation of operational efficiency of technology transfer ecosystems from the perspective of supply and demand matching: An empirical study in China. J. Technol. Transf. 2025. [Google Scholar] [CrossRef]
  42. Capaldo, A.; Lavie, D.; Petruzzelli, A.M. Knowledge Maturity and the Scientific Value of Innovations. J. Manag. 2017, 43, 503–533. [Google Scholar] [CrossRef]
  43. McCabe, A.; Parker, R.; Osegowitsch, T.; Cox, S. Overcoming barriers to knowledge co-production in academic–practitioner research collaboration. Eur. Manag. J. 2023, 41, 212–222. [Google Scholar] [CrossRef]
  44. Zhang, S.-J.; Lu, X.-D.; Wang, S.-P.; Guo, W. Supply-Demand Matching in Non-Cooperative Social Networks. IEEE Access 2020, 8, 162458–162466. [Google Scholar] [CrossRef]
  45. Liu, Y.; Li, K.W. A two-sided matching decision method for supply and demand of technological knowledge. J. Knowl. Manag. 2017, 21, 592–606. [Google Scholar] [CrossRef]
  46. Luo, T.; Qu, J.; Cheng, S. Knowledge Network Embeddedness and Innovation Resilience. IEEE Trans. Eng. Manag. 2024, 71, 11454–11462. [Google Scholar] [CrossRef]
  47. Li, J.; Peng, D.; Zheng, L.; Yuan, L.; Li, R. Cooperative R&D networks embeddedness and innovation resilience: The moderating role of environmental turbulence. Eur. J. Innov. Manag. 2024; epub ahead of printing. [Google Scholar] [CrossRef]
  48. Han, J.; Li, B.; Liang, H.; Lai, K.K. A novel two-sided matching decision method for technological knowledge supplier and demander considering the network collaboration effect. Soft Comput. 2018, 22, 5439–5451. [Google Scholar] [CrossRef]
  49. Zhou, Q.; Deng, X. A configuration analysis on knowledge transfer between projects: From horizontal and vertical perspectives. Eng. Constr. Archit. Manag. 2024, 32, 3349–3374. [Google Scholar] [CrossRef]
  50. Dulipovici, A.; Baskerville, R. An eduction model of disciplinary emergence: The ripples of knowledge management. Knowl. Manag. Res. Pract. 2015, 13, 115–133. [Google Scholar] [CrossRef]
  51. Sergeeva, N.; Zanello, C. Championing and promoting innovation in UK megaprojects. Int. J. Proj. Manag. 2018, 36, 1068–1081. [Google Scholar] [CrossRef]
  52. Liu, N.; Zhou, G. Analysis of Collaborative Innovation Behavior of Megaproject Participants Under The Reward and Punishment Mechanism. Int. J. Strateg. Prop. Manag. 2022, 26, 241–257. [Google Scholar] [CrossRef]
  53. Qian, Y.; Yu, X.; Chen, X.; Song, M. Research on stability of major engineering technology innovation consortia based on evolutionary game theory. Comput. Ind. Eng. 2023, 186, 109734. [Google Scholar] [CrossRef]
  54. Zhong, Q.; Cui, H.; Yang, M.; Ling, C. Research on Stochastic Evolution Game of Green Technology Innovation Alliance of Government, Industry, University, and Research with Fuzzy Income. Sustainability 2025, 17, 2294. [Google Scholar] [CrossRef]
  55. Chen, X.; He, Q.; Zhang, X.; Cao, T.; Liu, Y. What Motivates Stakeholders to Engage in Collaborative Innovation in the Infrastructure Megaprojects? J. Civ. Eng. Manag. 2021, 27, 579–594. [Google Scholar] [CrossRef]
  56. Maynard Smith, J. Evolution and the Theory of Games, 1st ed.; Cambridge University Press: Cambridge, UK, 1982. [Google Scholar]
  57. Hofbauer, J.; Sigmund, K. Evolutionary Games and Population Dynamics, 1st ed.; Cambridge University Press: Cambridge, UK, 1998. [Google Scholar]
  58. Holmstrom, B. Moral Hazard and Observability. Bell J. Econ. 1979, 10, 74. [Google Scholar] [CrossRef]
Figure 1. Logical relationship diagram of supply–demand matching based on tripartite evolutionary game.
Systems 13 00434 g001
Figure 2. Phase diagram of strategy evolution for China Railway Group.
Systems 13 00434 g002
Figure 3. Phase diagram of strategy evolution for collaborative innovation platform.
Systems 13 00434 g003
Figure 4. Phase diagram of strategy evolution for major project user.
Systems 13 00434 g004
Figure 5. Stability analysis of E 4   ( 0 , 1 , 1 ) .
Systems 13 00434 g005
Figure 6. Stability analysis of E 6   ( 1 , 1 , 0 ) .
Systems 13 00434 g006
Figure 7. Stability analysis of E 7   ( 1 , 0 , 1 ) .
Systems 13 00434 g007
Figure 8. Stability analysis of E 8   ( 1 , 1 , 1 ) .
Systems 13 00434 g008
Figure 9. Evolution process of the system’s stable state.
Systems 13 00434 g009
Figure 10. Impact of initial willingness of China Railway Group.
Systems 13 00434 g010
Figure 11. Impact of initial willingness of collaborative innovation platforms.
Systems 13 00434 g011
Figure 12. Impact of initial willingness of major project users.
Systems 13 00434 g012
Figure 13. Impact of matching effort coefficients a and b.
Systems 13 00434 g013aSystems 13 00434 g013b
Figure 14. Impact of risk coefficients c 1 and c 2 .
Systems 13 00434 g014aSystems 13 00434 g014b
Figure 15. Impact of additional benefit L .
Systems 13 00434 g015
Figure 16. Impact of subsidy R .
Systems 13 00434 g016
Figure 17. Impact of punishment F .
Systems 13 00434 g017aSystems 13 00434 g017b
Figure 18. Comparison of parameter sensitivities.
Systems 13 00434 g018aSystems 13 00434 g018b
Figure 19. Comparison of parameter sensitivities.
Systems 13 00434 g019
Figure 20. Comparison of parameter sensitivities.
Systems 13 00434 g020aSystems 13 00434 g020b
Figure 21. Comparison of parameter sensitivities.
Systems 13 00434 g021
Figure 22. Comparison of parameter sensitivities.
Systems 13 00434 g022aSystems 13 00434 g022b
Figure 23. Comparison of parameter sensitivities.
Systems 13 00434 g023
Table 1. Related parameters and their meanings.
ParameterParameter Description
G 1 G 1 denotes governance entities’ payoff under a high-involvement strategy, with payoff normalized to 0 under a low involvement strategy (where G 1 > G 2 ).
G 2 G 2 represents governance entities′ administrative costs under a high-involvement strategy, with administrative costs normalized to 0 under a low-involvement strategy (where G 1 > G 2 ).
G 3 When both collaborative innovation platforms and demand-side entities adopt active matching strategies, high congruence between research demand and supply enables successful technological iteration/leapfrogging, generating social benefit G 3
G 4 The negative societal externality G 4 arising when both the collaborative innovation platform and demand-side entities adopt passive supply–demand matching strategies.
a a signifies demand-side entities’ matching effort coefficient, where higher values indicate more frequent collaborative/sharing behaviors during matching processes (baseline = 1).
b b represents collaborative innovation platforms’ matching effort coefficient, where higher values correspond to intensified coordination/sharing engagements (baseline = 1).
c 1 Asymmetric active/passive matching exposes unilateral active participants to innovation risks from low congruence between research demand and supply, with c 1 denoting demand-side entities’ risk coefficient.
c 2 Asymmetric active/passive matching exposes unilateral active participants to innovation risks from low congruence between research demand and supply, with c 2 denoting collaborative innovation platform’ risk coefficient.
a R Under the high-involvement strategy, governance entities provide demand-side entities adopting active matching with subsidy a R to enhance technological innovation supply–demand alignment in mega-railway projects.
b R Under the high-involvement strategy, governance entities provide subsidies b R to collaborative innovation platforms employing active matching strategies, thereby enhancing technological innovation supply–demand coordination in major railway engineering projects.
F Under a high-involvement strategy, governance entities impose a penalty F on passive matching actors, with the constraint G 1 G 2 > 2 F ensuring incentive compatibility.
U 1 U 1 denotes demand-side entities’ baseline payoff.
U 2 U 2 represents demand-side entities’ baseline participation costs in research alignment activities.
a L When both collaborative innovation platforms and demand-side entities adopt active matching strategies, demand-side entities obtain additional economic benefits a L because of technological problem resolution.
c 1 U 2 During technological innovation supply–demand matching processes, unilateral active matching by demand-side entities incurs extra technological innovation risk costs quantified as c 1 U 2
Table 2. Strategy set of tripartite game.
Collaborative Innovation Platforms
Active MatchingPassive Matching
Demand-Side Entities
ActivePassiveActivePassive
Governance
entities
high(high, active,
active)
(high, active,
passive)
(high, passive,
active)
(high, passive,
passive)
low(low, active,
active)
(low, active,
passive)
(low, passive,
active)
(low, passive,
passive)
Table 3. Payoff matrix of tripartite game.
StrategyGovernance Entities
( x )
Collaborative Innovation Platforms
( y )
Demand-Side Entities
( z )
( x , y , z ) G 1 + G 3 G 2 a R b R P 1 + b L + b R P 2 c 2 P 2 U 1 + a L + a R U 2 c 1 U 2
( x , y , 1 z ) G 1 + F G 2 b R P 1 + b R P 2 c 2 P 2 U 1 U 2 F
( x , 1 y , z ) G 1 + F G 2 a R P 1 P 2 F U 1 + a R U 2 c 1 U 2
( x , 1 y , 1 z ) G 1 + F + F G 2 G 4 P 1 P 2 F U 1 U 2 F
( 1 x , y , z ) G 3 P 1 + b L P 2 c 2 P 2 U 1 + a L U 2 c 1 U 2
( 1 x , y , 1 z ) 0 P 1 P 2 c 2 P 2 U 1 U 2
( 1 x , 1 y , z ) 0 P 1 P 2 U 1 U 2 c 1 U 2
( 1 x , 1 y , 1 z ) G 4 P 1 P 2 U 1 U 2
Table 4. Stability analysis of equilibrium points.
Equilibrium Points Eigenvalues Sign of the Real Part
λ 1 λ 2 λ 3
E 1 ( 0 , 0 , 0 ) 2 F + G 1 G 2 c 2 P 2 c 1 U 2 ( + , , )
E 2 ( 0 , 1 , 0 ) F + G 1 G 2 R b c 2 P 2 L a c 1 U 2 ( × , + , × )
E 3 ( 0 , 0 , 1 ) F + G 1 G 2 R a L b c 2 P 2 c 1 U 2 ( × , × , + )
E 4 ( 0 , 1 , 1 ) G 1 G 2 R a R b c 2 P 2 L b c 1 U 2 L a ( × , × , × )
E 5 ( 1 , 0 , 0 ) G 2 G 1 2 F F c 2 P 2 + R b F + R a c 1 U 2 ( , × , × )
E 6 ( 1 , 1 , 0 ) G 2 G 1 F + R b c 2 P 2 F R b F + L a + R a c 1 U 2 ( × , × , × )
E 7 ( 1 , 0 , 1 ) G 2 G 1 F + R a F + L b c 2 P 2 + R b c 1 U 2 R a F ( × , × , × )
E 8 ( 1 , 1 , 1 ) G 2 G 1 + R a + R b c 2 P 2 L b F R b c 1 U 2 L a R a F ( × , × , × )
Table 5. Analysis of stability conditions.
Equilibrium PointsStability Conditions
E 4 ( 0 , 1 , 1 ) G 1 G 2 R a R b < 0
c 2 P 2 L b < 0
c 1 U 2 L a < 0
E 6 ( 1 , 1 , 0 ) G 2 G 1 F + R b < 0
c 2 P 2 F R b < 0
F + L a + R a c 1 U 2 < 0
E 7 ( 1 , 0 , 1 ) G 2 G 1 F + R a < 0
F + L b c 2 P 2 + R b < 0
c 1 U 2 R a F < 0
E 8 ( 1 , 1 , 1 ) G 2 G 1 + R a + R b < 0
c 2 P 2 L b F R b < 0
c 1 U 2 L a R a F < 0
Disclaimer/Publisher’s Note: The statements, opinions and data contained in all publications are solely those of the individual author(s) and contributor(s) and not of MDPI and/or the editor(s). MDPI and/or the editor(s) disclaim responsibility for any injury to people or property resulting from any ideas, methods, instructions or products referred to in the content.

