Abstract
Cross-border greenfield investment in the financial services sector is increasingly understood not as isolated flows, but as a complex, dynamic global system. This systemic perspective is essential for understanding its holistic structure and evolution amidst globalisation and digital transformation. This paper utilises financial services greenfield investment projects from 100 major economies from 2003 to 2021 to construct the Global Financial Services Greenfield FDI Network (GFS-GFN). By combining Social Network Analysis (SNA) and Temporal Exponential Random Graph Models (TERGMs), we systematically investigate its dynamic evolutionary features and endogenous mechanisms. The findings reveal the following: (1) System-wide, the network exhibits persistent expansion, “small-world” properties, and a pronounced “rich club” effect among source countries. (2) Nodally, the structure has evolved from a US-UK “dual-core” to a multipolar configuration, as emerging hubs like China, the UAE, and Singapore rapidly approach the traditional centres. (3) Structurally, the network has fragmented from Euro-American dominance into five major communities, forming a diverse, complementary pattern. Network evolution is primarily driven by endogenous mechanisms. Investment relationships widely exhibit reciprocity, preferential attachment, transitive closure, and marked path dependence.
1. Introduction
In recent years, globalisation and digitalisation have transformed the financial services sector. As a vital component of high-end global value chains, financial services facilitate international capital flows and risk diversification. However, these cross-border investments are not isolated events; they are interdependent flows that constitute a complex, dynamic global system of financial integration. Despite the clear emergence of this system, extant research has failed to capture its underlying logic. First, an empirical focus on manufacturing overlooks the unique topological characteristics and systemic functions of capital- and knowledge-intensive financial services. Second, and most critically, the predominance of static or cross-sectional methodologies fundamentally fails to capture the dynamic evolution of this system. These methods cannot model the endogenous mechanism. Third, an insufficient focus on developing economies and emerging markets hinders a holistic understanding of the network’s shift towards a multipolar structure. Consequently, it is imperative to establish a new research framework to systematically analyse the spatiotemporal evolution and underlying logic of greenfield FDI networks within the global financial services industry.
Within the theoretical framework, foreign direct investment (FDI) has long been a central topic in international economics (Dunning, 2009; & Verbeke, 2001) [1,2]. However, traditional theories primarily rely on bilateral and linear assumptions, with insufficient research into the pervasive “network effects” observed in transnational investment. With the introduction of Social Network Analysis (SNA), scholars began reinterpreting cross-border investment and capital flows through the lens of network structures (Snyder & Kick, 1979) [3]. Specifically within the financial services sector, research by Claessens and Van Horen (2014) indicates that multinational banks, insurance firms, and asset management institutions gradually form cross-border financial service networks through establishing investment partnerships [4]. Lane and Milesi-Ferretti (2008) found a significant positive correlation between the centrality of financial centres and capital inflows [5]. Haberly and Wójcik (2015) further indicate that London, New York, and Singapore have long occupied the core of the global financial city network, though emerging nodes such as Dubai and Shanghai are rising [6]. Related research also demonstrates that network structure significantly influences the transmission of financial crises (Battiston et al., 2012) [7]. Theoretically, the emergence of network structures in financial services FDI can be attributed to specific economic mechanisms inherent to the sector. First, informational frictions play a pivotal role. As noted by Chaney (2014) in trade networks, firms utilise existing contacts to navigate opaque foreign markets [8]. In financial services, where information asymmetry is severe, transitive network connections (i.e., “friend of a friend”) serve as critical channels for verifying regulatory compliance and counterparty credibility. Second, the Liability of Foreignness (LOF) drives reciprocity. Financial institutions face high institutional barriers and regulatory scrutiny abroad. Reciprocal investment acts as a “hostage exchange” mechanism, creating mutual regulatory interdependence that mitigates policy uncertainty and builds trust (Claessens & Van Horen, 2014) [4]. Finally, preferential attachment in this network reflects a “herding” behaviour driven by search costs. Established financial centres (e.g., London, New York) offer agglomeration externalities that lower the cost of entry for new players, creating a path-dependent evolution where capital flows gravitationally toward well-connected hubs. Furthermore, as Mugerman et al. (2020) [9] demonstrated, synchronised events can jointly affect global markets; similarly, the dense “rich-club” structure of the FDI network identified in this study implies a high degree of interconnectedness that may facilitate the rapid contagion of financial shocks. However, existing research predominantly focuses on mergers and acquisitions (M&A) and equity networks (UNCTAD, 2021) [10], with limited in-depth exploration of the networked evolution of greenfield investment as a “new node” model [11,12,13].
In terms of research methodology, exponential random graph models (ERGMs) have been extensively employed for statistical modelling of complex networks (Robins et al., 2007; Lusher et al., 2013; Snijders et al., 2010) [14,15,16]. However, static characteristics struggle to capture the dynamic evolutionary mechanisms of networks. In recent years, the Temporal Exponential Random Graph Model (TERGM) and the Stochastic Actor-Oriented Model (SAOM, e.g., SIENA) have emerged as pivotal approaches for dynamic network analysis. TERGM proves particularly adept at revealing endogenous effects within networks (Leifeld, 2018; Leifeld, 2019) [17,18]. This model can simultaneously model network dependence and time dependence (Hanneke et al., 2010) [19] and, through simulation approximations of real networks and parameter estimation, effectively explain the logic of relationship generation and evolution (Cranmer and Desmarais, 2011) [20].
In summary, while extant research provides a crucial foundation for understanding global greenfield FDI networks, significant gaps remain. First, existing studies predominantly focus on manufacturing, neglecting the distinctive characteristics of the financial services sector regarding regulatory intensity, information opacity, and relational production. Specifically: (1) Regulatory Intensity and Liability of Foreignness (LOF): Financial firms face exacerbated Liability of Foreignness (LOF) due to stringent prudential regulations, capital adequacy requirements, and significant regulatory discretion across different jurisdictions. This regulatory asymmetry makes trust-building through network embeddedness far more critical in finance than in manufacturing (Claessens & Van Horen, 2014) [4]. (2) Information Opacity: Financial services involve intangible assets and severe information asymmetry, which increases the value of network closure for effective due diligence and risk assessment (Lane & Milesi-Ferretti, 2008) [5]. (3) Relational Production: Unlike goods production, financial services require continuous client relationships and local market knowledge, making embeddedness in host-country networks a prerequisite for competitive advantage (Haberly & Wójcik, 2015) [6]. Consequently, endogenous network mechanisms are likely to exert stronger effects in financial services than in manufacturing FDI, necessitating industry-specific theoretical grounding. Second, network analyses predominantly employ static methodologies, failing to capture the dynamic evolutionary characteristics of investment networks under global macroeconomic shocks. Third, insufficient attention is given to the role of emerging markets and developing economies. Crucially, existing theories have failed to explain why endogenous network mechanisms (e.g., reciprocity, transitive closure) are more pivotal in financial services FDI—a phenomenon driven precisely by the sector’s inherent Liability of Foreignness (LOF) and institutional distance. Consequently, it is imperative to establish a new research framework integrating international business theory with network science to systematically analyse the structure and endogenous evolutionary logic of the financial services greenfield FDI network. This study utilises fDi Markets greenfield investment data from 2003 to 2021 to construct the Global Financial Services Greenfield FDI Network (GFS-GFN) across 100 economies, systematically examining its characteristics and endogenous mechanisms.
The main contributions of this study are as follows. Firstly, from a methodological perspective, this study deviates from the conventional FDI research approach that is centred on gravity models (Blonigen, 2005; Kolstad and Wiig, 2012) [21,22]. Employing a Temporal Exponential Random Graph Model (TERGM) from a network analysis perspective systematically unveils the structural characteristics of the global financial services FDI network. These include reciprocity, clustering, transitive closure and time dependency, thereby filling a gap in the application of network methods within this field. Secondly, from a standpoint of data selection and research, this study diverges from mainstream research grounded in cross-border M&A data. By incorporating greenfield investment data from FDI Markets to construct the Global Financial Services Greenfield FDI Network (GFS-GFN), it not only broadens the analytical dimensions, but also provides fresh empirical foundations for examining transnational investment behaviour within global value chains. Empirical findings demonstrate an evolution of the global financial services FDI network from a “Europe–America axis” towards a multipolar structure characterised by “traditional centres–resource hubs–emerging Asia-Pacific”. This structural shift has exposed emerging trends in the allocation of international financial resources, thereby providing crucial empirical evidence for understanding the evolution of international financial integration and the global financial governance system.
2. Data and Methodology
2.1. Data Sources and GFS-GFN Construction
This study examines greenfield FDI in the global financial services industry. We focus exclusively on greenfield FDI because it represents active strategic entry and the creation of new productive capacity, which differs fundamentally from the ownership transfer characteristic of M&A. Greenfield investment is particularly sensitive to the “institutional distance” and “information frictions” we aim to study, as it requires building operations from scratch. While M&A is another vital mode of integration, greenfield data offers a cleaner signal of long-term strategic commitment to a host market. The data has been sourced from the fDi Markets database, which is operated by the Financial Times Group. This database has provided real-time monitoring and cross-verification of all publicly announced cross-border greenfield projects valued at USD 1 million or above since 2003. The database encompasses greenfield investment records from approximately 200 countries and regions worldwide. It is widely utilised in the United Nations Conference on Trade and Development’s World Investment Report, and is regarded as the most authoritative and comprehensively covered global greenfield FDI database currently available. While we acknowledge that fDi Markets captures announced projects, it is widely recognised as the industry standard for granular greenfield FDI data. As noted in the UNCTAD World Investment Report (2021), fDi Markets provides the most comprehensive tracking of specific cross-border greenfield projects, offering sector-specific details that aggregated Balance of Payments (BOPs) statistics cannot provide. This makes it uniquely suitable for constructing a precise global investment network. Numerous empirical studies have shown the overall validity and reliability of the fDi Markets database [23,24]. Ideally, future research could complement this with M&A data for a fuller picture.
In order to guarantee the representativeness and stability of the research, the present paper employs the methodology that was proposed by Hausmann et al. (2014) [25], with the aim of selecting the top 100 countries by total number of financial services greenfield investment projects from 2003 to 2021 as the research subjects. This strategy minimises survivorship bias while ensuring the network is sufficiently dense for TERGM convergence. Including micro-states with sparse or zero connectivity would lead to computational issues and model non-convergence. A 100 × 100 investment relationship matrix was constructed, where N = {i∣i = 1, 2, …, 100}. Our sampling strategy selects the top 100 economies based on the cumulative number of projects over the entire 2003–2021 period. This approach is specifically designed to minimise survivorship bias. By using cumulative counts, our sample captures not only traditional financial centres (e.g., UK, USA) but also “late risers”—emerging hubs like the UAE and Vietnam—that may have had low activity in the early 2000s but experienced a surge in later periods. The final sample comprises 21,247 greenfield FDI projects in the financial services industry, involving investment amounts totalling USD 583.56 billion, with an average project investment of USD 27.5 million. Specifically, this study defines the GFS-GFN as an aggregate financial connectivity network that encompasses five distinct sub-sectors recorded in the fDi Markets database. Retail Banking accounts for the largest share of the total projects (approximately 43.2%, with 9184 projects), followed by Investment Banking (27.1%, 5762 projects) and Insurance (15.8%, 3351 projects). While we acknowledge that the driving dynamics may vary across sub-sectors, an aggregate network approach is adopted here to map the holistic structure of global financial integration. This scope encompasses major developed economies and emerging markets, thereby reflecting the global landscape of greenfield investment in financial services.
In accordance with the aforementioned data, this study establishes a 100 × 100 investment relationship matrix on an annual basis. Each element of the matrix is indicative of the number of greenfield investment projects in the financial services sector directed from the home country i to the host country j. An investment relationship is assigned a value of 1 if present, and 0 otherwise. This forms a sequence of directed investment networks spanning 2003–2021.
2.2. The Indicators for Analysing the GFS-GFN
In order to reveal the network’s multidimensional characteristics, this paper characterises it across three levels:
2.2.1. Systemic-Level Indicators
(1) Network Density.
Network density (D) is a metric that quantifies the proximity of investment relations between nations. The calculation of the ratio is based on the actual investment relations in comparison to the maximum possible number of investment relations. It is defined as follows:
M denotes the actual number of investment relationships, i.e., the number of edges connecting nodes in the investment network; N represents the number of nodes (or countries) in the network.
(2) Average Path Length.
Average path length (L) is a topological concept reflecting the ease of investment between countries within a network. This value equals the average number of edges along the shortest path connecting nations in the network, where the shortest path length denotes the route with the fewest intermediate nodes among all paths from a specific starting node to an end node (Xuan et al., 2009) [26]. Defined as follows:
where dij denotes the minimum number of edges required to connect countries (regions) i and j, and N represents the number of nodes (or countries) in the network.
(3) Average Clustering coefficient.
The average clustering coefficient (C) is used to evaluate the extent to which nodes within a network are aggregated, which is usually determined by calculating the mean value of each node’s clustering coefficient. A higher numerical value indicates a stronger clustering effect within the network (Feng et al., 2020) [27]. It is defined as follows:
where ki denotes the number of nodes connected to node i; Di represents the actual number of edges; and N denotes the number of nodes (or countries) in the network. A higher average clustering coefficient indicates tighter investment relationships between countries. The average clustering coefficient is known to be unable to exceed 1 in the case of a fully connected network; in typical circumstances, it remains below 1.
(4) Degree Centralisation.
Degree centralisation reflects a network’s overall properties, measuring the extent to which it is built around certain nodes. The greater the centrality, the more concentrated the network becomes, with a wider disparity in centrality between core and peripheral nodes. It is defined as follows:
2.2.2. Node-Level Indicators
(1) Degree centrality.
Degree centrality (D) is a measure of importance within a network, calculated as the number of direct connections that a node has with other nodes. In the context of a network, a node with a high degree of centrality occupies a central position and exerts a greater influence. It is defined as follows:
where indegreei represents a country’s (region’s) in-degree, outdegreei represents its out-degree, and N denotes the number of nodes (countries) in the network.
(2) Closeness Centrality.
Closeness centrality (CC) is measured by the reciprocal of the mean path length from a node to other nodes. It is evident that the higher the CC value of a given node, the more proximate its position in the network is to the network’s central location. The calculation method is outlined as follows:
where dij denotes the shortest distance connecting nodes i and j, and N represents the number of nodes (countries) in the network.
(3) Betweenness Centrality.
Betweenness centrality (BC) is a measure of a nation’s capacity to control other country combinations, calculated by the number of shortest paths that pass through a single node. A higher value indicates a greater degree of control over other country combinations within the global financial services greenfield FDI network. The calculation method is outlined as follows:
where bij denotes the probability of node i being on the shortest path between nodes j and k, and N represents the number of nodes (or countries) in the network.
2.2.3. Community-Level Indicators
Consistent with the research of Vincent Blondel et al. (2008) [28], this study employs the Louvain algorithm to analyse the community structure of the global financial services greenfield investment network. Modularity (Q) serves as a crucial metric for evaluating the quality of community partitioning (Newman, 2004) [29]. A lower value indicates a higher degree of regional integration. Modularity is defined as follows:
wij denotes the number of investment projects from country i to country j; ki and kj respectively represent the total number of investment projects for country i and country j; ci and cj represent the communities associated with countries i and j. When ci equals cj, δ(ci, cj) equals 1; otherwise, it equals 0; m denotes the total number of edges in the network.
3. Structural Characteristics of the GFS-GFN
The global greenfield FDI network in financial services underwent a significant evolution from a single-core to a multipolar structure between 2003 and 2021. This was manifested in steadily increasing network density, strengthened small-world properties, gradual diversification of central nodes, and a shift in community structure from intra-regional clustering towards cross-regional integration. This paper systematically analyses its evolutionary characteristics at three levels: the overall network structure, node centrality, and community structure.
3.1. Systemic Network Properties
We use a series of indicators, such as network density, average path length, clustering coefficient, to characterise the overall GFS-GFN, the detailed calculation results are presented in Table 1. At the systemic level, the network exhibits a phased evolutionary pattern of “scale expansion–crisis contraction–multipolar recovery”.

Table 1.
The descriptive statistics of the overall network structure in GFS-GFN.
Firstly, there has been a significant increase in network density, accompanied by a notable increase in volatility (Figure 1). From a density of 0.059 in 2003, it increased to 0.0687 by 2021—an overall rise from the baseline period, but exhibiting an M-shaped fluctuation. The period between 2003 and 2008 was characterised by rapid expansion, followed by a significant decline in the aftermath of the 2008 financial crisis, with a subsequent gradual recovery that commenced in 2016. The cyclical nature of investment relations closely aligns with fluctuations in the global economy and financial markets, indicating heightened sensitivity of cross-border investment in financial services to external shocks.
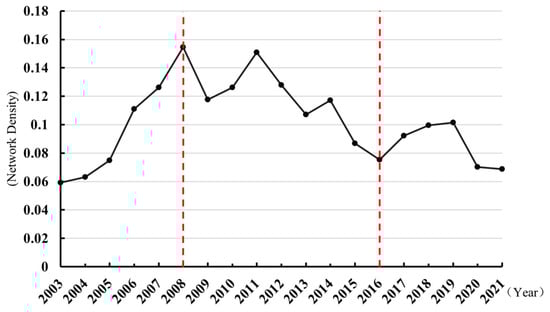
Figure 1.
The network density of the GFS-GFN in 2003–2021.
Secondly, the average path length has progressively shortened (Figure 2). The average path length decreased from 2.899 in 2003 to 2.502 in 2021, representing a reduction of 13.7%. This phenomenon signifies an enhancement in network accessibility, with the physical distance required to establish investment relationships between any two countries progressively diminishing. Consequently, the accessibility and transmission efficiency of global financial services investment have improved markedly.
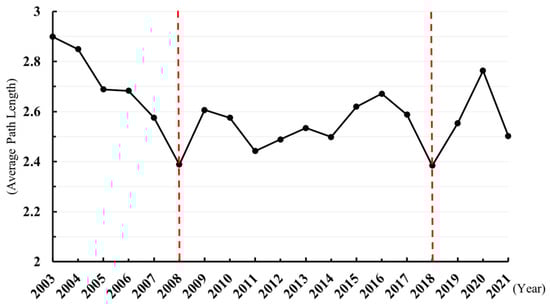
Figure 2.
The average path length of the GFS-GFN in 2003–2021.
In addition, the clustering coefficient has increased significantly, thereby reinforcing the “small-world” effect (Figure 3). The average clustering coefficient exhibited an increase from 0.258 in 2003 to 0.332 in 2021, signifying an overall growth rate of 28.7%. Quantitatively, we calculated the Small-world Quotient , where C is the observed clustering coefficient and L is the observed average path length. Crandom and Lrandom are calculated from 1000 equivalent random networks. For all years σ > 1, significantly exceeding the σ > 1 threshold, confirming robust small-world characteristics (Watts & Strogatz, 1998) [30]. The clustering coefficient consistently exceeded that of random networks of equivalent scale, indicating that greenfield investment connections within the global financial sector tend to form tightly knit local network structures. The finding suggests that investment connections are being established with increasing ease. The “small-world” characteristic of the network enhances the efficiency of information and capital transmission, while simultaneously rendering the network more resilient to crisis shocks [30].
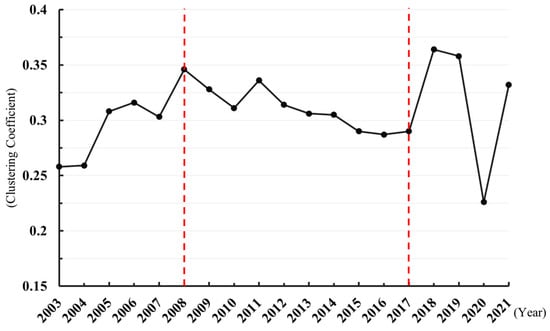
Figure 3.
The clustering coefficient of the GFS-GFN in 2003–2021.
The collective analysis demonstrates that the GFS-GFN manifests a propensity towards “small-world” properties during periods of expansion. This phenomenon is characterised by the establishment of more robust relationships and the enhancement of transmission efficiency, while concurrently preserving pronounced local clustering tendencies. This provides a structural foundation for subsequent evolution at the node and community levels.
3.2. Node Centrality Analysis
This study calculates the nodes’ characteristics of the GFS-GFN from 2003 to 2021 based on Equations (6)–(8). It should be noted that the results presented in Table 2 are limited to the years 2003, 2008, 2009, 2015 and 2021, due to constraints regarding the available space. At the node level, centrality metrics reveal the power distribution within the financial services FDI network. Evidence suggests that European and American financial centres have historically maintained a dominant presence in the field. However, emerging market nations are increasingly assuming more prominent roles, thereby resulting in a diversification of the core locational distribution of global financial investment.
Table 2.
The top 5 countries (regions) of centrality in GFS-GFN.
(1) Degree centrality: The United States continues to dominate the field, while Europe has experienced a relative decline in its standing. Degree centrality is indicative of a nation’s role as an initiator or recipient of investments, thereby unveiling significant shifts in the power structure of greenfield investments within the global financial services sector [31]. From 2003 to 2021, the United States consistently achieved the highest ranking. Despite a temporary decline in its degree centrality during the financial crisis, the system has since demonstrated remarkable resilience, with a gradual recovery that commenced after 2015. The United Kingdom has been experiencing a consistent downward trend, evidenced by a decline from 8.333 in 2003 to 4.678 in 2021. This decline is indicative of a gradual diminution in the nation’s dominance within the global financial network. It is evident that traditional European financial hubs, including those of Germany and France, have demonstrated consistent stability in their respective rankings. Nevertheless, a decline in their overall values indicates a tendency towards marginalisation within the global financial services greenfield investment landscape.
(2) Betweenness Centrality: The ascent of the United States and the United Arab Emirates is concomitant with the decline of the United Kingdom. Betweenness centrality measures a node’s bridging role within a network, reflecting a nation’s intermediary function and control capacity within the global financial investment network [32]. The United Kingdom held absolute leadership from 2003 to 2009, but was overtaken by the United States in 2015, which has since maintained its top position. Concurrently, the UAE demonstrated a particularly noteworthy intermediary centrality, ascending from fifth position in 2008 to third in 2015. This country has become a pivotal intermediary node within the global financial network, reflecting its growing importance as a financial hub connecting Asia, Africa, and Europe. Conversely, the intermediary functions of traditional European financial centres, such as France and Switzerland, have undergone a gradual decline.
(3) Closeness Centrality: The present paper sets out the argument for enhanced accessibility of Asian financial centres. Closeness centrality is a measure of a node’s accessibility to other countries (regions), reflecting its core position within the network and information dissemination efficiency [33]. It is evident that, whilst the United Kingdom and the United States have historically dominated this metric, the emergence of Asian financial centres has been particularly salient. A preliminary examination of the data indicates that China ascended to third position in 2015, while Singapore entered the top five for the first time in 2021. A similar trajectory was observed in the UAE, which ascended from fifth position in 2015 to third in 2021. This suggests a substantial improvement in the accessibility and efficiency of information distribution in Asian financial centres within the network. Consequently, they are established as crucial nodes in the global greenfield investment network for financial services.
To visualise the topological evolution of the GFS-GFN, we constructed annual network matrices based on project data from 100 major economies. Figure 4 visualises the network topology at the beginning (2003) and the end (2021) of the study period to highlight the structural transformation. In these visualisations, node size represents degree centrality, edge width corresponds to the number of projects, and arrow direction indicates investment flow.
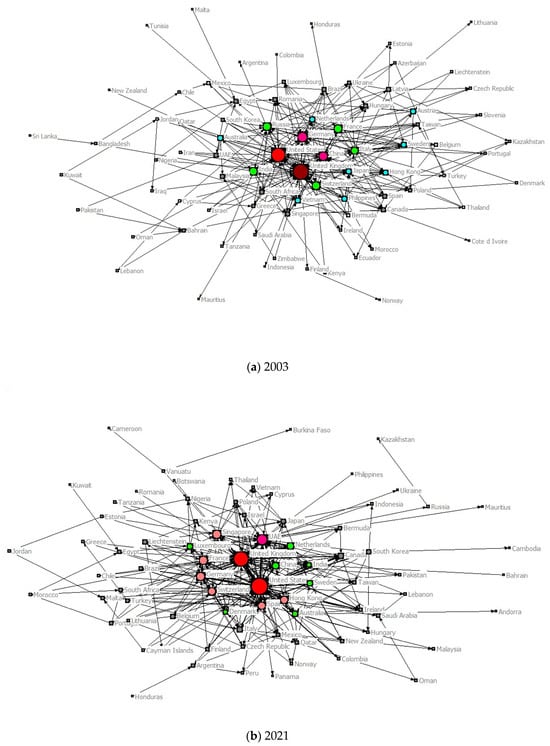
Figure 4.
The topological structural evolution of the GFS-GFN: a comparison between (a) 2003 and (b) 2021. The visualisation highlights the shift from a sparse, Western-centric network to a dense, multipolar system. (Intermediate snapshots for 2008, 2009, and 2015 are provided in Figure S1 of the Supplementary Materials.)
Longitudinal analysis reveals a clear evolutionary trajectory:
(1) 2003 (Initial Phase): As shown in Figure 4a, global economic connections were relatively sparse, particularly in the information-intensive financial services sector. The network was dominated by a Western-centric axis. London and New York served as the absolute hubs, with Germany playing a supporting role, forming a nascent “US–UK–Germany” triangle. China’s network position was rising due to its opening-up policies, but it was not yet a core node.
(2) 2003–2008 (Expansion and Crisis): Investment activities intensified rapidly, peaking in 2008. However, the 2008 Financial Crisis triggered a significant structural break. Following the crisis (e.g., in 2009), the number of projects plummeted. Notably, while Western hubs contracted, China’s network position rose in comparison due to its resilience to the external shock.
(3) 2015–2021 (Recovery to Multipolarity): The post-crisis recovery consolidated the US-UK core until 2015. However, since then, and particularly by 2021 (as shown in Figure 4b), the network has exhibited a clear trend towards multipolarity. The investment landscape is no longer unevenly concentrated; instead, interconnectedness within the core has strengthened, while emerging hubs in the Asia-Pacific (China, Singapore) have risen to challenge the traditional dominance. However, by 2021, investment volume showed signs of decline, reflecting the complexity of the recent geopolitical environment.
3.3. Community Structure Analysis
It is possible to regard a closely connected group of nodes as constituting a community within a network [34]. The hypothesis is that the GFS-GFN may form various communities due to differences in the intensity and closeness of greenfield investment relationships. This study employs Louvian community detection to reveal that the global greenfield FDI network in financial services underwent an evolutionary shift from “regional clustering” to “cross-regional integration” between 2003 and 2021. We employed the Louvain algorithm for community detection due to its superior efficiency in optimising modularity for large-scale networks. The calculated Modularity (Q) is 0.339, indicating a statistically significant community structure with clear boundaries, distinguishing the identified clusters from random groupings (Table 3).
Table 3.
Segmentation of GFS-GFN Communities (2003–2021).
(1) Regional Clusters: Traditional Centres Dominate.
Cluster I centres on developed financial hubs such as Europe, the United States, and Japan, while attracting “satellite-type” developing nations including Brazil, Mexico, and Vietnam. These countries maintain close trade ties, creating investment opportunities within the financial services sector. Characterised by strong capital outflows and numerous cross-regional connections, they serve as the network’s most crucial bridges and diffusion sources.
(2) Resource Hubs: Gulf States Linking Asia, Africa, and Europe.
Cluster II encompasses nations situated at the intersection of the continents of Asia, Africa and Latin America. The geographical proximity of these countries enhances the convenience and efficiency of greenfield FDI in financial services. The UAE and Qatar are at the vanguard of this development, reflecting the profound interconnection between Gulf capital and resource-rich nations in Asia, Africa, and Latin America, thereby establishing a pivotal nexus for trade and economic collaboration between Africa and Asia.
Community III is constituted by a preponderance of Nordic and Eastern European nations, forming a regional cluster centred on Russia and Central/Eastern Europe, extending towards the periphery of Europe. The Russia–Nordic energy corridor and Central/Eastern European financial infrastructure are leveraged, thus enabling the functioning of an “Eurasian land bridge”. This bridge serves to maintain close economic and cultural ties among its member states. It is evident that, circa 2010, Gulf states such as the UAE and Qatar gradually emerged as pivotal hubs linking Asia, Africa and Europe through capital outflows and geopolitical advantages. The geographical scope of their influence extends beyond the Middle East and North Africa, encompassing South Asia and sub-Saharan Africa, thereby demonstrating transregional aggregation.
(3) Asia-Pacific Emergence: Driven by RCEP and the Belt and Road Initiative.
Community IV comprises Latin American nations, centred on the Panama-Colombia Corridor and oriented towards North American and Asia-Pacific capital. These countries share geographical proximity and strong cultural ties, representing a distinct geo-cultural convergence.
Community V encompasses RCEP nations and the Asian Tigers, maintaining significant economic ties with countries such as Saudi Arabia. Centred on East Asia, Southeast Asia and Oceania, it features both high-intensity intra-regional connections and the integration of Gulf states (e.g., Saudi Arabia) through energy and supply chains. The formation of these communities is influenced by multiple factors including geographical location, historical and cultural heritage, language, religion, and trade and investment relationships.
Since 2015, Asian nations have exhibited an augmented degree of cohesion within global financial investment networks. It is evident that nodes such as China, Singapore, South Korea, and Australia have progressively formed a transregional community centred on East Asia-Southeast Asia-Oceania. The Belt and Road initiative has facilitated the incorporation of several Middle Eastern and Eastern European nations into this community. The emergence of this transregional community signifies a shift in the global financial services investment network from a “Western-centric axis” towards a multipolar structure where “Asia-Pacific emerging centres” coexist with traditional hubs.
In essence, the evolution occurring at the community level is characterised by a transition from a “single-centre” model to a state of “multiple regions coexisting” and, ultimately, to a condition of “cross-regional integration”. It is evident that the global financial services investment network is no longer confined to regional integration. This paradigm shift signifies a departure from the conventional “Euro-American axis” towards a multi-polar community structure comprising “traditional centres–resource hubs–Asia-Pacific emerging economies”. These communities are characterised by functional complementarity and geographic intertwining. Collectively, they exert a significant influence on the configuration of the contemporary global financial investment topology network, which is characterised by its complexity and resilience.
In summary, the global greenfield investment network in financial services underwent a complete cycle of “scale expansion–crisis adjustment–multipolar reshaping” between 2003 and 2021. At the aggregate level, edge counts and density exhibited M-shaped fluctuations, while average path length decreased and clustering coefficient increased, indicating a sustained strengthening of “small-world characteristics” and a significant improvement in cross-border financial service efficiency. At the node level, the United States maintained its central position, while the United Kingdom experienced relative decline. China, the United Arab Emirates, and Singapore emerged as core nodes, driving the hub structure towards multipolarity. At the community level, regional clusters progressively evolved into transregional communities, forming a tripartite structure comprising “traditional centres–resource hubs–emerging Asia-Pacific players”. This evolutionary trajectory reflects the adaptive reshaping of global financial services amid crisis shocks and geopolitical shifts, revealing a trend from oligopolistic dominance towards multipolar competition within global investment networks. It provides robust structural evidence for subsequent endogenous mechanism testing.
4. Analysis of Endogenous Mechanisms Based on TERGM
4.1. Theoretical Analysis and Research Hypotheses
The evolution of the GFS-GFN is shaped by the combined influence of node attributes, external contextual factors, and endogenous structural characteristics (Leifeld, 2018; Leifeld, 2019) [17,18]. This paper categorises node attributes and external contextual factors as exogenous mechanisms of network evolution, while attributing the self-organisation of networks—specifically how the current network structure influences its future evolution, termed the “endogenous effect”—to endogenous mechanisms. Drawing upon existing research (Leifeld, 2018; Liu Linqing et al., 2021; Luo Chaoliang et al., 2022) [17,35,36], this paper conceptualises the endogenous structural effects of the greenfield FDI network in the global financial services sector as: Reciprocity Effects, Structural Dependence Effects, and Temporal Dependence Effects.
4.1.1. Reciprocity Effect
The reciprocity mechanism in financial services is fundamentally driven by the need to mitigate the Liability of Foreignness (LOF). Unlike manufacturing, the financial sector is characterised by high regulatory intensity and “prudential supervision”. When a financial institution enters a host country, it faces significant regulatory uncertainty and institutional distance. Reciprocal investment acts as a credible commitment device or a “hostage exchange” mechanism. The mutual market presence creates a state of “regulatory interdependence”, where regulators in both countries are incentivised to treat foreign entrants fairly to ensure their own domestic firms receive reciprocal treatment abroad (Claessens & Van Horen, 2014) [4]. Therefore, we posit that reciprocity in this network is a strategic response to institutional barriers. The reciprocity effect describes the probability of nations forming “tit-for-tat” relationships. Within the greenfield FDI network of the global financial services sector, reciprocity primarily refers to the formation of reciprocal greenfield FDI relationships in financial services between nations. This arises from outward-oriented enterprises expanding and penetrating international markets, coupled with countervailing competition from host-country firms.
Hypothesis 1:
A reciprocity effect exists within the global financial services greenfield FDI network, manifesting as follows: if one country has initiated investment in another, the latter is more likely to undertake reciprocal investment.
4.1.2. Structural Dependency Effect
The Structural Dependency Effect can be decomposed into two specific effects:
Firstly, the preferential attachment effect. Preferential attachment embodies network convergence and reflects the attractiveness of central nodes. It is typically measured using a geometrically weighted degree distribution (Harris, 2025) [37]. In financial services, preferential attachment is intensified by institutional distance considerations (Eden & Miller, 2004) [38]. Firms prefer to invest in countries with compatible regulatory frameworks and similar financial development levels to reduce adaptation costs and regulatory risks. This creates a “regulatory clustering” effect where new ties disproportionately target economies that have already achieved regulatory isomorphism with existing network members, reinforcing the “rich-get-richer” pattern. New investors tend to select economies that already possess numerous greenfield investment relationships in the financial services sector as their investment targets. This preferential attachment mechanism causes nodes that are already highly connected to acquire even more new connections, thereby further strengthening their central position within the network. A minority of node economies become favoured by the majority of economies in the network, emerging as “star nodes”.
Secondly, connectivity and transitive closure. In trust-intensive financial markets, transitive closure serves a critical information verification function. When two countries share a common financial partner, this partner can provide credible information about regulatory compliance, market conditions, and counterparty risks, reducing information costs for new entrants (Battiston et al., 2012) [7]. This mechanism is particularly salient in financial services where opaque information environments increase the value of network-based trust. In a directed network, two nodes may transmit a relationship via one or more intermediary nodes. If the relationship is transmitted through a single intermediary, it is a simple 2-path. If it is transmitted through multiple intermediaries, it manifests as a complex 2-path, also termed “multiple connectivity”. This paper focuses on whether multiple connectivity exists in the GFS-GFN, compelling economies to transmit investment relationships via multiple paths, thereby generating a connectivity effect.
Transitive closure builds upon a 2-path by adding one more relational tie to form a triadic structure. This showcases the tendency of countries within the GFS-GFN to form “triangular” relationships. Specifically, it means that nodes which have shared partners or shared relations—i.e., those with dyad-sharing or edge-sharing—have a higher probability of establishing a tie, thus forming a closed triadic structure. Colloquially, this is understood as “a friend of a friend is a friend”.
Based on this, Hypotheses 2, 3, and 4 are proposed:
Hypothesis 2:
Countries with higher in-degree are more likely to acquire new connections, exhibiting a “the-strong-get-stronger” effect.
Hypothesis 3:
Connectivity exists within the GFS-GFN; the presence of open 2-paths influences new edge formation, with “multiple connectivity” playing a significant role in financial services networks.
Hypothesis 4:
Transitive closure exists in the GFS-GFN; that is, countries that share partners are more inclined to form a closed triangle.
4.1.3. Temporal Dependence Effects
This refers to where stability and variability are typical temporal dependence structure variables within the TERGM model. To facilitate high-quality outward expansion of domestic greenfield FDI in financial services, establishing relationships demands substantial time investment and significant economic costs. Once an investment tie is established, it will not be easily dissolved; that is, the GFS-GFN exhibits stability.
Furthermore, resource accumulation also facilitates low-cost, high-frequency interactions between the two countries; therefore, both parties are inclined to maintain and preserve the existing relationship. However, developments in international financial markets and changes in the global macroeconomic environment, such as political conflicts or divergent economic cycles, can lead to an increase in the continuation costs of financial services greenfield FDI relationships. When these costs exceed the cost of establishing new relationships, the original financial services greenfield FDI ties may disappear, while new greenfield FDI ties may emerge. Consequently, the GFS-GFN exhibits a certain variability. In other words, the GFS-GFN has a degree of resilience, but also possesses vulnerability. Based on this, Hypotheses 5 and 6 are proposed:
Hypothesis 5:
The GFS-GFN exhibits stability; that is, once an investment tie is formed, its probability of persisting into the next period is higher.
Hypothesis 6:
The GFS-GFN exhibits variability; that is, investment ties have a certain tendency for dissolution or substitution over time.
4.2. Model Construction and Variable Measurement
4.2.1. Model Construction
Based on the analysis of influence mechanisms presented above, this study constructs a model to investigate the endogenous and exogenous factors driving the dynamic evolution of the global financial services greenfield FDI network. Extant literature identifies the Temporal Exponential Random Graph Model (TERGM) and the Stochastic Actor-Oriented Model (SAOM, e.g., SIENA) as prevalent approaches for longitudinal network evolution analysis (Silk et al., 2017) [39]. However, TERGM is considered superior when the primary research focus is on endogenous network structural effects (Leifeld, 2019; Leifeld, 2018) [17,18]. Consequently, this study employs the TERGM approach to examine the mechanisms influencing the global financial services greenfield FDI network.
As a dynamic extension of the traditional Exponential Random Graph Model (ERGM), TERGM incorporates both endogenous and exogenous network mechanisms, enabling statistical inference regarding the formation and evolution of observed networks based on stochastic social processes. Compared to conventional regression methods, the model’s superiority lies in its ability to circumvent the strong assumption of observational independence while allowing for the simultaneous consideration of various network configurations. Through iterative simulation to approximate the observed network and parameter estimation, it quantitatively identifies the mechanisms influencing the formation and development of the network structure (Lusher et al., 2013) [15]. Functioning as a discrete-time network evolution model, TERGM operates on principles consistent with ERGM. It utilises Maximum Pseudolikelihood Estimation (MPLE) for model estimation and testing, achieving stability in parameter estimates through continuous simulation and parameter adjustment. The implementation process primarily involves initially simulating a distribution of random graphs based on a given set of starting parameters. Subsequently, parameter values are refined by comparing the distribution of network statistics from the simulated graphs with those of the original observed network; this process is repeated iteratively until the estimates converge to stability. This study employs the TERGM to characterise the dynamic generation process of investment networks. Building upon the ERGM, TERGM incorporates a temporal dimension, enabling simultaneous examination of both structural and temporal dependencies within a longitudinal framework. Intuitively, the TERGM can be understood as a “network-aware” logistic regression. While a standard regression predicts investment probability based solely on country characteristics (e.g., GDP), TERGM additionally considers the network’s own history and structure. For example, it estimates how much the probability of a new US–China investment increases if a China–US link already exists (reciprocity) or if both share a link with the UK (transitivity), thus capturing the systemic interdependence.
To systematically explore the mechanisms influencing the formation and evolution of the GFS-GFN, this study adopts the methodology of Liu Linqing et al. (2021) [35]. A longitudinal global financial services greenfield FDI observation network spanning 2003–2021 was constructed, with a two-year time interval, covering the greenfield FDI networks for ten odd-numbered years from 2003 to 2021. The selection of a two-year interval is methodologically deliberate. Greenfield FDI projects, unlike high-frequency stock trading, are characterised by large capital commitments and long gestation periods. Using annual data often introduces significant “short-term noise” and network sparsity that can hinder model convergence. A two-year interval effectively smooths these fluctuations while retaining sufficient temporal granularity to capture structural evolution. Furthermore, we address the concern of network non-stationarity—particularly structural breaks caused by the 2008 Global Financial Crisis—by conducting a rigorous sub-period analysis pre-crisis (2003–2008), during crisis diffusion (2009–2013), and post-crisis (2014–2021) in Section 4.4.2, which explicitly tests for parameter stability across different macroeconomic regimes. Building upon this foundation, this study comprehensively examines endogenous mechanisms—including reciprocity, structural dependence, and temporal dependence—alongside exogenous factors such as node attributes and external environmental conditions. It conducts quantitative analysis of their influence on the formation and dissolution of greenfield FDI relationships within the financial services sector. The following TERGM fitting model is first constructed:
Here, Nt and Nt−1 denote the GFS-GFN for periods t and t − 1, respectively, θ represents the parameter to be estimated, and 1/c is the normalising constant ensuring probabilities remain between 0 and 1. edges denotes the number of directed edges in the financial services greenfield FDI network, functioning similarly to the constant term in traditional regression models, with coefficients typically being negative. Explanatory variables encompass a suite of endogenous structural characteristics, including reciprocity (mutual), preferential attachment (gwideg), transitive closure (gwesp), multiple connectivity (gwdsp), stability (stability), and variability (variability). Additionally, it includes node covariates (nodecov), exogenous network covariates (edgecov), and homophily. The subscript s denotes the sender effect, while r represents the receiver effect.
4.2.2. Selection of the Variable
(1) Dependent Variable.
The probability of establishing investment relationship within the GFS-GFN. A relationship is assigned a value of 1 if present, and 0 otherwise. Drawing upon the methodology of Hausmann et al. (2014) and Liu Linqing et al. (2021) [25,35], this study employs financial services greenfield FDI data volume as a screening criterion. The top 100 countries by cumulative number of financial services greenfield FDI projects between 2003 and 2021 are selected as the research subjects.
(2) Independent Variables.
Endogenous structural characteristics variable.
Reciprocity (mutual): Examining the propensity for establishing bilateral greenfield FDI relationships in the financial services sector between countries.
Preferential Attachment (gwideg): Also known as Geometrically Weighted In-Degree, it is calculated by summing the product of the frequency corresponding to each node’s in-degree and a weighting parameter. This metric measures the influence of high-in-degree countries in the network. If the coefficient is negative, it indicates a preferential attachment effect, meaning high-in-degree countries more easily attract more financial services’ greenfield FDI relationships.
Multiple Connectivity (gwdsp): Measures the connectivity effect within the financial services greenfield FDI network, also termed the geometrically weighted dyadic shared partnership. It reflects the depth to which financial services greenfield FDI relationships between two countries are transmitted through intermediary nations.
Transitive closure (gwesp): Measures the transitive closure effect within the financial services greenfield FDI network, which is also referred to as the geometrically weighted edge shared partnership. It reflects the likelihood of two countries establishing a relationship when both have already formed a financial services greenfield FDI relationship with a third country.
The three statistics gwideg, gwdep and gwesp evaluate a network’s clustering, connectivity and transitive closure characteristics based on structural patterns within the network relationships. Consequently, this paper classifies them as endogenous structural dependence variables.
Stability is determined by analysing data across different time periods to assess parameter variation over time. Minimal changes in parameter estimates across periods indicate robust stability, measuring whether the connectivity status of greenfield FDI relationships in the financial services sector during period t − 1 persists in period t. This reflects the stability of the network configuration.
Variability measures whether greenfield FDI relationships in the financial services sector exhibit interaction effects with time, reflecting the emergence of new relationships or the dissolution of existing ones over time. This captures the temporal variability of greenfield FDI relationships within the sector.
(3) Node Covariates.
This study incorporates factors potentially influencing a country’s financial services greenfield FDI as exogenous mechanisms within the model. These specifically include market size, measured by the logarithm of gross domestic product (lngdp); level of economic development, measured by the logarithm of per capita gross domestic product (lnpergdp); and the level of financial development (finance), measured using a composite indicator. Homophily is reflected by the continent to which the economy belongs (continent).
(4) Exogenous Network Covariates.
To examine the combined impact of human, cultural, social, and political factors on greenfield FDI in financial services across nations, this study incorporates colonial ties (colony), common language (comlang), and geographical distance (distcap) into the model. This assesses how other inter-state relationships influence greenfield FDI in financial services. Country attribute data are sourced from the World Development Indicators database (WDI), financial development level data from the Global Financial Development Database (GFDD), while colonial history, common language, geographical distance between capitals, and continental affiliation data are drawn from the CEPII-Geography database. Specific variable definitions and statistical significance are detailed in Table 4.
Table 4.
Definitions and Statistical Significance of TERGM Regression Variables.
4.3. Empirical Findings and Discussion on Endogenous Mechanisms
This study employs the TERGM model to estimate and fit the longitudinal greenfield FDI network in the financial services sector from 2003 to 2021, yielding the empirical results presented in Table 5.
Table 5.
Empirical Results of TERGM for the GFS-GFN.
Model 1 in Table 5 serves as the benchmark model, incorporating node covariates lngdp, lnpergdp, and the homophily indicator continent. Its empirical results broadly align with existing traditional regression analyses, thereby providing a baseline for comparison with models incorporating endogenous variables. Model 2 incorporates the endogenous structural feature variable mutual into Model 1; Model 3 adds the endogenous structural dependency variables gwideg, gwesp, and gwdsp to Model 2; Model 4 further includes two time-dependent variables, stability and variability, to form a comprehensive model encompassing all exogenous and endogenous variables, thereby testing endogenous mechanisms. Consistent with standard practice in inferential network analysis (Robins et al., 2007; Cranmer and Desmarais, 2011) [14,20], we interpret the magnitude of the estimated parameters by exponentiating the coefficients to obtain odds ratios (OR = ). This metric quantifies the multiplicative change in the conditional odds of tie formation associated with the presence of a specific network structure, thereby providing a more intuitive measure of effect size than raw log-odds coefficients.
- 1.
- Reciprocity Effect
Across all models, the reciprocity term is consistently significant and positive. The reciprocity coefficient in Model 4 is 0.6227, significant at the 0.1% level, confirming the existence of a reciprocity effect. This indicates a significant bidirectional investment propensity between countries. This coefficient corresponds to an odds ratio of 1.86. This magnitude implies that, holding all other network structures constant, the existence of a reverse investment tie increases the odds of forming a new investment relationship by approximately 1.86 times. This implies that if Country A invests in Country B, Country B is nearly twice as likely (1.86 times) to invest back in Country A, holding all else constant. This strong effect quantitatively validates the “tit-for-tat” logic in financial integration, where mutual market presence serves as a critical trust-building mechanism. Specifically, if one country initiates investment in another, the probability of the latter reciprocating with counterinvestment increases significantly, thereby validating Hypothesis 1.
- 2.
- Structural Dependency Effect
Preferential Attachment: The gwideg coefficient is −1.5264, significantly negative, indicating that a small number of high-degree economies are more likely to attract investment relationships, thereby reinforcing their central position and ultimately evolving into critical hubs within the network. While the negative sign is a technical parameter of the geometrically weighted statistic, its substantial magnitude indicates a strong centralisation tendency in the network. It suggests that the probability of a new tie forming is heavily skewed towards nodes that already possess high degrees, quantitatively confirming a pronounced “rich-get-richer” mechanism where traditional hubs disproportionately capture new capital flows. This confirms the preliminary linkage effect within the GFS-GFN, where so-called network “star” economies exhibit a “the rich get richer” network characteristic, thereby substantiating Hypothesis 2.
Multiple Connectivity: The gwdsp coefficient is −0.0180, significantly negative in the integrated model, which translates to an odds ratio of 0.98. This value is just below 1, indicating that after controlling for the closed triangle, additional open 2-paths do not enhance but rather inhibit the formation of new edges. This outcome may stem from the high compliance and reputational costs within the financial services sector, where excessive indirect pathways instead foster intermediary competition and information redundancy, thereby validating Hypothesis 3.
Transitive Closure: The gwesp is significantly positive in Models 3 and 4, specifically, the coefficient of 0.5230 corresponds to an odds ratio of 1.69. This signifies a robust transitivity effect: two countries that share a common financial partner are approximately 1.69 times more likely to establish a direct investment tie compared to those who do not. This high value underscores the role “network closure” plays in reducing information asymmetry.
Indicating that partner nations with shared ties are more inclined to form closed triangular relationships. This reflects the crucial role of trust and information verification in cross-border investment, thereby validating Hypothesis 4.
Overall, the GFS-GFN structurally exhibits the typical characteristics of “Preferential Attachment” and “Transitive Closure.” Meanwhile, the negative effect of multiple connectivity suggests that in this industry environment, redundant paths do not necessarily facilitate the formation of new relationships.
- 3.
- Temporal Dependence Effects
Stability and variability were employed to analyse dynamic network data. For the TERGM model, stability assessment involved examining data across different time periods to determine parameter shifts. Minimal variation in parameter estimates across periods indicates robust stability. The stability coefficient (stability) is 0.7395, yielding an odds ratio of 2.09. This is the strongest effect observed in our model, implying that an existing investment tie is over twice as likely (2.09 times) to persist into the next period than to dissolve. This magnitude highlights the high sunk costs and “path dependence” inherent in financial infrastructure investments.
The variability coefficient is −0.0726 and statistically significant. The coefficient is −0.0726, corresponding to an odds ratio of 0.93. This value indicates a dampening of random fluctuations. Specifically, it suggests that the network resists arbitrary turnover (forming and dissolving ties randomly), reinforcing the structural rigidity of the global financial network against short-term shocks. It indicates that the tendency for relationship changes (or turnover) is suppressed, and the network favours stable continuation over time. Together, these reveal a dynamic evolution mechanism characterised by “high inertia and limited adjustment”, thereby validating Hypotheses 5 and 6.
To ensure the scientific validity of our methodological approach, we conducted a robustness check using a traditional logistic regression model based on the full sample of financial services greenfield FDI data from 2003 to 2021. The results are presented as Model 5 in Table 5. This logistic model treats investment ties as independent observations, thereby disregarding network interdependencies. The regression results from Model 5 demonstrate a high degree of consistency with the estimates from Model 1 (the baseline model without endogenous terms), exhibiting similar signs, significance levels, and magnitudes for the coefficients. However, traditional regression relies on the assumption that observations are independent and identically distributed, implying that financial services greenfield investment ties between countries are mutually independent. In reality, interstate relationships are complex and intertwined; the establishment of one tie often depends on the existence of others. The formation and evolution of the Global Financial Services Greenfield FDI Network (GFS-GFN) are driven by an interplay of both endogenous and exogenous mechanisms. Traditional logistic regression models neglect these endogenous structural dependencies, potentially leading to biased estimates. In contrast, the TERGM framework explicitly accommodates interdependence among dyads. It comprehensively integrates endogenous structural factors and exogenous environmental covariates to quantitatively analyse the laws governing network formation and evolution, making it a more methodologically rigorous approach for this study.
The comparison with the benchmark results highlights the distinct advantages of the TERGM over traditional regression. The formation and evolution of the GFS-GFN exhibit significant path dependence; they are influenced not only by external contextual factors but also, to a large extent, by endogenous mechanisms such as reciprocity, structural dependence, and temporal dependence. Our findings indicate that as endogenous network variables are introduced, the explanatory power attributed solely to exogenous mechanisms diminishes. This further validates the superiority of the TERGM fit: by incorporating time-lagged network statistics, the model avoids the independence assumption inherent in traditional regression, thereby more accurately simulating complex relational dynamics and predicting the formation or dissolution of ties (Lusher et al., 2013) [15].
4.4. Robustness Tests
To examine the robustness of the TERGM model fit, three types of robustness tests were conducted: re-estimation after adjusting the time interval (3 years, 4 years, 5 years); sample analysis divided into three phases—pre-crisis, crisis period, and post-crisis; and replacement of estimation methods. Results are presented in Table 6 and Table 7.
Table 6.
Robustness Analysis of the GFS-GFN I.
Table 7.
Robustness Analysis of the GFS-GFN II.
4.4.1. Altering the Time Interval of Investment Network Data
First, drawing upon the methodology of Liu Linqing et al. (2021) [35], we modified the time intervals of global financial services greenfield FDI data in Models 6–8 based on Model 4. The data employed were: 3-year intervals (2003, 2006, 2009, 2012, 2015, 2018, 2021), four-year intervals (2004, 2008, 2012, 2016, 2020), and five-year intervals (2004, 2009, 2014, 2019). By comparing the TERGM model fitting results for greenfield FDI networks in the financial services sector across different time intervals, we find strong consistency with the empirical findings from Model 4, indicating robust model fitting outcomes.
4.4.2. Classification of Different Phases Based on the 2008 Financial Crisis
To test the robustness of the TERGM model, this paper also analyses changes in the global financial services greenfield FDI network following the 2008 financial crisis. Acknowledging the non-stationarity risks and structural breaks caused by external shocks, specifically the 2008 Global Financial Crisis, we divided the study period into three distinct phases: pre-crisis (2003–2008), crisis diffusion (2009–2013), and post-crisis (2014–2021). The crisis effectively began spreading in the fourth quarter of that year. As data for 2008 showed no significant impact and multiple indicators reached peaks, this year is classified as pre-crisis. Table 7 presents empirical results for each phase, with Models 11-1, 11-2, and 11-3 corresponding to these periods, respectively.
The empirical findings reveal that prior to and following the financial crisis, the level of financial development exerted a significant positive influence on both sender and recipient effects. However, this influence ceased to be significant during the crisis propagation phase. This aligns with reality, as the financial crisis inflicted severe shocks upon economies with developed financial sectors, particularly those possessing large financial systems yet fragile frameworks—such as Greece and Ireland—where the contagion of debt crises further exacerbated overall instability within the Eurozone. Consequently, during this phase, countries with higher levels of financial development exhibited non-significant relationships with greenfield FDI in financial services. China and the United Arab Emirates stood out during this period due to their robust performance. The empirical results of Model 11 are highly consistent with Model 4, further validating Hypotheses 1–6 and confirming the robustness and reliability of this study’s conclusions.
4.4.3. Markov Monte Carlo Maximum Likelihood Estimation
Markov Monte Carlo Maximum Likelihood Estimation (MCMLE) provides an efficient estimation method suitable for analysing time-series dynamic network data. The methodological contribution of Leifeld et al. (2018) lies not only in providing an advanced tool for analysing complex network data but also in offering new perspectives and methodological pathways for the network research in this paper [17]. By replacing the traditional Time-Exponential Random Graph Model (TERGM) estimation method with MCMLE, an in-depth analysis of the data was conducted while maintaining a two-year time interval. This approach not only optimises the accuracy of model estimation but also enhances the ability to capture dynamic network changes. Empirical results from the revised estimation method are presented in Table 7, Model 10. The results of Model 10 are clearly and highly consistent with those of the preceding Model 4. This consistency further reinforces the credibility of Hypotheses 1–6 proposed in this study. This demonstrates that research findings remain consistent even when employing different statistical methods and model specifications, validating the robustness of this study’s conclusions.
4.4.4. Goodness-of-Fit Test
The Goodness-of-Fit (GOF) test serves as a vital tool for assessing the quality of the TERGM fit. By iteratively incorporating key network statistics, simulated networks are generated to approximate the observed network. GOF plots facilitate a comparison between the observed data and the model-generated data; by plotting the discrepancies in various network statistics, they assist in evaluating whether the model effectively captures the characteristics of the actual data. To verify the model’s ability to reproduce the real-world network, this study conducted network simulations based on the previously fitted TERGM Model 4 using the GOF method. Six network statistics were selected for this assessment: geodesic distance (top-left in Figure 5), geometrically weighted dyad-wise shared partner distribution (gwdsp) (top-middle in Figure 5), geometrically weighted edgewise shared partner distribution (gwesp) (top-right in Figure 5), indegree (bottom-left in Figure 5), outdegree (bottom-middle in Figure 5), and triad census (bottom-right in Figure 5). Based on the estimated parameters of Model 4, 1000 random networks were simulated for each observation period, resulting in a total of 10,000 simulated networks across the ten periods, with the fitting results visualised in Figure 5. In the figure, the solid black lines represent the observed characteristic metrics of the empirical network, the boxplots depict the median and interquartile ranges of the simulation results, and the grey lines indicate the 95% confidence intervals of the simulated networks. Generally, a closer alignment between the observed network and the simulated networks indicates a superior model fit. As shown in Figure 5, the observed values for all characteristic metrics consistently fall within the 95% confidence intervals of the simulations. This indicates a minimal discrepancy between the empirical network and the networks derived from simulation, further demonstrating that the TERGM achieves a robust fit and can effectively elucidate the formation and evolution of the global financial services greenfield investment network (GFS-GFN).
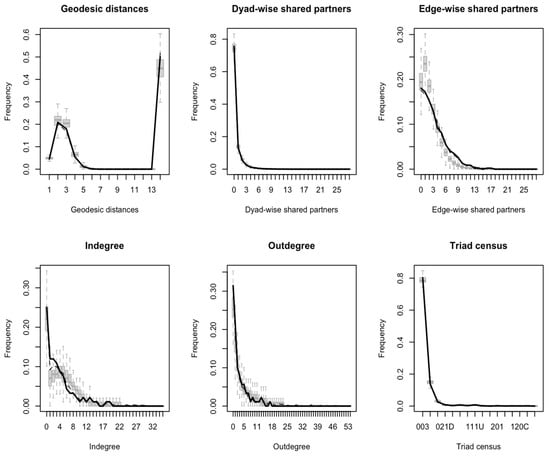
Figure 5.
Results of goodness-of-fit test.
In summary, the empirical results indicate that the formation and evolution of the GFS-GFN are jointly driven by both endogenous and exogenous mechanisms, but endogenous mechanisms play a more critical role. The investment relationships exhibit significant features of reciprocity, preferential attachment, transitive closure, and temporal dependence, thus validating Hypotheses H1–H6. Although exogenous factors have an influence, their effect is diminished with the introduction of endogenous variables. These findings illustrate that the GFS-GFN is not merely shaped by external conditions, but rather is a complex system that continuously evolves through self-organisation based on its existing relational structure.
5. Conclusions and Discussion
5.1. Conclusions
This study employs Social Network Analysis and TERGM to systematically examine the dynamic evolution and endogenous mechanisms of GFS-GFN in the financial services sector, utilising data from 2003 to 2021. The key findings are as follows:
First, the investment network is continuously expanding, yet retains its “small-world” characteristics, with the investment source countries exhibiting prominent “rich club” features. Second, node centrality has evolved from a US-UK “dual-core” structure towards a multi-polar one, as emerging hubs like China, the UAE, and Singapore rapidly approach the traditional centres. Third, the Euro-American-dominated community structure has fractured into five major communities, forming a complementary pattern of “Traditional Centers,” “Resource Corridors,” and “Asia-Pacific Emerging Hubs.”
The formation and evolution of the investment network are primarily driven by endogenous mechanisms. The generation and evolution of the financial service greenfield investment network exhibit certain path dependence characteristics. They are not only influenced by external contextual factors but are also largely affected by reciprocity effects, structural dependence effects, and temporal dependence effects. Investment relationships show significant reciprocity, preferential attachment, and transitive closure. These findings empirically validate the theoretical argument that reciprocity serves as a critical mechanism to overcome the Liability of Foreignness (LOF). In the trust-intensive financial sector, mutual investment ties act as collateral, reducing regulatory uncertainty and facilitating market entry. The observed tendency toward transitive closure supports the “information frictions” hypothesis derived from Chaney (2014) [8]. Financial multinationals appear to rely on indirect connections as trusted information channels, exhibiting “herding” behaviour to mitigate the risks associated with information asymmetry in foreign markets. Concurrently, they demonstrate strong stability and path dependence in the temporal dimension. This illustrates that the financial services greenfield investment network does not merely rely on external conditions, but rather is a complex system that evolves through self-organisation.
Based on these findings, the following policy recommendations are proposed:
(1) Leverage Reciprocity through Institutional Arrangements: Given the strong reciprocity effect, policymakers should prioritise Bilateral Investment Treaties (BITs) that specifically address financial sector market access. Establishing mutual “green lanes” for banking licencing with key partners can institutionalise this reciprocity, effectively lowering the Liability of Foreignness and creating stable, two-way capital channels.
(2) Enhance Hub Centrality via Preferential Attachment: The confirmed “rich-get-richer” mechanism suggests that emerging financial centres (e.g., Shanghai, Dubai) cannot rely solely on domestic market size. They must actively establish direct “financial corridors” with existing global hubs (London, New York) to tap into the preferential attachment mechanism. By positioning themselves as connectors to these “star nodes”, emerging markets can accelerate their integration into the core network.
(3) Utilise Transitivity for Risk Management: For regulators, the strong transitivity and “small-world” nature of the network implies that financial contagion can spread rapidly through indirect links. Regulatory bodies should monitor not just direct exposure but also second-order network risks (partners of partners), using the community structures identified in this study to establish regional financial stability mechanisms.
5.2. Discussions
Our findings contribute to the ongoing debate in financial geography regarding the shifting gravity of global finance. Consistent with Wójcik (2013) [40], our network analysis reveals a clear trend towards multipolarity, challenging the traditional core–periphery dichotomy.
However, this study is not without limitations. First, we analysed an aggregate financial network. As indicated by our descriptive data, the network is composed of heterogeneous sub-sectors like banking and insurance. Future studies should explore sub-sector heterogeneity by constructing separate networks to uncover their distinct evolutionary logics. Second, we employed a binary network model, focusing on connectivity rather than investment intensity. Future research could employ weighted TERGM approaches to incorporate investment volumes for a more granular view. Third, to ensure data continuity, our sample was limited to the top 100 economies, which means smaller developing nations are underrepresented. Finally, regarding the scope of financial integration, while this study focuses on greenfield investment (new capacity creation), we acknowledge that Cross-border Mergers and Acquisitions (M&As) represent another critical mode of integration. As noted by Didier et al. (2019) [41], M&A networks also exhibit strong connectivity driven by information asymmetries. However, greenfield FDI reflects a distinct long-term strategic commitment to host markets, often preceding M&A in the sequence of internationalisation. Future research combining both modes would provide a more comprehensive view of the global financial architecture.
Supplementary Materials
The following supporting information can be downloaded at: https://www.mdpi.com/article/10.3390/systems13121110/s1, Figure S1: Intermediate snapshots of the GFS-GFN evolution: (a) 2008 (Peak before crisis), (b) 2009 (Post-crisis contraction), and (c) 2015 (Recovery phase).
Author Contributions
Conceptualization, G.Z., R.Q., L.W. and F.L.; methodology, F.L. and L.W.; software, F.L.; validation, R.Q., G.Z. and L.W.; formal analysis, F.L.; investigation, G.Z.; resources, R.Q.; data curation, F.L.; writing—original draft preparation, F.L.; writing—review and editing, G.Z. and L.W.; visualisation, F.L.; supervision, R.Q. and L.W.; project administration, G.Z.; funding acquisition, R.Q. All authors have read and agreed to the published version of the manuscript.
Funding
This research was funded by the Key Project of the National Social Science Fund of China, grant number 24AJL014.
Data Availability Statement
The raw data supporting the conclusions of this article were sourced from the fDi Markets database (a proprietary service from Financial Times Ltd.). These data are not publicly available due to licensing restrictions that prohibit the redistribution of raw data. The data may be obtained by any researcher with a valid subscription to fDi Markets. The processed data generated and analysed during the current study are available from the corresponding author upon reasonable request.
Conflicts of Interest
The authors declare no conflicts of interest.
References
- Dunning, J.H. Location and the Multinational Enterprise: A Neglected Factor? J. Int. Bus. Stud. 2009, 40, 5–19. [Google Scholar] [CrossRef]
- Rugman, A.M.; Verbeke, A. Subsidiary-specific Advantages in Multinational Enterprises. Strateg. Manag. J. 2001, 22, 237–250. [Google Scholar] [CrossRef]
- Snyder, D.; Kick, E.L. Structural Position in the World System and Economic Growth, 1955–1970: A Multiple-Network Analysis of Transnational Interactions. Am. J. Sociol. 1979, 84, 1096–1126. [Google Scholar] [CrossRef]
- Claessens, S.; Van Horen, N. Foreign Banks: Trends and Impact. J. Money Credit Bank. 2014, 46, 295–326. [Google Scholar] [CrossRef]
- Lane, P.R.; Milesi-Ferretti, G.M. The Drivers of Financial Globalization. Am. Econ. Rev. 2008, 98, 327–332. [Google Scholar] [CrossRef]
- Haberly, D.; Wójcik, D. Regional Blocks and Imperial Legacies: Mapping the Global Offshore FDI Network. Econ. Geogr. 2015, 91, 251–280. [Google Scholar] [CrossRef]
- Battiston, S.; Puliga, M.; Kaushik, R.; Tasca, P.; Caldarelli, G. DebtRank: Too Central to Fail? Financial Networks, the FED and Systemic Risk. Sci. Rep. 2012, 2, 541. [Google Scholar] [CrossRef] [PubMed]
- Chaney, T. The Network Structure of International Trade. Am. Econ. Rev. 2014, 104, 3600–3634. [Google Scholar] [CrossRef]
- Mugerman, Y.; Yidov, O.; Wiener, Z. By the Light of Day: The Effect of the Switch to Winter Time on Stock Markets. J. Int. Financ. Mark. Inst. Money 2020, 65, 101197. [Google Scholar] [CrossRef]
- United Nations Conference on Trade and Development. World Investment Report 2021: Investing in Sustainable Recovery; United Nations Conference on Trade and Development (UNCTAD) World Investment Report (WIR); United Nations: New York, NY, USA, 2021; ISBN 978-92-1-005463-8.
- Zhou, K.; Kumar, S.; Yu, L.; Jiang, X. The Economic Policy Uncertainty and the Choice of Entry Mode of Outward Foreign Direct Investment: Cross-Border M&a or Greenfield Investment. J. Asian Econ. 2021, 74, 101306. [Google Scholar] [CrossRef]
- Tan, D. Foreign Market Entry Strategies and Post-Entry Growth: Acquisitions vs Greenfield Investments. J Int Bus Stud 2009, 40, 1046–1063. [Google Scholar] [CrossRef]
- Shimizu, K.; Hitt, M.A.; Vaidyanath, D.; Pisano, V. Theoretical Foundations of Cross-Border Mergers and Acquisitions: A Review of Current Research and Recommendations for the Future. J. Int. Manag. 2004, 10, 307–353. [Google Scholar] [CrossRef]
- Robins, G.; Pattison, P.; Kalish, Y.; Lusher, D. An Introduction to Exponential Random Graph (P*) Models for Social Networks. Soc. Netw. 2007, 29, 173–191. [Google Scholar] [CrossRef]
- Lusher, D.; Koskinen, J.; Robins, G. Exponential Random Graph Models for Social Networks: Theory, Methods, and Applications; Cambridge University Press: Cambridge, UK, 2013; ISBN 978-0-521-19356-6. [Google Scholar]
- Snijders, T.A.B.; Van De Bunt, G.G.; Steglich, C.E.G. Introduction to Stochastic Actor-Based Models for Network Dynamics. Soc. Netw. 2010, 32, 44–60. [Google Scholar] [CrossRef]
- Leifeld, P.; Cranmer, S.J.; Desmarais, B.A. Temporal Exponential Random Graph Models with Btergm: Estimation and Bootstrap Confidence Intervals. J. Stat. Softw. 2018, 83, 1–36. [Google Scholar] [CrossRef]
- Leifeld, P.; Cranmer, S.J. A Theoretical and Empirical Comparison of the Temporal Exponential Random Graph Model and the Stochastic Actor-Oriented Model. Net. Sci. 2019, 7, 20–51. [Google Scholar] [CrossRef]
- Hanneke, S.; Fu, W.; Xing, E.P. Discrete Temporal Models of Social Networks. Electron. J. Stat. 2010, 4, 585–605. [Google Scholar] [CrossRef]
- Cranmer, S.J.; Desmarais, B.A. Inferential Network Analysis with Exponential Random Graph Models. Polit. Anal. 2011, 19, 66–86. [Google Scholar] [CrossRef]
- Blonigen, B.A. A Review of the Empirical Literature on FDI Determinants. Atl. Econ. J. 2005, 33, 383–403. [Google Scholar] [CrossRef]
- Kolstad, I.; Wiig, A. What Determines Chinese Outward FDI? J. World Bus. 2012, 47, 26–34. [Google Scholar] [CrossRef]
- Crescenzi, R.; Pietrobelli, C.; Rabellotti, R. Innovation Drivers, Value Chains and the Geography of Multinational Corporations in Europe. J. Econ. Geogr. 2014, 14, 1053–1086. [Google Scholar] [CrossRef]
- Dogaru, T.; Burger, M.; Karreman, B.; van Oort, F. Functional and Sectoral Division of Labour within Central and Eastern European Countries: Evidence from Greenfield FDI. Tijdschr. Econ. Soc. Geogr. 2015, 106, 120–129. [Google Scholar] [CrossRef]
- Hausmann, R.; Hidalgo, C.A. The Atlas of Economic Complexity: Mapping Paths to Prosperity; The MIT Press: Cambridge, MA, USA, 2013. [Google Scholar]
- Xuan, Q.; Li, Y.; Wu, T.-J. Optimal Symmetric Networks in Terms of Minimizing Average Shortest Path Length and Their Sub-Optimal Growth Model. Phys. A Stat. Mech. Its Appl. 2009, 388, 1257–1267. [Google Scholar] [CrossRef]
- Feng, L.; Xu, H.; Wu, G.; Zhao, Y.; Xu, J. Exploring the Structure and Influence Factors of Trade Competitive Advantage Network along the Belt and Road. Physica A 2020, 559, 125057. [Google Scholar] [CrossRef]
- Blondel, V.D.; Guillaume, J.-L.; Lambiotte, R.; Lefebvre, E. Fast Unfolding of Communities in Large Networks. J. Stat. Mech. Theory Exp. 2008, 2008, P10008. [Google Scholar] [CrossRef]
- Newman, M.E.J.; Girvan, M. Finding and Evaluating Community Structure in Networks. Phys. Rev. E 2004, 69, 26113. [Google Scholar] [CrossRef]
- Watts, D.J.; Strogatz, S.H. Collective Dynamics of ‘Small-World’ Networks. Nature 1998, 393, 440–442. [Google Scholar] [CrossRef] [PubMed]
- Spelta, A.; Pecora, N.; Chen, H.-J.; Huang, B. Understanding the Dynamics of the Global FDI Architecture: A Network Analysis. Ann. Oper. Res. 2024. [Google Scholar] [CrossRef]
- Sun, Z.; Cheng, X.; Zhuang, Y.; Sun, Y. Spatial Correlation Network Structure Characteristics of Carbon Emission Efficiency and Its Influencing Factors at City Level in China. Environ. Dev. Sustain. 2024, 26, 5335–5366. [Google Scholar] [CrossRef]
- Guo, F.; Lyu, B.; Lyu, X.; Zheng, J. Social Media Networks and Stock Price Synchronicity: Evidence from a Chinese Stock Forum. Abacus 2025, 61, 419–461. [Google Scholar] [CrossRef]
- Fortunato, S.; Hric, D. Community Detection in Networks: A User Guide. Phys. Rep. 2016, 659, 1–44. [Google Scholar] [CrossRef]
- Liu, L.Q.; Yan, X.F.; Yang, L.S.; Song, M. Research on the Evolution and Endogenous Mechanism of the International Trade Dependence Network. China Ind. Econ. 2021, 37, 98–116. (In Chinese) [Google Scholar] [CrossRef]
- Luo, C.L.; Fu, Z.P.; Liu, B.; Wang, X. Research on the Evolution and Dynamic Mechanism of the International Trade Network for Strategic Emerging Industries. J. Int. Trade 2022, 48, 121–139. (In Chinese) [Google Scholar] [CrossRef]
- Harris, J. An Introduction to Exponential Random Graph Modeling; SAGE Publications, Inc.: Thousand Oaks, CA, USA, 2025. [Google Scholar]
- Eden, L.; Miller, S.R. Distance Matters: Liability of Foreignness, Institutional Distance and Ownership Strategy. In Theories of the Multinational Enterprise: Diversity, Complexity and Relevance; Hitt, M.A., Cheng, J.L.C., Eds.; Emerald Group Publishing Limited: Leeds, UK, 2004; Volume 16, ISBN 978-0-7623-1126-2. [Google Scholar]
- Silk, M.J.; Croft, D.P.; Delahay, R.J.; Hodgson, D.J.; Weber, N.; Boots, M.; McDonald, R.A. The Application of Statistical Network Models in Disease Research. Methods Ecol. Evol. 2017, 8, 1026–1041. [Google Scholar] [CrossRef]
- Wójcik, D. The Dark Side of NY–LON: Financial Centres and the Global Financial Crisis. Urban Stud. 2013, 50, 2736–2752. [Google Scholar] [CrossRef]
- Didier, T.; Herrador, S.; Pinat, M. Network Determinants of Cross-Border Merger and Acquisition Decisions; International Monetary Fund: Washington, DC, USA, 2019; ISBN 978-1-5135-1255-6. [Google Scholar]


Disclaimer/Publisher’s Note: The statements, opinions and data contained in all publications are solely those of the individual author(s) and contributor(s) and not of MDPI and/or the editor(s). MDPI and/or the editor(s) disclaim responsibility for any injury to people or property resulting from any ideas, methods, instructions or products referred to in the content. |
© 2025 by the authors. Licensee MDPI, Basel, Switzerland. This article is an open access article distributed under the terms and conditions of the Creative Commons Attribution (CC BY) license (https://creativecommons.org/licenses/by/4.0/).