Abstract
As regional integration accelerates globally, green development has emerged as a pivotal imperative for reconciling economic growth with environmental sustainability. This study employs a Difference-in-Differences framework incorporating city and year fixed effects to examine the impact of regional integration on green development efficiency in China’s Yangtze River Delta. The empirical findings reveal that regional integration significantly undermines green development efficiency, a conclusion corroborated by rigorous robustness checks including parallel trends and placebo tests. Mechanism analysis demonstrates that trade openness and digital economy development function as partial mediating channels that modestly attenuate the direct adverse effect of regional integration, whereas the decline in secondary industry agglomeration amplifies the negative impact. Notably, innovation capability has yet to fully unlock its potential for green transformation, it intensifies the negative effects of regional integration across all three mediating mechanisms. Building on these findings, this study proposes policy recommendations including strengthening multi-level green governance frameworks, integrating ecological compensation and carbon trading systems, advancing low-carbon trade structures, promoting the synergistic development of digitalization and green transformation, facilitating the green transition of secondary industries, and reinforcing green technology innovation. These insights provide empirical evidence and policy references for achieving coherence between regional integration and sustainable development objectives.
1. Introduction
In the context of globalization, regional integration has become a strategic response for countries and regions to address external uncertainties. By enhancing interregional coordination, regional integration promotes more efficient resource allocation and strengthens economic performance. Nevertheless, the integration process often entails large-scale agglomeration and the mobility of capital and labor, which may in turn exacerbate resource consumption and environmental pressures. Against this backdrop, green development efficiency (GDE), which reflects the balance between economic growth and environmental protection, has attracted considerable attention from both scholars and policymakers. However, whether regional integration contributes to enhancing green development efficiency remains a subject of theoretical debate and empirical divergence.
China’s experience in this domain offers an especially representative case. In 2006, energy conservation and emission reduction were, for the first time, incorporated into the binding indicators of China’s national economic and social development plan. In 2007, the concept of “ecological civilization” was officially established as a national strategic priority, marking a fundamental shift in the country’s development paradigm. As one of the most dynamic and economically vibrant regions in China, the Yangtze River Delta (YRD) bears the dual responsibility of achieving high-quality economic growth while advancing ecological sustainability. From the early establishment of the Urban Economic Coordination Council to the elevation of YRD integration into a national strategy in 2018, the scope and depth of regional cooperation have continued to expand. By 2024, the Yangtze River Delta (YRD) region accounted for less than 4% of China’s land area but was concentrated with nearly 17% of the national population and generated almost one-quarter of national GDP. However, the Yangtze River Delta (YRD) region is characterized by intensive energy consumption and carbon emissions, with environmental quality in certain cities yet to align with their socioeconomic development. Advancing green development efficiency remains an issue that requires deeper exploration.
The objective of this study is to provide a systematic examination of how regional integration influences green development efficiency in the Yangtze River Delta (YRD). It also aims to propose policy recommendations for optimizing regional integration strategies. These strategies seek to maximize the efficiency of green development while minimizing potential negative externalities. The main contributions of this study are as follows: it comprehensively accounts for the expansion in the number of cities and employs a quasi-natural experimental framework based on the Difference-in-Differences (DID) method. Rather than merely assessing the level or quality of green development, this study emphasizes the impact of regional integration on urban green development efficiency. Moreover, this study can reveal the dynamic evolution of regional integration’s effects on green development across different stages. In contrast to conventional studies that focus primarily on factors such as industrial structure and trade openness, this study incorporates the digital economy and technological innovation as emerging production factors into the analytical framework, and further examines the mediating and moderating mechanisms involved. This broadens the theoretical pathways through which regional integration influences green development efficiency. The results will provide data-driven evidence and targeted insights to improve green development efficiency in the YRD and other similar regions.
The remainder of this paper is organized as follows. Section 2 reviews the relevant literature. Section 3 develops the theoretical framework and research hypotheses. Section 4 describes the study area, model specification, variable description and data source. Section 5 presents the empirical results, including robustness checks and mechanism verification. Section 6 discusses the findings. The final section concludes with key insights and policy recommendations.
2. Literature Review
2.1. Regional Integration
Tinbergen [] was among the first to explore the concept of integration from an economic perspective. He argued that different countries or regions could achieve integrated development by enhancing economic cooperation, reducing trade barriers, establishing common markets, and coordinating economic policies. Building on this foundation, Haas [] emphasized that economic cooperation could also drive institutional convergence. Subsequently, Balassa [] provided a more systematic framework, proposing that regional integration is a progressive process that begins with “trade integration”, advances through “factor integration” and “policy integration”, and ultimately culminates in “complete integration”. Various regions have pursued intercity integration to enhance global competitiveness and promote sustainable development.
Scholars have adopted various approaches to measuring regional integration. Some focus on single-dimensional indicators such as economic coordination, market integration, or industrial linkage [], while others employ multi-dimensional composite index systems to provide a more comprehensive assessment of integration levels [,,,]. In recent years, many scholars have employed the Difference-in-Differences (DID) method to assess the effects of regional integration on economic performance, environmental outcomes, and other dimensions. Feng et al. [] found that the impact of regional integration on economic resilience varies significantly across time periods, regions, and urban structures. Further research indicates that while regional integration policies can effectively strengthen economic resilience, they have limited influence on social and infrastructural resilience and may even exert adverse effects on ecological resilience []. Another study applied a DID approach to examine the effect of the YRD Economic Coordination Council on improvements in energy efficiency across the urban agglomeration []. Guo et al. [] applied a multi-period DID model to panel data from 285 Chinese prefecture-level cities (2003–2018), finding that government-led regional integration significantly boosted per capita GDP.
2.2. Green Development Efficiency
From an input–output perspective, green development efficiency (GDE) refers to the comprehensive ability to optimize resource utilization efficiency under existing resource input levels, thereby maximizing desirable outputs, such as economic benefits and ecological improvements, while simultaneously minimizing undesirable environmental outputs. Unlike traditional measures of economic efficiency, GDE emphasizes the reduction in undesirable outputs, highlighting the balance between economic activity and ecological protection []. The development of efficiency measurement methods such as Data Envelopment Analysis (DEA) in the 1990s provided key methodological tools for quantifying GDE. The Slack-Based Measure (SBM) model further refines traditional DEA by incorporating input and output slacks, allowing for the inclusion of undesirable outputs in efficiency evaluations [].
A growing body of literature has examined the impact of regional integration on green development efficiency. Hou and Song [] demonstrates that market integration significantly enhances regional green total factor productivity (GTFP). This positive impact not only manifests directly within the region but also indirectly promotes GTFP growth in neighboring areas. Wang et al. [] finds that regional integration improves urban green development efficiency, exhibits spatial spillover effects and heterogeneity across different urban agglomerations. Feng et al. [] reveals that regional integration in the Yangtze River Economic Belt fosters inclusive green growth by urban innovation capacity.
In terms of traditional determinants, Lu et al. [] identified industrial structure, environmental regulation, and urbanization level as key drivers. Specifically, industrial structure positively contributes to efficiency improvement, whereas environmental regulation and urbanization have negative effects. Si et al. [] highlighted that per capita GDP, industrial structure, technological innovation, population density, education investment, and transportation infrastructure all significantly influence green development efficiency.
Gu et al. [] found that regional collaborative innovation not only directly enhances urban green development efficiency but also positively moderates the impact of industrial digitalization. Drawing on panel data from 2011 to 2021, Liu et al. [] utilized panel data spanning 2011–2021 and employed a coupling coordination model to examine the mechanism through which digital–physical integration influences regional green development efficiency. Zhang et al. [] highlighted that the digital economy enhances urban green development efficiency by fostering the agglomeration of innovative human capital.
2.3. Summary
Although existing studies have made substantial contributions to the fields of regional integration and green development efficiency, there remain gaps in methodological approaches and mechanistic analysis. In the field of regional integration, most existing studies rely either on single-dimensional indicators, or constructs multidimensional composite indices, which struggle to capture the comprehensive impact of formal institutional arrangements or isolate their specific effects. The limited studies applying the Difference-in-Differences (DID) approach generally adopt a single policy implementation timeframe with static control and treatment groups, thereby neglecting the dynamic expansion of regional integration policies and failing to reflect the phased evolution and cumulative effects of the integration process. In the domain of green development efficiency, the selection of input and output indicators in DEA often lacks robust theoretical grounding, with some outputs narrowly emphasizing economic benefits. Moreover, the efficiency scores generated by DEA are typically used directly in regression analyses without sufficiently accounting for the inherent uncertainty or potential estimation errors. More importantly, from the perspective of urban agglomerations that are in the process of development and maturation, the mediating and moderating mechanisms through which regional integration influences green development efficiency have not been adequately explored.
3. Theoretical Analysis and Hypotheses Development
Both neoclassical growth theory and new economic geography generally suggest that regional integration can reduce transaction costs and cross-regional frictions, thereby facilitating the spatial reallocation of production factors [,]. Regional integration promotes healthy interregional competition and policy coordination [], and contributes to improving the efficiency of green development. However, when regional integration prioritizes economic growth over green development, local governments may shift environmental governance responsibilities to other regions and adopt short-term growth strategies focused on attracting investment and enhancing regional competitiveness. Moreover, throughout the integration process, polluting and energy-intensive enterprises may relocate from strictly regulated core cities to peripheral areas, creating a regional “pollution haven” effect. The large population scale also entails intensive energy consumption, waste generation, and land occupation, thereby exerting considerable strain on the region’s environmental carrying capacity. When the development of green infrastructure fails to keep pace with the rapid expansion of socioeconomic activities, it may even reduce the efficiency of green development. This phenomenon aligns with Externalities Theory [] and the Environmental Kuznets Curve (EKC) hypothesis [].
Although cities involved in regional integration have promoted green development through increased investment and the expansion of green infrastructure, their excessive reliance on factor inputs, coupled with the diseconomies of scale arising from population agglomeration, has substantially raised the environmental cost per unit of output, thereby leading to a pattern of high input but low efficiency in green development [,]. In some cases, limitations in technology, policy, or managerial capacity during environmental governance and industrial upgrading have also resulted in a temporary decline in green development efficiency [,]. By contrast, cities that have prioritized green development from the outset may not occupy a leading position in terms of overall green development levels due to scale and resource constraints, yet through structural transformation they can still realize a latecomer advantage in green development efficiency [,]. Therefore, we propose Hypothesis 1.
H1:
Regional integration may undermine green development efficiency by privileging economic growth, enabling pollution transfer, and perpetuating high-input development patterns.
From the perspective of trade structure [], the Yangtze River Delta integration has dismantled inter-provincial administrative barriers, lowered intra- and inter-regional trade costs, and substantially increased the degree of trade dependence among cities. Yet the resulting ‘competitive convergence,’ as cities race to expand export-oriented industries, has led to extensive duplication of construction, undermining resource allocation efficiency and aggravating environmental pressures. In regions characterized by high trade openness, the disproportionate concentration of energy-intensive and emission-intensive segments within the value chain cultivates path dependence and institutional inertia, significantly escalating the costs associated with transitioning to green technological innovations. Moreover, excessive trade openness can erode green development efficiency through channels such as ‘carbon leakage’ and ‘embodied carbon transfer,’ pushing regions into a ‘growth trap’ where the welfare gains of green development diminish []. The theory of ‘policy priority sequencing’ [] further suggests that, under resource constraints, trade expansion and environmental protection objectives are inherently in competition. The prioritization of trade can intensify environmental pressures, a phenomenon that is particularly pronounced in regional integration processes that emphasize economic growth.
Regional integration in the Yangtze River Delta has driven the agglomeration of secondary industry enterprises in areas with convenient transportation, large markets, and well-developed industrial linkages, enabling them to reap agglomeration benefits such as economies of scale, knowledge spillovers, and shared labor markets from Marshallian externalities []. However, secondary industries, particularly manufacturing and heavy industries, are energy-intensive sectors. Strong path dependencies may reinforce a high-energy-consumption growth model, and when such agglomeration surpasses the region’s environmental carrying capacity, negative externalities arise, impeding the shift toward green development []. In the context of regional integration, secondary industry agglomeration may also trigger broader “race-to-the-bottom” competition, reducing regional green development efficiency, especially in stages where relevant green standards and regulations are weak or ambiguous.
During the regional integration of the Yangtze River Delta, collaborative initiatives have accelerated the development of digital infrastructure and enabled the cross-regional flow of data as a critical production factor. Nevertheless, while reducing search, matching, and transaction costs, the rise in the digital economy has simultaneously induced an exponential surge in the scale of goods, services, and capital. The escalating resource consumption, structural imbalances, and superficial application patterns arising from this digital production and consumption model not only impose significant environmental pressures but may also offset or even surpass the efficiency gains delivered by digital technologies []. Furthermore, the inherently high energy consumption of digital infrastructure may result in a significant increase in carbon emission intensity. This effect is particularly pronounced in cases where new infrastructure, such as data centers, 5G base stations, and computing hubs, predominantly relies on fossil fuel-based energy sources. Moreover, the efficiency gains driven by digital technologies in traditional industrial and manufacturing sectors frequently translate into capacity expansion rather than green transformation, which collectively undermine overall green development efficiency.
Therefore, we propose Hypothesis 2a, Hypothesis 2b, and Hypothesis 2c.
H2a:
Regional integration enhances trade openness, which subsequently exerts a negative mediating effect on green development efficiency through mechanisms such as competitive convergence, carbon leakage, and embodied carbon transfer.
H2b:
The agglomeration of secondary industries driven by regional integration may generate negative externalities and path dependence, thereby exacerbating the decline in green development efficiency.
H2c:
When regional integration prioritizes economic scale expansion, the digital economy may generate rebound effects and amplify the negative impact of regional integration on green development efficiency.
Regional integration, by expanding markets and lowering transaction costs, creates broader opportunities and scale economies for technological innovation and application. Yet it may also trigger the Jevons paradox []. In contexts dominated by high trade openness, secondary industry agglomeration, and rebound effects from the digital economy, innovation can drive larger-scale production and increased energy use, ultimately undermining the efficiency of green development. Innovation activities often exhibit pronounced path dependence [], where established technological trajectories generate self-reinforcing mechanisms. The competitive pressures induced by regional integration may drive cities and enterprises to prioritize short-term comparative advantages over high-risk, long-term transformative green technology innovation. When innovation resources within a region are predominantly allocated to trade-oriented activities, traditional secondary industries, or high-return but energy-intensive digital technological domains, a crowding-out effect on green technology innovation may emerge. This technological bias is reinforced through learning effects and network externalities, particularly when enterprises lack sufficient environmental responsibility or face inadequate institutional and policy support for green development. Consequently, enterprises may favor incremental improvements within existing technological frameworks over disruptive green technological advancements.
Therefore, we propose Hypothesis 3.
H3:
Although innovation is typically regarded as a key driver of green development, under the mediating influences of low value-added trade, traditional secondary industry agglomeration, and the rebound effects of the digital economy, it may also amplify the negative impact of regional integration on green development efficiency.
The theoretical analysis framework is presented in Figure 1.
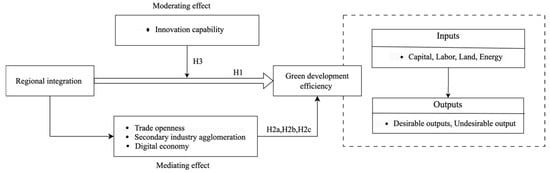
Figure 1.
Theoretical analysis framework.
4. Material and Methods
4.1. Study Area
The Yangtze River Delta (YRD) region, located along China’s eastern coastal area, spans the provinces of Jiangsu, Zhejiang, and Anhui, along with Shanghai, covering a total area of approximately 358,000 square kilometers (Figure 2). As one of the country’s earliest and most dynamic urban agglomerations, the YRD is characterized by a high degree of trade openness, strong manufacturing agglomeration, and a pivotal role as a national hub for technological innovation and the digital economy. In 1997, the Yangtze River Delta City Economic Coordination Council was formally established, transforming intercity cooperation from a spontaneous process into a structured mechanism supported by the high-level “Mayors’ Joint Conference.” In its initial phase, the integration of the YRD prioritized economic growth and industrial competitiveness as primary objectives. The Regional Plan for the Yangtze River Delta (2010–2020), approved by the central government in 2010, identified 16 core cities, consistent with the membership of the City Economic Coordination Council, while gradually incorporating ecological development and environmental protection into the integration agenda through coordinated governance mechanisms. The Yangtze River Delta Urban Agglomeration Development Plan of 2016 expanded the scope to 26 cities. In 2019, the Outline of the Yangtze River Delta Regional Integration Development Plan further extended coverage to all 41 cities across Shanghai, Jiangsu, Zhejiang, and Anhui, and increased the number of designated core cities to 27. The integration and expansion of the YRD region serves as a suitable empirical foundation for applying a Difference-in-Differences (DID) analytical approach.
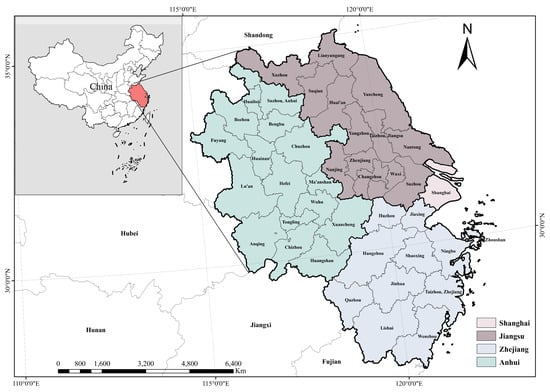
Figure 2.
Geographical location of the Yangtze River Delta. Note: The figure is produced using ArcGIS 10.8.2 software based on the Standard Map with the review number GS(2024)0650 from the National Platform for Common GeoSpatial Information Services of China, with no modification to the base map boundaries. The dotted lines indicate latitude–longitude grids.
4.2. Model Specification
This study adopts the DID method because regional integration policies constitute an exogenous intervention with clearly defined temporal nodes and geographical boundaries. The quasi-experimental framework of DID effectively isolates the policy’s causal impact from confounding factors, enabling precise identification of the net effect of regional integration on green development efficiency. In contrast, measuring regional integration levels with composite indices may lead to inconsistent results due to differences in indicator selection and weighting, while also raising potential endogeneity concerns. Whether comparing a city’s green development efficiency before and after regional integration, or between the treatment and control groups, the estimates may be confounded by unobserved time effects or individual heterogeneity, potentially leading to estimation bias. To mitigate this issue, this study follows the methodological framework of Abadie [] and employs a multi-period Difference-in-Differences (DID) model to systematically evaluate the impact of the YRD regional integration on green development efficiency. Grounded in theoretical analysis, this study further develops a mediation effect model [,] and extends it by incorporating moderating effects to provide a comprehensive assessment [,].
In Equations (1)–(4), represents a city; represents a year; denotes the dependent variable, measuring a city’s green development efficiency; is the core explanatory variable, equal to 1 if the city participates in the YRD integration in year and 0 otherwise; is a vector of control variables; denotes the mediating variables that captures the mechanism through which regional integration may affect green development efficiency; is the moderating variables that conditions the relationship between regional integration and green development efficiency, while represents the interaction term used to test the moderating effect; (j = 0,1,2,3) represents the intercept term across the different model settings; (j = 0,1,2,3) captures the effect of regional integration on green development efficiency under each model; and are the coefficients to be estimated for the corresponding explanatory variables; is the parameter vector associated with the control variables; and capture time and city fixed effects, respectively; and is the random error term. This approach provides a more nuanced understanding of how these factors amplify or weaken the impact of regional integration, thereby offering more targeted empirical evidence for optimizing integration policies and advancing sustainable development. All empirical analyses were conducted using Stata 17.0 software.
4.3. Variable Description
4.3.1. Dependent Variable
The dependent variable is green development efficiency (GDE). Following Tone [], this study applies a super-efficiency slack-based measure (Super-SBM) model with undesirable outputs to evaluate regional GDE [,]. This approach accommodates input and output slacks, incorporates undesirable outputs, and overcomes the inability of conventional DEA models to differentiate decision-making units (DMUs) with an efficiency score of one. However, treating DEA efficiency scores as deterministic inputs in regression models overlooks the inherent sampling variability and statistical uncertainty embedded in these estimates, violating the assumption that error terms must be independent and identically distributed (i.i.d.) []. This leads to biased estimation results and invalidates statistical inference. To address these issues, this study employs the bootstrap bias correction procedure proposed by Simar and Wilson [,]. Following the computation of initial DEA efficiency scores, we perform 2000 bootstrap resamples with replacement, recalculating DEA efficiency values for each resampled dataset. By comparing the efficiency estimates from the bootstrap samples with the original efficiency values, we calculate the expected systematic bias. Finally, this bias is subtracted from the original efficiency estimates (GDE*) to derive the bias-corrected Green Development Efficiency (GDE) values, which serve as the dependent variable in the Difference-in-Differences (DID) analysis.
The GDE input–output indicator system is shown in Table 1. Inputs are categorized into capital, labor, land, and energy. Capital input is proxied by fixed asset stock, calculated using the perpetual inventory method []. Labor input is measured by the year-end number of employed persons [,]. Land input is represented by urban construction land area, reflecting both land resources and their allocation in economic development [,]. Energy input includes total electricity consumption, total supply of liquefied petroleum gas and natural gas, total available water resources [,]. Outputs comprise desirable and undesirable components. Desirable outputs include: (i) GDP, indicating economic performance; (ii) per capita disposable income of urban residents, reflecting social welfare and living standards; and (iii) urban park green space area, representing ecological construction level []. The undesirable output is carbon emission intensity, capturing the environmental burden of production activities [,,].

Table 1.
GDE input–output indicator system.
4.3.2. Explanatory Variable
The explanatory variable captures the policy intervention of the YRD regional integration. Within the multi-period Difference-in-Differences (DID) framework, if city is in the treatment group in year , and if it is in the control group. Given data availability and China’s policy timeline for advancing ecological civilization, the sample period starts in 2006. Prior to the release of the Yangtze River Delta Regional Plan (2010–2020) in 2010, 16 cities had already joined the YRD Economic Coordination Council and initiated coordinated development; these are coded as 1, and all others as 0. Cities included in the national plan in 2016 and 2019 are coded 1 from the year of inclusion, and the remaining cities are coded 0. The cities incorporated into the YRD urban agglomeration in each period are shown in Table 2.
Table 2.
The expansion process of the YRD regional integration.
4.3.3. Control Variables
Population size (POP) reflects the total number of people living in a city and serves as a key indicator of a city’s resource demand and development intensity [,,]. Economic development level (PGDP) affects green development efficiency by shaping resource allocation and the implementation of environmental policies [,]. Government fiscal expenditure (GFE) plays a crucial role in determining green development efficiency through its impact on environmental governance, green infrastructure development, and sustainable technology promotion [,,]. Environmental governance (EG) reflects the regional policy intensity in environmental protection and the cleanliness of production practices [,].
The four control variables are represented by the permanent resident population, GDP per capita, the amount of general government budgetary expenditure, and industrial SO2 emissions, all of which are expressed in natural logarithms form in the econometric analysis.
4.3.4. Mediating Variables
Drawing on the theoretical framework and existing literature, this study identifies trade openness (TO) [,], secondary industry agglomeration (IAS) [,,], and the digital economy (DE) [,,] as mediating variables to elucidate the pathways through which regional integration influences green development efficiency.
Trade openness (TO) is measured as the ratio of total imports and exports to GDP. Following prior studies and considering data availability [,,], the digital economy (DE) is primarily based on the Peking University Digital Inclusive Finance Index. Secondary industry agglomeration (IAS) is typically measured using the Location Quotient (LQ) [,,]. TO and DE are expressed in natural logarithms form in the econometric analysis.
4.3.5. Moderating Variables
Innovation capacity (IC) comprises key components including technological progress, knowledge accumulation, and human capital [,,]. This study constructs a composite indicator for each city-year, based on patent grants, the number of college students per 10,000 population, and investment in science and technology, thereby capturing regional innovation capability.
4.4. Data Source
This study utilizes panel data covering 41 cities in the Yangtze River Delta from 2006 to 2021. Most of the data are drawn from the Express Professional Superior database (EPS, http://olap.epsnet.com.cn/; accessed on 10 October 2025), a specialized platform for macroeconomic data analysis and forecasting. Carbon emissions data are obtained from the China Enterprise Greenhouse Gas Emissions Accounting Platform (IPE, https://www.ipe.org.cn/; accessed on 20 September 2025). To ensure completeness, missing values were supplemented with information from local statistical yearbooks, statistical bulletins, and government work reports. The final dataset consists of 656 observations.
5. Empirical Results
5.1. Descriptive Statistics
Table 3 presents the descriptive statistics of the key variables. Green Development Efficiency (GDE and GDE*) exhibits regional variation. The explanatory variable RI indicates that approximately half of the sample cities are in the treatment group. Other variables, reflect pronounced differences in economic foundations and resource endowments among Yangtze River Delta cities, forming a solid empirical basis for the subsequent analysis of how regional integration policies affect green development efficiency.
Table 3.
Descriptive Statistics of Main Variables.
5.2. Baseline Regression Results
The core assumption of the Difference-in-Differences (DID) framework requires that, in the absence of intervention, the trends in the outcome variable over time are identical for the treatment and control groups [,]. Moreover, the selection of cities for the regional integration policy was not randomly assigned but is instead correlated with city-specific characteristics []. Consequently, this study employs a two-way fixed effects model, utilizing city and year fixed effects to mitigate the influence of time-invariant omitted variable bias and common time trends. Additionally, we apply city-level clustered robust standard errors to address the underestimation of standard errors arising from serial correlation and heteroskedasticity due to the persistence of policy effects, thereby ensuring the reliability of causal inference [,]. To validate the model’s appropriateness, Table 4 presents the estimation results across four models: a simple DID model without fixed effects (column 1), a model with only time fixed effects (column 2), a model with only city fixed effects (column 3), and a two-way fixed effects model (column 4).
Table 4.
Baseline regression results.
The results show that the goodness of fit in column (1) is extremely low (0.031), indicating that the model has very limited explanatory power when fixed effects are not controlled for. Although column (2) incorporates year fixed effects, its explanatory capacity remains weak. This suggests that while nationwide macroeconomic shocks are accounted for, city-specific heterogeneity is still not addressed, thereby preventing accurate identification of the net effect of regional integration. In contrast, the results in columns (3) and (4) demonstrate that once city fixed effects are included, the explanatory power of the model improves substantially. These findings are consistent with prior research in Difference-in-Differences estimation [,]. Accordingly, the two-way fixed effects specification is adopted as the benchmark model for the subsequent analysis.
In column (4), the coefficient of regional integration (RI) is negative (−0.097) and statistically significant at the 5% level, indicating the inhibiting effect of RI on GDE persists after accounting for demographic, economic, fiscal conditions, and environmental governance conditions. The coefficients of LNPOP and LNPGDP are not statistically significant, suggesting that population size and economic level exert limited influence on GDE. By contrast, LNGFE has a negative and statistically significant coefficient (−0.205), implying that increases in local government spending are associated with lower green development efficiency. LNEG also have a negative and statistically significant coefficient indicating that higher SO2 emissions are associated with lower green development efficiency, highlighting the critical role of environmental governance in promoting sustainable development.
5.3. Parallel Trend Test
A fundamental prerequisite for the Difference-in-Differences (DID) approach is that the treatment and control groups satisfy the parallel trend assumption, meaning that their variables exhibit similar trajectories prior to policy implementation. In this study, since cities in the Yangtze River Delta (YRD) were incorporated into the regional integration (RI) development plan in different years, the timing of treatment varies across cities. To account for this, policy implementation is represented by a set of dummies, with key years identified as 2006, 2016 and 2019. Specifically, the year immediately prior to implementation is coded as pre1, two years before as pre2, and so forth, with all years earlier than eight years before the policy uniformly coded as pre8. Similarly, the year following the policy is coded as post1, two years after as post2, and so on, with all years beyond eight years after the policy grouped into post8.
Figure 3 illustrates that during the pre-treatment phase (pre8 to pre2), the confidence intervals all include zero, indicating that the estimated coefficients for these time points are statistically insignificant. This suggests that, prior to policy implementation, there were no systematic differences in green development efficiency between the treatment and control groups, thereby supporting the validity of the parallel trends assumption. The coefficients for post2 to post5 are negative and statistically significant at the 10% level, with the negative impact becoming more pronounced at post7. These findings indicate a delayed effect of the policy, with green development efficiency significantly declining two years after the implementation of regional integration. Furthermore, the results suggest that cities in the implementation region (RI) do not necessarily exhibit higher green development efficiency compared to those in the non-implementation (non-RI) regions.
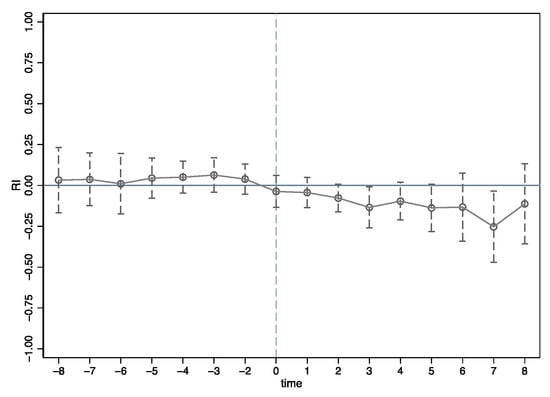
Figure 3.
Parallel trend test results.
5.4. Placebo Test
The placebo test is utilized to eliminate spurious correlations and confirm model robustness by simulating fictitious treatments [,]. This study employs a random resampling to assign placebo treatment years for regional integration across 41 cities. Fixed-effects regressions, incorporating control variables, are conducted over 1000 simulations to estimate the coefficients, standard errors, and p-values of the placebo treatment variable [,,]. As shown in Figure 4, the estimated coefficients of the placebo integration variable are clustered around zero, with most p-values exceeding 0.1. In contrast, the baseline regression coefficient for regional integration (−0.097, p-value = 0.019, Table 4, column 4) stands out as a significant outlier, suggesting that the observed effect is unlikely to result from unobserved random factors, thereby reinforcing the robustness of the study’s conclusions.
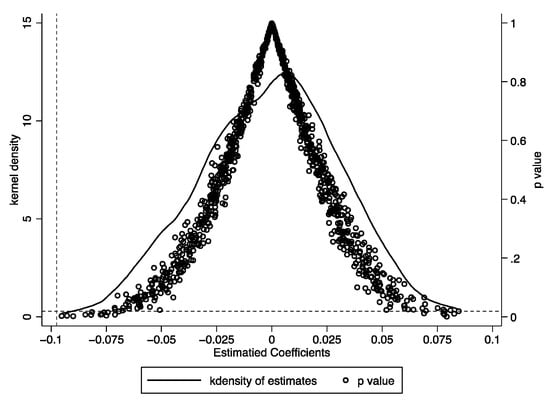
Figure 4.
Placebo test results.
5.5. Mechanism Verification
5.5.1. Mediating Effect Analysis
Following the three-step regression approach proposed by Baron and Kenny [] and the results of the baseline model, this study investigates the mediating roles of trade openness (LNTO), secondary industry agglomeration (IAS), and digital economy (LNDE) in the impact of regional integration (RI) on green development efficiency (GDE). To ensure the robustness of statistical inferences, the Sobel test [] and a bootstrap method [] with 500 resampling iterations were employed to assess the significance of the mediation effects. Detailed results are presented in Table 5. Columns (1), (3), and (5) of Table 5 report the second-step regression results, showing the effects of regional integration on trade openness (LNTO), secondary industry agglomeration (IAS), and digital economy (LNDE), respectively. Columns (2), (4), and (6) present the third-step regression results after incorporating these variables into the baseline model.
Table 5.
Mediating effect analysis results.
The findings indicate that regional integration significantly promotes trade openness (0.205, 1%) and the development of the digital economy (0.077, 10%), while reducing the agglomeration of secondary industries (−0.039, 10%). Upon incorporating the mediating variables, all three mediators exhibit a significant negative impact on green development efficiency. Compared to the baseline model, the inclusion of LNTO and LNDE reduces the RI coefficient to −0.072 and −0.079, respectively, whereas the inclusion of IAS strengthens the RI coefficient to −0.111. The Sobel test further confirmed the significance of these mediating effects, with the indirect effects of trade openness (LNTO), secondary industry agglomeration (IAS), and the digital economy (LNDE) accounting for approximately 26.2%, −14.2%, and 18.7% of the total effect, respectively. In addition, the 95% bias-corrected confidence intervals obtained from 500 bootstrap replications excluded zero and provide further support for these findings.
These results collectively indicate that trade openness (LNTO), secondary industry agglomeration (IAS), and digital economy (LNDE) serve as significant mediators in the relationship between regional integration and green development efficiency.
5.5.2. Moderating Effect Analysis
Table 6 presents the results of the moderating effects of innovation (IC) and its interaction with regional integration (RI), building on the three mediation mechanisms. Across all models, the coefficients for IC are positive and statistically significant at the 1% or 5% level (ranging from 2.422 to 2.628). The interaction term between RI and IC is consistently negative and significant at the 5% level (ranging from −1.915 to −2.094). These findings indicate that innovation capacity amplifies the negative direct effect of regional integration on green development efficiency (GDE).
Table 6.
Moderating effect analysis results.
6. Discussion
6.1. The Adverse Effect of Regional Integration on Green Development Efficiency
In the baseline analysis, the coefficient of regional integration is negative and significant. This finding supports Hypothesis 1, indicating that regional integration, which prioritizes economic growth and high-input development models, may also hinder improvements in green development efficiency [,].
Population size and per capita GDP exhibit no significant effect on green development efficiency, suggesting that in the Yangtze River Delta, the scale effects of population and the associated increase in economic activities have only a limited direct influence [,]. Alternatively, the impact of population size and economic development level on green development efficiency may be far more complex than anticipated, potentially exhibiting nonlinear effects [,,].
Consistent with the findings of [], government budget expenditure has a significant negative effect on green development efficiency. This may reflect that, in the context of regional integration, government spending is disproportionately directed toward infrastructure and industrial support aimed at economic growth, while relatively less is allocated to environmental technologies and green industries []. Consequently, such expenditures have not been effectively translated into improvements in green development efficiency. Certainly, another contributing factor is the reverse causal effect stemming from institutional arrangements that grant greater expenditure authority to regions with lower green development efficiency [,].
Environmental governance, as an institutional framework, imposes restrictions on SO2 emission through emission standards, environmental taxes, and emissions trading schemes. These measures can encourage firms to internalize pollution costs and foster the development of clean production technologies [,]. However, if SO2 emissions are not effectively controlled, environmental carrying capacity may be compromised, ultimately reducing the efficiency of green development.
6.2. Heterogeneous Mediation by Trade Openness, Industrial Agglomeration, and Digital Economy in Regional Integration’s Effects on Green Development Efficiency
Empirical results indicate that regional integration promotes trade openness, consistent with hypothesis H2a. This is consistent with the findings of [,], the facilitation of cross-border trade driven by regional integration. However, as highlighted by [,], due to substantial variations in environmental regulatory standards and enforcement across regions, trade openness within the framework of regional integration may undermine green development efficiency by intensifying competition in energy-intensive imports. Further analysis reveals that the indirect effect of trade openness slightly mitigates the direct negative impact of regional integration on green development efficiency. In other words, when the pathway of trade openness is not considered, the negative relationship is partially overstated.
The mediating effect of secondary industry agglomeration shows that the deepening of regional integration dismantles existing market fragmentation and geographical barriers, facilitating the relocation of secondary industries and consequently reducing the degree of agglomeration. However, as highlighted in the existing literature [,], the relocation and agglomeration of secondary industries during the integration process can generate significant negative externalities in the absence of effective environmental regulations and cooperative mechanisms, thereby further suppressing green development efficiency. This validates hypothesis H2b. Further analysis reveals that the mitigating effect of reduced secondary industry agglomeration on the suppression of green development efficiency is offset by the enhanced direct effect of regional integration.
The results of the digital economy’s mediating effect indicate that regional integration provides foundational support for digital economy development, thereby promoting its growth. However, the digital economy intensifies the negative effect of regional integration on green development efficiency, reflecting its double-edged nature []. On the one hand, digital technologies such as big data, cloud computing, and the Internet of Things enhance information flows and resource allocation, thereby improving overall economic efficiency []. On the other hand, the rapid expansion of the digital economy may trigger a rebound effect during the integration process, intensifying environmental pressures [], thus validating hypothesis H2c. Further analysis reveals that the digital economy also acts as a partial suppressing mediator, slightly offsetting the direct negative effect of regional integration on green development efficiency. In other words, when the pathway of the digital economy (LNDE) is not considered, the initial negative association is overstated.
6.3. Innovation and the Digital Economy as Reinforcers of the Negative Effect of Regional Integration on Green Efficiency
Although innovation is typically regarded as a key driver of green development [,], the moderating analysis reveals that, even when accounting for the mediation effects of trade openness, secondary industry agglomeration, and the digital economy, innovation capacity amplifies the negative impact of regional integration on green development efficiency. This aligns with Hypothesis H3, suggesting that under regional integration, innovation-leading regions focus on technologies favoring economic growth, thereby reinforcing the negative effects of low-end, high-input trade patterns. Additionally, R&D resources are often allocated to technological fixes for high-carbon industries within the non-digital economy. This indicates that green-oriented innovation has not yet achieved sufficient scale effects or effective market application, thereby exacerbating the adverse impact of regional integration on green development efficiency. These findings are supported by relevant literature [,,].
7. Conclusions
The study reveals that regional integration (RI) in the Yangtze River Delta has a negative impact on green development efficiency (GDE), as reflected by a consistently negative coefficient across DID models. The robustness of the findings is further supported by both parallel trends and placebo tests. To reverse the negative impact of regional integration on green development efficiency identified in this study, policy efforts should aim to embed ecological priorities into the integration process. Capitalizing on the 2019 “Overall Plan for the Yangtze River Delta Eco-Green Integrated Development Demonstration Zone” and the 2023 “Yangtze River Delta Eco-Green Integrated Development Demonstration Zone Territorial Spatial Master Plan (2021–2035)”, policy efforts should aim to establish a cohesive, multi-level governance framework and collaborative mechanism to advance green development. Green development efficiency indicators should serve as core evaluation criteria to prevent a “race-to-the-bottom” effect. Priority should be given to regional collaboration in green industries, including clean technologies, environmental protection sectors, and pollution control initiatives. A comprehensive cross-regional ecological compensation system should be implemented to internalize environmental costs, while existing trading platforms for pollutant discharge and carbon emissions should be integrated into a regional green factor trading center to enhance market-based allocation efficiency and improve environmental governance levels. To align fiscal expenditure toward green priorities, the Yangtze River Delta Economic Coordination Council can coordinate regional green infrastructure development to optimize resources and minimize redundant investments. Government spending should increase fiscal support for environmental protection, clean technology R&D, and ecological restoration. Tax instruments should be leveraged to establish incentive-compatible mechanisms that amplify the impact of public fiscal resources. Promote the comprehensive implementation of green building, sponge city, and “15-min living circle” planning and construction across the region, while encouraging the development of “near-zero carbons emission demonstration zones”.
The study reveals that regional integration in the Yangtze River Delta region, by increasing trade openness and promoting the development of the digital economy, has led to a decrease in green development efficiency, thereby generating a certain degree of negative mediating effect. Additionally, regional integration partially amplifies the direct negative impact on green development efficiency by reducing secondary industry agglomeration. Moderation analysis further demonstrates that innovation capability amplifies the adverse effects of RI on GDE. These results highlight the importance of targeted policies to reconcile regional integration with green development objectives, emphasizing efficient resource allocation, green-oriented innovation, and strengthened environmental regulations to counteract the observed “high-input, low-output” dynamics during the integration process. To mitigate the negative externalities of trade-oriented economies and secondary industry agglomeration, optimize the integration of the digital economy with green development, and transform innovation capacity into green innovation efficiency, the following policy recommendations are proposed for reference. First, establish internationally aligned green product standards and green supply chain management systems, prioritizing support for low-carbon product exports to promote upgrading of trade structures toward greener development. Second, implement a negative list for industrial relocation alongside a “green access” system, and promote the development of “green digital factory” benchmarks. This is particularly critical in high-energy-consumption sectors such as steel, chemicals, and data centers, where digitalization and green transformation can mitigate the negative amplifying effects of secondary industries while achieving dual goals of industrial upgrading and emission reduction. Third, guide digital infrastructure in adopting clean energy sources and green energy efficiency standards, thereby reducing the carbon footprint of the digital economy. Fourth, establish dedicated green technology innovation funds and incubators to foster innovation oriented toward green development. Additionally, form green innovation alliances to facilitate cross-city technology sharing. Finally, formulate tailored urban green development and high-quality economic growth policies that align with regional integration and leverage the unique resource endowments and strengths of individual cities.
Although this study examines the direct effects and mechanisms of the Yangtze River Delta’s regional integration process on green development, the generalizability of these findings warrants further validation through extension to other regional integration cases. More refined indicator systems, possibly leveraging big data, could be employed to measure the level of regional integration and green development efficiency. More detailed research designs could be utilized to uncover specific or nonlinear transmission pathways and mechanisms. In addition, future research could focus on the spatial spillover effects of green development efficiency, as well as the synergistic and diffusion effects of regional integration policies in conjunction with other green development policies.
Author Contributions
Conceptualization, G.W. and X.N.; methodology, G.W., D.Y. and Z.Z.; software, G.W., D.Y. and Z.Z.; validation, G.W., X.N. and Z.Z.; formal analysis, G.W. and X.N.; investigation, G.W., D.Y., H.W. and Z.Z.; resources, G.W., H.W. and X.N.; data curation, G.W., D.Y. and Z.Z.; writing—original draft preparation, D.Y. and Z.Z.; writing—review and editing, G.W., H.W. and X.N.; visualization, G.W. and Z.Z.; supervision, G.W.; project administration, G.W., H.W. and X.N.; funding acquisition, G.W. and X.N. All authors have read and agreed to the published version of the manuscript.
Funding
This research was funded by Key Program of National Social Science Foundation of China (grant number 21AZD036), Humanities and Social Science Fund of Ministry of Education of China (grant number 22YJA630096, 20YJC630108).
Data Availability Statement
The raw data supporting the conclusions of this article will be made available by the authors on request.
Acknowledgments
The authors wish to express heartfelt gratitude to the anonymous reviewers and the editors of this article for their invaluable comments.
Conflicts of Interest
The authors declare no conflicts of interest.
References
- Tinbergen, J. International Economic Integration; Elsevier: Amsterdam, The Netherlands, 1954. [Google Scholar]
- Haas, E.B. The Uniting of Europe: Political, Social, and Economic Forces, 1950–1957; Stanford University Press: Stanford, CA, USA, 1959; ISBN 0-8047-0515-1. [Google Scholar]
- Balassa, B. The Theory of Economic Integration; Routledge: London, UK, 1961; ISBN 978-0-203-80518-3. [Google Scholar]
- Parsley, D.C.; Wei, S.-J. Convergence to the Law of One Price without Trade Barriers or Currency Fluctuations. Q. J. Econ. 1996, 111, 1211–1236. [Google Scholar] [CrossRef]
- Badinger, H. Growth Effects of Economic Integration: Evidence from the EU Member States. Rev. World Econ. 2005, 141, 50–78. [Google Scholar] [CrossRef]
- De Lombaerde, P.; Dorrucci, E.; Genna, G.; Mongelli, F.P. Composite Indexes and Systems of Indicators of Regional Integration. In The Regional Integration Manual: Quantitative and Qualitative Methods; Routledge: London, UK, 2011; pp. 323–346. ISBN 978-0-203-81371-3. [Google Scholar]
- Hong, T.; Yu, N.; Storm, S.; Gao, B. How Much Does Regional Integration Contribute to Growth? An Analysis of the Impact of Domestic Market Integration on Regional Economic Performance in China (1997–2011). Econ. Res.-Ekon. Istraž. 2019, 32, 3189–3210. [Google Scholar] [CrossRef]
- Bai, L.; Zhou, X.; Tian, Y.; Wei, L. Evaluation for the Development of Urban Agglomeration Integration: A Case Study of Pearl River Delta. Social Indic. Res. 2024, 171, 877–904. [Google Scholar] [CrossRef]
- Feng, Y.; Lee, C.-C.; Peng, D. Does Regional Integration Improve Economic Resilience? Evidence from Urban Agglomerations in China. Sustain. Cities Soc. 2023, 88, 104273. [Google Scholar] [CrossRef]
- Jiang, N.; Jiang, W. How Does Regional Integration Policy Affect Urban Resilience? Evidence from Urban Agglomeration in China. Environ. Impact Assess. Rev. 2024, 104, 107298. [Google Scholar] [CrossRef]
- Gao, D.; Li, G.; Li, Y. Government Cooperation, Market Integration, and Energy Efficiency in Urban Agglomerations—Based on the Quasi-Natural Experiment of the Yangtze River Delta Urban Economic Coordination Committee. Energy Environ. 2022, 33, 1679–1694. [Google Scholar] [CrossRef]
- Guo, L.; Tang, M.; Wu, Y.; Bao, S.; Wu, Q. Government-Led Regional Integration and Economic Growth: Evidence from a Quasi-Natural Experiment of Urban Agglomeration Development Planning Policies in China. Cities 2025, 156, 105482. [Google Scholar] [CrossRef]
- D’Amato, D.; Droste, N.; Allen, B.; Kettunen, M.; Lähtinen, K.; Korhonen, J.; Leskinen, P.; Matthies, B.D.; Toppinen, A. Green, Circular, Bio Economy: A Comparative Analysis of Sustainability Avenues. J. Clean. Prod. 2017, 168, 716–734. [Google Scholar] [CrossRef]
- Tone, K. A Slacks-Based Measure of Efficiency in Data Envelopment Analysis. Eur. J. Oper. Res. 2001, 130, 498–509. [Google Scholar] [CrossRef]
- Hou, S.; Song, L. Market Integration and Regional Green Total Factor Productivity: Evidence from China’s Province-Level Data. Sustainability 2021, 13, 472. [Google Scholar] [CrossRef]
- Wang, Z.; Zhang, X.; Zhang, C.; Yang, Q. How Regional Integration Affects Urban Green Development Efficiency: Evidence from Urban Agglomeration in the Middle Reaches of the Yangtze River. Int. J. Environ. Res. Public Health 2022, 19, 7937. [Google Scholar] [CrossRef]
- Feng, Y.; Sun, M.; Pan, Y.; Zhang, C. Fostering Inclusive Green Growth in China: Identifying the Impact of the Regional Integration Strategy of Yangtze River Economic Belt. J. Environ. Manag. 2024, 358, 120952. [Google Scholar] [CrossRef] [PubMed]
- Lu, Y.; Cao, B.; Hua, Y.; Ding, L. Efficiency Measurement of Green Regional Development and Its Influencing Factors: An Improved Data Envelopment Analysis Framework. Sustainability 2020, 12, 4361. [Google Scholar] [CrossRef]
- Si, L.; Wang, J.; Yang, S.; Yang, Y.; Zhang, J. Urban Green Development towards Sustainability in Northwest China: Efficiency Assessment, Spatial Temporal Differentiation Characters, and Influencing Factors. Complexity 2021, 2021, 6630904. [Google Scholar] [CrossRef]
- Gu, R.; Li, C.; Yang, Y.; Zhang, J. The Impact of Industrial Digital Transformation on Green Development Efficiency Considering the Threshold Effect of Regional Collaborative Innovation: Evidence from the Beijing-Tianjin-Hebei Urban Agglomeration in China. J. Clean. Prod. 2023, 420, 138345. [Google Scholar] [CrossRef]
- Liu, B.; Huang, Y.; Chen, M.; Lan, Z. Towards Sustainability: How Does the Digital-Real Integration Affect Regional Green Development Efficiency? Econ. Anal. Policy 2024, 83, 42–59. [Google Scholar] [CrossRef]
- Zhang, R.; Ying, W.; Wu, K.; Sun, H. The Impact of Innovative Human Capital Agglomeration on Urban Green Development Efficiency: Based on Panel Data of 278 Cities in China. Sustain. Cities Soc. 2024, 111, 105566. [Google Scholar] [CrossRef]
- Solow, R.M. A Contribution to the Theory of Economic Growth. Q. J. Econ. 1956, 70, 65–94. [Google Scholar] [CrossRef]
- Krugman, P. Increasing Returns and Economic Geography. J. Polit. Econ. 1991, 99, 483–499. [Google Scholar] [CrossRef]
- Porter, M. The Competitive Advonfoge of Notions. Compet. Intell. Rev. 1990, 1, 14. [Google Scholar] [CrossRef]
- Coase, R.H. The Problem of Social Cost. J. Law Econ. 1960, 3, 1. [Google Scholar] [CrossRef]
- Grossman, G.M.; Krueger, A.B. Economic Growth and the Environment. Q. J. Econ. 1995, 110, 353–377. [Google Scholar] [CrossRef]
- Khan, R.Z.; Razak, L.A.; Premaratne, G. Green Growth and Sustainability: A Systematic Literature Review on Theories, Measures and Future Directions. Clean. Responsible Consum. 2025, 17, 100274. [Google Scholar] [CrossRef]
- Zou, X.; Xiao, Y.; Ma, D.; Zhang, F.; An, B.; Guo, Z.; Zhang, J. How to Achieve Green Development? A Study on Spatiotemporal Differentiation and Influence Factors of Green Development Efficiency in China. PLoS ONE 2024, 19, e0291468. [Google Scholar] [CrossRef]
- Mehmood, S.; Zaman, K.; Khan, S.; Ali, Z. The Role of Green Industrial Transformation in Mitigating Carbon Emissions: Exploring the Channels of Technological Innovation and Environmental Regulation. Energy Built Environ. 2024, 5, 464–479. [Google Scholar] [CrossRef]
- Zhan, L.; Guo, P.; Pan, G. The Effect of Mandatory Environmental Regulation on Green Development Efficiency: Evidence from China. Environ. Sci. Pollut. Res. 2023, 30, 9782–9792. [Google Scholar] [CrossRef] [PubMed]
- Saraji, M.K.; Streimikiene, D. Challenges to the Low Carbon Energy Transition: A Systematic Literature Review and Research Agenda. Energy Strategy Rev. 2023, 49, 101163. [Google Scholar] [CrossRef]
- Lema, R.; Fu, X.; Rabellotti, R. Green Windows of Opportunity: Latecomer Development in the Age of Transformation toward Sustainability. Ind. Corp. Change 2020, 29, 1193–1209. [Google Scholar] [CrossRef]
- Copeland, B.R.; Taylor, M.S. Trade, Growth, and the Environment. J. Econ. Lit. 2004, 42, 7–71. [Google Scholar] [CrossRef]
- Peters, G.P.; Minx, J.C.; Weber, C.L.; Edenhofer, O. Growth in Emission Transfers via International Trade from 1990 to 2008. Proc. Natl. Acad. Sci. USA 2011, 108, 8903–8908. [Google Scholar] [CrossRef]
- Antweiler, W.; Copeland, B.R.; Taylor, M.S. Is Free Trade Good for the Environment? Am. Econ. Rev. 2001, 91, 877–908. [Google Scholar] [CrossRef]
- Marshall, A. Industry and Trade: A Study of Industrial Technique and Business Organization, and of Their Influences on the Conditions of Various Classes and Nations; Macmillan and Co.: London, UK, 1919. [Google Scholar]
- Henderson, J.V. The Sizes and Types of Cities. Am. Econ. Rev. 1974, 64, 640–656. [Google Scholar]
- Lange, S.; Pohl, J.; Santarius, T. Digitalization and Energy Consumption. Does ICT Reduce Energy Demand? Ecol. Econ. 2020, 176, 106760. [Google Scholar] [CrossRef]
- Jevons, W.S. The Coal Question; an Inquiry Concerning the Progress of the Nation, and the Probable Exhaustion of Our Coal-Mines; Macmilan: London, UK, 1865. [Google Scholar]
- Arthur, W.B. Increasing Returns and Path Dependence in the Economy; University of Michigan Press: Ann Arbor, MI, USA, 1994; ISBN 978-0-472-06496-0. [Google Scholar]
- Abadie, A. Semiparametric Difference-in-Differences Estimators. Rev. Econom. Stud. 2005, 72, 1–19. [Google Scholar] [CrossRef]
- Judd, C.M.; Kenny, D.A. Estimating the Effects of Social Intervention; the Press Syndicate of the University of Cambridge: New York, NY, USA, 1981; ISBN 978-0-521-22975-3. [Google Scholar]
- Baron, R.M.; Kenny, D.A. The Moderator–Mediator Variable Distinction in Social Psychological Research: Conceptual, Strategic, and Statistical Considerations. J. Pers. Soc. Psychol. 1986, 51, 1173–1182. [Google Scholar] [CrossRef]
- Muller, D.; Judd, C.M.; Yzerbyt, V.Y. When Moderation Is Mediated and Mediation Is Moderated. J. Pers. Soc. Psychol. 2005, 89, 852–863. [Google Scholar] [CrossRef] [PubMed]
- Fairchild, A.J.; MacKinnon, D.P. A General Model for Testing Mediation and Moderation Effects. Prev. Sci. 2009, 10, 87–99. [Google Scholar] [CrossRef] [PubMed]
- Guo, H.; Xie, Z.; Wu, R. Evaluating Green Innovation Efficiency and Its Socioeconomic Factors Using a Slack-Based Measure with Environmental Undesirable Outputs. Int. J. Environ. Res. Public Health 2021, 18, 12880. [Google Scholar] [CrossRef]
- Xiang, Y.; Shao, W.; Wang, S.; Zhang, Y.; Zhang, Y. Study on Regional Differences and Convergence of Green Development Efficiency of the Chemical Industry in the Yangtze River Economic Belt Based on Grey Water Footprint. Int. J. Environ. Res. Public Health 2022, 19, 1703. [Google Scholar] [CrossRef] [PubMed]
- Cramér, H. Mathematical Methods of Statistics; Princeton University Press: Princeton, NJ, USA, 1999; ISBN 978-0-691-00547-8. [Google Scholar]
- Simar, L.; Wilson, P.W. Sensitivity Analysis of Efficiency Scores: How to Bootstrap in Nonparametric Frontier Models. Manag. Sci. 1998, 44, 49–61. [Google Scholar] [CrossRef]
- Simar, L.; Wilson, P.W. Estimation and Inference in Two-Stage, Semi-Parametric Models of Production Processes. J. Econom. 2007, 136, 31–64. [Google Scholar] [CrossRef]
- Zhang, J.; Liu, J.; Li, J.; Gao, Y.; Zhao, C. Green Development Efficiency and Its Influencing Factors in China’s Iron and Steel Industry. Sustainability 2021, 13, 510. [Google Scholar] [CrossRef]
- Liu, R.; Chen, D.; Yang, S.; Chen, Y. Evaluation of Green Development Efficiency of the Major Cities in Gansu Province, China. Sustainability 2021, 13, 3034. [Google Scholar] [CrossRef]
- Wang, A.; Lin, W.; Liu, B.; Wang, H.; Xu, H. Does Smart City Construction Improve the Green Utilization Efficiency of Urban Land? Land 2021, 10, 657. [Google Scholar] [CrossRef]
- Xiang, Y.; Wang, S.; Zhang, Y.; Dai, Z. Green Development Efficiency Measurement and Influencing Factors of the Paper Industry in the Yangtze River Economic Belt. Water 2021, 13, 1286. [Google Scholar] [CrossRef]
- Liu, K.; Qiao, Y.; Zhou, Q. Analysis of China’s Industrial Green Development Efficiency and Driving Factors: Research Based on MGWR. Int. J. Environ. Res. Public Health 2021, 18, 3960. [Google Scholar] [CrossRef]
- Huang, J.; Shangguan, Z.; Gui, T.; Liu, J. How Urban Development Affects Green Development Efficiency in China: Taking the City Cluster of Yangtze River Economic Belt as an Example. Front. Environ. Sci. 2023, 11, 1169226. [Google Scholar] [CrossRef]
- Huang, L.; Zhang, Y.; Xu, X. Spatial-Temporal Pattern and Influencing Factors of Ecological Efficiency in Zhejiang—Based on Super-SBM Method. Environ. Model. Assess. 2023, 28, 227–243. [Google Scholar] [CrossRef]
- Guo, A.; Liu, P.; Zhong, F.; Yang, C.; Luo, X. Borrowing Size and Urban Green Development Efficiency in the City Network of China: Impact Measures and Size Thresholds. Land 2022, 11, 493. [Google Scholar] [CrossRef]
- Xia, M.; Tao, D. How Does Livelihood Public Service Affect Urban Green Development Efficiency? Evidence from 281 Cities in China. J. Resour. Ecol. 2024, 15, 304–316. [Google Scholar] [CrossRef]
- Wu, Z.; Gao, M.; Xie, P.; Li, H.; Jiang, M. Impact Assessment of Construction Waste Policy Intensity on Environmental Efficiency Based on System Generalized Method of Moments. Environ. Sci. Pollut. Res. 2024, 31, 23522–23534. [Google Scholar] [CrossRef] [PubMed]
- Zhang, H.; Dou, W. Impact of Air Pollution Prevention and Control on Urban Green Economy Efficiency: Evidence from China. Sci. Rep. 2024, 14, 27905. [Google Scholar] [CrossRef] [PubMed]
- Liu, R.; Sun, K.; Cao, H. The Impact and Mechanism of Vertical Fiscal Imbalance on Green Development Efficiency: An Empirical Analysis Based on City-Level Samples in China. Heliyon 2024, 10, e27097. [Google Scholar] [CrossRef]
- Wu, Y.; Zhou, X. Research on the Efficiency of China’s Fiscal Expenditure Structure under the Goal of Inclusive Green Growth. Sustainability 2021, 13, 9725. [Google Scholar] [CrossRef]
- Zhao, W.; Xu, Y. Public Expenditure and Green Total Factor Productivity: Evidence from Chinese Prefecture-Level Cities. Int. J. Environ. Res. Public Health 2022, 19, 5755. [Google Scholar] [CrossRef]
- Liu, P.; Huang, W.-C.; Chen, Z.; Wang, S.; Ren, T. The Relationship between Policy Adjustment of SO2 Emissions Charge Standard and the Growth of Green Total Factor Productivity—Evidence from China. Front. Environ. Sci. 2022, 10, 988957. [Google Scholar] [CrossRef]
- Shen, N.; Liao, H.; Deng, R.; Wang, Q. Different Types of Environmental Regulations and the Heterogeneous Influence on the Environmental Total Factor Productivity: Empirical Analysis of China’s Industry. J. Clean. Prod. 2019, 211, 171–184. [Google Scholar] [CrossRef]
- Dai, S.; Tang, D.; Li, Y.; Lu, H. Digital Trade, Trade Openness, FDI, and Green Total Factor Productivity. Int. Rev. Financ. Anal. 2025, 97, 103777. [Google Scholar] [CrossRef]
- Shu, Z.; Peng, S.; Huang, X. How Does Service Trade Openness Promote the Green Transformation of Manufacturing Firms? Evidence from China. Energy Econ. 2025, 144, 108347. [Google Scholar] [CrossRef]
- Xie, W.; Li, X. Can Industrial Agglomeration Facilitate Green Development? Evidence from China. Front. Environ. Sci. 2021, 9, 745465. [Google Scholar] [CrossRef]
- Yu, H.; Dai, S.; Ke, H. Industrial Collaborative Agglomeration and Green Economic Efficiency—Based on the Intermediary Effect of Technical Change. Growth Change 2024, 55, e12727. [Google Scholar] [CrossRef]
- Zhang, R.; Ma, Y.; Ren, J. Green Development Performance Evaluation Based on Dual Perspectives of Level and Efficiency: A Case Study of the Yangtze River Economic Belt, China. Int. J. Environ. Res. Public Health 2022, 19, 9306. [Google Scholar] [CrossRef]
- Gao, X.; Li, J. China’s Digital Economy: A Dual Mission of Carbon-Emission Reduction and Efficiency Enhancement. Sustainability 2024, 16, 2351. [Google Scholar] [CrossRef]
- Kong, L.; Li, J. Digital Economy Development and Green Economic Efficiency: Evidence from Province-Level Empirical Data in China. Sustainability 2023, 15, 3. [Google Scholar] [CrossRef]
- Lee, C.-C.; He, Z.-W.; Wen, H. The Impact of Digitalization on Green Economic Efficiency: Empirical Evidence from City-Level Panel Data in China. Energy Environ. 2024, 35, 23–46. [Google Scholar] [CrossRef]
- Li, G.; Li, X.; Huo, L. Digital Economy, Spatial Spillover and Industrial Green Innovation Efficiency: Empirical Evidence from China. Heliyon 2023, 9, e12875. [Google Scholar] [CrossRef]
- Melnyk, L.H.; Kubatko, O.V.; Piven, V.S.; Klymenko, K.; Rybina, L. Digital and Economic Transformations for Sustainable Development Promotion: A Case of OECD Countries. Environ. Econ. 2021, 12, 140–148. [Google Scholar] [CrossRef]
- Zhang, L.; Azam, S.F.; Tham, J. Impact of Digital Inclusive Finance on the High Quality Development of Rural Economy: Evidence from China. Res. World Agric. Econ. 2025, 6, 192–210. [Google Scholar] [CrossRef]
- Zhu, Y. A Sustainable Mechanism for Digitization to Promote Green Technological Innovation in Enterprises. Appl. Math. Nonlinear Sci. 2024, 9, 1–13. [Google Scholar] [CrossRef]
- Duan, S.; Shang, B.; Nie, Y.; Wang, J.; Li, M.; Yu, J. Spatial and Temporal Differentiation of Carbon Emission Efficiency and the Impact of Green Technology Innovation in Hubei Province. Sustainability 2025, 17, 3613. [Google Scholar] [CrossRef]
- Bertrand, M.; Duflo, E.; Mullainathan, S. How Much Should We Trust Differences-In-Differences Estimates? Q. J. Econ. 2004, 119, 249–275. [Google Scholar] [CrossRef]
- Imbens, G.W.; Wooldridge, J.M. Recent Developments in the Econometrics of Program Evaluation. J. Econ. Lit. 2009, 47, 5–86. [Google Scholar] [CrossRef]
- Angrist, J.D.; Pischke, J.-S. Mostly Harmless Econometrics: An Empiricist’s Companion; Princeton University Press: Princeton, NJ, USA, 2009; ISBN 978-0-691-12035-5. [Google Scholar]
- Cameron, A.C.; Miller, D.L. A Practitioner’s Guide to Cluster-Robust Inference. J. Hum. Resour. 2015, 50, 317–372. [Google Scholar] [CrossRef]
- Abadie, A.; Diamond, A.; Hainmueller, J. Synthetic Control Methods for Comparative Case Studies: Estimating the Effect of California’s Tobacco Control Program. J. Am. Stat. Assoc. 2010, 105, 493–505. [Google Scholar] [CrossRef]
- Bruhn, M.; McKenzie, D. In Pursuit of Balance: Randomization in Practice in Development Field Experiments. Am. Econ. J. Appl. Econ. 2009, 1, 200–232. [Google Scholar] [CrossRef]
- Fu, L.; Han, X.; Peng, J. The Impact of Innovation-Driven Policies on Urban Resilience. Humanit. Soc. Sci. Commun. 2025, 12, 1–16. [Google Scholar] [CrossRef]
- Mu, L.; Zhang, C.; Liu, H. The Impact of the River Chief System on Corporate ESG Performance: Evidence from China. Water 2025, 17, 265. [Google Scholar] [CrossRef]
- Sobel, M.E. Asymptotic Confidence Intervals for Indirect Effects in Structural Equation Models. Sociol. Methodol. 1982, 13, 290–312. [Google Scholar] [CrossRef]
- Bollen, K.A.; Stine, R. Direct and Indirect Effects: Classical and Bootstrap Estimates of Variability. Sociol. Methodol. 1990, 20, 115–140. [Google Scholar] [CrossRef]
- Qiu, P.; Tang, C.; Tu, X.; Crompvoets, J. How Does Regional Cooperation Affect Green Total Factor Productivity?—Evidence from the Guangdong-Hong Kong-Macao Greater Bay Area in China. Heliyon 2024, 10, e38598. [Google Scholar] [CrossRef]
- Cai, J.; Baohang, H.; Tan, L. Can the Yangtze River Delta Urban Agglomeration Policy Promote Green High-Quality Development? Evidence from the Digital Economy and Green Total Factor Productivity. J. Resour. Ecol. 2024, 15, 105–116. [Google Scholar] [CrossRef]
- Liang, K.; Li, Z.; Luo, L. Measurement, Dynamic Evolution and Influencing Factors of Green Development Efficiency in Western China: Based on Ecological-Economic-Social System. PLoS ONE 2023, 18, e0290472. [Google Scholar] [CrossRef]
- Stern, D.I. The Rise and Fall of the Environmental Kuznets Curve. World Dev. 2004, 32, 1419–1439. [Google Scholar] [CrossRef]
- Fajri, M.N.; Pratama, B.P.; Kharisudin, A. Fiscal Decentralization and Green Development Efficiency. Bestuurskd. J. Gov. Stud. 2023, 3, 103–115. [Google Scholar] [CrossRef]
- Liu, H.; Jafri, M.A.H.; Zhu, P.; Hafeez, M. Fiscal Policy-Green Growth Nexus: Does Financial Efficiency Matter in Top Carbon Emitter Economies? Environ. Dev. Sustainability 2024, 26, 20379–20396. [Google Scholar] [CrossRef]
- Stern, D.I.; Common, M.S.; Barbier, E.B. Economic Growth and Environmental Degradation: The Environmental Kuznets Curve and Sustainable Development. World Dev. 1996, 24, 1151–1160. [Google Scholar] [CrossRef]
- Chen, Y.; Kong, X.; Wang, F. Carbon Emission, Air Pollution, and Total Factor Productivity: Evidence from Prefecture-Level Cities in China. SAGE Open 2023, 13, 21582440231209100. [Google Scholar] [CrossRef]
- Oloyede, B.M.; Osabuohien, E.S.; Ejemeyovwi, J.O. Trade Openness and Economic Growth in Africa’s Regional Economic Communities: Empirical Evidence from ECOWAS and SADC. Heliyon 2021, 7, e06996. [Google Scholar] [CrossRef]
- Pomerlyan, E.; Belitski, M. Regional Integration and Economic Performance: Evidence from the Eurasian Economic Union. Eurasian Geogr. Econ. 2024, 65, 627–655. [Google Scholar] [CrossRef]
- Chhabra, M.; Giri, A.K.; Kumar, A. Do Trade Openness and Institutional Quality Contribute to Carbon Emission Reduction? Evidence from BRICS Countries. Environ. Sci. Pollut. Res. 2023, 30, 50986–51002. [Google Scholar] [CrossRef]
- Pham, D.T.T.; Nguyen, H.T. Effects of Trade Openness on Environmental Quality: Evidence from Developing Countries. J. Appl. Econ. 2024, 27, 2339610. [Google Scholar] [CrossRef]
- Dai, Y.; Liu, Y.; Ding, X.; Wu, C.; Chen, Y. Environmental Regulation Promotes Eco-Efficiency through Industrial Transfer: Evidence from the Yangtze River Economic Belt in China. Int. J. Environ. Res. Public Health 2022, 19, 10127. [Google Scholar] [CrossRef] [PubMed]
- An, M.; Wang, J.; An, H.; Zhang, J.; Huang, J. A Dynamic View of Environmental Regulation Influence Mechanism on Manufacturing Agglomeration-a Case Study of the Yangtze River Delta City Cluster. Environ. Sci. Pollut. Res. 2023, 30, 6643–6657. [Google Scholar] [CrossRef]
- Zheng, Q.; Su, Y.; Cao, C. The Nonlinear and Spatial Effects of Digital Economy on Regional Green Development Efficiency: Empirical Evidence from 30 Provinces in China. Int. J. Finance Econ. 2025. [Google Scholar] [CrossRef]
- Liu, Y.; Jiang, T. Research on the Coupling Coordination of Digital Economy and Urban Green Development in the Yangtze River Delta of China. Environ. Res. Commun. 2024, 6, 095027. [Google Scholar] [CrossRef]
- Gao, S.; Li, X.; Duan, H.; Liu, S.; Sun, X. How Digital Technology Affects Regional Energy Intensity from the Perspective of Energy Economy: A Case Study of the Yangtze River Economic Belt. Front. Environ. Sci. 2024, 12, 1468512. [Google Scholar] [CrossRef]
- Hu, S.; Zeng, G.; Cao, X.; Yuan, H.; Chen, B. Does Technological Innovation Promote Green Development? A Case Study of the Yangtze River Economic Belt in China. Int. J. Environ. Res. Public Health 2021, 18, 6111. [Google Scholar] [CrossRef]
- Cheng, M.; Wen, Z.; Yang, S. The Driving Effect of Technological Innovation on Green Development: Dynamic Efficiency Spatial Variation. Environ. Sci. Pollut. Res. 2022, 29, 84562–84580. [Google Scholar] [CrossRef]
- Xu, X.; Zhao, T. Towards Green Development: Exploring the Impact of Housing Price Bubbles on Regional Green Innovation Efficiency Based on Chinese Provincial Panel Data Analysis. Sustainability 2024, 16, 10275. [Google Scholar] [CrossRef]
- Chen, S.; Du, Y.; Liu, Y. Regional Integration and Urban Green and Low-Carbon Development: A Quasi-Natural Experiment Based on the Expansion of the Yangtze River Delta Urban Agglomeration. Sustainability 2025, 17, 3621. [Google Scholar] [CrossRef]
- Zhu, Y.; Zhang, M.; Chen, H.; Ma, J. The Green Finance Pilot Policy Suppresses Green Innovation Efficiency: Evidence from Chinese Cities. Sustainability 2025, 17, 6136. [Google Scholar] [CrossRef]
Disclaimer/Publisher’s Note: The statements, opinions and data contained in all publications are solely those of the individual author(s) and contributor(s) and not of MDPI and/or the editor(s). MDPI and/or the editor(s) disclaim responsibility for any injury to people or property resulting from any ideas, methods, instructions or products referred to in the content. |
© 2025 by the authors. Licensee MDPI, Basel, Switzerland. This article is an open access article distributed under the terms and conditions of the Creative Commons Attribution (CC BY) license (https://creativecommons.org/licenses/by/4.0/).