Abstract
Balancing the development of urban road infrastructure (URI) with the pace of urbanization is crucial to supporting high-quality urban growth. This study constructed a comprehensive evaluation framework of URI and urbanization using data from 101 Chinese cities between 2002 and 2021. The spatio-temporal characteristics of URI and urbanization were assessed using the entropy weighting method and the relative development index (RDI). Key variables were identified through the obstacle degree model and further refined via relative importance analysis. To investigate the nonlinear interactions among the most influential factors, a random forest model was employed in combination with SHapley Additive exPlanations (SHAP). The results revealed three key findings: (1) both URI and urbanization levels exhibited overall upward trends during the study period, although notable disparities were observed across cities; (2) URI development generally outpaced urbanization, indicating a lack of synergy between the two systems; and (3) key determinants of this mismatch included road density, total road area, the number of streetlights per unit road length, resident population size, and educational human capital. By integrating multidimensional URI and urbanization metrics in a comprehensive evaluation framework, this study provides new insights into the spatial synergy mechanisms and supports the formulation of tier-specific urban planning strategies.
1. Introduction
With the acceleration of global urbanization, spatial expansion, population concentration, and functional upgrading have emerged as key forces driving socio-economic development []. In China, the rapid urbanization has significantly reshaped the socio-economic patterns of cities and generated an unprecedented demand for urban infrastructure []. Among various infrastructure components, road infrastructure serves as the backbone of urban systems by facilitating spatial expansion, promoting population mobility, and improving access to essential services []. Consequently, understanding the interplay between URI and urbanization process has become a central concern in urban planning and sustainable development.
Numerous studies have explored the complex relationship between URI and urbanization from various perspectives. At the macro level, road density, road network length, and light density have all been shown to promote urbanization levels significantly []. Li et al. used Jilin-1 high-resolution nighttime light data to study Quito’s streetlights and found higher-income areas had more LEDs, denser road lighting, and brighter roads, showing a clear link between lighting infrastructure and urban development []. However, urbanization is not driven solely by URI, but is instead influenced by a combination of factors, including population density, land use, economic development, and social structure []. As a fundamental component of urban spatial form, road infrastructure shapes urban development patterns through multiple mechanisms [,]. From a population perspective, highway and arterial road systems have effectively facilitated the diffusion of population towards the urban periphery []. Economically, Xue et al. demonstrated through model analysis that increases in population density and economic vitality, in turn, drive the continued optimization of urban road network spatial structures []. In terms of land use, there is a significant spatial coupling relationship between road network structure and land development intensity, with different centrality indices of road networks showing differentiated spatial effects on land use intensity []. In the social service dimension, road network accessibility plays a decisive role in the spatial distribution of urban facilities. Song et al. found a significant positive correlation between road connectivity and the concentration of dining and shopping facilities within a 500 m radius []. It is important to clarify that this study focuses solely on the spatial and structural aspects of URI, excluding broader transportation modes such as public transit, rail, cycling, and walking. Accordingly, all transport-related indicators are confined to the road infrastructure domain.
From a methodological perspective, traditional research has primarily relied on linear assumptions, using regression modeling, principal component analysis [], spatial kernel density estimation, regression analysis [], and spatial design network analysis (sDNA) techniques [] to quantify the relationship between the evolution of URI and urbanization processes. While these linear methods perform well in identifying macro-level development trends, they fall short in capturing the nonlinear interactions and threshold effects that occur during the synchronous evolution of urban systems. In recent years, researchers have increasingly turned to machine learning to uncover the nonlinear dynamics linking road systems and urban development. For instance, Cleveland et al. analyzed road network and population data from multiple Canadian cities and identified a pronounced nonlinear relationship between population density and road length per capita, indicating that denser urban areas require disproportionately less road infrastructure []. Zhao et al. (2017) examined spatio-temporal changes in Chinese road networks and urban expansion, revealing an inverted U-shaped relationship between expansion speed and road density, which points to distinct stages in road network evolution []. Doan et al. applied nonlinear and threshold models across multiple urban contexts and found that sidewalk proportion has a significant threshold effect on urban vitality, with substantial gains only once a certain coverage level is reached [].
Despite these significant advancements in understanding the interaction mechanisms between URI and urbanization systems, several important limitations remain in the existing literature. First, in terms of research perspective, existing studies often focus on single structural variables (e.g., road density or width), lacking a comprehensive analytical framework that integrates multiple dimensions of road characteristics, such as scale, morphological features, and supporting infrastructure, making it difficult to fully characterize the complex attributes of road infrastructure []. Second, in terms of research scope, most studies are confined to single-city case analyses, with limited cross-regional or cross-city type comparative studies, thereby restricting the generalizability and applicability of research conclusions []. Finally, in terms of the time dimension, most existing studies adopt cross-sectional or static research perspectives, with insufficient attention given to the dynamic coupling relationship and evolutionary patterns of URI and urbanization over long-term time series, thus failing to reveal the temporal characteristics and development trends of their interactions [].
To fill these gaps, this study proposes a dual-system evaluation framework that integrates multidimensional URI and urbanization indicators, based on panel data from 101 major Chinese cities spanning 2002 to 2021. The entropy weight method was adopted to construct system development indices of URI and urbanization. The obstacle degree model was used to identify key factors influencing the synchronous development of the two systems, and a random forest regression model enhanced with SHAP was applied to uncover nonlinear effects and variable interactions. A typological comparative analysis by city tier further reveals spatial patterns and structural differences, offering insights for multi-scalar urban governance and evidence-based policymaking. Cities are classified solely by population size, without accounting for other functional types (e.g., planned, historical, or port cities), which remains a limitation for future research. The main contributions include: (1) proposing a quantitative framework to assess the dynamic synergy between URI and urbanization; (2) uncovering nonlinear threshold effects and complex interactions among key factors influencing the synergy of the two systems; and (3) providing policy recommendations tailored to different urban scales for enhancing URI–urbanization coordination.
The remainder of this paper is organized as follows: Section 2 describes the research design, data sources, and analytical methods. Section 3 presents the empirical results, including synergy classification, obstacle analysis, and nonlinear interpretation. Section 4 and Section 5 provide the discussion and conclusions, respectively.
2. Research Design and Methodology
2.1. Research Design
To systematically analyze the developmental relationship and interaction mechanisms between URI and urbanization, this study is structured into four core components: (1) Assessment of development levels. Based on the literature review, a dual-system evaluation framework for URI and urbanization process was developed. The entropy weight method was applied to assign weights to indicators. The system development index (SDI) and relative development index (RDI) were calculated to quantitatively assess the overall development level of each system and its relative relationship. (2) Identification of influencing factors. By integrating the obstacle degree model with a random forest–based relative importance analysis interpreted through SHAP, the study identified and ranked the key factors constraining the synchronous development of URI and urbanization. (3) Exploration of interaction mechanisms. Building on these results, SHAP interaction and dependence analyses were used to uncover how key variables jointly influence RDI and to reveal their underlying interaction mechanisms. (4) Policy recommendations. Based on empirical findings and accounting for heterogeneity across cities of different scales, targeted policy recommendations are proposed to promote the synchronous development of URI and urbanization.
2.2. Evaluation Systems
A well-structured and robust assessment framework is critical for accurately evaluating the development levels of both URI and urbanization systems. Considering the data availability and indicator validity, this study proposed two separate frameworks for measuring the URI and urbanization, respectively.
2.2.1. Dimensions and Indicators for URI
The evaluation framework for URI considers two dimensions: scale and structure. The quantitative dimension includes total road length (URI1) and total road area (URI2); the structural dimension comprises road density (URI3), average road width (URI4), proportion of pedestrian walkways (URI5), and the number of streetlights per unit road length (URI6). Common proxies such as population or road network density are often used to represent urban development. However, they do not uniformly capture development levels, particularly in affluent neighborhoods where lower densities may result from land use regulations, planning preferences, or lifestyle factors. As this study operated at the city scale, such intra-urban socio-spatial variations were not explicitly accounted for, which may introduce some measurement variation []. Although road area and road density are correlated, they capture different aspects. Road area measures the absolute scale of land occupied by roads, whereas road density reflects the concentration of road networks relative to urban land. Both were retained to provide a more comprehensive evaluation of the infrastructure system. For clarity and consistency in analysis, each indicator was assigned a specific code, as summarized in Table 1.

Table 1.
Evaluation indicators of the URI system.
2.2.2. Dimensions and Indicators for Urbanization
The urbanization system is conceptualized as a process encompassing demographic, spatial, economic, and social transformations [,]. Based on the concept of new urbanization in China, we categorized urbanization indicators into four primary dimensions [,].
The demographic dimension includes resident population (DU1), the natural population growth rate (DU2), number of employed persons (DU3), the proportion of employment in the secondary (DU4) and tertiary sectors (DU5), the average employee wage (DU6), and human capital stock (DU7). Human capital here is defined as the stock of educational attainment in a city’s population and represented by the number of college students per 10,000 residents—an established proxy in urban development literature [,]. Together, these indicators reflect population structure and labor distribution. The land use dimension comprises indicators such as built-up area (LU1), and the proportion of land allocated to residential (LU2), industrial (LU3), and logistics and warehousing uses (LU4), along with measures of ecological quality, including per capita green space (LU5) and green coverage ratio in built-up areas (LU6).
The economic dimension encompasses per capita GDP (EU1), urban economic density (EU2), the value-added ratios of the secondary and tertiary sectors (EU3 and EU4), the industrial upgrading index (EU5), and the number of large-scale industrial enterprises (EU6), which together reflect economic vitality and industrial optimization. Finally, the social dimension incorporates total public library holdings (SU1), number of hospitals (SU2), hospital beds (SU3), practicing medical doctors (SU4), as well as the number of participants in basic urban pension (SU5) and unemployment insurance (SU6), capturing the level of public service provision and social welfare accessibility. SU1 (library holdings) and SU2–SU4 (healthcare infrastructure), while not direct measures of population or economic scale, serve as proxies for urban social functionality, reflecting a city’s capacity to support well-being and inclusive development, and are integral to sustainable urbanization [,]. Across all dimensions, the selected indicators capture both the hard” aspects (spatial and economic) and the “soft” aspects (human capital and services), ensuring a comprehensive measurement framework. All indicators were defined as positively oriented (“+”) toward urbanization development, so no reverse indicators or directional normalization were required. Variables with potential skewness (e.g., per capita GDP, economic density, library holdings) were visually inspected, though no transformations (e.g., log or Box–Cox) were applied; future research may consider such adjustments to reduce outlier sensitivity. The dimensions and corresponding indicators are summarized in Table 2.
Table 2.
Evaluation indicators of the urbanization system.
2.3. Method
2.3.1. Entropy Weights
To address inconsistencies in dimensions, meanings, and scales among the selected indicators, the raw data are standardized using the min-max normalization method []. This approach enhances the comparability of evaluation outcomes by removing disparities in measurement units []. The standardization formula is as follows:
where Zij represents the standardized value of indicator j in city i; is the original (raw) value of indicator j in city i; and min(Xi) and max(Xi) denote the minimum and maximum values of indicator j, respectively.
The entropy weight method provides an objective approach for determining the importance of indicators, thereby minimizing potential bias from subjective assessments. Typically, a lower entropy value indicates greater data dispersion, suggesting a higher influence of that indicator on the comprehensive evaluation []. The entropy and corresponding weight for each indicator are computed using the following formulas.
Compute the proportion of indicator j in city i:
Calculate the information entropy of indicator j:
Calculate the weight of indicator j:
In the equations above, n denotes the number of cities, and m represents the number of indicators.
2.3.2. Development Indices
The SDI is used to measure the development level of the URI and urbanization systems, serving as a fundamental component of this study. The expression is shown in Equation (7) []:
In this equation, xj denotes the standardized value of each indicator; n is the total number of indicators within the system; wj represents the weight of each indicator; SDIi refers to the SDI for city i.
The RDI is used to classify the relative development patterns between URI and urbanization [,], It is calculated using the following formula:
In this study, SDI1 denotes the system development index of the URI, while SDI2 denotes the system development index of the urbanization subsystem. The RDI is categorized as follows: an RDI value ≤ 0.8 indicates that URI development is lagging; a value between 0.8 and 1.2 suggests synergistic development of both systems; and an RDI greater than 1.2 reflects a lag in urbanization.
2.3.3. Obstacle Degrees
The obstacle degree model is widely applied to diagnose development bottlenecks by analyzing indicator contributions, deviations, and obstacle degrees []. In this study, the obstacle degree model is employed to identify the critical factors that impede the synergistic development between the two systems [,].
In this context, the factor contribution (Fj) represents the contribution of each indicator to the URI–urbanization composite system and is typically denoted by its weight wj. The deviation degree Ij reflects the gap between the ideal and actual values of an indicator and is generally expressed as 1 − Yj; where Yj is the standardized value of the indicator. The obstacle degree Oj indicates the extent to which each indicator hinders the synergistic functioning of the composite system. Here, n denotes the total number of indicators.
2.3.4. Random Forest and SHAP
Random forest regression was employed to model the relationship between the RDI and the selected explanatory variables []. Random forest is a tree-based ensemble learning method capable of capturing nonlinear patterns and high-order interactions without requiring strong parametric assumptions. To enhance interpretability, SHAP was applied. SHAP assigns each feature a contribution value based on cooperative game theory, enabling both global and local interpretation of model predictions []. The analysis was conducted in three steps:
(1) Feature importance ranking: The dataset was randomly split into a training set (70%) and a testing set (30%) using a fixed random seed (random state = 42) to ensure reproducibility. The random forest model was implemented in Python (version 3.11.3), and model hyperparameters were optimized via a grid search over the following ranges: n estimators was set to one of {50, 100, 200}; max depth to {None, 10, 20}; min samples split to {2, 5}; and min samples leaf to {1, 2}. Hyperparameter tuning was conducted using five-fold cross-validation on the training set, with the negative mean squared error (MSE) as the scoring metric. The relative contribution of each feature to RDI prediction was quantified based on the mean decrease in impurity.
(2) SHAP-based interpretation: SHAP values were computed for all samples, revealing the marginal effect of each feature and identifying potential nonlinearities and interaction patterns. Global interpretation was achieved through summary plots, while dependence plots were used to capture feature interactions.
(3) Global and local explanations: Summary plots, dependence plots, and force plots were used to visualize overall feature importance as well as case-specific contributions. These visualizations clarified the mechanisms through which key factors influence RDI outcomes.
The final model’s predictive performance was evaluated on the testing set using MSE and the coefficient of determination (R2). This random forest–SHAP framework enables accurate prediction while retaining high interpretability, making it well-suited for analyzing complex urban systems with multiple interacting determinants.
2.4. Study Area and Data
2.4.1. Study Area
As engines of China’s economic growth, cities concentrate population, industry, and infrastructure, and serve as catalysts for regional integration and spillover. Based on population size, they are classified into three types: megacities (over 10 million residents), supercities (5–10 million), and large cities (1–5 million). For example, megacities such as Beijing and Shanghai feature large populations and highly concentrated industries, but also face complex challenges, including traffic congestion, environmental degradation, and housing shortages. Supercities like Wuhan and Nanjing serve as regional economic hubs, with comprehensive industrial systems and strong innovation capacity. Meanwhile, large cities such as Xiamen and Kunming, although smaller in terms of total population and GDP, are strategically important as provincial or regional nodes within broader development frameworks. Given these differences, this study selected 101 officially designated cities in China with permanent resident populations exceeding one million as the research sample. The spatial distribution of the sampled cities is shown in Figure 1.
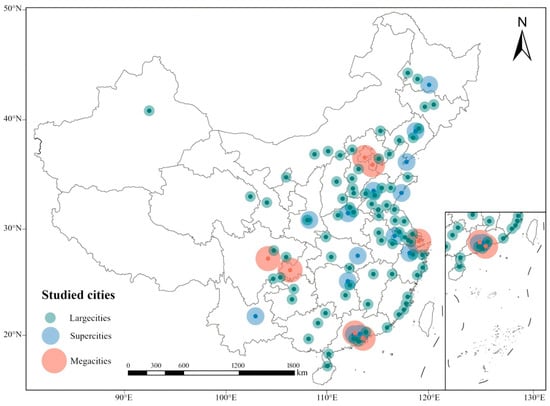
Figure 1.
Spatial distribution of 101 major cities in China (2002–2021). This map was created using a standard base map downloaded from the National Geographic Information Public Service Platform (China), with approval number GS (2024)0650. The base map was not modified.
2.4.2. Data Sources
The data analyzed spanned the period from 2002 to 2021. The primary sources include the China Urban Statistical Yearbook, China City Construction Statistical Yearbook, statistical yearbooks of the 101 selected cities and their corresponding provinces, and the Statistical Bulletins on National Economic and Social Development. The sources of the specific indicators are detailed in Table 1 and Table 2. Missing values were addressed using linear interpolation methods. In total, 132 missing values were identified across the dataset, accounting for only 0.15% of the 86,903 total entries. These missing values were distributed evenly across indicators and years, ensuring that the interpolation introduced no systematic bias. To provide additional context, we reported descriptive statistics for several key indicators in 2020, a representative year near the end of the study period. In that year, the mean resident population across the 101 cities was 7.42 million, ranging from 1.32 million to 32.09 million, with a gap of 30.81 million. The average road density was 8.26 km/km2 (min: 3.1, max: 17.15), and the mean human capital stock was 32.26 per 10,000 persons. Similar variations were also observed in per capita GDP and green coverage ratio. These descriptive values highlight the heterogeneity of city scales and socio-economic conditions across the sample.
3. Results
3.1. Spatio-Temporal Characteristics of SDI
3.1.1. URI Development Level
Figure 2a–c present the spatial distribution of URI development levels in 2002, 2012, and 2021, respectively. A distinct pattern of high-value clustering in the east with gradual diffusion toward the west is evident. This spatial polarization aligns with regional development patterns reported in prior studies, where eastern coastal agglomerations, such as the Beijing–Tianjin–Hebei region, the Yangtze River Delta, and the Guangdong–Hong Kong–Macao Greater Bay Area, exhibit stronger infrastructure and planning capacity compared to central and western cities []. Cities such as Beijing, Shanghai, Guangzhou, Shenzhen, and Chengdu exhibited significantly higher levels of URI development, reinforcing their positions as core nodes in China’s urban system.
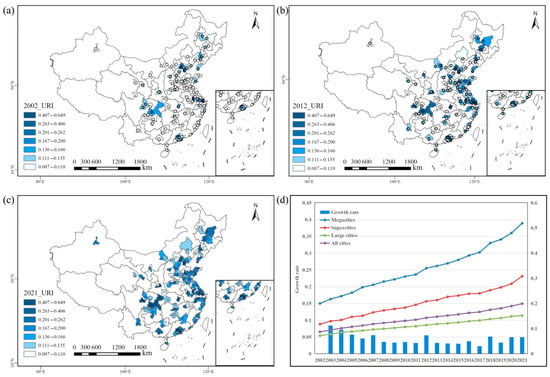
Figure 2.
Spatio-temporal evolution and growth trends of the URI development index in 101 major Chinese cities from 2002 to 2021. (a–c) Spatial distribution of the URI development index values in 2002, 2012, 2021. (d) Annual growth trends of the URI development index by city tier (megacities, supercities, large cities) and national average (2002–2021).
In contrast, Figure 2a–c also reveal that cities in Northeast China and the inland western regions (such as Changchun, Shijiazhuang, Changzhou, and Harbin) tended to exhibit lower development levels and slower growth rates. This mirrors findings from Zhou [], who noted a persistent urban infrastructure lag in resource-based and less economically vibrant regions. Moreover, the trajectories across different city tiers followed a clear “stepwise pattern” wherein higher-tier cities consistently achieved both faster growth and better-quality infrastructure. This confirms the positive association between urban administrative rank and URI performance, consistent with the conclusions of Xu and Zhu [], who emphasized the institutional embeddedness of infrastructure development in China’s urban hierarchy.
As shown in Figure 2d, the development level of URI showed a steady upward trend from 2002 to 2021. Nationally, the average index value increased from 0.087 to 0.200—more than doubling over the study period—with an average annual growth rate of 4.45%. Growth was particularly pronounced in megacities and supercities, where the average annual growth rates reached 5.03% and 5.07%, respectively, compared to 3.91% in large cities. These patterns reflect urban infrastructure polarization and align with findings from Liu et al., who identify growing infrastructure disparities between eastern and inland regions in China []. They also echo infrastructure inequality trends noted by national-scale studies of urban development [].
3.1.2. Urbanization Development Level
Figure 3a–c show the spatial distribution of the urbanization index in 2002, 2012, and 2021, respectively. The pattern reveals a clear spatial gradient, characterized by higher values in the east and lower values in the west, accompanied by substantial cluster-based expansion. High-index cities were predominantly concentrated in the eastern coastal areas and key urban clusters, such as the Beijing–Tianjin–Hebei region, the Yangtze River Delta, the Pearl River Delta, and the Chengdu–Chongqing metropolitan area. These regions exhibited rapid growth, strong spatial agglomeration, and high urbanization levels. These areas exhibited strong spatial agglomeration effects and rapid urban transformation, in line with previous observations of regional polarization in China’s urban system [].
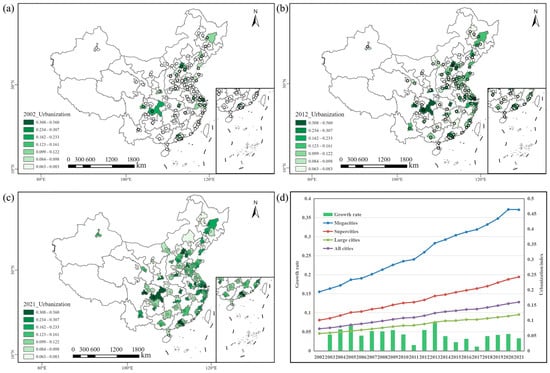
Figure 3.
Spatio-temporal evolution and growth trends of the urbanization development index in 101 major Chinese cities from 2002 to 2021. (a–c) Spatial distribution of the urbanization index in 2002, 2012, 2021. (d) Annual growth trends of urbanization levels by city tier and national average (2002–2021).
As seen in Figure 3a–c, the spatial evolution of urbanization progressed from point-based distribution toward corridor-like expansion, gradually forming regional growth belts. Meanwhile, hierarchical divergence became increasingly apparent. Throughout the study period, megacities consistently maintained the highest urbanization levels and the fastest growth rates, with their indices rising from approximately 0.25 to over 0.45. This reflects their stronger capacity for concentrating population, capital, and services. Supercities followed a similar trajectory but with slower growth, while large cities experienced more moderate increases, resulting in an expanding inter-tier gap. These trends reinforce the notion of tiered progression and spatial polarization in China’s urbanization process.
As shown in Figure 3d, the urbanization index demonstrated a steady upward trend throughout the study period, marked by stage-based characteristics. In 2002, urbanization levels were generally low, with only a few cities exceeding an index of 0.3. By 2021, however, most cities had made significant improvements, and some had surpassed the 0.45 threshold. This trend reflects a transition from a low baseline to a medium-to-high level of urbanization, particularly after 2012, when national strategies for new-type urbanization took effect [,].
3.2. Spatio-Temporal Characteristics of RDI
From 2002 to 2021, cities with RDI values falling within the range of 0.8 to 1.2 were considered to exhibit a “synergistic development” status, indicating that URI expansion and urbanization were progressing in a relatively synchronized manner. Conversely, cities whose RDI values did not converge toward this interval over time (2002–2021) were deemed to lack a trend of synchronous development.
As shown in Figure 4, a large proportion of cities lagged in urbanization relative to URI development throughout the study period. Although some showed gradual improvement toward synergy, many remained persistently unsynchronized. For instance, cities such as Tianjin, Dongguan, Dalian, Nanjing, Daqing, and Luzhou exhibited RDI values that remained significantly outside the synergistic development range in most years, suggesting misalignment between infrastructure expansion and urban functional capacity []. Statistically, cities with unsynergistic development accounted for 57.14% of megacities, 57.14% of supercities, and 73.75% of large cities. This consistency suggests a systemic imbalance even among top-tier cities, aligning with findings on hierarchical disparities in urban functionality []. Notably, several large cities—such as Jinan, Baotou, Daqing, Jilin, and Liuzhou—showed persistent “inverse imbalance,” with RDI values chronically too high or too low. Such divergence likely reflects structural discrepancies between rapid infrastructure buildup and population/service capacity, consistent with urban polarization scenarios identified in recent long-term urban development studies [].
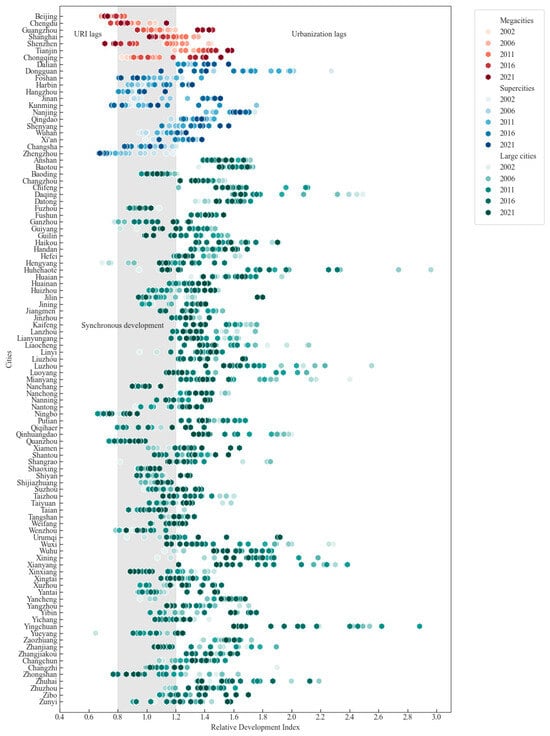
Figure 4.
Time-Series and synergistic development patterns of RDI between URI and urbanization systems.
In contrast, several cities demonstrated significant improvements in synergistic development by 2021. Cities such as Chengdu, Changsha, Foshan, Baoding, Nanchang, and Xinxiang recorded RDI values approaching 1.0, indicating substantial progress in synchronizing URI development with urbanization. These cases offer valuable lessons for other cities aiming to enhance integrated urban growth. A more detailed analysis by city tier reveals notable distinctions. Among megacities, Beijing had an RDI approaching 0.8, suggesting that urbanization was outpacing URI construction. Chengdu and Shanghai maintained stable RDI values within the 0.8–1.2 range, indicating synergistic development. In contrast, Guangzhou, Chongqing, and Tianjin exhibited RDI values between 1.4 and 1.6, indicating that URI expansion significantly outpaced urbanization progress. Among supercities, only Zhengzhou had RDI below 0.8, whereas Nanjing reached 1.6, underscoring a misalignment in development sequencing.
3.3. Diagnosis of Influencing Factors
3.3.1. Obstacle Degree Analysis
Figure 5 presents the average obstacle degree distributions of various indicators for megacities, supercities, and large cities, distinguishing between URI and urbanization indicators. Road length (URI1), road area (URI2), and road density (URI3) consistently exhibit high obstacle degrees across all city tiers, with particularly notable values in megacities and supercities. In contrast, urbanization-related indicators, especially in large cities, such as built-up area (LU2), residential land proportion (LU3), urban economic density (EU2), and pension coverage (SU5), show relatively high obstacle degrees. These patterns highlight clear differences across city tiers: in megacities and supercities, constraints are concentrated in URI variables, whereas in large cities, limitations arise primarily from the urbanization subsystem.
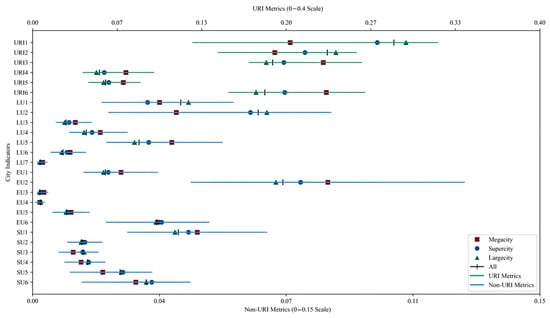
Figure 5.
Analysis of key indicator barriers across different levels of cities.
These findings suggest that although megacities and supercities benefit from advanced infrastructure investment, the marginal returns of further expansion diminish as spatial and functional complexity increases. This pattern is consistent with the “saturation threshold” theory in large-scale transport systems []. Conversely, the persistence of governance and service provision constraints in large cities reflects gaps in spatial planning efficiency, industrial concentration, and public welfare provision. Addressing these imbalances is essential for reducing developmental inequality, in line with theories on spatial mismatch and the unequal distribution of urban services [,].
3.3.2. Relative Importance Analysis
Before interpreting the SHAP results, we first evaluated the predictive performance of the random forest model. The optimal hyperparameters obtained through grid search were: n_estimators = 50, max_depth = 20, min_samples_split = 2, and min_samples_leaf = 1. The model achieved a cross-validation MSE of 0.0583. On the independent testing set, the predictive accuracy was further confirmed, with an MSE of 0.0199 and an R2 of 0.8166. These values indicated that the model explained over 80% of the variance in the relative development index (RDI), with a low prediction error. Such performance demonstrated that the random forest provided a reliable basis for subsequent SHAP-based interpretation of feature importance and nonlinear interactions.
As shown in Figure 6a,b, resident population size had the most substantial positive influence on RDI, suggesting that population agglomeration strengthened the alignment between URI supply and urbanization []. Meanwhile, variables such as road density, streetlight coverage, and total road length emerged as strong predictors, reflecting the importance of spatial layout and accessibility of URI in promoting balanced urban development. Figure 6b further ranks variables by their average SHAP values, providing a global view of each factor’s contribution to the model. These results highlight not only the role of population and road network indicators but also the foundational importance of educational resources and industrial capacity, such as total library holdings, human capital stock measured by college enrollment density, and the number of large-scale industrial enterprises, in supporting systemic synergistic development between URI and urbanization.
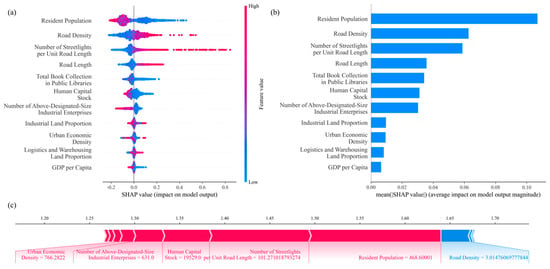
Figure 6.
SHAP-based interpretation of key variables influencing the RDI in Chinese cities. (a) SHAP summary plot. (b) Mean SHAP values. (c) Force plot for key feature impacts on RDl.
Figure 6c further illustrates the feature contributions across cities. Red areas reflect variables with a positive contribution (e.g., human capital, population, lighting density), while blue areas denote suppressive effects. Notably, high road density had a negative effect in some samples, implying diminishing marginal returns if infrastructure expansion was not matched with functional or behavioral integration. This pattern mirrors the “saturation threshold” effect previously documented by Duranton and Turner in high-density urban systems [].
3.4. Nonlinear Synergies Between URI and Urbanization in Shaping RDI
To investigate the underlying mechanisms of the top six important variables in driving the synergistic relationship between URI and urbanization, SHAP dependence and interaction plots were applied to uncover how pairs of key factors jointly influence the RDI, and to what extent these variables exhibit synergistic or offsetting effects across different urban contexts.
3.4.1. Interaction Between Population and URI
Figure 7 presents SHAP dependence plots for (a) road density, (b) total road length, and (c) streetlight density, with population size represented by the color gradient. Overall, a strong interaction is evident between the structural features of URI and population scale. When the road density exceeds approximately 10 km/km2, the SHAP contribution to RDI increases sharply, especially in high-population cities; see Figure 7a. This aligns with studies indicating that higher urban density enhances infrastructure utilization and synergistic outcomes []. As shown in Figure 7b, SHAP values rise rapidly up to around 4000 km, but plateau or decline beyond 10,000 km, suggesting diminishing returns at excessive scales. This is supported by empirical threshold analysis, which shows similar patterns in Chinese provinces []. Additionally, cities with streetlight density above 150 lights per km demonstrate rapid RDI gains, including lower-population cities. This implies that refined micro-infrastructure can compensate for limited scale and improve functional synergy.
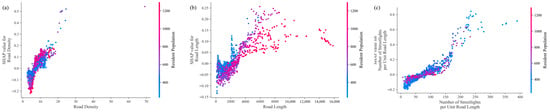
Figure 7.
Interaction effects between population size and key URI indicators on the RDI. (a) Road density SHAP impact (colored by population). (b) Road length SHAP impact (colored by population). (c) Streetlight density SHAP impact (colored by population).
Figure 8 presents SHAP dependence plots between human capital and three core URI indicators: road length, road density, and streetlight density. Overall, the results indicate that the relationship between URI and human capital is characterized by nonlinear synergy rather than simple additive effects. As displayed in Figure 8a, when human capital stock is low, its SHAP values are relatively high, implying a strong marginal effect on RDI in cities with limited educational resources. However, as human capital increases, its marginal contribution diminishes and may even become slightly negative. This “initially strong, then weakening” pattern aligns with threshold effects observed in urban development, where marginal returns to education taper beyond a certain saturation point []. The color gradient indicates that streetlight density plays only a modest moderating role, although regions with high streetlight density still exhibit slightly higher RDI scores under conditions of low human capital, suggesting a limited compensatory effect from micro-level infrastructure. A similar pattern is found with road density. In areas where road density is relatively balanced, the impact of human capital on RDI remains relatively stable, reinforcing the idea that balanced infrastructure can buffer disparities in educational resource distribution []. Furthermore, when both road length and human capital increase simultaneously, SHAP values rise steadily (Figure 8c), reflecting a compounded positive impact. Conversely, cities with abundant URI but low human capital show suppressed RDI values, emphasizing that physical expansion alone cannot compensate for a lack of social investment.
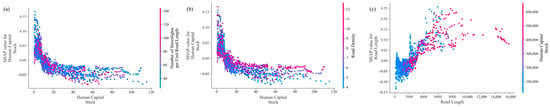
Figure 8.
Interaction effects between human capital and URI indicators on the RDI. (a) Human capital SHAP impact (colored by streetlight density). (b) Human capital SHAP impact (colored by road density). (c) Road length SHAP impact (colored by human capital).
3.4.2. Interaction Between Public Libraries and URI
Figure 9 presents SHAP dependence plots for road length and library collection metrics. Overall, the results reveal nonlinear associations between cultural service provision and URI. These are model-derived rather than causal and should be interpreted within the limits of SHAP-based inference. Figure 9a shows that cities with both abundant URI and extensive library holdings achieve higher SHAP values, indicating more potent development synergy, whereas limited cultural resources weaken the contribution of infrastructure. While the marginal effect of library resources rises steeply at low levels, it soon plateaus (Figure 9b), with streetlight density (red) partially compensating for resource scarcity. In Figure 9c, the positive impact of cultural resources becomes more pronounced in high road-density environments, likely due to improved spatial accessibility. However, these patterns remain descriptive and should not be interpreted as evidence of causality. Overall, while prior urban systems research supports the association between URI and public service provision [], the interaction patterns observed here should be regarded as model-based insights rather than empirically verified causal mechanisms.
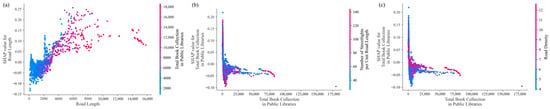
Figure 9.
Interaction effects between public cultural resources and URI indicators on the RDI. (a) Road length SHAP impact (colored by library stock). (b) Library collection SHAP impact (colored by streetlight density). (c) Library collection SHAP impact (colored by road density).
3.4.3. Internal Interactions Among URI Variables
Figure 10 shows SHAP dependence plots of the interaction effects among three key URI indicators: road density, total road length, and streetlight density. Overall, the results reveal that spatial extent, network density, and service quality jointly influence synergistic development, forming a “scale–density–facility” interaction mechanism. Figure 10a shows that as road density surpasses 15 km/km2, SHAP values rise sharply, particularly in cities with high streetlight density (red points), suggesting that micro-level infrastructure enhances the effectiveness of network compactness. This supports findings on the importance of integrated urban transport infrastructure []. Figure 10b demonstrates that cities with both longer roads and more intensive streetlighting coverage exhibit higher RDI contributions. This demonstrates that spatial scale and service quality reinforce each other, which aligns with empirical insights into infrastructure interdependencies for sustainable city systems []. In low-density cities, even a long road network yields lower SHAP values (Figure 10c). In contrast, high density alongside long roads sustains stronger synergy, implying that structural compactness is critical for sustaining synergistic development.
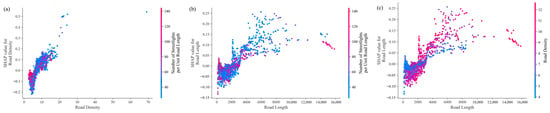
Figure 10.
Internal interaction mechanisms within the URI and their impact on the RDI. (a) Road density SHAP impact (colored by streetlight density). (b) Road length SHAP impact (colored by streetlight density). (c) Road length SHAP impact (colored by road density).
4. Discussion
This section presents the findings from both empirical analysis and model interpretation, drawing on relevant literature. By placing our results in the context of URI and urbanization research, we provide a more conceptually grounded interpretation of URI–urbanization synergy in 101 Chinese cities.
4.1. Development of URI and Urbanization
Between 2002 and 2021, most cities experienced steady progress in both URI and urbanization. This finding aligns with prior studies showing that infrastructure development in major urban clusters drives economic performance and spatial integration []. However, our results also revealed imbalances—especially in cities like Shenyang and Changchun—where the road system expanded more rapidly than the process of urbanization. A similar mismatch phenomenon between infrastructure and urban development has been documented in industrial transition and lagging regions, particularly in northeastern and western China []. The finding that human capital and social resources moderate urbanization performance supports theories that inclusive infrastructure policies and soft environment development are essential for sustainable urban growth [,].
4.2. Characteristics of Relative Development
The RDI analysis revealed that urbanization lagged behind the expansion of URI in most of the studied cities. This corroborates results by Ma et al. [], who identified policy-led overinvestment in infrastructure as a structural issue in many large cities. The more balanced development observed in cities such as Chengdu and Foshan supports the view that integrated planning and strong local governance can narrow the urbanization–infrastructure gap []. The spatial disparity, ‘high in the east, low in the west’, is also consistent with the broader spatial inequalities documented in China’s urban studies literature [].
4.3. Key Influencing Factors of RDI
Obstacle degree analysis identifies road length, area, and density as primary constraints in megacities and supercities, supporting the saturation threshold effect observed in Duranton and Turner, where further infrastructure expansion yields limited marginal benefit []. In large cities, deficits in land use efficiency and social resources restrict synergistic development, aligning with findings from recent Chinese urban coordination studies, which highlight social service infrastructure gaps as key limits to urban growth []. The SHAP-based analysis further demonstrated strong positive interactions between physical infrastructure variables (such as population size and road density) and social resources (including human capital stock and library infrastructure). This aligns with broader findings from urban co-evolution research, which indicate that balanced investment in both physical and social systems drive sustainable development across city scales [].
4.4. Limitations and Future Research
While the study provides a robust evaluation of the synergy between URI and urbanization, several limitations should be noted. First, the use of standardized indicators (such as road density, population concentration) and reliance on administrative boundaries may conceal important intra-urban heterogeneity, a recognized issue in urban morphology research []. For instance, affluent neighborhoods may combine low-density street patterns and low population densities with high service standards and functional urban development, challenging the assumption that higher densities universally reflect greater urbanization. This highlights the need for context-sensitive indicators that more accurately capture socio-spatial diversity, as well as a greater focus on local planning and zoning characteristics in future studies.
Second, the focus on supply-side infrastructure indicators limits our understanding of actual human mobility behavior. Future studies should integrate mobile positioning data, GPS traces, or activity-based surveys to capture behavioral dynamics. In particular, this study does not include transport demand indicators such as origin–destination flows, traffic volumes, or individual travel patterns, which are essential for a more comprehensive understanding of urban mobility systems. Although such demand-side data were unavailable across all 101 cities during the 2002–2021 period, emerging techniques, such as floating car data, mobile phone data, and travel demand estimation under limited information, offer promising avenues for future research []. Integrating these approaches can help bridge the gap between infrastructure provision and actual mobility needs. The increasing application of mobile technologies in transport studies has already demonstrated strong potential for revealing behavior patterns and urban functionality [].
Finally, although this paper focuses on road network infrastructure, expanding the analysis to incorporate non-motorized transport modes, such as walking and cycling, as well as multimodal connectivity, would further enrich the evaluation of urban mobility synergy.
5. Conclusions
This study examines the development trajectories and synergistic patterns of URI and urbanization across 101 major Chinese cities from 2002 to 2021. The findings reveal that URI development and urbanization follow similar upward trajectories, yet with URI often developing ahead of urbanization. Road density is identified as a critical driver in determining whether the two systems evolve synergistically. Supercities demonstrate notable advantages in terms of URI scale and population aggregation, contributing to stronger URI–urbanization synergy. However, even leading cities such as Beijing, Guangzhou, and Tianjin must remain alert to potential mismatches between physical expansion and urban functionality.
This study establishes an evaluation framework for the URI–urbanization relationship. To achieve this, it employs a multidimensional indicator system incorporating the RDI, obstacle degree analysis, and interpretable machine learning to quantitatively assess their interactions. The proposed framework enables systematic evaluation of URI–urbanization dynamics and helps identify diminishing returns and threshold effects. As a scalable and replicable tool, it offers strong potential for urban diagnostics and regional development planning.
The results highlight that critical constraints on synergy include road area, road length, road density, lighting infrastructure, human capital, employment scale, built-up area, and economic density. Among these, population size, lighting coverage, and road density are particularly influential in shaping synergistic outcomes. Additionally, the degree of synergy varies significantly by city size: while supercities typically maintain better alignment between infrastructure and urban growth, megacities and large cities still face challenges in synchronizing development trajectories. Therefore, differentiated policy approaches, adapted to local characteristics and development stages, are essential to achieving more balanced and integrated urban evolution. Although this study provides a city-level comparative framework, future research should incorporate spatial–functional heterogeneity and intra-city variations to enhance model specificity and policy relevance.
Author Contributions
Conceptualization, M.D., J.C. and Q.Y.; methodology, M.D. and Q.Y.; software, M.D. and F.C.; validation, M.D., J.C., and J.X.; formal analysis, M.D. and F.C.; investigation, M.D. and Y.W.; resources, M.D. and Q.Y.; data curation, M.D. and Y.W.; writing—original draft preparation, M.D.; writing—review and editing, M.D., J.X., and Q.Y.; visualization, F.C. and Y.W.; supervision, J.C. and Q.Y.; project administration, Q.Y.; funding acquisition, J.C. All authors have read and agreed to the published version of the manuscript.
Funding
This research was financed by the National Natural Science Foundation of China, grant number 52278048.
Data Availability Statement
The dataset presented in this study is available upon request from the corresponding author.
Conflicts of Interest
The authors declare no conflicts of interest.
References
- Li, G.; Sun, S.; Fang, C. The Varying Driving Forces of Urban Expansion in China: Insights from a Spatial-Temporal Analysis. Landsc. Urban Plan. 2018, 174, 63–77. [Google Scholar] [CrossRef]
- Cheng, J.; Zhou, J. Urban Growth in a Rapidly Urbanized Mega City: Wuhan. In Urban Development Challenges, Risks and Resilience in Asian Mega Cities; Springer: Tokyo, Japan, 2015; pp. 301–322. [Google Scholar]
- Zhang, R. Spatial Analysis of Transportation Networks for Urban Planning. Int. J. New Dev. Eng. Soc. 2023, 7, 1–5. [Google Scholar] [CrossRef]
- Brandily, P.; Rauch, F. Within-City Roads and Urban Growth. J. Reg. Sci. 2024, 64, 1236–1264. [Google Scholar] [CrossRef]
- Watson, C.S.; Elliott, J.R.; Córdova, M.; Menoscal, J.; Bonilla-Bedoya, S. Evaluating Night-Time Light Sources and Correlation with Socio-Economic Development Using High-Resolution Multi-Spectral Jilin-1 Satellite Imagery of Quito, Ecuador. Int. J. Remote Sens. 2023, 44, 2691–2716. [Google Scholar] [CrossRef]
- Hussain, M.; Imitiyaz, I. Urbanization Concepts, Dimensions and Factors. Int. J. Recent Sci. Res. 2018, 9, 23513–23523. [Google Scholar]
- Rui, Y.; Ban, Y. Urban Growth Modeling with Road Network Expansion and Land Use Development. In Advances in Cartography and GIScience; Springer: Berlin/Heidelberg, Germany, 2011; Volume 2, pp. 399–412. [Google Scholar]
- Cohen, M. A Systematic Review of Urban Sustainability Assessment Literature. Sustainability 2017, 9, 2048. [Google Scholar] [CrossRef]
- Duranton, G.; Turner, M.A. Urban Growth and Transportation. Rev. Econ. Stud. 2012, 79, 1407–1440. [Google Scholar] [CrossRef]
- Xue, J.; Jiang, N.; Liang, S.; Pang, Q.; Yabe, T.; Ukkusuri, S.V.; Ma, J. Quantifying the Spatial Homogeneity of Urban Road Networks via Graph Neural Networks. Nat. Mach. Intell. 2022, 4, 246–257. [Google Scholar] [CrossRef]
- Zhang, X.; Wang, C.; Wang, B.; Chen, Y. The Impact of Transportation Network Centrality on Land Use Intensity: A Case Study of the Central Urban Area of Qingdao. Hum. Geogr. 2022, 37, 161–170. [Google Scholar]
- Song, X.; Du, L.; Wang, Z. Correlation Analysis of Urban Road Network Structure and Spatial Distribution of Tourism Service Facilities at Multi-Scales Based on Tourists’ Travel Preferences. Buildings 2024, 14, 914. [Google Scholar] [CrossRef]
- Shi, G.; Shan, J.; Ding, L.; Ye, P.; Li, Y.; Jiang, N. Urban Road Network Expansion and Its Driving Variables: A Case Study of Nanjing City. Int. J. Environ. Res. Public Health 2019, 16, 2318. [Google Scholar] [CrossRef]
- Zheng, Z.; Wu, F.; Chen, J.; Liu, J.; Zhang, B. Analysis of Urban Road Network Evolution and Its Coupling with Urban Expansion in the Main Urban Area of Chongqing. Geomat. Spat. Inf. Technol. 2020, 43, 135–138. [Google Scholar]
- Li, C.; Lou, N.; Yang, Y.; Wang, T.; Xing, X. Spatio-Temporal Evolution of the Road Network and Its Relationship with Urban Spatial Changes in Xi’an City. Sci. Surv. Mapp. 2021, 46, 173–180. [Google Scholar]
- Cleveland, T.; Dec, P.; Rainham, D. Shorter Roads Go a Long Way: The Relationship Between Density and Road Length per Resident Within and Between Cities. Can. Plan. Policy 2020, 2020, 71–89. [Google Scholar]
- Zhao, G.; Zheng, X.; Yuan, Z.; Zhang, L. Spatial and Temporal Characteristics of Road Networks and Urban Expansion. Land 2017, 6, 30. [Google Scholar] [CrossRef]
- Doan, Q.C.; Ma, J.; Chen, S.; Zhang, X. Nonlinear and Threshold Effects of the Built Environment, Road Vehicles and Air Pollution on Urban Vitality. Landsc. Urban Plan. 2025, 253, 105204. [Google Scholar] [CrossRef]
- Turok, I. Getting Urbanization to Work in Africa: The Role of the Urban Land-Infrastructure-Finance Nexus. Area Dev. Policy 2016, 1, 30–47. [Google Scholar] [CrossRef]
- Zhao, X.; Xu, J.; Yang, J.; Duan, J. A Global Urban Road Network Self-Adaptive Simplification Workflow from Traffic to Spatial Representation. Sci. Data 2025, 12, 883. [Google Scholar] [CrossRef]
- Hu, Y.; Liang, C. Study on the spatial relationship between road network and the diversity of urban public facilities: The case of the central area of Changsha City. J. Eng. Appl. Sci. 2024, 71, 156. [Google Scholar] [CrossRef]
- Stefanidis, R.-M.; Bartzokas-Tsiompras, A. Pedestrian accessibility analysis of sidewalk-specific networks: Insights from three Latin American central squares. Sustainability 2024, 16, 9294. [Google Scholar] [CrossRef]
- Brenner, N.; Schmid, C. The ‘Urban Age’ in Question. Int. J. Urban Reg. Res. 2014, 38, 731–755. [Google Scholar] [CrossRef]
- UN-Habitat. World Cities Report, The Value of Sustainable Urbanization; United Nations Human Settlements Programme: Nairobi, Kenya, 2020. [Google Scholar]
- Xu, C.; Wang, S.; Zhou, Y.; Wang, L.; Liu, W. A Comprehensive Quantitative Evaluation of New Sustainable Urbanization Level in 20 Chinese Urban Agglomerations. Sustainability 2016, 8, 91. [Google Scholar] [CrossRef]
- Luo, J.; Ma, W.; An, S.; Zhang, Z.; Fu, Y.; Huang, H.; Chang, G. Coupling Analysis of Multi-Systems Urbanization: Evidence from China. Ecol. Indic. 2025, 170, 112977. [Google Scholar] [CrossRef]
- Florida, R.; Mellander, C.; Stolarick, K. Human Capital in Cities and Suburbs. Ann. Reg. Sci. 2016, 57, 91–123. [Google Scholar] [CrossRef]
- Zhao, J.; Chen, N.; Jin, Z. The More Centralized the Spatial Structure Is, the Greater the Economic Growth? Evidence from Urban Agglomerations in Western China. Humanit. Soc. Sci. Commun. 2025, 12, 483. [Google Scholar] [CrossRef]
- World Bank. Banking on Cities: Investing in Resilient and Low-Carbon Urbanization; World Bank Publications: Washington, DC, USA, 2023; Available online: https://www.worldbank.org/en/topic/urbandevelopment/publication/banking-on-cities (accessed on 1 August 2025).
- National Bureau of Statistics of China. China Statistical Yearbook; China Statistics Press: Beijing, China, 2022. [Google Scholar]
- United Nations. World Urbanization Prospects: The 2018 Revision; UN: New York, NY, USA, 2018. [Google Scholar]
- Zhou, C.; Zheng, H.; Wan, S. Industrial Structure, Employment Structure and Economic Growth—Evidence from China. Sustainability 2023, 15, 2890. [Google Scholar] [CrossRef]
- Fang, C.; Yu, D. Urban Agglomeration: An Evolving Concept of an Emerging Phenomenon. Landsc. Urban Plan. 2017, 162, 126–136. [Google Scholar] [CrossRef]
- Zhou, H.; Sun, B.; Zhang, T. The Evolution of Urban Employment Spatial Structure in China: From the Perspective of Monocentricity and Polycentricity. Cities 2024, 147, 104824. [Google Scholar] [CrossRef]
- Yan, X.; Mohd, S. Trends and Causes of Regional Income Inequality in China. Sustainability 2023, 15, 7673. [Google Scholar] [CrossRef]
- Florida, R.; Mellander, C. Talent, Skills and Urban Economies. Cities 2015, 51, 36–44. [Google Scholar]
- Seto, K.C.; Fragkias, M.; Güneralp, B.; Reilly, M.K. A Meta-Analysis of Global Urban Land Expansion. PLoS ONE 2011, 6, e23777. [Google Scholar] [CrossRef]
- Ding, C.; Zhao, X. Land Market, Land Development and Urban Spatial Structure in Beijing. Land Use Policy 2014, 40, 83–90. [Google Scholar] [CrossRef]
- Lin, G.C.S.; Ho, S.P.S. The State, Land System, and Land Development Processes in Contemporary China. Ann. Assoc. Am. Geogr. 2005, 95, 411–436. [Google Scholar] [CrossRef]
- Yuan, Q.; Zhu, J. Logistics Sprawl in Chinese Metropolises: Evidence from Wuhan. J. Transp. Geogr. 2019, 74, 242–252. [Google Scholar] [CrossRef]
- Tan, P.Y.; Wang, J.; Sia, A. Perspectives on Five Decades of the Urban Greening of Singapore. Cities 2013, 32, 24–32. [Google Scholar] [CrossRef]
- Langemeyer, J. Urban Ecosystem Services: The Value of Green Spaces in Cities; Stockholm University: Stockholm, Sweden, 2015. [Google Scholar]
- World Bank. World Development Indicators; World Bank: Washington, DC, USA, 2020. [Google Scholar]
- Chen, M.; Liu, W.; Lu, D. Challenges and the Way Forward in China’s New-Type Urbanization. Habitat Int. 2016, 55, 186–195. [Google Scholar] [CrossRef]
- Chen, A.; Gao, J. Urbanization in China and the Coordinated Development Model—The Case of Chengdu. Soc. Sci. J. 2011, 48, 500–513. [Google Scholar] [CrossRef]
- Wang, C.; Meng, Q. Research on the Sustainable Synergetic Development of Chinese Urban Economies in the Context of a Study of Industrial Agglomeration. Sustainability 2020, 12, 1122. [Google Scholar] [CrossRef]
- Zhang, B.; Zhou, E. The Evaluation of Spatial Distribution Equity of Public Service Facilities in Coastal Cities. J. Coast. Res. 2020, 103, 1060–1064. [Google Scholar] [CrossRef]
- Hong, L.; Kongshøj, K. China’s Welfare Reform: An Ambiguous Road Towards a Social Protection Floor. Glob. Soc. Policy 2014, 14, 352–368. [Google Scholar] [CrossRef]
- Cheng, Z.; Nielsen, I.; Smyth, R. Access to Social Insurance in Urban China: A Comparative Study of Rural–Urban and Urban–Urban Migrants in Beijing. Habitat Int. 2014, 41, 243–252. [Google Scholar] [CrossRef]
- Yang, Q.; Zhang, Z.; Cai, J.; Ding, M.; Li, L.; Zhang, S.; Song, Z.; Chen, F.; Ling, Y. Quality of Pedestrian Networks around Metro Stations: An Assessment Based on Approach Routes. Systems 2025, 13, 63. [Google Scholar] [CrossRef]
- Zhang, R.; Zhu, S.; Zhang, Z.; Zhang, H.; Tian, C.; Wang, S.; Wang, P.; Zhang, H. Long-Term Variations of Air Pollutants and Public Exposure in China During 2000–2020. Sci. Total Environ. 2024, 930, 172606. [Google Scholar] [CrossRef]
- Zhu, C.; Fang, C.; Zhang, L. Analysis of the Coupling Coordinated Development of the Population–Water–Ecology–Economy System in Urban Agglomerations and Obstacle Factors Discrimination: A Case Study of the Tianshan North Slope Urban Agglomeration, China. Sustain. Cities Soc. 2023, 90, 104359. [Google Scholar] [CrossRef]
- Liu, H.; Zhang, Y.; Zheng, W. Evaluation on Spatio-Temporal Development and Interaction of Intensive Urban Land Use and Urbanization: Case Studies of the Cities in the Bohai Rim Region. Geogr. Res. 2011, 30, 1805–1817. [Google Scholar]
- Sui, Y.; Hu, J.; Zhang, N.; Ma, F. Exploring the Dynamic Equilibrium Relationship Between Urbanization and Ecological Environment—A Case Study of Shandong Province, China. Ecol. Indic. 2024, 158, 11145. [Google Scholar] [CrossRef]
- He, X.; Cai, C.; Tang, J.; Shi, J.; Yang, R. Analysis of Coupling Coordination and Obstacle Factors Between Tourism Development and Ecosystem Services Value: A Case Study of the Yellow River Basin, China. Ecol. Indic. 2023, 157, 111234. [Google Scholar] [CrossRef]
- Qu, B.; Jiang, E.; Li, J.; Liu, Y.; Liu, C. Coupling Coordination Relationship of Water Resources, Eco-Environment and Socio-Economy in the Water-Receiving Area of the Lower Yellow River. Ecol. Indic. 2024, 160, 111766. [Google Scholar] [CrossRef]
- Breiman, L. Random Forests. Mach. Learn. 2001, 45, 5–32. [Google Scholar] [CrossRef]
- Lundberg, S.M.; Lee, S.I. A Unified Approach to Interpreting Model Predictions. Adv. Neural Inf. Process. Syst. 2017, 30, 4765–4774. [Google Scholar]
- Huang, H.; Wei, Y.D. The Spatial-Temporal Hierarchy of Inequality in Urban China: A Prefectural City-Level Study. Prof. Geogr. 2019, 71, 391–407. [Google Scholar] [CrossRef]
- Zhou, J.; Raza, A.; Sui, H. Infrastructure Investment and Economic Growth Quality: Empirical Analysis of China’s Regional Development. Appl. Econ. 2021, 53, 2615–2630. [Google Scholar] [CrossRef]
- Xu, Y.; Zhu, S. Transport Infrastructure, Intra-Regional Inequality and Urban-Rural Divide: Evidence from China’s High-Speed Rail Construction. Int. Reg. Sci. Rev. 2024, 47, 378–406. [Google Scholar] [CrossRef]
- Liu, H.; Wang, L.; Wang, J.; Ming, H.; Wu, X.; Xu, G.; Zhang, S. Multidimensional Spatial Inequality in China and Its Relationship with Economic Growth. Humanit. Soc. Sci. Commun. 2024, 11, 1415. [Google Scholar] [CrossRef]
- Pandey, B.; Brelsford, C.; Seto, K.C. Rising Infrastructure Inequalities Accompany Urbanization and Economic Development. Nat. Commun. 2025, 16, 1193. [Google Scholar] [CrossRef]
- Wei, Y.D.; Li, H.; Yue, W. Urban Land Expansion and Regional Inequality in Transitional China. Landsc. Urban Plan. 2017, 163, 17–31. [Google Scholar] [CrossRef]
- Wang, X.; Zhang, X. A Regional Comparative Study on the Mismatch Between Population Urbanization and Land Urbanization in China. PLoS ONE 2023, 18, e0287366. [Google Scholar] [CrossRef]
- Dong, G.; Li, R.; Li, F.; Liu, Z.; Wu, H.; Xiang, L.; Yu, W.; Jiang, J.; Zhang, H.; Li, F. Differences in Urban Development in China from the Perspective of Point of Interest Spatial Co-Occurrence Patterns. ISPRS Int. J. Geo-Inf. 2024, 13, 24. [Google Scholar] [CrossRef]
- Hu, Y.; Connor, D.S.; Stuhlmacher, M.; Peng, J.; Ii, B.L.T. More Urbanization, More Polarization: Evidence from Two Decades of Urban Expansion in China. npj Urban Sustain. 2024, 4, 33. [Google Scholar] [CrossRef]
- Xu, R.; Yue, W.; Wei, F.; Yang, G.; Chen, Y.; Pan, K. Inequality of Public Facilities Between Urban and Rural Areas and Its Driving Factors in Ten Cities of China. Sci. Rep. 2022, 12, 13244. [Google Scholar] [CrossRef]
- Li, C.; Gibson, J.; Boe-Gibson, G. Regional Inequality in Urban China, Allowing for Spatial Cost of Living Differences: Evidence from a Hedonic Analysis of Apartment Prices. Asia Pac. Policy Stud. 2019, 6, 170–185. [Google Scholar] [CrossRef]
- Tang, Y.; Lu, X.; Wang, M.; Jiang, B.; Chen, D.; Ge, K. Assessing the Threshold Effects of Road Infrastructure Construction on Farmland Use Transition: An Empirical Study in China. Environ. Sci. Pollut. Res. 2022, 29, 47323–47336. [Google Scholar] [CrossRef]
- Fan, S.; Chan-Kang, C. Road Development, Economic Growth, and Poverty Reduction in China; International Food Policy Research Institute: Washington, DC, USA, 2005. [Google Scholar]
- Chu, X.; Zhang, Q.; Li, W. An Examination of the Impact of China’s Compulsory Education Levels on Urban Economic Resilience: Based on the Mediation and Threshold Effects of Industrial Structure Rationalization and Upgrading. Educ. Urban Soc. 2025, 57, 639–673. [Google Scholar] [CrossRef]
- Gao, C.; Xie, X. The Interplay Between Urban Expansion, Human Capital Accumulation and Innovation Performance in Chinese Cities. Spat. Econ. Anal. 2025, 20, 197–217. [Google Scholar] [CrossRef]
- Jayasinghe, P.A.; Derrible, S.; Kattan, L. Interdependencies Between Urban Transport, Water, and Solid Waste Infrastructure Systems. Infrastructures 2023, 8, 76. [Google Scholar] [CrossRef]
- Gürsan, C.; De Gooyert, V.; De Bruijne, M.; Rouwette, E. Socio-Technical Infrastructure Interdependencies and Their Implications for Urban Sustainability: Recent Insights from the Netherlands. Cities 2023, 140, 104397. [Google Scholar] [CrossRef]
- Yu, Z.; Lin, J.; Zhao, Y.; Liu, W. Spatiotemporal Dynamics and Driving Mechanisms of Coupled Coordination between Rural–Urban Integration and Rural Resilience in Southwest China. Sci. Rep. 2025, 15, 23944. [Google Scholar] [CrossRef]
- Favier, A.; Westernhagen, C.H.V.; Krieg, M.; Kumawat, B. Integrating Social Capital with Urban Infrastructure Networks for More Resilient Cities. arXiv 2025, arXiv:2502.06328. [Google Scholar] [CrossRef]
- Ma, Y.; Yu, Z.; Liu, W.; Ren, Q. Exploring the Coupling Coordination Relationship and Obstacle Factors of Rural Revitalization, New-Type Urbanization, and Digital Economy in China. PLoS ONE 2025, 20, e0313125. [Google Scholar] [CrossRef]
- Chen, M.; Zhang, Q.; Jiang, Y.; Wang, J.; Zhu, S. Evaluating the Coupling Coordination Levels and Critical Obstacle Indicators of Urban Infrastructure Resilience: A Case Study in China. Buildings 2025, 15, 495. [Google Scholar] [CrossRef]
- Duranton, G.; Puga, D. The Growth of Cities. In Handbook of Economic Growth; Elsevier: Amsterdam, The Netherlands, 2014; Volume 2, pp. 781–853. [Google Scholar]
- Li, Y.; Ma, X.; Liu, Y.; Zhong, F. Can China’s New Infrastructure Promote Urban–Rural Integrated Development? Evidence from 31 Chinese Provinces. Buildings 2024, 14, 3978. [Google Scholar] [CrossRef]
- Wang, R.; Wang, X.; Zhang, Z.; Zhang, S.; Li, K. Research on the Nonlinear and Interactive Effects of Multidimensional Influencing Factors on Urban Innovation Cooperation: A Method Based on an Explainable Machine Learning Model. Systems 2025, 13, 187. [Google Scholar] [CrossRef]
- Schirmer, P.M.; Axhausen, K.W. A Multiscale Classification of Urban Morphology. J. Transp. Land Use 2016, 9, 101–130. [Google Scholar] [CrossRef]
- Croce, A.I.; Musolino, G.; Rindone, C.; Vitetta, A. Estimation of Travel Demand Models with Limited Information: Floating Car Data for Parameters’ Calibration. Sustainability 2021, 13, 8838. [Google Scholar] [CrossRef]
- Sun, Y.; Liu, C.; Zhang, C. Mobile Technology and Studies on Transport Behavior: A Literature Analysis, Integrated Research Model, and Future Research Agenda. Mob. Inf. Syst. 2021, 2021, 9309904. [Google Scholar] [CrossRef]
Disclaimer/Publisher’s Note: The statements, opinions and data contained in all publications are solely those of the individual author(s) and contributor(s) and not of MDPI and/or the editor(s). MDPI and/or the editor(s) disclaim responsibility for any injury to people or property resulting from any ideas, methods, instructions or products referred to in the content. |
© 2025 by the authors. Licensee MDPI, Basel, Switzerland. This article is an open access article distributed under the terms and conditions of the Creative Commons Attribution (CC BY) license (https://creativecommons.org/licenses/by/4.0/).