Article

An Exact Algorithm for Continuous Ship Unloading Based on Vehicle Routing

Department of Industrial Engineering, Faculty of Engineering, Çukurova University, 01330 Adana, Turkey
*
Author to whom correspondence should be addressed.
Systems 2025, 13(10), 883; https://doi.org/10.3390/systems13100883
Submission received: 16 August 2025 / Revised: 23 September 2025 / Accepted: 27 September 2025 / Published: 9 October 2025

Abstract

Port operations involving ship unloading have traditionally posed significant complexity and have proven difficult to solve optimally using exact methods. This study investigates the long continuous unloading of ships carrying liquid products, where transportation is carried out using full truckload deliveries. For the first time, this work integrates the problem of liquid-based ship unloading with full truckload vehicle routing and truck driver scheduling. The primary objective is to minimize the total transportation costs during the continuous unloading process, while satisfying extra constraints such as driver rest–break–drive regulations, time windows, a heterogeneous fleet structure, and port-specific constraints such as maintaining a minimum number of backup vehicles at the port during unloading. To address this complex problem, a route-based insertion heuristic is employed as an initial step in a column generation framework designed for exact optimization. The approach incorporates a nested label setting algorithm for column generation, enhanced with acceleration techniques involving multi-search strategies, and refined selection methods. Performance analysis, based on artificial datasets closely resembling real-world scenarios and consisting of 112 instances, demonstrates that optimality gaps below 1% can be achieved within computational times considered reasonable in the context of the existing literature, while the total number of customer nodes and the minimum number of required vehicles at the port are at most 100 and 5, respectively.

1. Introduction

The connection between maritime and inland transportation modes is a crucial element of global logistics systems. The process of unloading cargo from ships at ports and transferring it to inland destinations via trucks is complex and essential for operational efficiency. This step impacts port operations and the broader supply chain in terms of timeliness, cost, and resource utilization. Trucks are the primary mode of inland transport due to their flexibility, responsiveness, and ability to offer direct point-to-point service. However, coordinating ship unloading with vehicle scheduling poses significant challenges, such as aligning arrival and service times, managing limited port storage capacities, and coordinating labor and vehicle resources in dynamic and uncertain conditions. With increasing trade volumes and environmental concerns, there is a growing need for integrated and optimized approaches to port–truck operations. Therefore, the effective coordination of ship unloading and truck dispatching is a key area of focus in maritime logistics and transportation planning.
The transshipment of liquid bulk cargo at ports accounts for a significant proportion of the critical operational links between maritime and inland transportation systems. Ship unloading operations in these contexts are typically continuous (non-stop unloading of the ship at the port, taking many hours or even days) and time-sensitive, requiring seamless coordination with inland distribution via tanker trucks. Due to the hazardous and perishable nature of many liquid products, such as chemicals, fuels, or food-grade liquids, reducing the dwell time at ports is essential to maintain product integrity, minimize handling risks, and uphold service quality throughout the supply chain. For instance, during prolonged continuous ship unloading operations at ports, the associated number of risks tend to increase, thereby necessitating the enforcement of constraints such as maintaining a minimum number of backup vehicles. As a result, ports often require logistics companies to ensure the prompt and error-free transportation of hazardous materials. Full truckload (FTL) configurations are the primary mode of inland transport, offering flexibility and direct service capability. However, integrating continuous ship unloading with truck dispatching presents complex operational challenges, including real-time vehicle assignment, routing constraints, and driver scheduling compliance with labor laws and safety standards. This problem represents a multi-level decision-making environment where unloading operations, vehicle routing, driver scheduling, multiple time windows, and heterogeneous fleets must be optimized simultaneously. Therefore, this study aims to develop a comprehensive approach to jointly optimizing long continuous ship unloading, FTL vehicle routing, and truck driver scheduling, with the goal of minimizing the total transportation costs while ensuring operational feasibility and regulatory compliance.
It must be emphasized that the numerous variants of the Vehicle Routing Problem (VRP) present significant complexities in the field of optimization and have far-reaching implications across sectors that are vital to global economies. For an in-depth examination of these VRP variants, the study by Konstantakopoulos et al. [1] is recommended. Each variant introduces additional computational challenges, often rendering the problems NP-hard and thereby requiring the development of advanced exact, heuristic, and metaheuristic solution methodologies. Consequently, despite the absence of port-specific complexities, the inherent difficulty of VRP variants remains substantial. Furthermore, although the presence of a ship introduces additional factors, it does not fundamentally alter the network structure of a typical VRP. This is because the ship can be modeled as a major supply node, and VRP networks generally comprise customer, supply, departure, and garage nodes within their solution frameworks.
Particle Swarm Optimization (Kennedy et al. [2]), Adaptive Large Neighbourhood Search (Ropke et al. [3]), Tabu Search (Glover [4]), Memetic Algorithms (Moscato [5]), and Genetic Algorithms (Holland [6]) are among the most commonly preferred metaheuristic approaches for addressing the complexities of VRP, particularly in obtaining high-quality upper bounds. In contrast, heuristic methods such as insertion heuristics (Solomon [7]), nearest neighbor heuristics (Lin [8]), and local search heuristics (Lin [8]) are widely employed across various VRP variants due to their simplicity and efficiency.
In recent years, the logistics sector has experienced increasing complexity driven by the diverse and evolving needs of individuals and organizations. As the feasible solution space of the relevant problems expands with the growing number of combinations, heuristic approaches may tend to deviate significantly from the optimal solution. Consequently, the literature has increasingly focused on the employment of exact algorithms. The application of exact algorithms in FTL operations is relatively limited compared to their use in other VRP variants, despite the fact that FTL constitutes a significant portion of port operations that influence global economies, as previously discussed. Moreover, studies that interweave exact algorithmic frameworks with heuristic or metaheuristic methods remain scarce. Therefore, to address the FTL-based ship unloading problem examined in this study, a column generation (CG) algorithm that was designed for exact optimization is employed alongside a construction heuristic to acquire initial columns or routes. Nevertheless, acceleration techniques are also employed to enhance the efficiency of the CG iterations. Notably, bi-directional search and heuristic column generation have proven to be highly effective in improving CG convergence, as demonstrated by Righini and Salani [9] and Desaulniers et al. [10], respectively. When multiple subproblems are present, the subproblem selection technique enables the heuristic column generation method to operate efficiently across them. In this context, the subproblem selection approach can be regarded as a generalized form of heuristic column generation.
In short, our contributions can be summarized as follows:
  • Constraints related to continuous unloading operations due to liquid-based products, vehicle routing, multiple daily time windows, driver scheduling, and heterogeneous fleet composition are simultaneously and uniquely incorporated in the objective of minimizing the total transportation costs;
  • This study uniquely investigates the optimal timing and duration of breaks or rest periods for truck drivers operating within a continuous ship-unloading-based FTL network;
  • The continuity of ship unloading is uniquely discretized by generating corresponding supply nodes with specific time window structures, enabling the application of efficient exact VRP solution methods alongside appropriate acceleration techniques;
  • The nested label setting algorithm is customized to align with the specific characteristics of the FTL structure and is uniquely adapted to incorporate port-related constraints, such as continuous unloading, as well as vehicle-related constraints, including a requirement that each vehicle be loaded a certain minimum number of times;
  • Acceleration techniques are also specifically adapted to account for the dynamics of the port–truck integration, thereby enhancing the performance of the nested label setting algorithm;
  • This study presents a unique and detailed performance evaluation regarding long continuous ship unloading with the FTL delivery problem using the proposed algorithm.
Following the Introduction in Section 1, Section 2 reviews the key contributions in the literature, with a particular focus on FTL transportation systems incorporating truck driver scheduling. Section 3 presents the problem definition, provides the mathematical formulation, and illustrates the corresponding vehicle network flow. Section 4 then discusses the core components of the proposed algorithm, while Section 5 evaluates its performance based on the relevant input instances. Finally, Section 6 concludes the study and outlines promising directions for future research.

2. Literature Review

It is important to note that there exists a substantial body of research focusing on port operations, including ship planning and scheduling. However, the number of studies significantly decreases when these operations are integrated with VRP(s). This decline can be attributed to the additional complexities introduced by the specific constraints inherent in port operations, which pose further challenges to conventional VRP formulations. Consequently, many of the existing studies that address the combined problem of port operations and vehicle routing rely on heuristic algorithms to manage the computational difficulties associated with large-scale instances Undoubtedly, mixed-integer programming approaches have been employed to address the relevant port-oriented problems in an exact manner. However, the application of more efficient methods, such as the column generation technique and its associated acceleration strategies, remains relatively limited.
The FTL problem was first introduced by Ball et al. [11], who aimed to determine the optimal fleet size by constructing vehicle routes that satisfied maximum route–time constraints. Their study effectively identified the core challenges associated with implementation and proposed potential solution strategies. Subsequently, Desrosiers et al. [12] applied an asymmetric Traveling Salesman Problem (TSP) model incorporating two types of constraints to demonstrate its applicability and effectiveness within FTL systems.
Currently, VRP studies have not focused considerably on the integration of truck driver scheduling within exact algorithm frameworks. This is primarily due to the fact that driver scheduling remains an underexplored aspect across many VRP variants. The initial efforts for an exact solution in this direction were made by Tilk [13] and Goel and Irnich [14], who investigated the problem under United States regulations. Subsequently, Tilk and Goel [15] extended this line of research by incorporating acceleration techniques and adapting the model to comply with European Union regulations. Notably, while U.S. regulations prohibit the splitting of rest or break periods, European regulations permit such periods to be taken in a partial manner.
El Bahi et al. [16] addressed the optimal distribution of petroleum products using a heterogeneous fleet with multiple compartments, employing mixed-integer programming to minimize transportation costs. However, their model did not incorporate driver scheduling or port-related constraints. Similarly, Budiyanto et al. [17] examined the cost feasibility of natural gas distribution to multiple island-based gas power plants, utilizing mixed-integer programming and genetic algorithms to account for necessary ship routing. Nonetheless, unlike the current study, their approach did not account for the port-related constraints and driver scheduling requirements arising from prolonged continuous unloading operations. Heidari et al. [18] applied mixed-integer programming for small instances and adaptive large neighborhood search heuristics for large-scale cases in solving the multi-product many-to-many maritime inventory problem. However, their model did not account for continuous ship unloading as a port operation and they employed ships instead of trucks during routing. Shafipour et al. [19] studied liquid transportation, similarly to in the present work; however, vehicle routing was not considered, as transportation occurred solely via ships between ports. Santos et al. [20] investigated the scheduling of shuttle tanker operations for offshore oil transport. They employed integer linear programming and simulation techniques to minimize costs; however, as opposed to the current study, they did not incorporate driver scheduling or port-specific constraints. Budiyanto et al. [21] analyzed natural gas distribution to mobile power plants using small gas carriers, a setting conceptually related to this work. Their model combined integer linear programming with a greedy algorithm to reduce transportation costs, yet it did not consider driver scheduling or port constraints (such as non-stop unloading operations at the port taking many hours), both of which are integral to the approach proposed in this study. Gao et al. [22] investigated the ship unloading operations for a steel plant, aiming to minimize the total demurrage costs within a defined planning horizon using a column generation approach. However, their study did not address liquid-based products, nor did it incorporate vehicle routing with driver scheduling or the port-related constraints considered in the current work. Fu et al. [23] applied hybrid ant colony optimization and a genetic algorithm to solve a VRP related to port cargo transportation. In contrast to this study, their work did not involve liquid-based port operations, the associated constraints, or truck driver scheduling. Larsen et al. [24] developed a model predictive control framework to determine the optimal combinations of trucks, ships, and trains for container transportation within ports. Nonetheless, their focus excluded liquid products and was not centered on exact algorithms, unlike the current study. Baldouski et al. [25] examined the scheduling of truck arrivals to optimize the container flow in port logistics, employing mixed-integer linear programming to determine the optimal routes and schedules. Although there are certain similarities with the present study, their work did not address truck driver scheduling or liquid-based ship unloading operations. He et al. [26] developed a branch and price algorithm for customized bus services as an innovative public transport solution. Their results demonstrated that the proposed procedure significantly outperforms mixed-integer programming solvers, yielding very low optimality gaps. Similarly, Joo et al. [27] investigated a branch and price algorithm for drone–vehicle routing problems that incorporate the distinct operational constraints of drones. For large-scale instances, they designed an algorithm capable of achieving low optimality gaps and showed that it substantially outperformed mixed-integer programming solvers as well.
To the best of our knowledge, no existing study has integrated liquid-based ship unloading with full truckload vehicle routing and truck driver scheduling. Consequently, this specialized VRP variant has not yet been addressed using any exact algorithmic approach. The distinctive features of this study are summarized in Table 1. Accordingly, the primary objective is to achieve the minimum transportation cost by employing a CG-based exact algorithm, supported by acceleration techniques and a construction heuristic, within the framework of the specified FTL network structure.
In terms of Table 1, A–H represent liquid-based transportation, truck routing, ship unloading, truck driver scheduling, the exact algorithm solution, the column generation-based exact method, the heuristic method, and port-related constraints, respectively.

3. Problem Description

This section begins with the problem definition. Subsequently, a detailed mathematical model is presented to capture the dynamics of the specified FTL problem. Finally, the network representation is provided to facilitate visualization.

3.1. Problem Definition

This study focuses on an exact solution approach for a complex problem involving liquid-based ship unloading, FTL vehicle routing, and truck driver scheduling. The overall problem can be reformulated as an FTL problem defined over a specialized network with distinct operational constraints. The network consists of a departure node, a terminal/garage node, and customer and supply nodes, as well as a heterogeneous fleet of vehicles, including both rented and company-owned trucks, each subject to availability limits. All customer demands must also be fully satisfied. When a vessel arrives at the port, it is assigned a specific berth occupancy period, thereby imposing a fixed time horizon for the FTL operations. Within this period, the vessel must be unloaded, and its cargo transferred to vehicles, which are then routed to customer nodes while respecting their individual, often multiple, time window constraints. Due to the nature of liquid transport, unloading from the vessel must occur continuously. This necessitates that once one vehicle is fully loaded, another must be immediately available at the berth to maintain uninterrupted pumping operations. As an additional port constraint, port authorities require multiple backup vehicles to be present during the loading of each vehicle, particularly when hazardous liquids are involved. This precaution ensures that, in the event of a breakdown or malfunction, a backup vehicle can immediately replace the affected vehicle to prevent any disruption to the continuous unloading process and to facilitate the timely and complete transfer of liquid cargo from the vessel.
In FTL transportation, logistics companies commonly utilize a combination of owned and rented vehicles. This approach is often preferred because renting vehicles allows companies to avoid various expenses associated with ownership, such as maintenance, insurance, driver salaries, and potential penalties resulting from driver-related incidents during transport. For instance, a rented vehicle equipped with the same trailer type as an owned vehicle typically incurs lower operational costs for the logistics provider. However, despite the cost advantages of rented vehicles, logistics companies must maintain their own fleet to reduce dependence on external providers and ensure operational flexibility. Therefore, it becomes crucial to optimize the utilization of the entire fleet, both owned and rented vehicles, in order to achieve the lowest possible total transportation cost. Furthermore, while the operational costs of rented vehicles are lower compared to those owned by the company, their travel times may vary, being either shorter or longer, relative to the company-owned fleet.
According to labor regulations, truck drivers are required to take designated rest and break periods during their travel. Logistics companies are strictly prohibited from violating these regulations. Many governments enforce such service time rules to enhance road safety and reduce the risk of accidents. Without proper driver scheduling, fatigue can lead to severe accidents, posing risks not only to the drivers themselves but also to the public and the logistics companies. Even in the absence of accidents, inadequate rest can negatively affect a driver’s health and long-term performance. Regulatory frameworks typically define minimum durations for rest and break periods, as well as maximum allowable driving times between two consecutive rest or break intervals. As such, logistics companies must incorporate these regulations into their route optimization processes. Additionally, extended waiting times at nodes can contribute to driver fatigue. If a driver experiences prolonged waiting, they may require an earlier rest or break, potentially causing delays in reaching subsequent nodes and limiting the ability to follow cost-efficient routes. Therefore, unnecessary waiting times should be minimized, and, where possible, rest or break periods should be extended proactively to align with operational needs. In summary, the effective management of driver fatigue and energy levels must be considered alongside other constraints in the overall objective of minimizing transportation costs. Although such adjustments do not alter the cost of a given route, they can significantly improve the schedule efficiency by minimizing the number of idle periods of a vehicle on this route. Undoubtedly, if a route fails to satisfy any feasible combination of rest, break, and driving time regulations, it is deemed infeasible within the context of the problem. In our work, United States-based truck driver regulations are taken into account as well.
During FTL operations at the port, the logistics company is required to station multiple vehicles as backup while another vehicle is being loaded. However, a constraint is also imposed by the logistic firm to prevent vehicles from being assigned solely to wait at the port without performing deliveries. Specifically, each designated vehicle must be assigned to serve at least a minimum number of customer nodes. For instance, every such vehicle should visit at least two or three customer locations before the vessel unloading process is fully complete.
Furthermore, travel times are generally not too long (like days or many hours) in this type of port operation, as the port, comprising all supply nodes, is typically located in close proximity to the customer nodes/unloading zones of trucks. This geographical characteristic significantly contributes to the expansion of the feasible solution space. For example, if the travel times between nodes exceed the specified time horizon, the problem becomes infeasible. Therefore, shorter travel times result in a larger feasible region within the solution space. It is important to note that the unloading locations may either coincide geographically or be situated at distinct locations. In this study, the more generalized and challenging case involving distinct unloading locations is considered.
Nevertheless, due to the extended duration of continuous ship unloading, which can span several hours or even days, customer nodes are associated with multiple time windows. While the port permits vehicles to unload the ship without time window restrictions, individual customer nodes may impose specific delivery time intervals. Therefore, this study incorporates multiple daily time window constraints for customer nodes, which are known to significantly increase the complexity of VRP(s). As a result, the inclusion of such constraints substantially intensifies the overall difficulty of the problem.
Furthermore, it is important to recognize that FTL deliveries inherently involve both loading and unloading locations, which correspond to supply and demand points, respectively. In this study, the demand points are referred to as customer nodes, in alignment with the terminology commonly adopted in the VRP literature, since demands are fulfilled at these locations. From the perspective of the FTL market, supply points request that logistics providers transport goods to their designated customers. Consequently, demand points are consistently labeled as customer nodes throughout this work. It should also be noted that truck drivers are not permitted to take rest or break periods while their vehicles are at the port. This restriction arises because the port area does not provide suitable facilities for drivers to take sleep, meal, or coffee breaks. Instead, drivers are required to remain alert and vigilant during ship unloading operations while present at the port.
In summary, the primary objective is to minimize the total transportation cost by incorporating the aforementioned constraints. Based on the definitions provided above, the key characteristics of the corresponding FTL framework are outlined below:
  • The port does not have time windows;
  • The fleet comprises both rented and company-owned vehicles;
  • Unloading starts as soon as the vessel is assigned to a berth at the port;
  • There are not multiple vessels for unloading;
  • A single type of liquid product is unloaded from the vessel;
  • The vessel does not have multiple compartments;
  • The vessel cannot pump the liquid into multiple vehicles at the same time;
  • Trailers are attached to the vehicles for transporting the liquid product;
  • Drivers are prohibited from operating vehicles in violation of the legally mandated rest and break regulations of the United States;
  • A minimum number of vehicles is always present at the port during unloading operations;
  • No vehicle is exclusively assigned to remain at the port solely as a backup;
  • Drivers are not allowed to take rests or breaks when they are at the port;
  • The transportation network is comprised of a departure and a terminal/garage node;
  • The transportation network has multiple supply and customer nodes;
  • There are not multiple distribution layers;
  • With respect to trucks, loading operations are carried out at supply nodes, whereas unloading operations take place at customer nodes;
  • Supply nodes have one time window, whereas customer nodes have multiple time windows.
The following assumptions have been made for the methodology:
  • Environmental influences such as traffic jams are disregarded;
  • No additional waiting time is required for the ship’s arrival at the port, as the arrival is already scheduled before;
  • The time window bounds of a supply node are equal to each other to reflect the continuous ship unloading in the specified FTL problem’s network;
  • The ship does not wait in the queue at the port;
  • Drivers are identical;
  • Drivers do not impose any constraint except driver scheduling rules;
  • The port has unlimited vehicle capacity;
  • The port does not have roadway capacity;
  • There is no equipment constraint for pumps intended for liquid cargo, such as availability;
  • The service rate of pumps is constant;
  • The pumping of liquid is continuous;
  • Multiple time windows are separate, daily, consecutive, and limited;
  • A restricted number of owned and rented vehicles are available;
  • Travel costs along arcs are fixed and known in advance;
  • All trailers that are capable of transporting the relevant liquid cargo are considered identical in terms of capacity and specifications;
  • The expense of transporting a loaded vehicle is twice as high as that of transporting an unloaded one;
  • A fixed set of supply and customer nodes are involved;
  • Travel times between all nodes are predefined;
  • A predetermined minimum number of vehicles are available as backup during unloading operations;
  • Each designated vehicle serves at least a specified minimum number of customer nodes;
  • Minimum required durations for driver rest and break periods are enforced;
  • A maximum allowable driving time without rest is imposed;
  • A maximum allowable driving time without a break is specified;
  • A maximum permissible elapsed time without rest is defined;
  • A maximum permissible elapsed time without a break is also established;
  • There is no probabilistic or stochastic condition for the operations involved in the problem.
The assumptions concerning drivers’ rest, breaks, and driving times are fully consistent with the regulations of the United States Federal Motor Carrier Safety Administration. Furthermore, since the focus of this study is on the deterministic aspects of real-world processes, travel times and arc costs are treated as fixed and predetermined throughout the optimization procedure. The assumptions related to liquid-based ship unloading, port constraints, and pumping operations are also aligned with the standard industry practices, as confirmed by a major local logistics company that granted access to examine its operational procedures and experience. In addition, logistics companies are generally agile and accustomed to operating with a limited number of distinct vehicle types; however, heterogeneity among drivers is rarely considered within the sector. Accordingly, in our assumptions, vehicles are treated as distinct, whereas drivers are considered identical. In addition, during ship unloading, the logistics firm has to assign some customer nodes to each designated vehicle, otherwise waiting at the port throughout ship unloading can easily bother drivers and make them reluctant to serve.
In the proposed problem, each unit of time represents a 30 min interval. Accordingly, the time windows of customer nodes are defined based on the operational hours of these nodes. The time window structures of the supply nodes are configured to support the continuity of the unloading operations. Departure and terminal points are exempt from time window constraints. Furthermore, the travel and processing times are adjusted to align with this temporal framework.

3.2. Mathematical Formulation

The initial mathematical formulation is based on the CG approach introduced by Dantzig and Wolfe [28]. In the VRP literature, small- and medium-scale instances can generally be solved using mixed-integer programming models. For medium-scale problems, enhancements such as valid inequalities or cutting planes are commonly employed to reduce the integrality gap and limit the number of branch nodes explored by the mixed-integer programming solver. For large-scale instances, heuristic methods are often integrated to obtain high-quality upper bounds. However, branch-price-and-cut (BPC) algorithms have emerged as a significant approach for achieving optimality in large-scale VRPs, owing to the high efficiency of CG methods within VRP frameworks. This development is largely attributed to the foundational work by Desrosiers et al. [29], who applied the pricing algorithm, a core component of BPC, without incorporating branching or cutting techniques. Subsequently, Barnhart et al. [30] and Ropke et al. [31] extended the applicability of the pricing algorithm by incorporating both branching and cutting strategies, thereby enhancing its effectiveness in solving large-scale integer programming problems, including various VRP variants.
The notation employed for the CG model in this work is displayed in Table 2 below.
Based on the notation table, the column generation (CG) model is formulated as follows:
m i n   j J k K c j k θ j k  
subject to
j J k K a j k q θ j k = 1 ,   q   C
j J k K a j k q θ j k Y , q S
k K θ j k   H j   ,   j J
j J k K m , n     A ( U ) b j k m n θ j k 2 , U   P C  
j J k K m , n     A * ( m , n ) b j k m n θ j k 1 , m , n A * S C
q C a j k q θ j k X ,   j J , k K
θ j k   is   integer ,   j J , k K
Equation (1) defines the objective function, which aims to minimize the total transportation cost. Constraint (2) ensures that each customer node is visited just once. Constraint (3) ensures that each supply node is visited at least Y times, thereby guaranteeing the presence of multiple vehicles at the port as backups during the ship unloading process, in accordance with the problem definition. Constraint (4) restricts the total number of rented and owned vehicles departing from the departure node. Constraint (5) corresponds to the k-path inequalities (with k = 2), as proposed by Desaulniers, Lessard, and Hadjar [10]. All subsets U P C are constructed so that they contain disjoint customer nodes. Constraint (6) imposes arc flow restrictions, following the approach of Costa, Contardo, and Desaulniers [32]. To avoid handling all arc flow inequalities simultaneously during the column generation process, these cuts are introduced incrementally after a certain number of iterations. This strategy allows for the dynamic generation of dual variables from different inequality classes, which can enhance the effectiveness of the route generation in the subproblem phase. Constraint (7) enforces the requirement that each route should include at least X customer nodes, thereby preventing vehicles from being assigned exclusively to wait at the port and ensuring that every designated vehicle serves a minimum number of customer nodes, as many as X . Lastly, Constraint (8) enforces the integrality of the decision variables associated with the routes.
In the VRP literature, k-path inequalities are employed to tighten the relaxed master problem (RMP) in CG, effectively improving the lower bound and reducing the optimality gap. Desaulniers et al. [10] show that incorporating 2-path inequalities significantly enhances CG performance. Although higher order (k > 2) inequalities can further strengthen the RMP, their large number may impair computational efficiency, especially under the simplex algorithm, which struggles with large constraint sets. Even interior point methods face similar scalability issues. Consequently, BPC algorithms often favor 2-path inequalities, since logic-based or network-based branching (Kohl et al. [33] and Kallehauge et al. [34]) more effectively reduce the optimality gap than k-path (k > 2) constraints. In this study, branching was unnecessary due to the already low optimality gap (see performance analysis results).
Arc flow cuts quantify the flow over specific arcs, generating valid inequalities for the column generation model without altering its optimal integer solution (see Costa et al. [32] for a comprehensive review). These constraints contribute to tightening the RMP by improving the lower bound of the problem. However, in large-scale instances, the vast number of arcs makes adding all corresponding constraints simultaneously computationally impractical, significantly hindering convergence. Therefore, arc flow cuts should be introduced incrementally. In this study, for instance, they were incorporated every 50 iterations to ensure manageable and efficient integration.

3.3. Network Representation

According to the problem definition adopted in this study, the vehicle movements along the proposed routes are illustrated in Figure 1. The figure presents two distinct vehicles: a blue one attached to a green trailer representing an owned vehicle of the logistics company, and a red one with a green trailer representing a rented vehicle. The notation D i denotes the departure node for vehicles prepared to transport the i t h type of product. S i refers to the corresponding supply (loading) node, while C i indicates the customer (unloading) node for the same product type. G designates the terminal/garage node. The red vehicle’s route includes visits to two consecutive supply nodes. The first one represents a waiting period for the red vehicle while the blue vehicle is being loaded, and the second one represents the red vehicle’s own loading process while the blue vehicle is waiting.
In line with Figure 1, all supply nodes are located at the port to support ship unloading, whereas customer nodes are distributed across various off-port locations. Within the FTL network, both loading at supply nodes and unloading at customer nodes require 30 min, corresponding to one unit of time. The time windows for each supply node have equal lower and upper bounds, and the difference between the time windows of consecutive supply nodes is set to one time unit, matching the duration of a single loading or unloading operation. There is also no associated arc cost or travel time between consecutive supply nodes, as they represent the same physical location at different points in time. In Figure 1, from top to bottom, the first supply node possesses a single time window with the earliest bounds among all supply nodes, while the time window bounds of the subsequent supply nodes increase incrementally by one time unit, which is 30 min. In addition, for each supply node, there is a corresponding customer node and these customer nodes should be visited just once according to the CG model (1)–(8). These structures ensure that when the routes of multiple vehicles intersect at a supply node, one undergoes loading while the others remain idle as backups at this node, in accordance with port management protocols. Furthermore, for instance, if a ship has been scheduled to remain at the port for 25 h to provide a non-stop 25 h unloading process, 50 supply nodes are sufficient to discretize this continuous unloading period, given that each vehicle loading operation takes 30 min. Moreover, the ship’s scheduled duration of stay at the port determines the number of daily time windows assigned to customer nodes in the work. For example, if the ship is expected to remain at the port for 50 h (approximately two days), customer nodes are assigned three daily time windows. In general, the number of time windows for each customer node is defined as the sum of one and the rounded value of 1/24 of the ship’s stay duration at the port (for example, if the ship stays 20 or 38 h, the relevant rounded value becomes 1 or 2, respectively). Thus, due to the structure of the supply nodes, the complete unloading of the ship is ensured.
In the FTL market, regarding port operations, before a customer’s liquid product arrives at the port, the logistics company is informed by this customer as to the destination of each shipment. This is because the customer may have multiple regions (customer nodes/unloading zones, as mentioned above) that require the incoming product, and the logistics firm is responsible for delivering to these locations. In short, the customer provides a priority list based on the urgency of needs across various unloading regions. Therefore, the product unloaded first from the vessel (or the vehicle loaded first) is typically directed to the most urgent destinations. That is why each customer node in Figure 1 is served by a specific supply node that corresponds to a particular ship unloading time, as determined by the time window structure. Consequently, the vertical ordering of customer nodes in Figure 1 reflects their relative urgency priorities, indicating that the first customer node at the top has greater immediacy of demand compared to others. While in real life, certain zones may share the same priority, this study considers a more generalized and challenging scenario in which each zone has a distinct priority, reflected in varying arc costs and travel times.
In practice, within the context of our FTL network, the number of possible routing combinations can grow exponentially due to the high number of customer nodes and relatively short travel times (unlike long driving periods such as days or many hours). Additionally, driver scheduling constraints significantly increase the complexity of identifying feasible routes. Therefore, the use of both efficient heuristic and exact algorithms is essential for approaching optimality.
Figure 2 presents a detailed example of a designated vehicle’s route based on Figure 1, including the timing of rest, break, and drive periods. In this example, the vehicle sequentially visits nodes D 0 ,   S 0 ,   C 0 ,   S 0 ,   C 0 , before returning to the terminal/garage node G . In the given exemplary route, neither supply nodes nor customer nodes can be revisited due to the time window structure imposed on the supply nodes. Specifically, each supply node is associated with a unique time window, preventing multiple visits within a single route. Consequently, the routes depicted in Figure 1 are acyclic, as repeated visits to the same supply node are not permitted. Moreover, since each customer node is exclusively accessible through a corresponding supply node, customer nodes are also restricted to a single visit per route. Due to driver scheduling constraints, all vehicle operations must comply with the regulations outlined in the Methodology section, which are based on the United States Federal Motor Carrier Safety Administration guidelines. It is important to note that, under these regulations, rest periods are also considered break periods, and truck drivers are strictly required to adhere to these rules during their operations. Non-compliance can result in significant penalties for both the driver and the logistics company during traffic inspections. Accordingly, Figure 2 illustrates a feasible route that fully satisfies all break and rest period requirements without any violations under U.S. regulatory conditions.

4. Methodology

This section provides detailed explanations of the construction heuristic, the column generation method, and its acceleration techniques. Before presenting these details, the overall algorithmic framework is outlined as Steps of Overall Algorithm 1 below.
Algorithm 1. Steps of Overall Algorithm
1: Employ the construction heuristic algorithm to derive initial routes
2: Obtain the initial routes that will serve as initial columns for the column generation algorithm
3: Let initial routes be located in the RMP
4: Solve the RMP
5: Obtain the dual variables
6: Execute the nested label setting algorithm with the help of dual variables
7: Obtain a feasible route/column, which can improve the RMP, as a result of the nested label setting algorithm, add this promising route/column to the RMP, and return to Line 4
8: If no feasible route/column is found, then the RMP has reached optimality, which serves as a lower bound
9: Solve the integer version of the RMP with the generated columns so far and find an upper bound
10: Calculate the optimality gap

4.1. Construction Heuristic

An insertion-based method inspired by Solomon [7] is adopted, where customer nodes are incrementally added to a route in a feasible manner until all required customers are served. As a result of the construction heuristic algorithm, all customer nodes are served by vehicles, and each supply node is covered at least Y times in accordance with Constraint (3). However, some routes may fail to include the minimum required number of X customer nodes, as specified in Constraint (7). Consequently, a prohibitive cost is assigned to such routes to discourage their selection during CG iterations.
The pseudo code of the construction heuristic can be examined in Figure 3.
During the construction heuristic, the rest–break policy must be incorporated, and path generation should strictly adhere to these requirements. To insert nodes through appropriate extensions and to generate routes for each vehicle, the label updating process in forward labeling, utilizing the equations provided in the nested label setting algorithm part, is employed. In essence, the procedures outlined in the tables of this part are integrated into the construction heuristic to effectively address the rest–break–drive constraints. It should also be noted that the networks from which routes are derived in the construction heuristic algorithm differ depending on whether the selected vehicle type is rented or company-owned. This distinction mainly arises from the lower operational costs associated with rented vehicles. In fact, the networks for both vehicle types are mainly identical to that illustrated in Figure 1, except for the arc costs (travel times may be higher or lower during the comparison of vehicle types), which are reduced in the network that corresponds to rented vehicles.

4.2. Column Generation Algorithm

The CG method is highly effective and is designed to address large-scale integer programming models that inherently involve partitioning. Conceptually, CG serves as a framework. For example, thousands of studies employ mixed-integer programming models solved via the simplex method, which itself is a framework. However, the underlying computational process differs depending on the specific decision variables and constraints. While the CG method functions as a general framework (like the simplex method) its underlying procedure adapts to the characteristics of the problem at hand. In particular, for VRP variants, the CG process is modified through distinct labeling schemes and label updating rules, analogous to variations in decision variables or constraints within the simplex method. In the domain of VRP(s), CG methods have demonstrated significant advantages (Desrosiers et al. [29]) in addressing large-scale VRP variants compared to alternative approaches such as mixed-integer programming or branch and cut/bound, due to their exceptional computational efficiency. Mixed-integer programming is generally restricted to small-scale instances, as its complexity grows exponentially with problem size. Similarly, branch and cut techniques can effectively address medium-scale instances by employing sophisticated cutting strategies, but again exhibit exponential complexity for large-scale cases. In contrast, CG methods retain pseudo polynomial complexity even for large-scale problems, primarily due to the structure of the pricing problem within the CG framework. It is indisputable that the efficiency of the CG method can be substantially enhanced through the integration of acceleration techniques or the adoption of branching and cutting methodologies. Nonetheless, the proposed algorithm forgoes the branching phase, as it achieves a minimal optimality gap at the root node within the performance evaluation. Consequently, owing to its integration of both pricing and cutting mechanisms, it can be formally classified as a BPC algorithm.
According to the VRP literature, there is a clear trend indicating that CG-based algorithms are generally preferred over heuristic approaches, while achieving low optimality gaps or exact solutions, particularly for large-scale VRP instances. This preference arises because, even when heuristics are accelerated, they often fail to achieve low optimality gaps due to the vast solution space. In contrast, CG algorithms can be significantly accelerated using techniques such as those employed in this study. The literature shows that researchers typically focus on improving CG models through efficient label setting methods and other acceleration strategies, rather than on heuristics, while aiming to get exact solutions. Accordingly, as the primary objective of this work is to obtain exact solutions for large-scale instances of the specified FTL problem, our work employed the most effective exact method (CG method) and its most effective acceleration techniques, including bi-directional search, heuristic column generation, and subproblem selection. Therefore, our work does not focus on comparisons with heuristic approaches.
In VRP contexts, the CG method comprises two principal algorithms: the solver of the RMP, which produces the dual variables, and the label setting algorithm, which employs these dual variables to generate promising routes or columns. These algorithms are executed sequentially; hence, the overall computational complexity of the CG method is dictated by the algorithm with the higher complexity. The RMP is typically solved via interior point methods, which operate in polynomial time, whereas the label setting algorithm exhibits pseudo polynomial time complexity, as established by the works of Dial et al. [35] and Feillet et al. [36]. Consequently, the label setting algorithm constitutes the primary computational bottleneck in the proposed approach.
It should also be noted that the optimality of the RMP is attained upon the completion of the CG iterations, and that the optimal objective value of the RMP constitutes a valid lower bound for models (1)–(8) due to the relaxation of the integrality constraints. Undoubtedly, an upper bound for models (1)–(8) can be derived by solving the RMP with the currently generated columns in an integer manner. Consequently, the optimality gap can be determined from these bounds. However, models (1)–(8) involve an extensive number of route variables, and Constraint (7) introduces a substantial number of additional constraints. To alleviate this computational burden, Constraint (7) is omitted from the RMP. Nevertheless, the requirement embodied by this constraint that each route must include at least X customer nodes is enforced implicitly during the column generation process by ensuring that all generated columns/routes satisfy this condition without the loss of generality. Consequently, the RMP is solved without Constraint (7) and integrality constraints, while each generated route/column is constructed to be feasible with respect to Constraint (7), as well as truck driver regulations during the nested label setting algorithm (nested version of the normal label setting algorithm due to label updating procedure originating from driver regulations in the work).
According to the column generation model specified in Equations (1)–(8), the total number of subproblems equals j J 1 , with each subproblem corresponding to a specific vehicle type j J . Moreover, each subproblem is defined over a distinct network analogous to that depicted in Figure 1; however, the arc costs strictly differ to reflect the reduced expenses associated with rented vehicles, while travel times do not have such a restriction. In short, investigating different subproblems enables us to extract feasible routes that are suitable for the corresponding vehicle type. For a given subproblem network corresponding to a particular vehicle type j J , the pricing problem, aimed at generating routes/columns, can be formulated as follows:
min p P   c ¯ j p
subject to
time window constraints being respected
    driver scheduling constraints being respected
     each customer point should be visited at most once
Constraint (7) should be satisfied    
In the pricing problem presented above, P denotes the subset of all feasible routes within the given subproblem’s network, each visiting every customer node at most once, while simultaneously adhering to the time window constraints, truck driver scheduling regulations, and Constraint (7).
c ¯ j p = c j p q C a j p q   α q q S a j p q   α q U P C m , n     A U b j p m n   λ U m , n     A * S C m , n     A * m , n b o i j p m n p m n β    
In the equation above, c j p is the cost of the route, whereas α q , α q , λ U , p m n are the dual variables of (2), (3), (5), and (6), respectively, as a result of the solution of the RMP. β is the dual variable that belongs to (4), corresponding to the current subproblem.

4.2.1. Nested Label Setting Algorithm

The nested label setting algorithm is employed to address the pricing problem associated with each individual subproblem network, as previously described. Specifically, the total number of subproblems corresponds to the number of distinct vehicle types considered, with each vehicle type subject to its respective capacity constraint H j , as delineated earlier.
Given the pivotal importance of scheduling constraints in our study, we integrated and adapted the methodologies proposed by Tilk and Goel [15] as well as Goel and Irnich [15], tailoring their approaches to address the unique characteristics of the FTL problem merged with the continuous ship unloading operations under consideration. Moreover, we incorporated key insights from Feillet et al. [36] and Righini et al. [9], who developed advanced labeling techniques, namely forward and backward labeling, designed for solving the shortest path problems constrained by limited resources. These contributions were instrumental in generating feasible routes/columns within our column generation framework, aiding the derivation of tighter lower bounds. Consequently, we implemented a customized variant of these methods aligned with the specific demands of our problem.
Table 3 and Table 4 outline the critical frameworks that facilitate the practical execution of the nested label setting algorithm. Specifically, Table 3 details the Hours of Service regulations enforced by the Federal Motor Carrier Safety Administration as of 2022, which stipulate mandatory rest periods, breaks, and driving schedules for drivers operating on long haul routes within the United States.
Table 4 presents a detailed overview of the label structures generated within the nested label setting procedure.
Thus, a forward label belonging to a forward path P F = ( v 0 , v 1 , v i ) can be expressed as L i ( v i ,   S i , T i ) where v i   is the i t h node/vertex in the network, v 0 can be assumed to be the departure node in that network, and   S i includes the set of visited customer nodes in P F and T i = ( l c o s t , l t i m e , l d i s t , l d r i v e | R , l e l a p s e d | R , l e l a p s e d | B , l l a t e s t | R , l l a t e s t | B ) . Furthermore, L 0 ( v 0 , , T 0 ) , where T 0 = ( 0,0 , 0,0 , 0,0 , , ) , is employed to initialize the forward labeling procedures.
During the extension of forward labeling, multiple extension functions are employed to update the labels. Therefore, in Table 5 and Table 6, those functions can be examined in detail while potential feasible travel can occur from the i t h node to the j t h node, ensuring j S i and l t i m e +   t i j b j , where t i j is the required driving time between those nodes and b j is the upper bound of the selected time windows of the j t h node. In fact, these conditions make the usage of f i j s t a r t feasible. Because of the multiple time windows, [ a j , b j ] is one of the time windows of the j t h node, whereas s j is the process time of that node. After the extension, S j =   S i     { j } is obtained for L j ( v j ,   S j , T j ) , if j C .
In Table 5, is the drive time, break time or rest time related to f i j d r i v e ( ) , f i j b r e a k ( ) , or f i j r e s t ( ) , respectively. f i j d r i v e ( ) is feasible if 0 < l , where l indicates the maximum available driving time at that moment.
l = m i n ( l d i s t , t d r i v e | R l d r i v e | R , t e l a p s e d | R l e l a p s e d | R ,   t e l a p s e d | B l e l a p s e d | B )
f i j b r e a k ( ) , f i j r e s t ( ) can be applied in a feasible way if t b r e a k and t r e s t , respectively, as well as l 0 . f i j v i s i t can be feasible if l t i m e b j and l d i s t = 0 together, and it is also capable of reducing the redundant waiting times prolonging the last rest and last break periods. Furthermore, in l c o s t +   c ¯ i j , c ¯ i j is the updated version of c i j , with the dual variables taking Equation (9) into consideration.
If the number of generated labels increases dramatically, the performance of the column generation algorithm deteriorates. Therefore, the dominance rules created by Tilk [15] as well as Goel and Irnich [16] were employed in our study as follows:
i.
During travel, if l > 0 and l d i s t > 0 , then a drive period should take place subsequently;
ii.
Minimum rest and break periods should be taken at first, which are t r e s t and t b r e a k , respectively;
iii.
No two consecutive break or rest periods can exist;
iv.
Assuming L i 1 ( v i ,   S i 1 , T i 1 ) and L i 2 ( v i ,   S i 2 , T i 2 ) are two forward labels regarding the i t h node, L i 1 ( v i ,   S i 1 , T i 1 ) can dominate L i 2 ( v i ,   S i 2 , T i 2 ) if   S i 1   S i 2 , l 1 c o s t l 2 c o s t , l 1 t i m e l 2 t i m e , l 1 d i s t l 2 d i s t , l 1 d r i v e | R l 2 d r i v e | R , l 1 e l a p s e d | R l 2 e l a p s e d | R , l 1 e l a p s e d | B l 2 e l a p s e d | B , l 1 l a t e s t | R l 2 l a t e s t | R , and l 1 l a t e s t | B l 2 l a t e s t | B . Thus, L i 2 ( v i ,   S i 2 , T i 2 ) can be discarded.
A similar forward label procedure to the above can also be applied to backward labels, where the backward path is denoted as P B = ( v 0 b , v 1 b , v i b ) due to symmetry. Here, v 0 b is the garage node and v i b is the same node with v i . By using a sufficiently large positive number M, the time window [ a i , b i ] for each node v i becomes a i b , b i b =   [ M b i s i ,   M a i   s i ]   during backward labeling. For instance, M can be defined as the sum of 6 and the number of 30 min intervals between the ship’s arrival and its departure from the port. Although similarities are plenty between forward and backward labels, there are some slight differences in the updating procedures of labels.
A backward label belonging to a backward path P B = ( v 0 b , v 1 b , v i b ) can be expressed as L i b ( v i b ,   S i b , T i b ) , where v i b and   S i b serve as v i and   S i in the forward labeling. T i b = ( l c o s t b , l t i m e b , l d i s t b , l d r i v e | R b , l e l a p s e d | R b , l e l a p s e d | B b , l l a t e s t | R b , l l a t e s t | B b ) and v 0 b are now assumed to be the terminal nodes in the network. Thus, the backward label is initialized as L o b ( v 0 b , , T 0 b ) , where T 0 b = ( 0,0 , 0,0 , 0,0 , , ) .
The extension functions in forward labeling called f i j s t a r t , f i j d r i v e ( ) , f i j b r e a k ( ) , f i j r e s t , and f i j v i s i t become f i j s t a r t b , f i j d r i v e ( ) b , f i j b r e a k ( ) b , f i j r e s t b , and f i j v i s i t b in backward labeling, respectively. During forward labeling, there is travel on a forward arc from the i t h node to the j t h node; however, travel occurs on the reverse arc from the i t h node to the j t h node during backward labeling. Therefore, during the extension of the backward path, the feasibility of f i j s t a r t b requires j S i b and l t i m e b +   t i j b j b . In addition, the feasibility conditions and updating procedures for f i j d r i v e ( ) b , f i j b r e a k ( ) b , and f i j r e s t b are the same as their counterparts in forward labeling. However, a slight difference emerges when applying f i j v i s i t b during backward labeling. In fact, f i j v i s i t b covers the same concepts and conditions as f i j v i s i t , but it has two additional conditions to ensure feasible extension, which are as follows:
f i j v i s i t b l e l a p s e d | R b t e l a p s e d | R   f i j v i s i t b l e l a p s e d | B b t e l a p s e d | B
It must also be noted that the function f i j v i s i t b updates l c o s t b ,   l t i m e b ,     l d i s t b ,   l d r i v e | R b as in the forward labeling operations. However, l e l a p s e d | R b ,     l e l a p s e d | B b ,   l l a t e s t | R b ,   l l a t e s t | B b are updated in a different way, as shown in Table 7 below.
Note that l e l a p s e d | R b = 0 indicates that the last used extension function was f i j r e s t b , while l e l a p s e d | B b = 0 means the last used extension function was f i j r e s t b or f i j b r e a k b . Given the structural characteristics of the extension functions in the backward labeling framework, the dominance criteria applied in the forward labeling procedure remain valid and can be equivalently utilized to identify and eliminate inferior backward labels.
When forward labels are derived, l t i m e is chosen as a main resource. The forward label L i can be lengthened to node j by obtaining L j , while l t i m e M 2 + s j   . A similar process is implemented for backward labeling.
According to the problem specification, the logistics company prohibits drivers from taking break or rest periods while stationed at the port. Within the forward labeling phase of the nested label setting algorithm, this restriction entails that when a forward arc is traversed from a customer node to a supply node, or from a departure node to a supply node, with l d i s t = 0 , the extension functions f i j b r e a k ( ) , f i j r e s t ( ) are disallowed. In such cases, the extension function f i j v i s i t must be applied when l d i s t = 0 . In the context of backward labeling, a similar constraint holds: when initiating travel along a reverse arc from a supply node to a customer node, the extension functions f i j b r e a k ( ) b , f i j r e s t b are likewise prohibited. Instead, f i j d r i v e ( ) b must be used whenever feasible. If this is not possible, the current backward path is terminated without extension.
Following the generation of both forward and backward labels, their concatenation is performed to derive a candidate column/route that holds potential for enhancing the column generation process. Assuming L i ( v i ,   S i , T i ) and L i b ( v i b ,   S i b , T i b ) , which are the forward and backward labels for the i t h node, respectively, the concatenation rules should be taken into account as follows:
  S i   S i b = 1
l t i m e s i M l t i m e b
l d r i v e | R + l d r i v e | R b t d r i v e | R
l l a t e s t | R + t e l a p s e d | R M l l a t e s t | R b
l l a t e s t | B + t e l a p s e d | B M l l a t e s t | B b
l e l a p s e d | R + l e l a p s e d | R b s i t e l a p s e d | R     or   l e l a p s e d | R s i or   l e l a p s e d | R b s i
l e l a p s e d | B + l e l a p s e d | B b s i t e l a p s e d | B     or   l e l a p s e d | B s i or   l e l a p s e d | B b s i
Upon the completion of the concatenation stage, the generated route/column must satisfy Constraint (7), which mandates the inclusion of no fewer than X customer nodes within each route. If this condition is not fulfilled, the nested label setting algorithm continues its execution to generate a feasible route.

4.2.2. Acceleration Techniques

Since the nested label setting algorithm represents the principal computational bottleneck within the CG framework described earlier, implementing acceleration strategies specifically designed for this algorithm holds substantial promise for markedly improving the overall computational efficiency. Within the current VRP research domain, exact solution methodologies for large-scale instances are frequently preferred, owing to the well-established effectiveness of the CG approach. As a result, BPC algorithms have attracted considerable scholarly attention. In this work, we employ the most effective exact algorithm (CG-based algorithm) identified in the literature, integrating it with the most promising and widely acknowledged acceleration techniques documented in prior studies.
Heuristic Column Generation
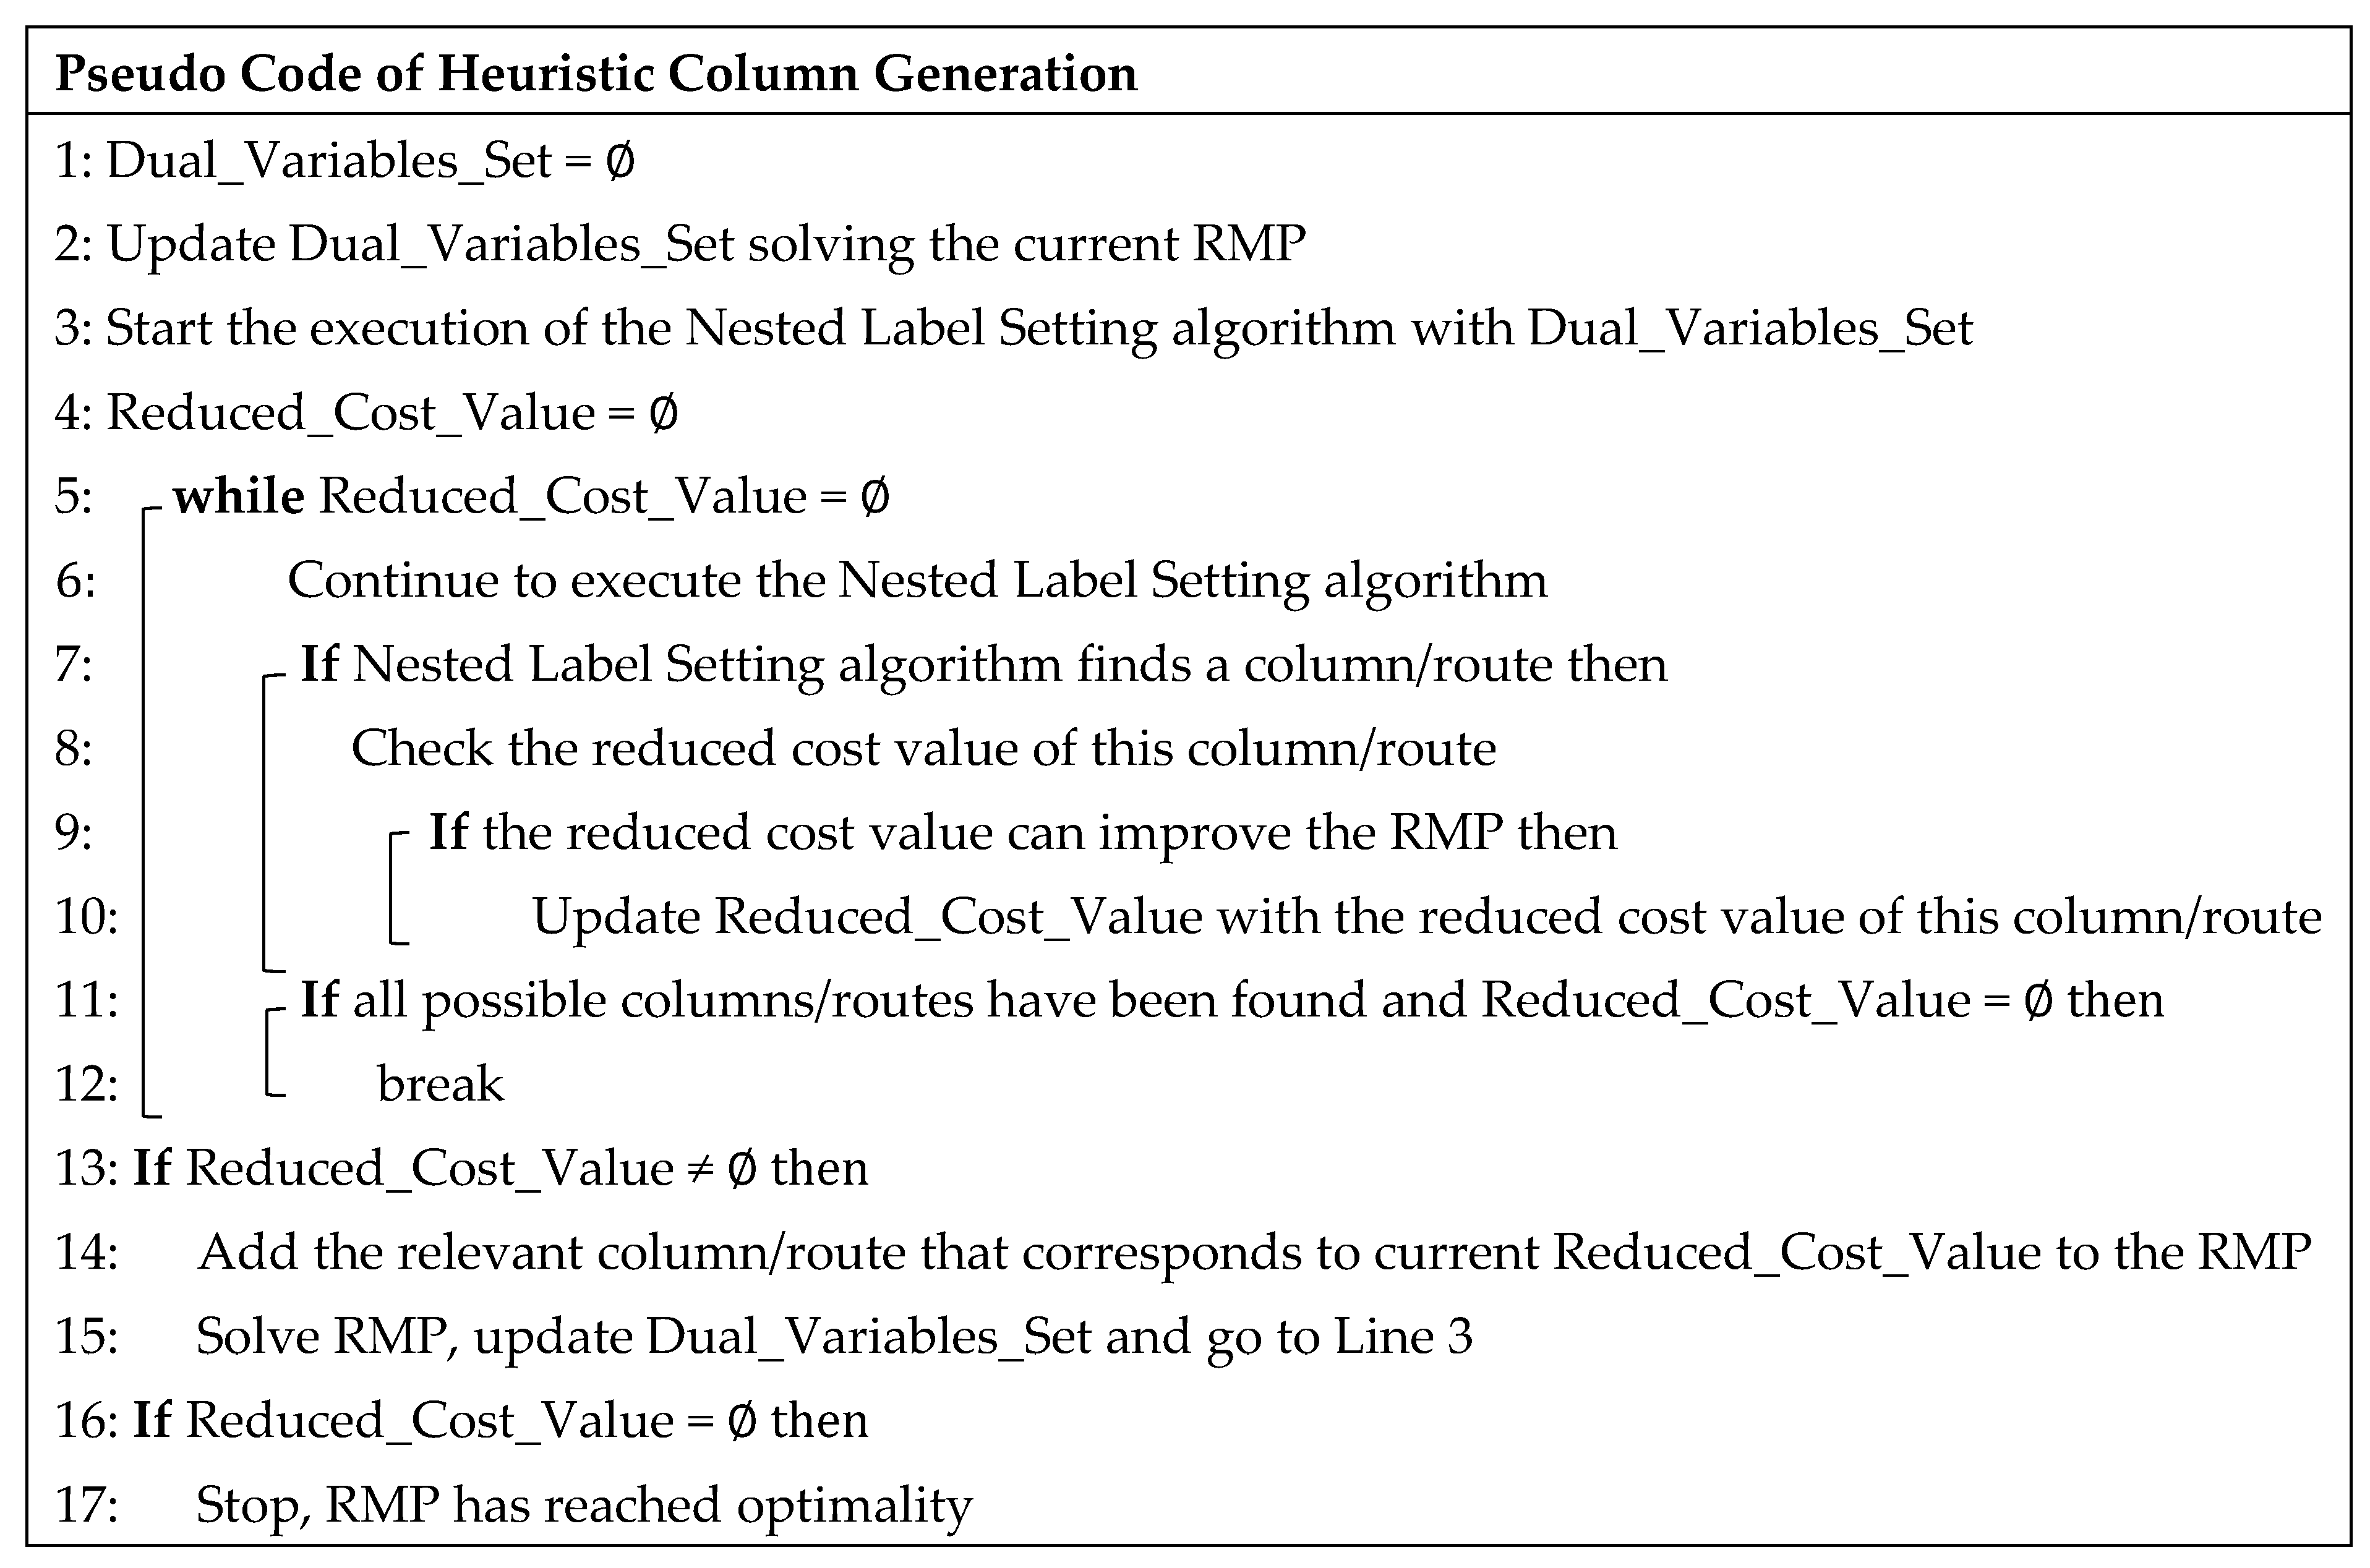
In the context of the label setting algorithm, the identification of the column offering the most reduced cost can impose considerable computational demands, arising from the necessity to examine an extensive set of labels (Desaulniers et al. [10]). To mitigate the computational overhead, Desaulniers et al. [10] embraces the approach that prioritizes selecting the first suitable column within a given subproblem that exhibits a favorably reduced cost, rather than exhaustively searching for the best one, by demonstrating the effectiveness of it as well. If no promising column is identified in the current subproblem, the process advances to subsequent subproblems, aiming to locate the first suitable column that meets the advantageous reduced cost criterion. Given the problem-specific nature of the approach, the formulation and deployment of this acceleration technique may vary substantially. This is because different VRP problems require distinct label management, and variations in label usage result in corresponding differences in the algorithmic execution of this acceleration method, as mentioned by Desaulniers et al. [10]. Accordingly, its procedural framework for the specified FTL problem is presented in the pseudo code illustrated in Figure 4.
Subproblem Selection
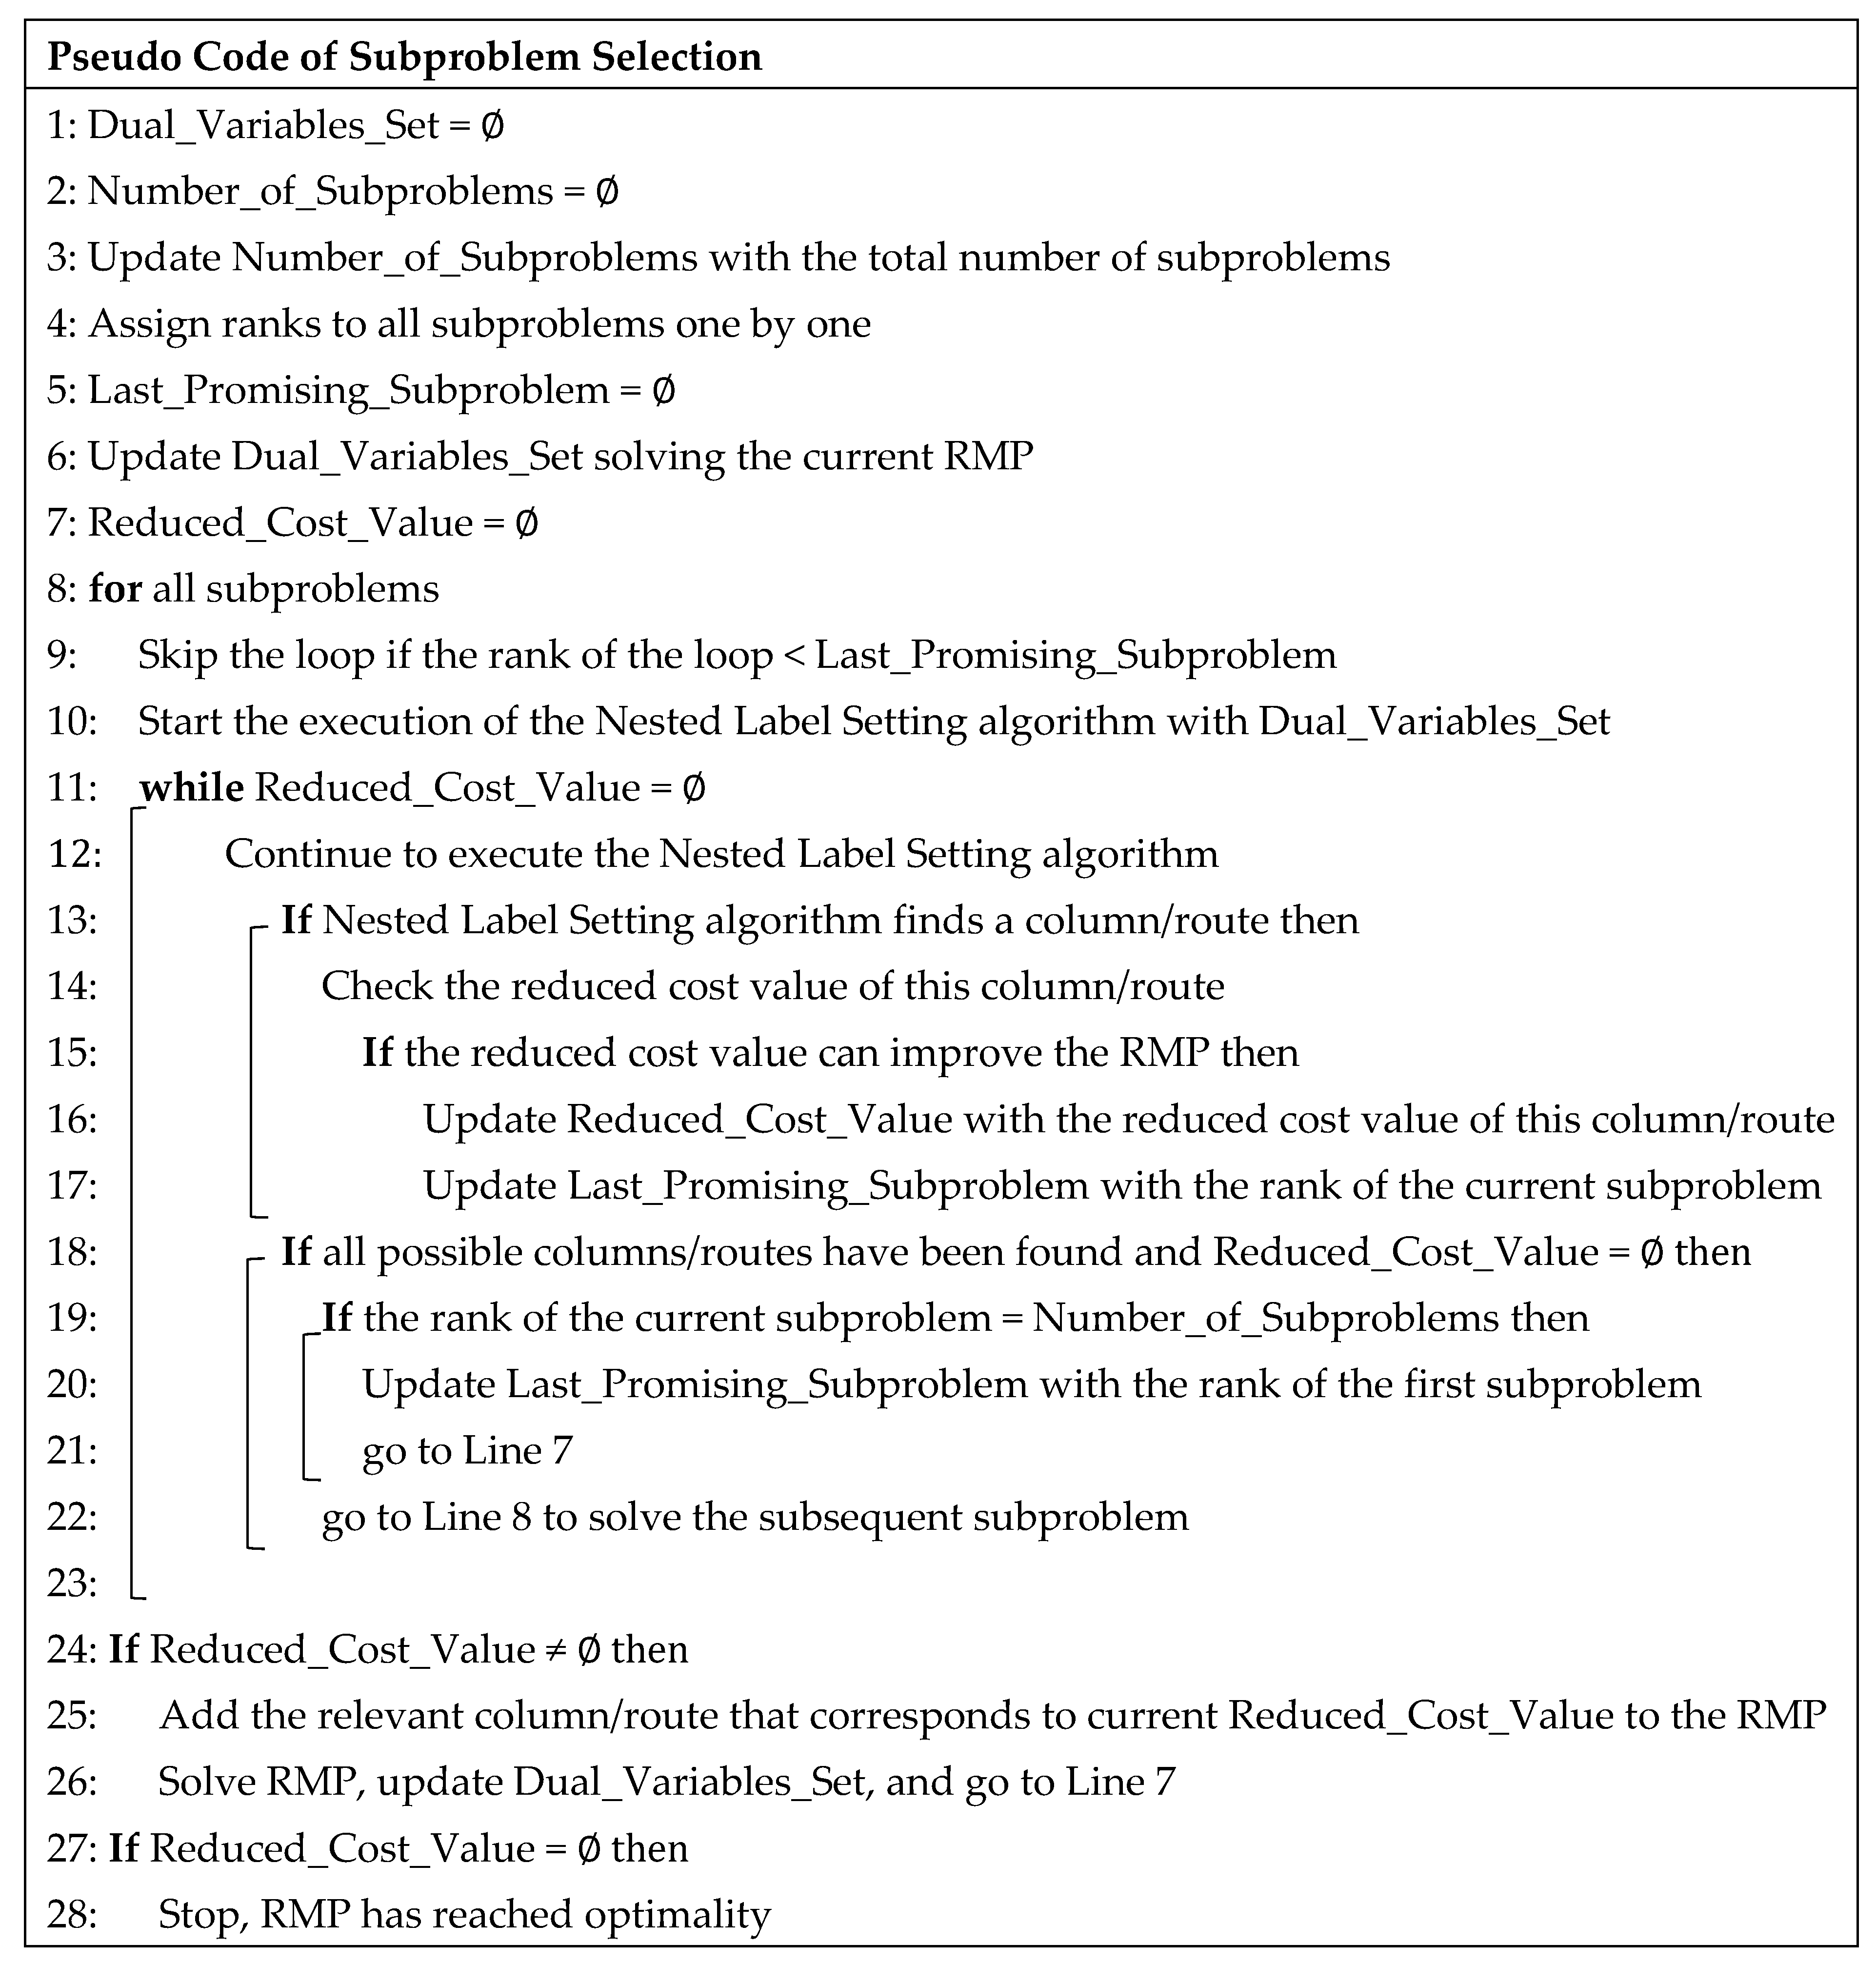
In scenarios where only a single subproblem is present during the iterations of the CG procedure, the application of this acceleration strategy is unnecessary. However, its relevance becomes pronounced in the presence of multiple subproblems. As the RMP advances through successive iterations, certain subproblems may cease to generate columns capable of improving the RMP, thereby causing a considerable escalation in computational time, particularly in large-scale instances. In other words, it is undesirable to solve a subproblem, which is incapable of producing a suitable column, in vain. To address this inefficiency, the proposed method prioritizes the evaluation of the most recent subproblem that has successfully contributed a favorable column to the RMP, rather than examining all subproblems in detail. It is important to note that this approach represents an advancement of the initial acceleration strategy proposed by Desaulniers et al. [10]. While the heuristic column generation method identifies the first suitable column in scenarios involving a single subproblem, the present technique extends this principle to settings with multiple subproblems. Rather than conducting a detailed search for the best column/route across all subproblems, it prioritizes a selected subproblem and seeks to identify the earliest encountered suitable column/route. Like heuristic column generation, the subproblem selection technique can vary significantly in terms of design and implementation, while there is a change in the problem structure. This is because, generally, the distinct VRP variants entail the distinct calculation of feasible paths, and subproblems are aimed at producing paths in distinct forms. The procedural structure of this method is illustrated in Figure 5.
Bi-directional Search
Resource-based elementary path problems, where cycles are prohibited, hold a central role in network and flow optimization within the field of operations research. Their significance stems from the fact that numerous real-world applications inherently exhibit complex and heterogeneous network structures. Consequently, shortest path problems occupy a fundamental position in this domain. Nevertheless, resource-based elementary shortest path problems constitute a broader and more complex generalization of the classical shortest path problem, as they incorporate additional dimensions arising from constraints on resources such as capacity, time, or other operational limitations. Prior to the work of Righini et al. [9], resource-based elementary shortest path problems were predominantly addressed through a mono-directional search strategy, in which path construction commenced from the origin node and progressed toward the terminal node exclusively via forward extension functions. Righini et al. [9], however, introduced a more advanced approach that leveraged both forward and backward extension mechanisms. Specifically, they simultaneously generated forward paths from the origin and backward paths from the terminal/garage node, thereby implementing a bi-directional search paradigm. This innovation proved markedly more efficient than the traditional mono-directional method, as it allowed for the concurrent development of partial forward and backward paths, substantially reducing the computational time required to identify a suitable column/route within the nested label setting algorithm.
In the present study, the generation of forward paths through forward extensions utilizes the procedures detailed in Table 5 and Table 6, whereas the construction of backward paths through backward extensions relies on the procedures outlined in Table 5 and Table 7 (recalling that, apart from the visit function, all extension functions employed in the backward labeling process are identical to those used in the forward labeling process). Furthermore, in order to have an efficient bi-directional search, its resource-bounded version (as Righini et al. [9] suggested) is employed in the study. Thus, l t i m e was chosen to be a vital resource of paths. Thus, our forward paths in the work were restricted by l t i m e M 2 + s j   for L i ( v i ,   S i , T i ) , where T i = ( l c o s t , l t i m e , l d i s t , l d r i v e | R , l e l a p s e d | R , l e l a p s e d | B , l l a t e s t | R , l l a t e s t | B ) and   M is a sufficiently large number. The same bounding concept was applied to backward label extensions as well.
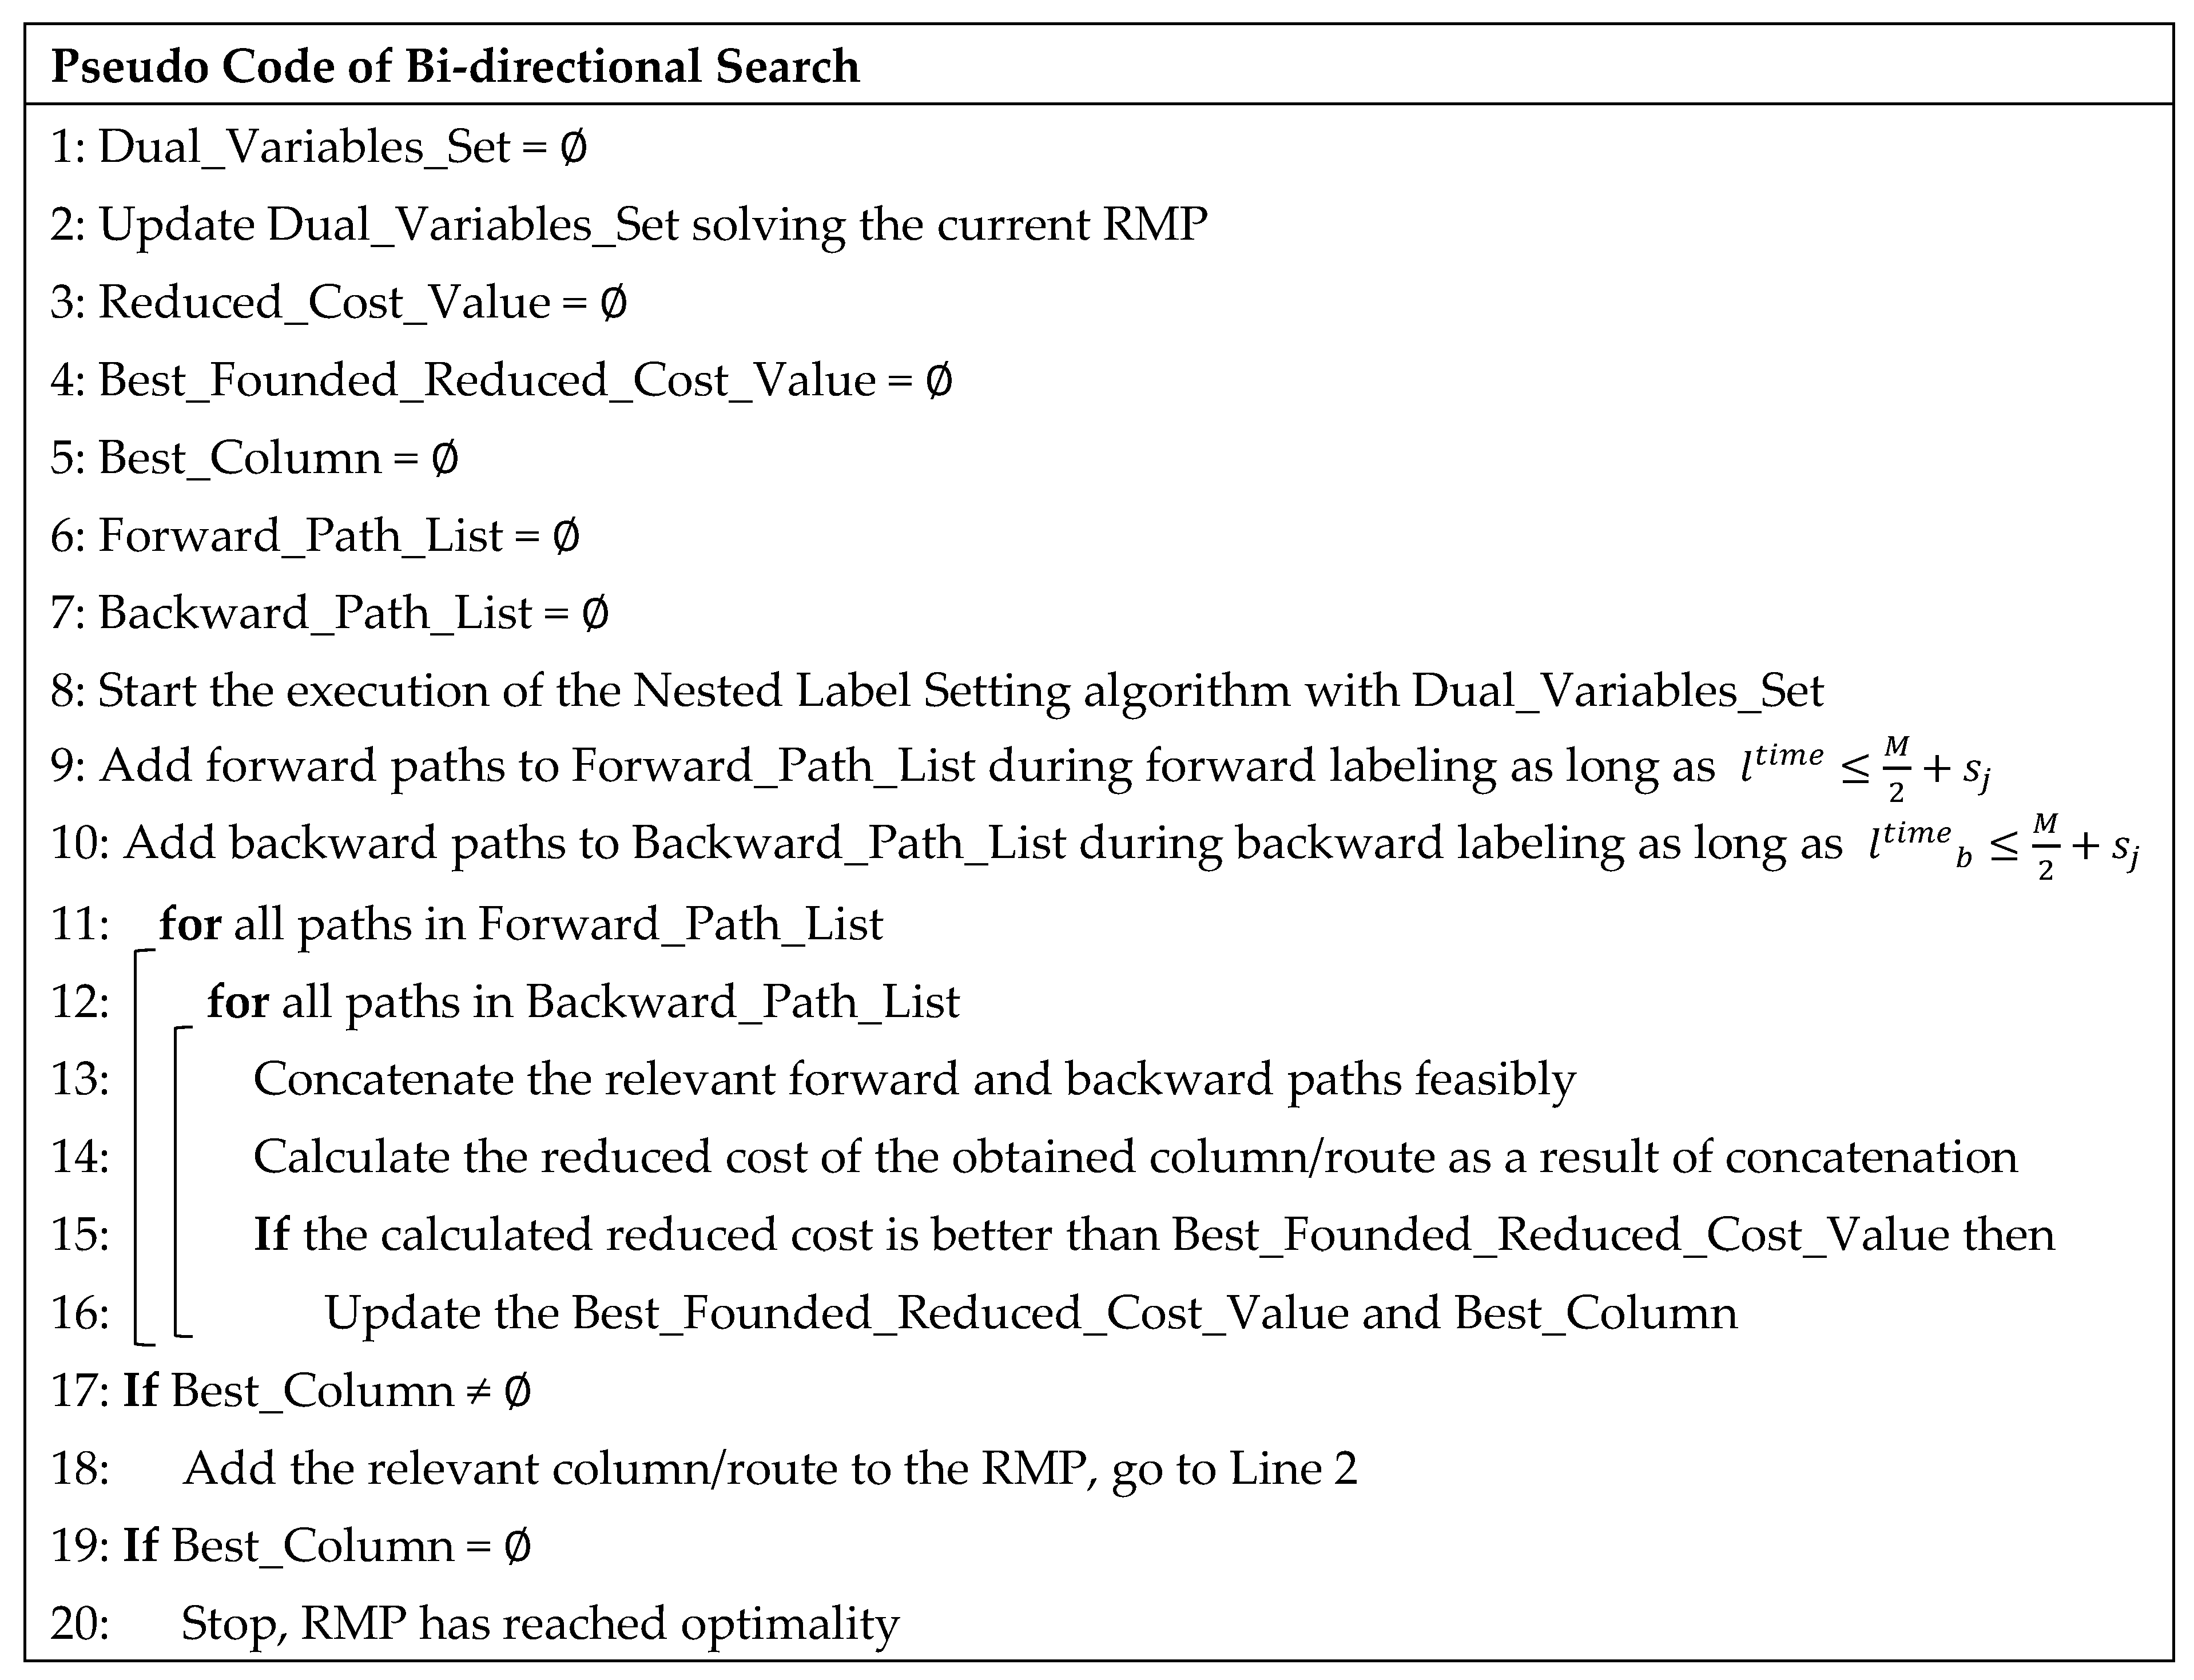
Due to the fact that bi-directional search is just a concept, its deployment can vary considerably over different problem structures. This is because, when addressing different VRP variants, feasible paths must be concatenated according to distinct rules. For instance, the rules governing path construction for electric vehicles differ significantly from those required for paths that must comply with driver rest–break regulations. Thus, for the specified FTL problem, Figure 6 indicates the outline of bi-directional search below.
Figure 7 indicates the outline of concatenation below.

5. Computational Study

In this section, instance creation is explained in detail, followed by a detailed presentation of the performance results with the relevant inputs and outputs. Nevertheless, the discussion of results is then organized into three parts: computational time analysis, analysis of the number of vehicles used, and analysis of the optimality gap.

5.1. Creation of Instances

As no established benchmark datasets exist for the specific structure of our problem, artificial instance sets were developed by drawing on the operational practices of a major Turkish logistics company with a substantial fleet (approximately 600 vehicles) and extensive expertise in liquid transportation. Relevant ranges were defined for arc costs and travel times with respect to this logistics company. The processing durations at supply nodes (vehicle loading/ship unloading) and customer nodes (vehicle unloading) are constant and taken as one unit of time, which is thirty minutes. Within these ranges, random values were generated using a uniform distribution to ensure a realistic representation of practical scenarios. To guarantee the triangle inequality for both arc costs and travel times, the Floyd–Warshall all pairs shortest path algorithm [37] was applied. Subsequently, additional costs associated with vehicles in the loaded state were incorporated into the arc costs obtained from the Floyd–Warshall procedure.
The experimental setup considers instances with {40, 50, 60, 70, 80, 90, 100} supply nodes and an equal number of customer nodes. Since the service times at supply nodes (vehicle loading/ship unloading) and customer nodes (vehicle unloading) are fixed at thirty minutes, the allowable berthing time of the ship at the port is set to {20, 25, 30, 35, 40, 45, 50} hours, respectively, corresponding to the number of supply nodes in each case. In these instances, customers may have two or three daily time windows. A single departure node is included, and the fleet composition varies between 65–35% and 50–50% ratios of company-owned to rented vehicles. Furthermore, the column generation model for this problem contains a substantial number of constraints of type (6). To manage computational efficiency, these constraints are progressively introduced, with one constraint added after every 50 iterations of column generation for each instance.
In the operational framework of the considered logistics company, each driver must be assigned a minimum number of trips, which, in this study, is set to at least two per vehicle for all problem instances in order to satisfy the parameter X in Constraint (7). Concurrently, the company must maintain a continuous reserve fleet to address unforeseen disruptions during vehicle loading at ports. Accordingly, a minimum of {2, 3, 4, 5} vehicles is designated in the instances to satisfy the parameter Y in Constraint (3). An increase in X generally reduces the total number of vehicles required to serve all customers. However, this reduction may lead to infeasibility, as a sufficient number of backup vehicles must still be available during ship unloading. Similarly, when Y is set to a high value for a given X, infeasibility may also arise. This occurs because larger Y values demand a greater number of customer nodes to justify the deployment of more vehicles, yet the problem instance may not contain enough customer nodes to satisfy this requirement. Furthermore, driver scheduling constraints boost the need for additional vehicles. Mandatory rest and break periods restrict vehicle availability, delaying their return to port and limiting their ability to serve as backups. The more rest break periods drivers have, the more vehicles are required to meet the requirements of the port and ship. To ensure both feasibility across all instances and consistency with the company’s real-world operational patterns, the value of X is fixed at two throughout the experiments.
It should be recognized that, within the CG framework, the RMP provides a valid lower bound for the formulated FTL problem. Consequently, once the RMP attains optimality, its objective value is referred to as z l b . Then, we try to find integer solutions using the columns/routes located in RMP, and an upper bound for our problem called z * is found to be benefiting from these solutions. In order to find the optimality gap, we calculate 100 z *   z l b z * accordingly.

5.2. Performance Results of the Proposed Algorithm

In this part, the algorithm’s efficiency is displayed over a dataset comprising 112 distinct instances. For each instance, the computational time and optimality gap have been recorded as performance metrics, and the corresponding analysis is presented in the subsequent part. The algorithms were implemented in Visual Studio (2020), and the RMP was solved using IBM ILOG CPLEX 12.9 (IBM, 2020) on a computer equipped with a 2.4 GHz Intel i7-13700 processor and 32 GB of RAM, running the Windows 11 operating system. Thus, in Table 8, detailed results for all instances are presented.

5.3. Discussion of Results

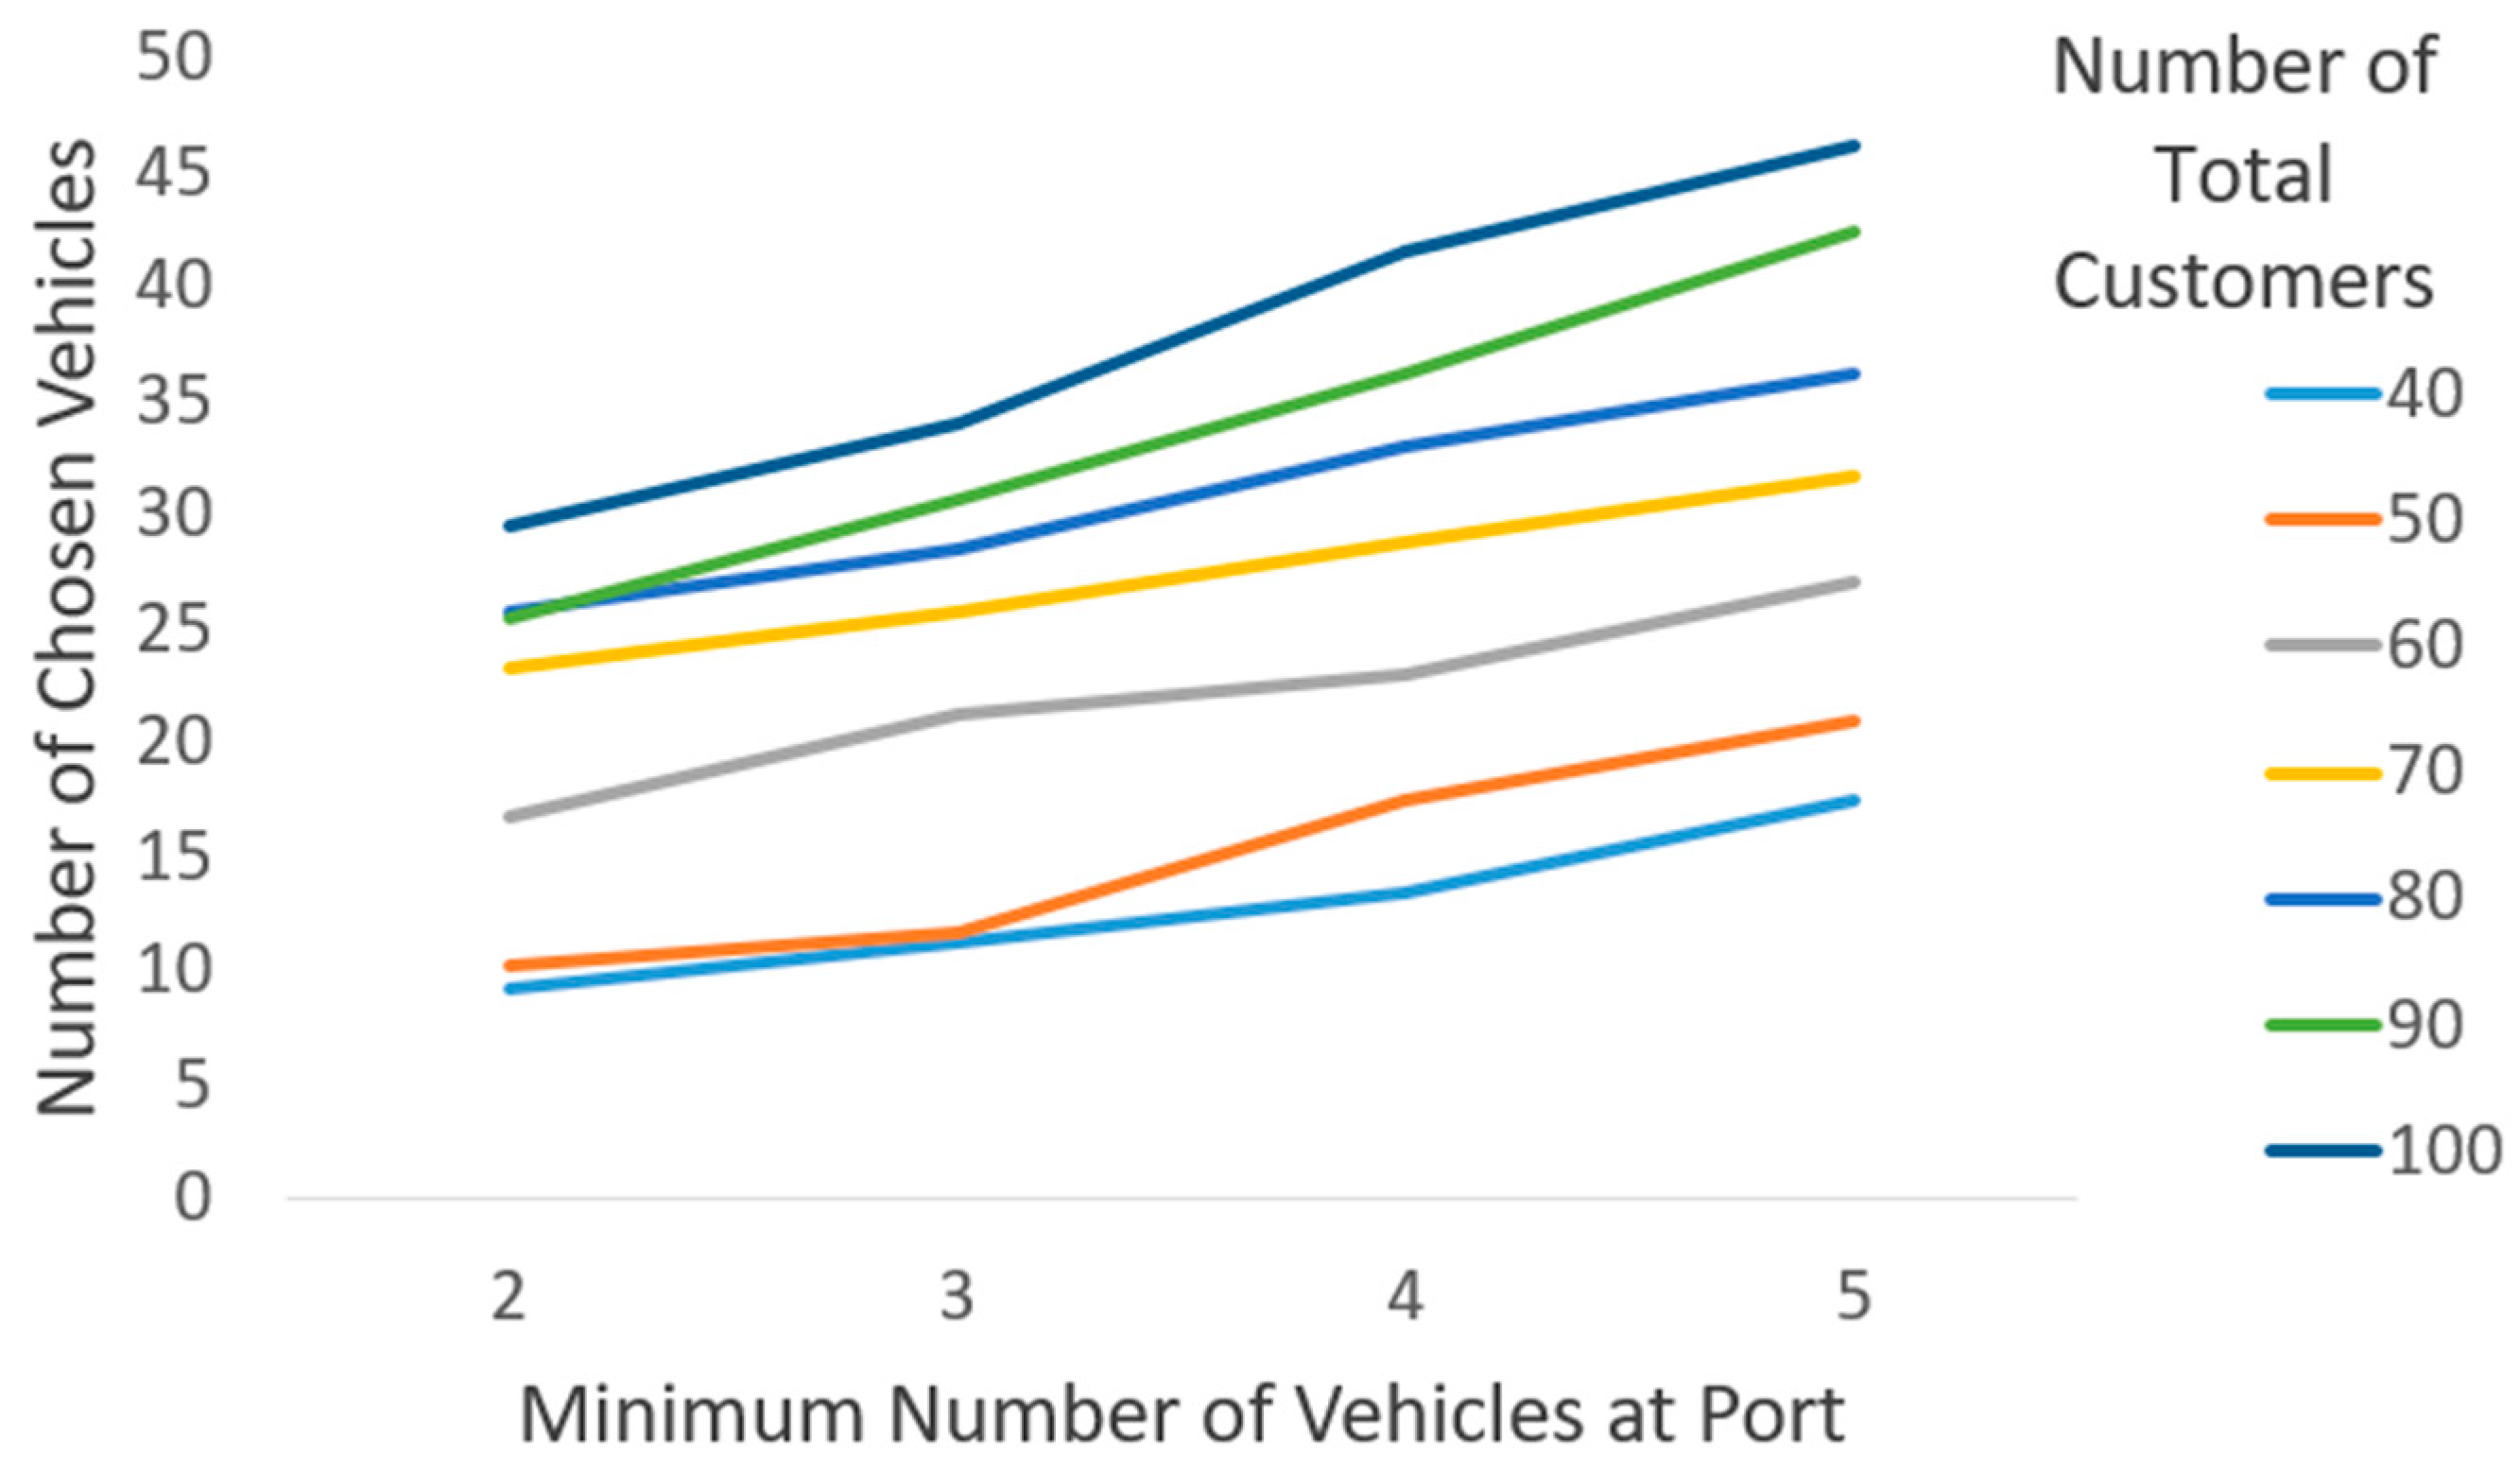
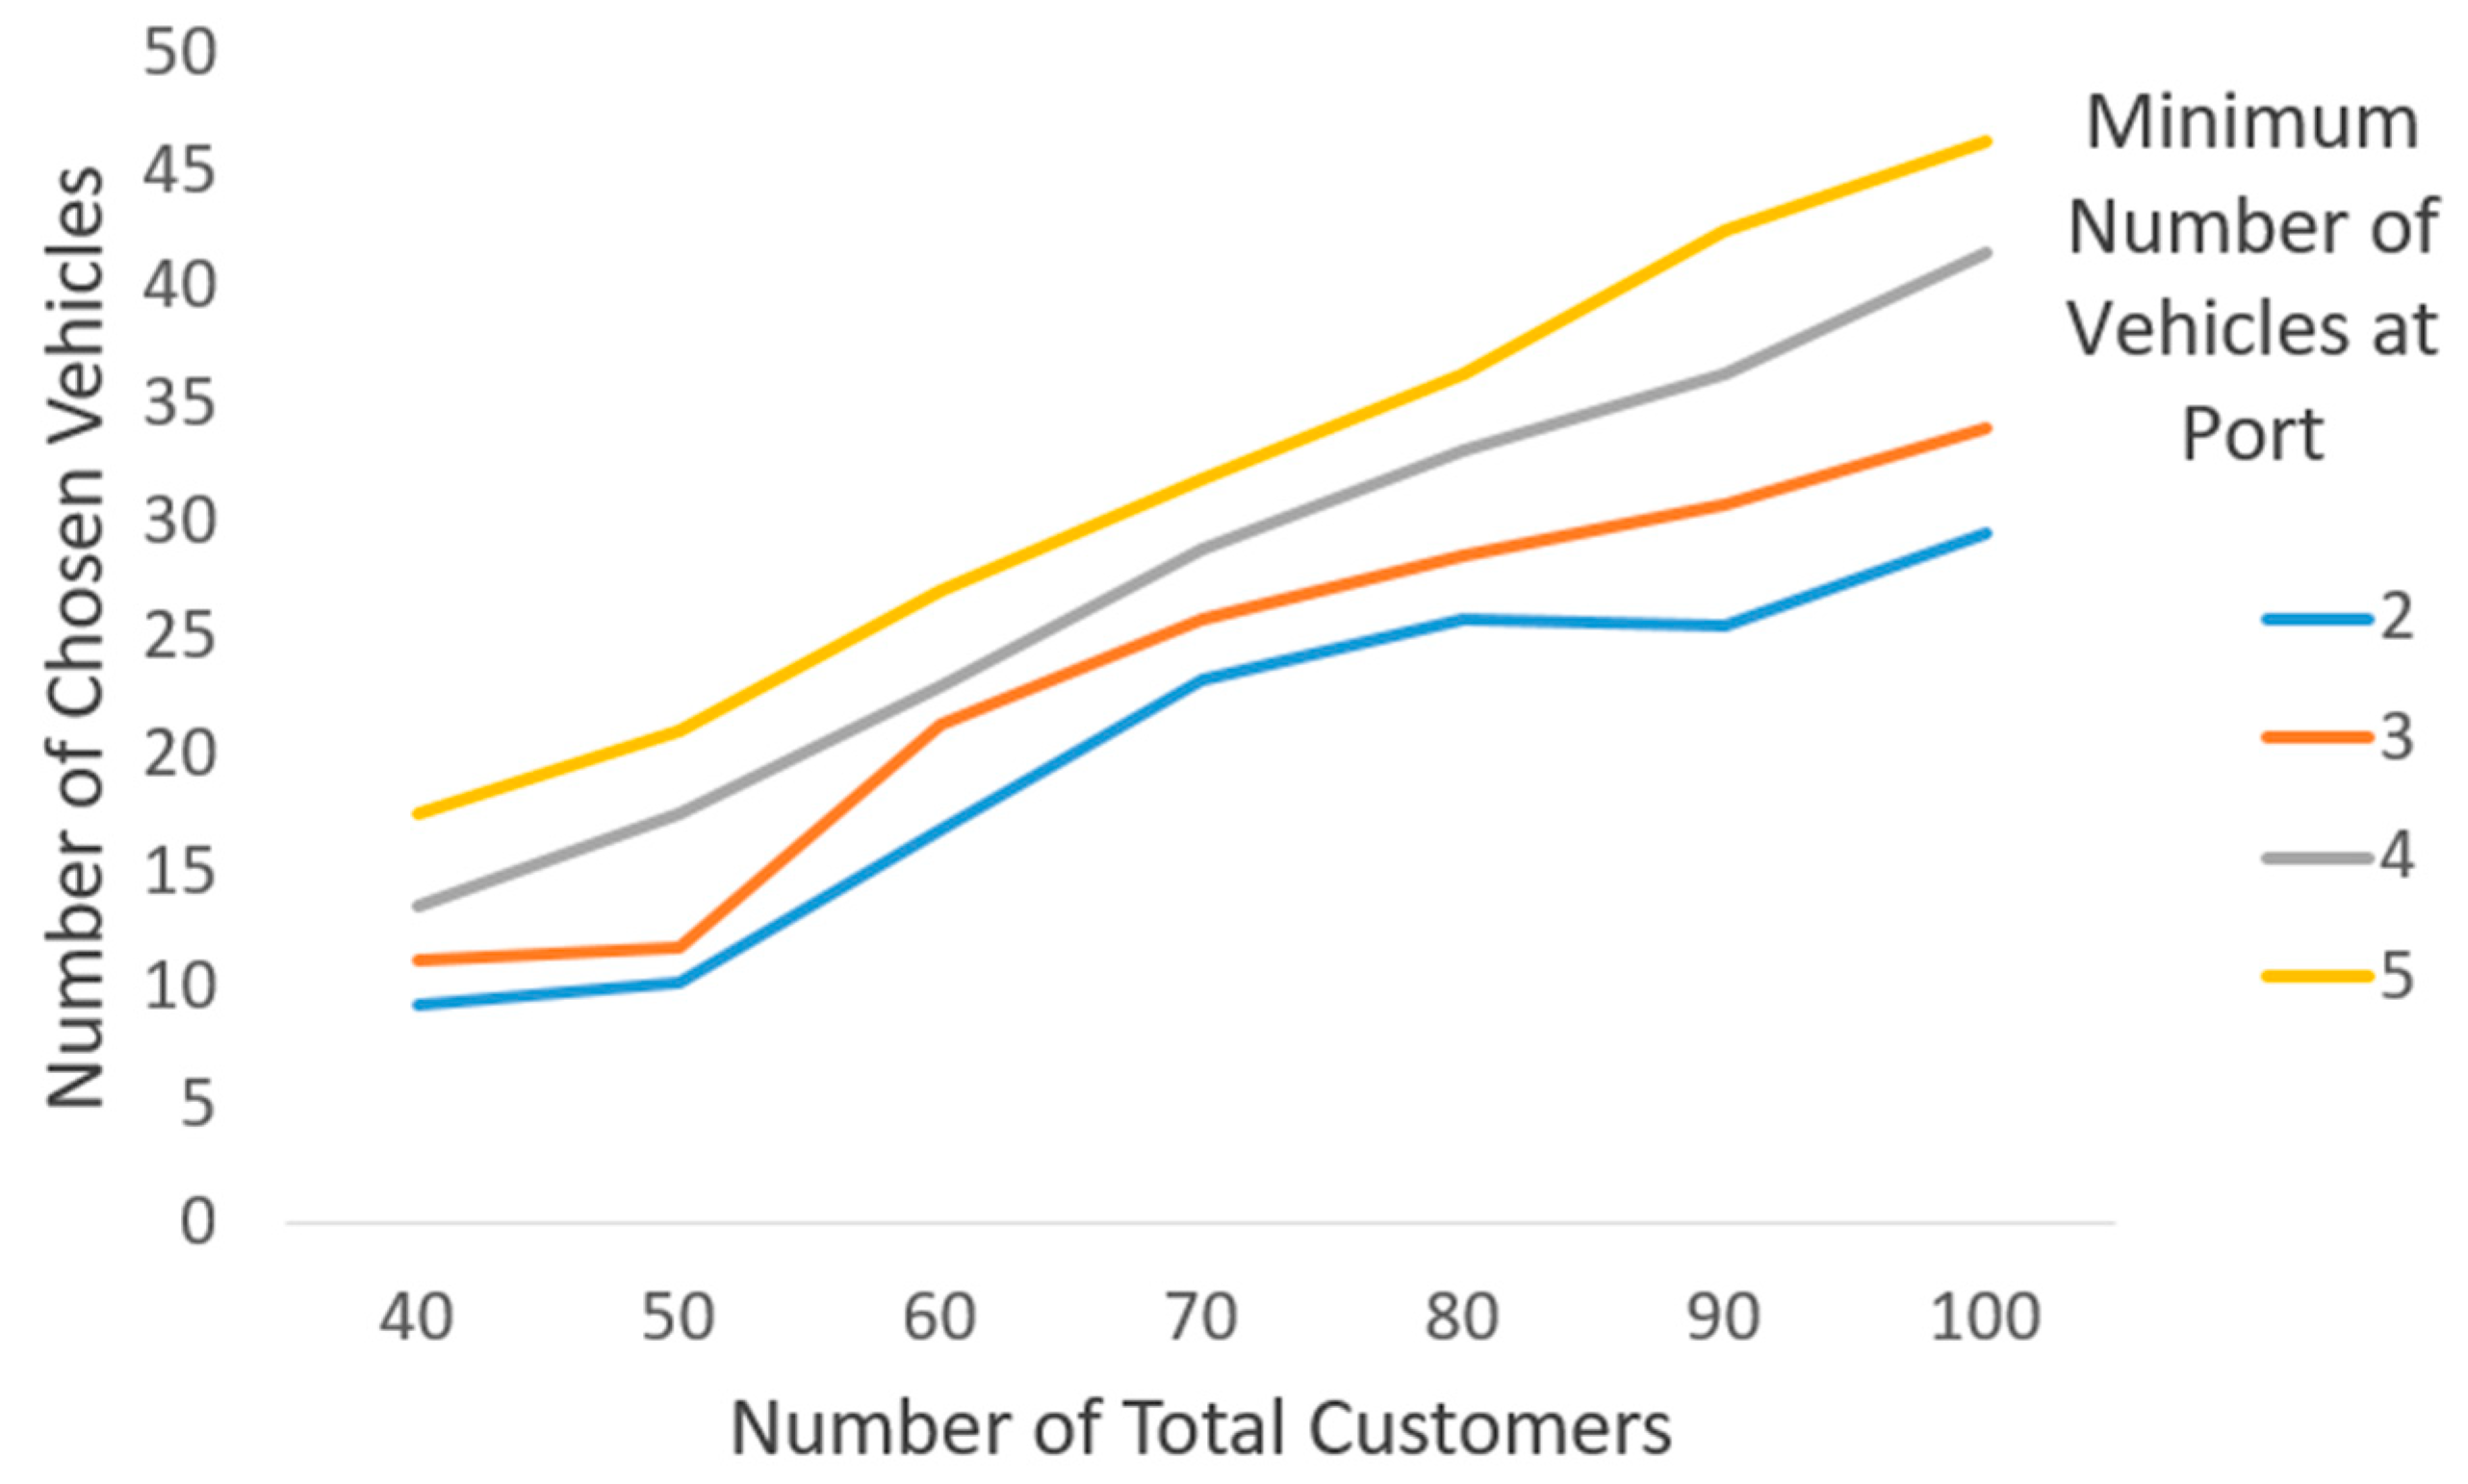
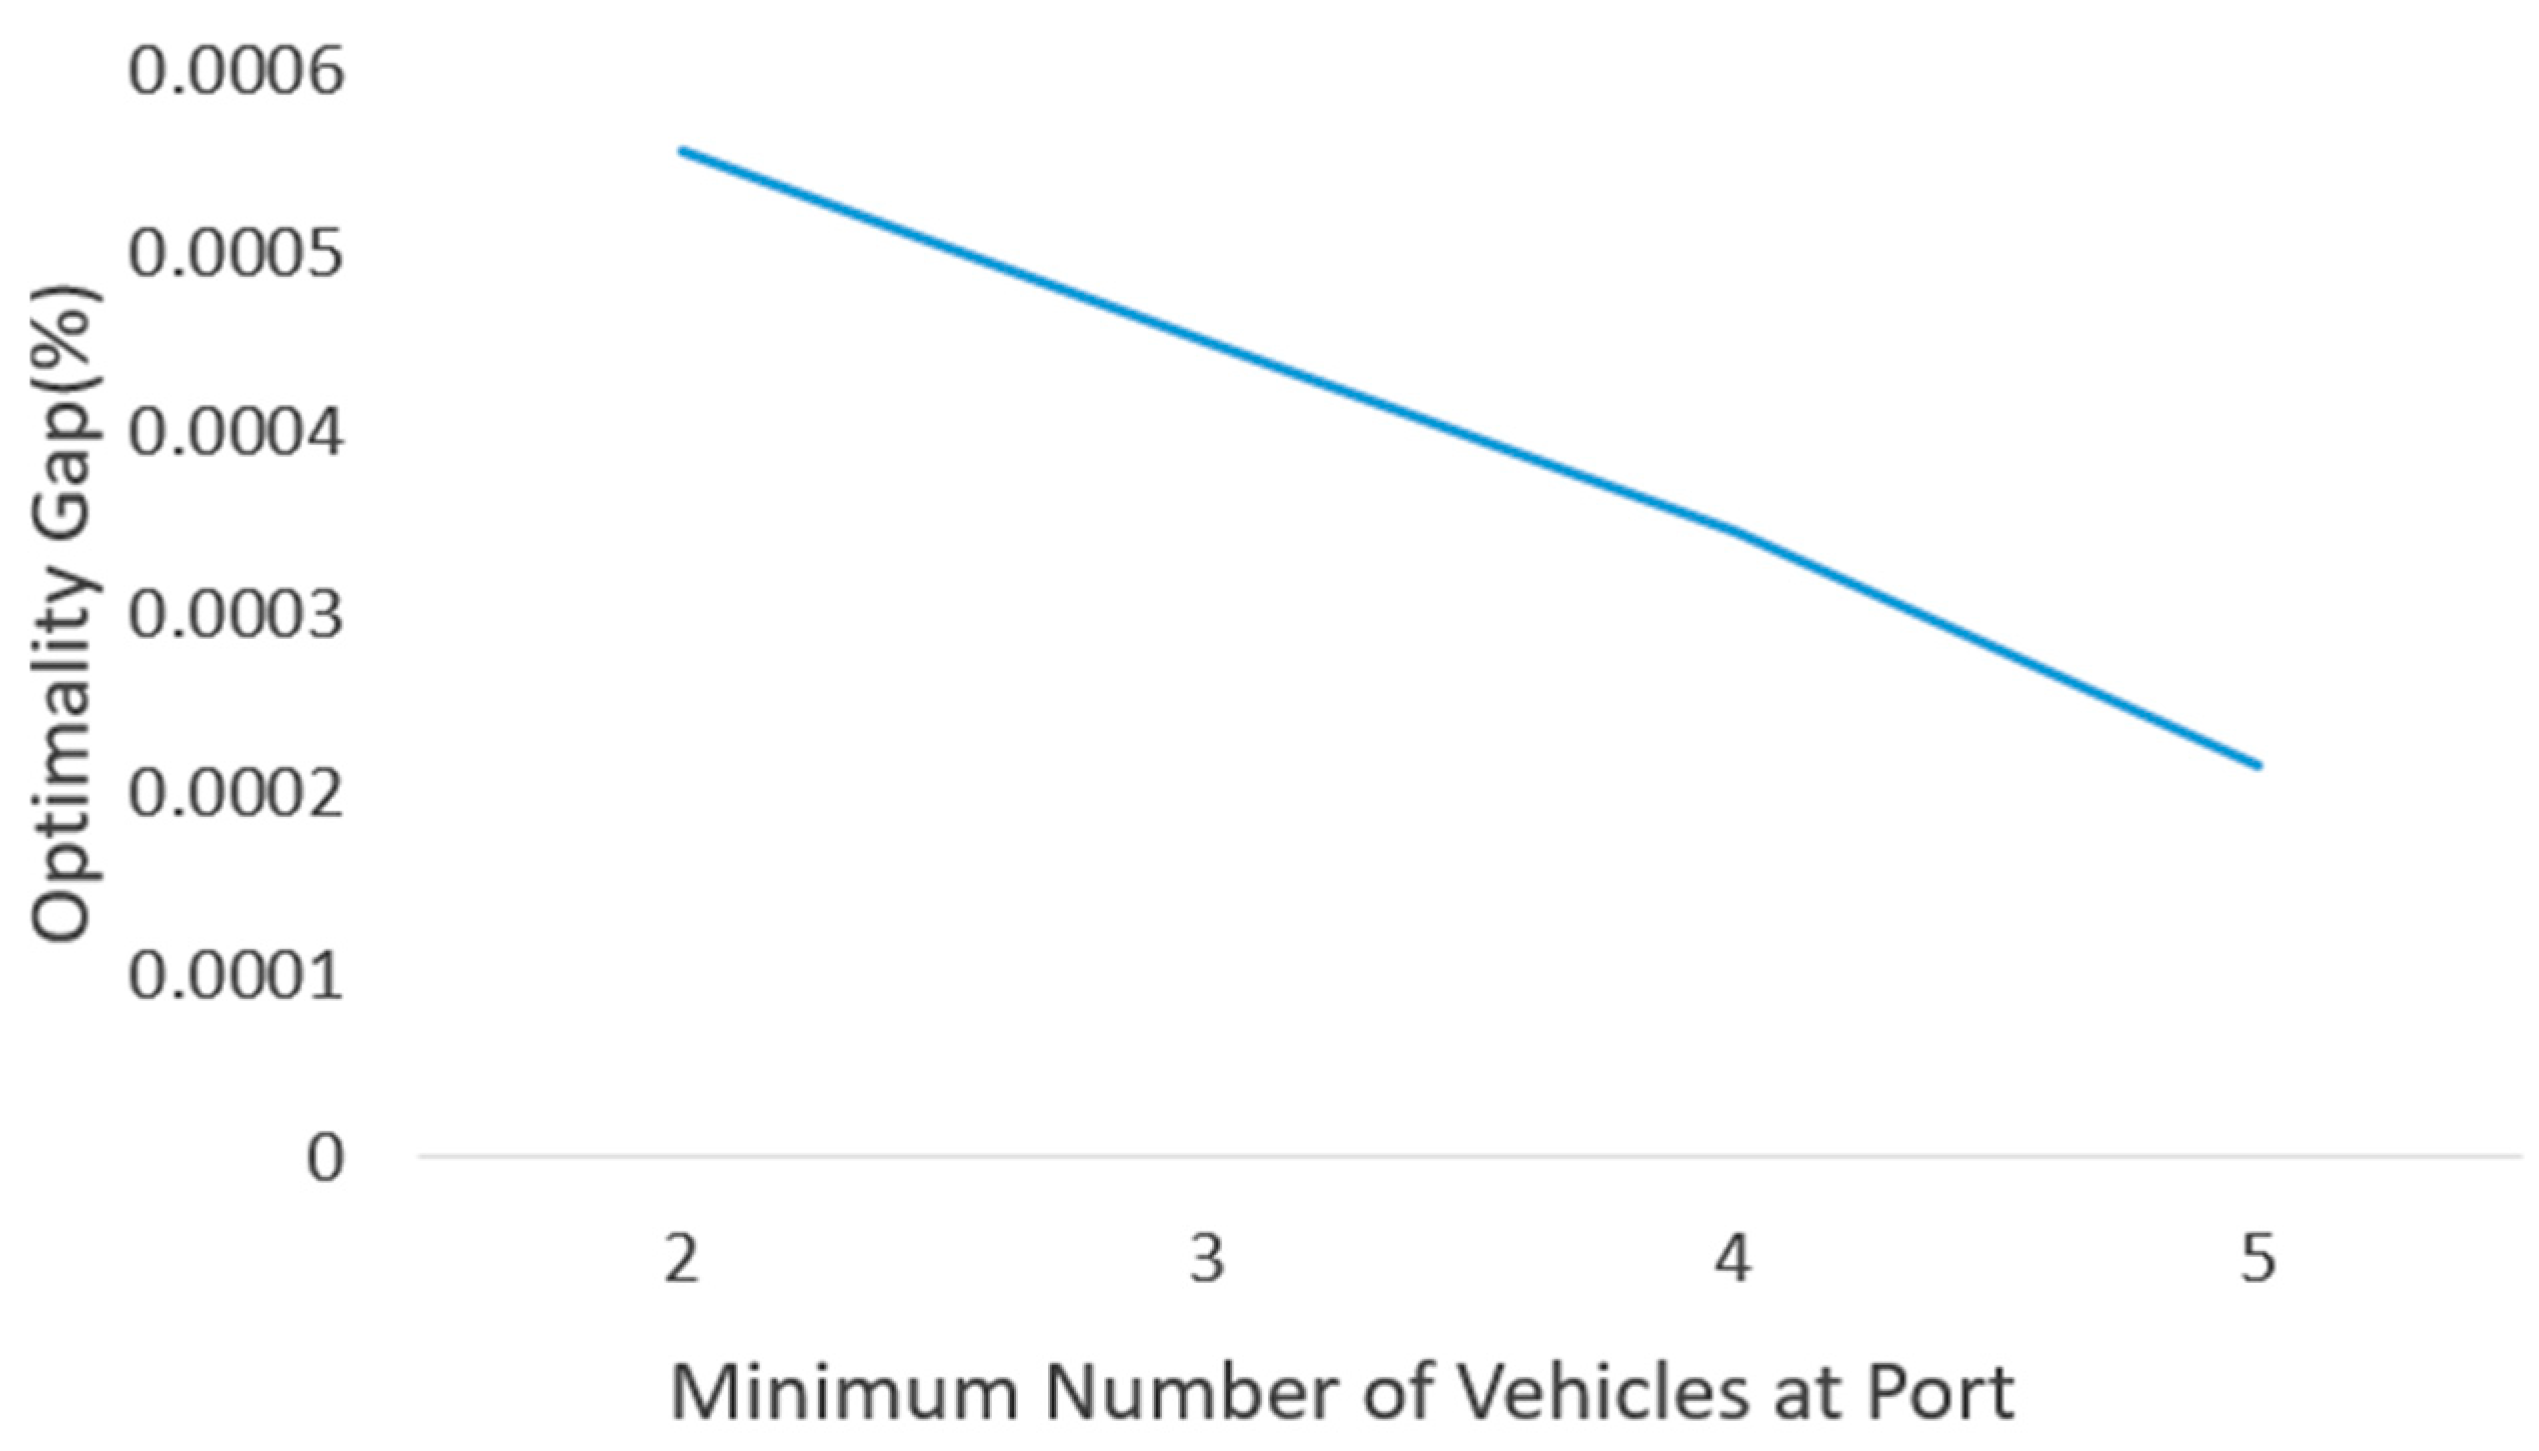
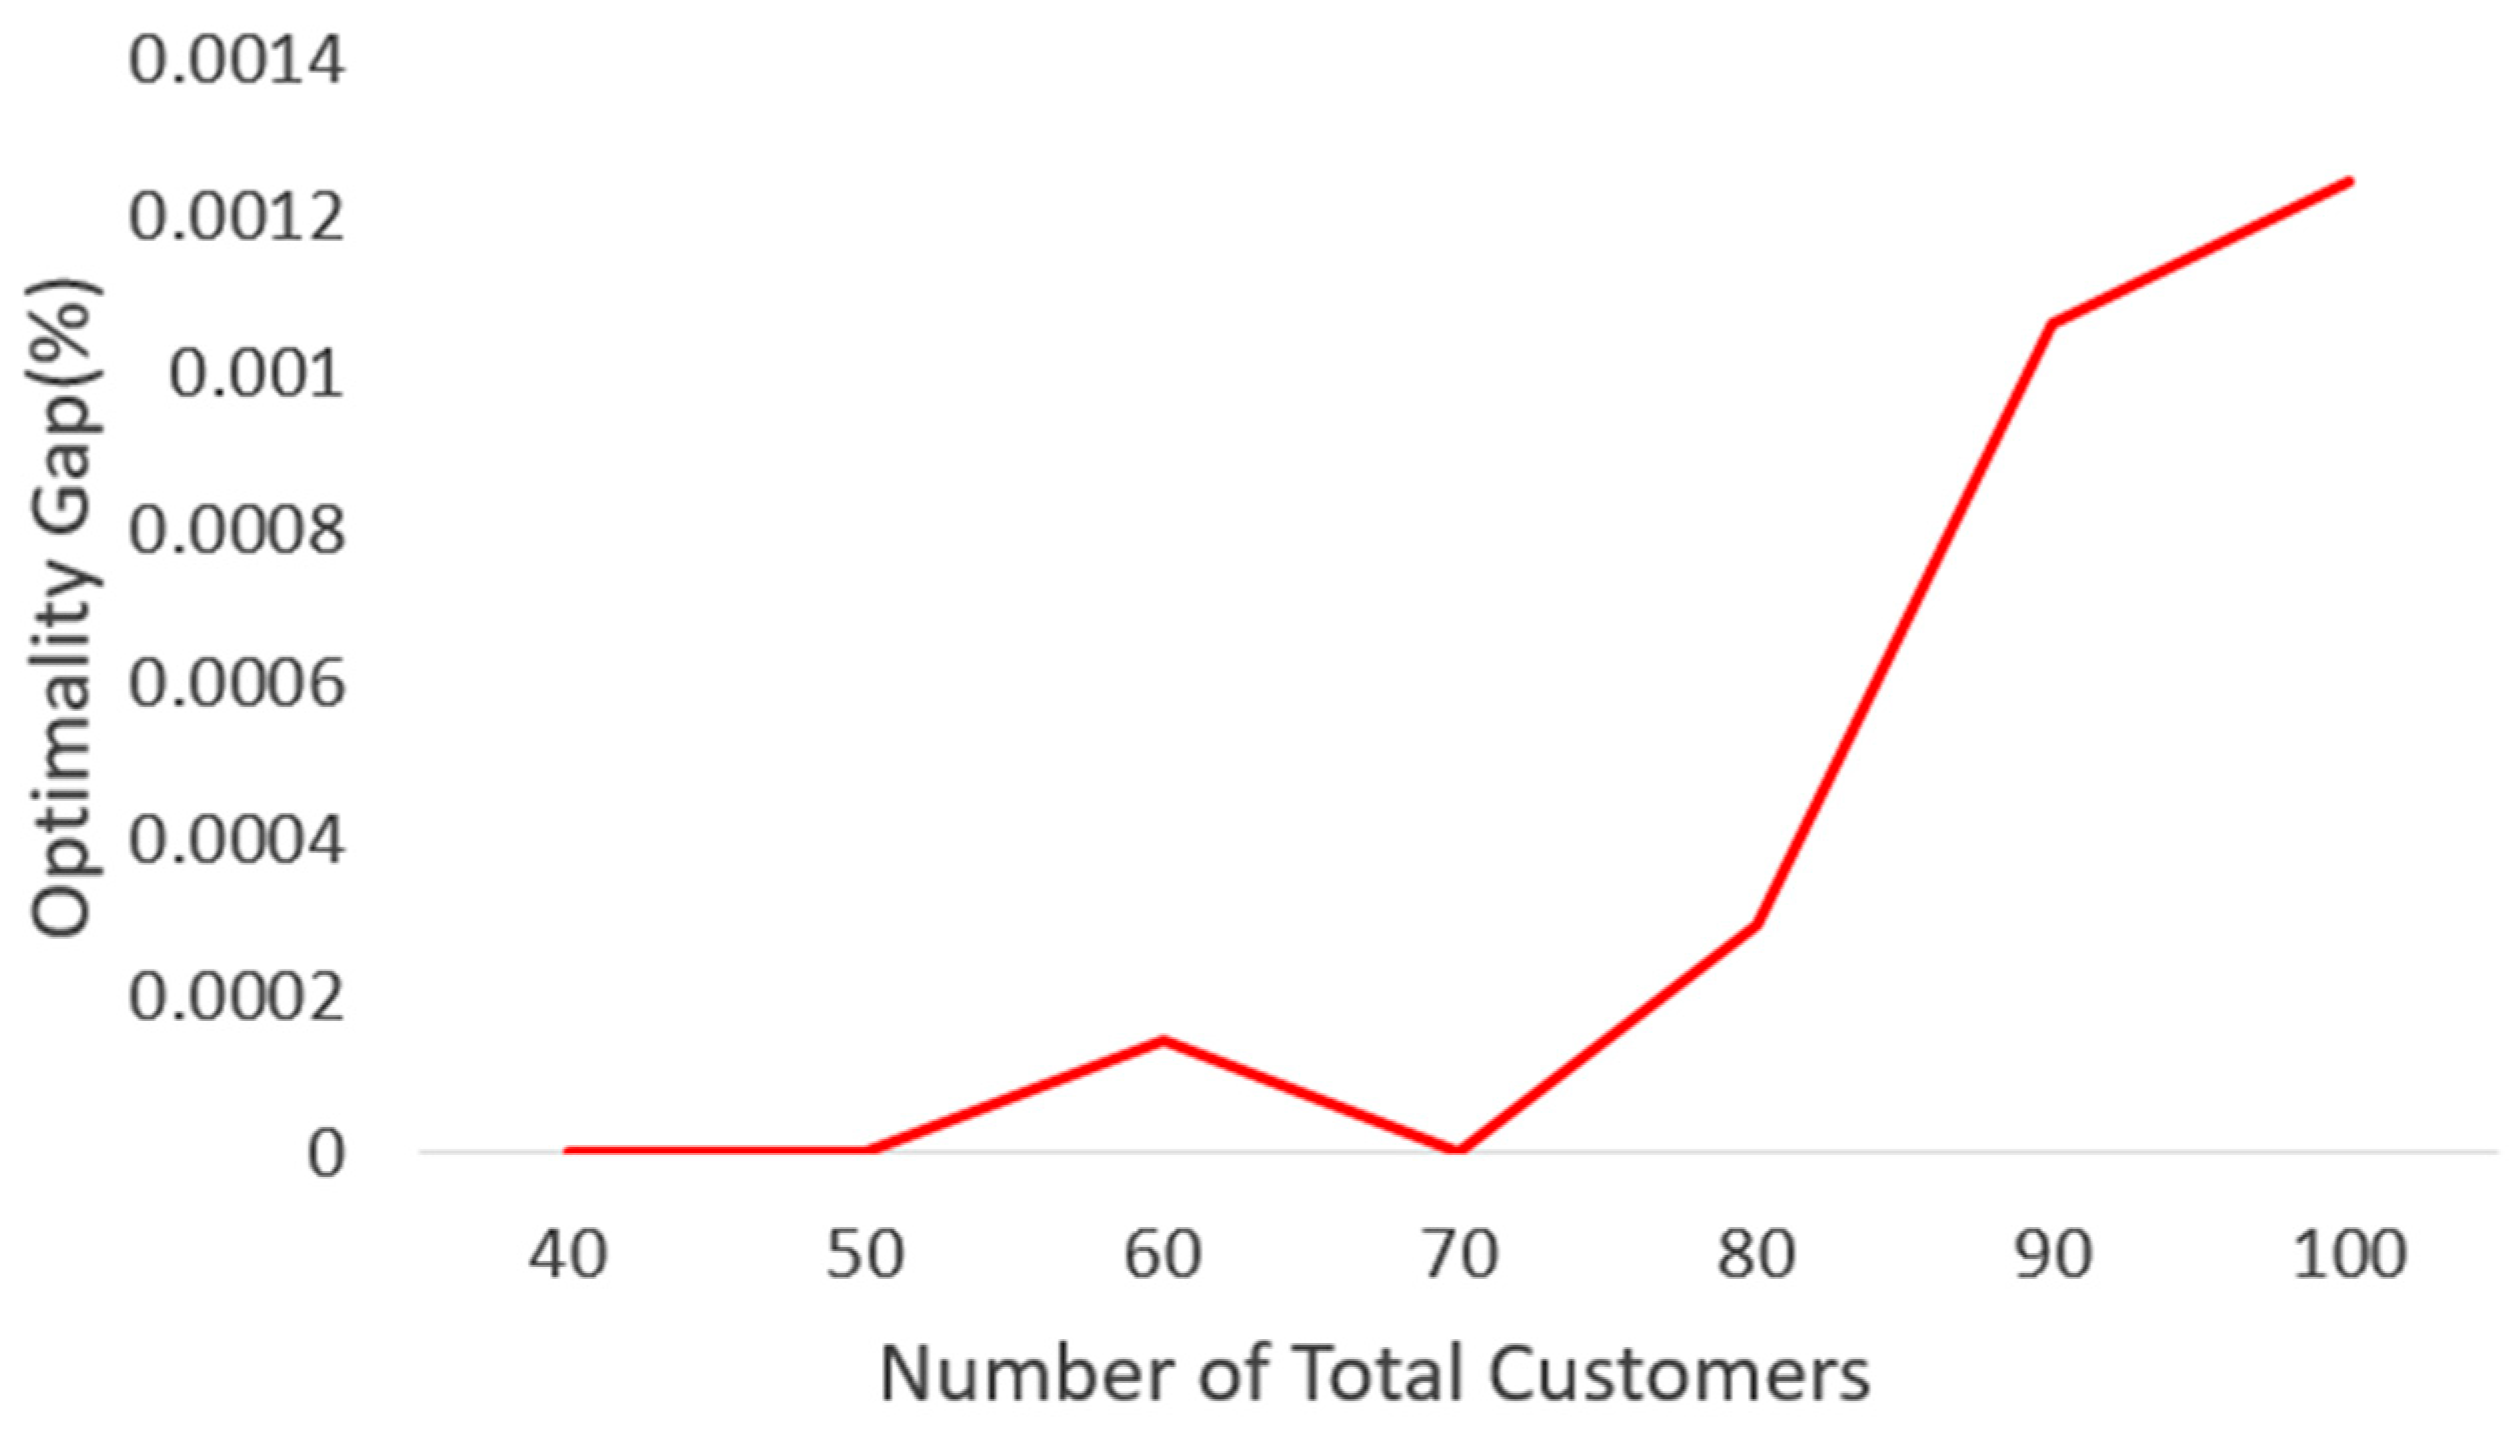
Within the VRP literature, it is widely observed that CG-based exact algorithms predominantly evaluate computational performance (CPU) with respect to a single factor, namely, the total number of customers. In contrast, the present study incorporates additional operational complexities, including multiple daily time windows, multiple supply nodes, and a minimum number of vehicle requirements at each supply node, each of which significantly influences the CPU times. Consequently, a multidimensional evaluation of computational performance is both reasonable and necessary. In this regard, Table 9, Table 10 and Table 11 present a two-dimensional analysis of the CPU times, total number of used vehicles, and optimality gap, respectively. For the FTL problem under consideration, collecting extensive data for every possible parameter combination would have been prohibitively time-consuming. Observations indicate that when the total number of customers reaches 90 or 100, convergence requires almost three hours. Therefore, a representative subset of 112 instances was selected for detailed investigation to derive meaningful insights into the problem.
The computational time may be analyzed with respect to two key factors: the total number of customers and the minimum number of vehicles required at the port during each loading operation. Furthermore, variations in the minimum number of vehicles stationed at the port often lead to substantial changes in the number of vehicles allocated to serve the ship, even when the total number of customer nodes remains constant. This observation justifies the adoption of a two-dimensional analytical framework for vehicle deployment, wherein the total number of customers and the minimum port vehicle requirement constitute the principal dimensions of evaluation.

5.3.1. Solution Time Analysis Based on the Number of Customer Nodes and Minimum Number of Vehicles at the Port

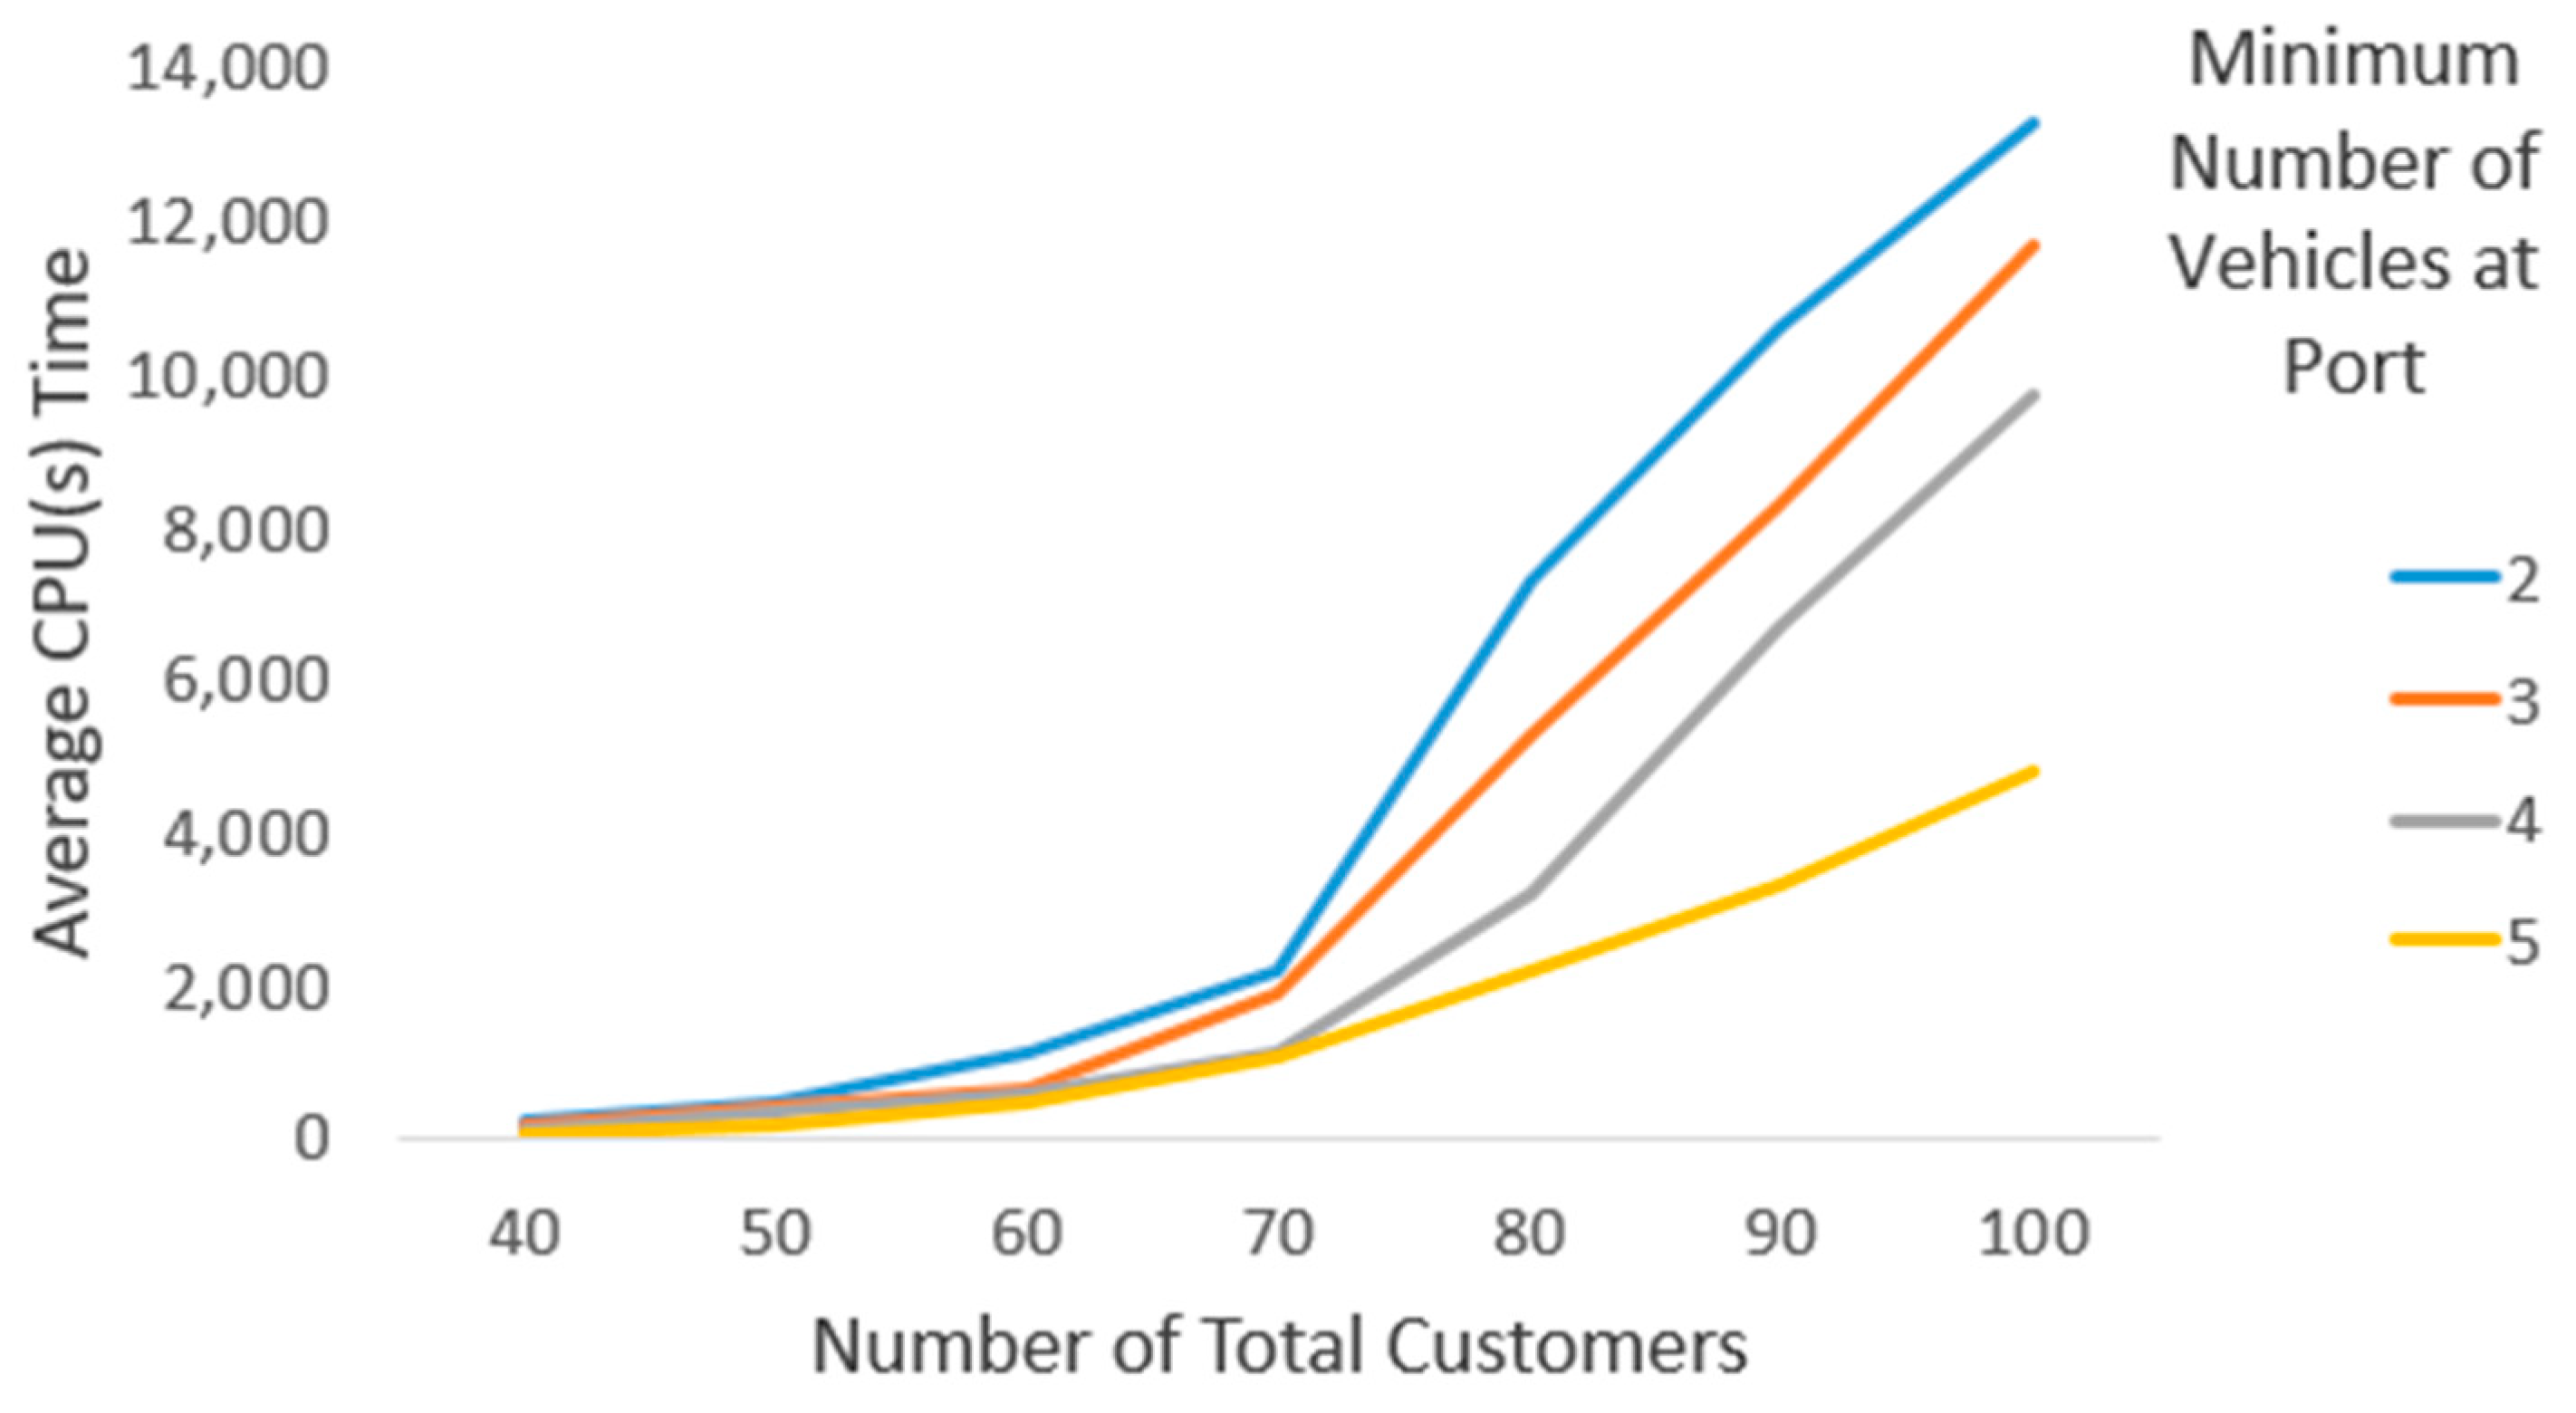
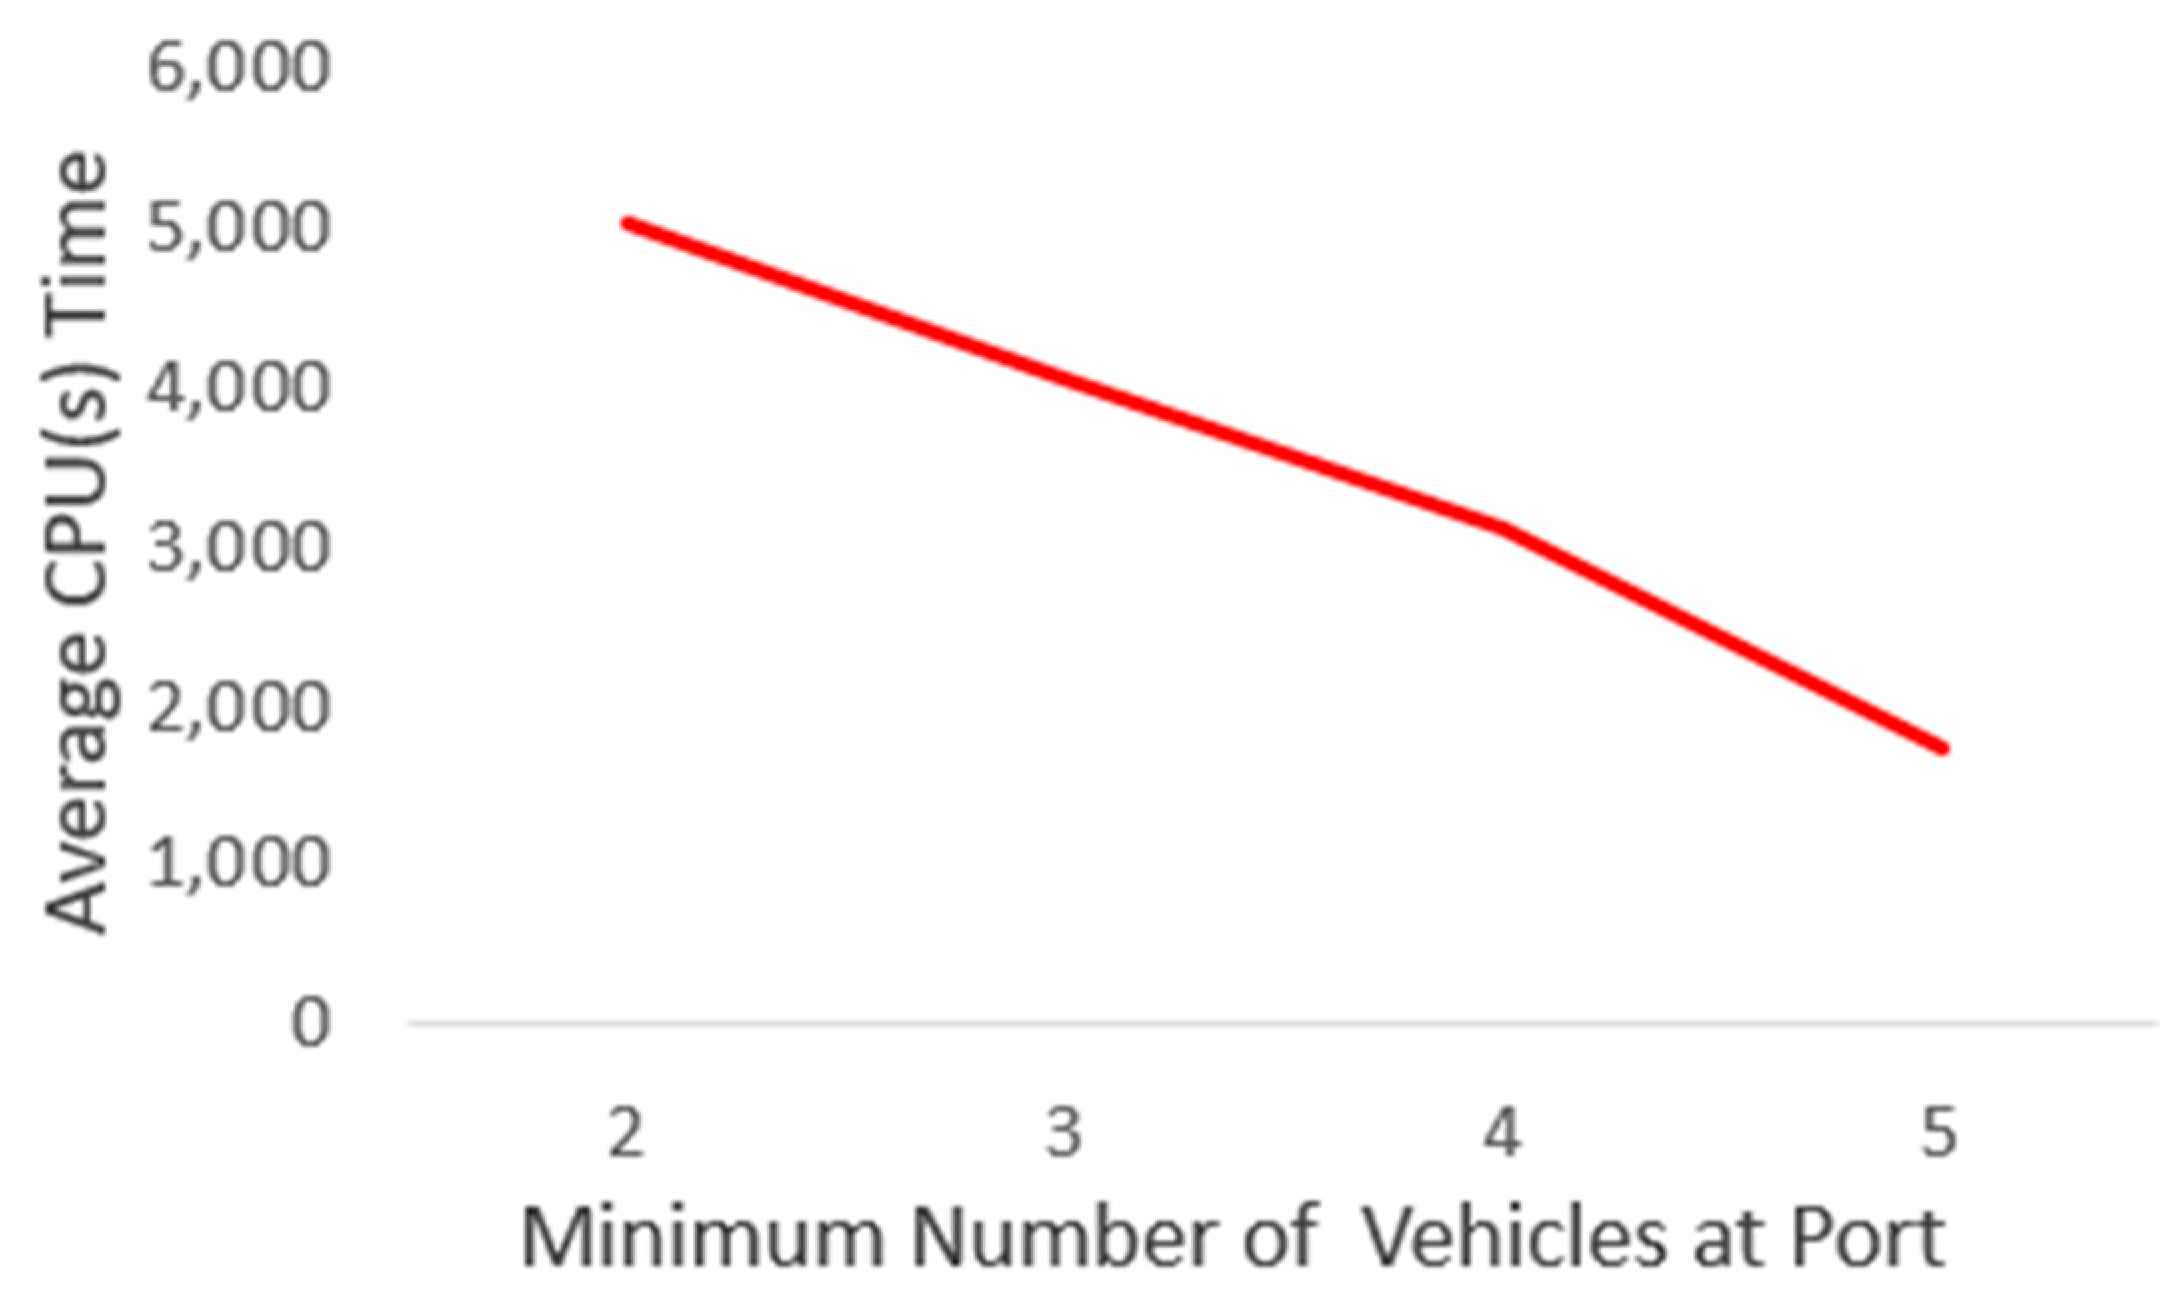
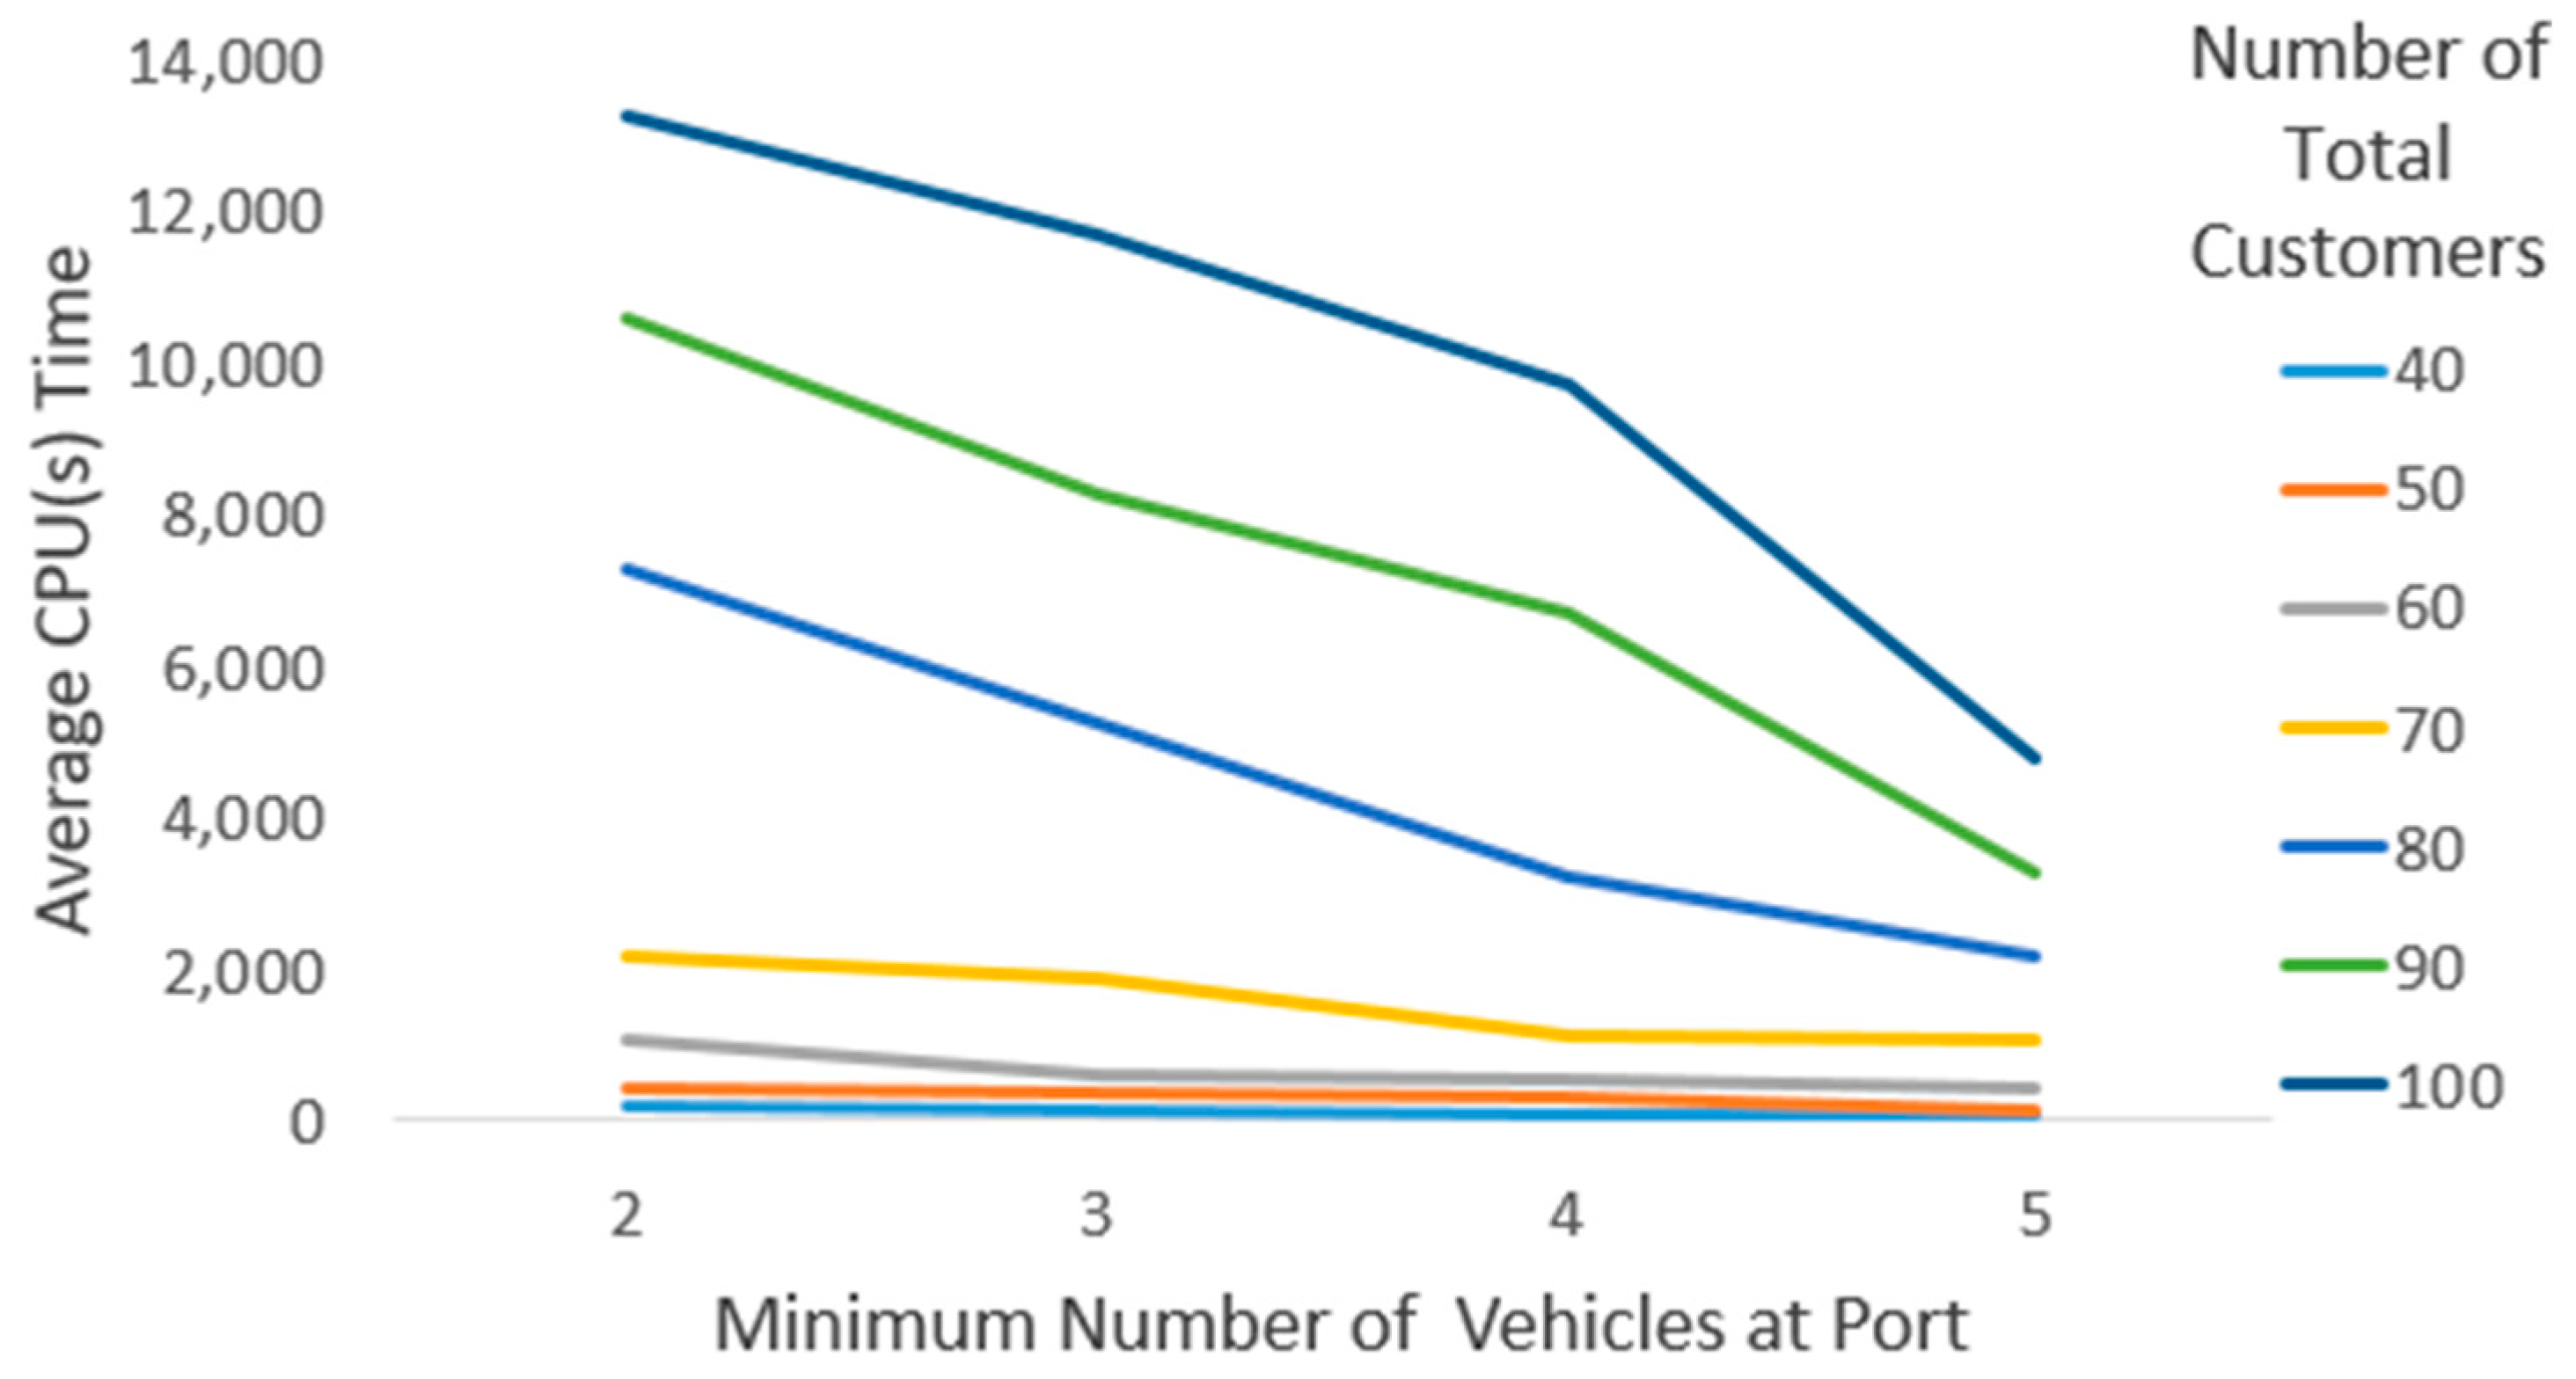
As indicated in Table 9, the generation of a large number of problem instances is tough, primarily due to the substantial computational time required when the customer count reaches high levels. While the computational times for individual instances with one hundred customers remain reasonable in the context of the existing literature, solving numerous such instances would entail a prohibitive overall runtime. A similar challenge arises for instances involving eighty or ninety customers. Nevertheless, Table 9 provides valuable insight into the relationship between the computational time, number of total customers, and the minimum number of vehicles stationed at the port. Figure 8 and Figure 9, derived from the CPU time data in Table 9, were constructed to facilitate a more detailed examination of these dynamics.
As illustrated in Figure 8, although the problem complexity exhibits an approximately linear growth within the ranges of 40–70 customers and 70–100 customers, the overall computational time follows a nonlinear trajectory. More precisely, the complexity pattern resembles a piecewise convex function. This behavior arises because an increase in the number of customer nodes leads to a disproportionately large expansion in the number of arcs, given that each node typically maintains multiple inbound and outbound connections. Consequently, the addition of even a single node can substantially amplify the problem’s complexity. Moreover, the rate of complexity growth resulting from an incremental increase in nodes is comparatively lower when the network size is small, whereas the same increment leads to a markedly higher complexity escalation in larger networks. Since the complexity of path generation algorithms is jointly determined by both the number of nodes and arcs, and given that the efficiency of the column generation approach in VRP(s) is directly contingent on the speed of path generation, the overall computational burden of the proposed algorithm is highly sensitive to the number of nodes.
Based on Figure 9, when the minimum number of vehicles at the port is fixed, the computational time exhibits a trend broadly consistent with that in Figure 8. Nonetheless, the curves in Figure 9 display a notable vertical displacement and progressively diverge as the total number of customer nodes increases. This divergence stems from the fact that scenarios with a smaller minimum number of vehicles at the port lead to a more rapid escalation in complexity compared to scenarios with a larger minimum number, as shown in Figure 10. A reduced minimum vehicle requirement expands the feasible solution space of the column generation model (1)–(8), thereby increasing the number of potential route combinations and making optimal path determination considerably more challenging. Furthermore, Figure 11 illustrates that when the total number of customers is relatively small, the computational time for scenarios with fewer minimum vehicles may closely approximate that for scenarios with more. In such cases, computational time is not a critical factor. However, as the number of customer nodes increases, the difference in computational time becomes increasingly pronounced. It is also noteworthy that the plots in Figure 11 exhibit an almost entirely linear form, indicating a near-linear variation in computational time, with changes in the minimum number of vehicles at the port for a fixed number of customer nodes. The slope of these lines, however, changes significantly with variations in the total number of customer nodes.
A more detailed examination of computational time reveals notable patterns when the total number of customers increases from 40 to 100:
  • With a minimum of two vehicles at the port, the computational time escalates sharply, exhibiting an approximately 6700% increase;
  • For a minimum of three vehicles, the increase reaches roughly 7900%;
  • With four vehicles, the computational time surges by approximately 11,400%;
  • For five vehicles, the rise amounts to around 8800%.
Similarly, when the minimum number of vehicles at the port decreases from five to two, substantial variations in computational time are observed across different customer volumes:
  • With 40 customers, the increase is approximately 366%;
  • With 50 customers, it is about 292%;
  • With 60 customers, computational time grows by roughly 235%;
  • With 70 customers, the increase is about 207%;
  • With 80 customers, the rise reaches approximately 339%;
  • With 90 customers, it is around 322%;
  • With 100 customers, the computational time is roughly 3.22 times greater.

5.3.2. Number of Used Vehicles Analysis Based on the Number of Customer Nodes and Minimum Number of Vehicles at the Port

Table 10 provides a detailed overview of the number of vehicles utilized across the various instances. It is generally understood that the total number of used vehicles does not exceed half the total number of customers. This limitation stems from the fact that, under Constraint (7) with X = 2, each vehicle is expected to serve at least two customers, theoretically making a vehicle count equal to half the adequate number of customers. Nevertheless, this assumption does not always hold true in practice. Despite X being set to two, certain vehicles may serve three or four customers, which can lead to infeasibility if the number of used vehicles becomes half the number of customers. Similar to the insights drawn from Table 9, Table 10 offers valuable information on how the number of vehicles deployed varies with fluctuations in both the total customer count and the minimum vehicle requirement at the port. Figure 12 and Figure 13, derived from the data in Table 10, facilitate a more comprehensive analysis of these dynamics.
Figure 12 demonstrates that when the total number of customers is held constant, the relationship between the minimum number of vehicles stationed at the port and the number of vehicles selected exhibits an almost linear pattern. These linear trends are distinctly displaced from one another, and their slopes vary. Furthermore, as the number of customers increases, these slopes tend to be steeper, indicating the sensitivity of vehicle selection to changes in the minimum port vehicle requirement. Figure 13 illustrates this phenomenon more explicitly. In Figure 13, for a fixed minimum number of vehicles at the port, the number of vehicles selected increases in an approximately linear fashion as the total customer count rises. This linearity is especially pronounced when the minimum vehicle requirement is set at four or five. Moreover, the disparity in vehicle usage between scenarios with minimum thresholds of two and five vehicles expands progressively with the growth in customer numbers, suggesting that this gap could become considerable when the total number of customers reaches high levels.
A more granular examination of the variations in the number of selected vehicles is presented below, focusing on the increase in the total number of customers from 40 to 100 under different minimum vehicle constraints at the port.
  • When the minimum number of vehicles at the port is set to two, the number of selected vehicles rises by approximately 318%;
  • With a minimum requirement of three vehicles, the increase amounts to 302%.
  • For a minimum of four vehicles, the number of selected vehicles grows by 307%.
  • When the minimum requirement is five vehicles, the observed increase is 264%.
The subsequent analysis provides a detailed assessment of how the number of selected vehicles evolves when the minimum vehicle requirement at the port is progressively increased from two to five, under different total customer demand levels.
  • For 40 customers, the number of selected vehicles increases by approximately 189%;
  • For 50 customers, the growth is around 204%;
  • For 60 customers, the increase is 161%;
  • For 70 customers, the growth is 136%;
  • For 80 customers, the number of vehicles rises by 141%;
  • For 90 customers, the growth is approximately 166%;
  • For 100 customers, the increase reaches a factor of 1.56.

5.3.3. Optimality Gap Analysis Based on the Number of Customer Nodes and Minimum Number of Vehicles at the Port

CG algorithms are particularly effective at producing solutions with minimal optimality gaps, especially for partitioning problems such as the VRP. This characteristic largely explains the small gaps observed in the present study. However, a two-dimensional analysis of the optimality gap, considering both the number of total customers and the minimum number of vehicles at the port, reveals nuanced differences across small, medium, and large instance sets. Table 11 reports the average, minimum, and maximum gaps obtained during the computational experiments. For small instances, the optimality gap is consistently zero, indicating that even the lower bound provides a feasible integer solution for the CG model (1)–(8). In medium-sized instances, non-zero gaps begin to emerge, although they remain relatively minor. In contrast, large instances exhibit almost no cases with a zero gap. While the gaps in this set are still small in absolute terms, their relative variation is substantial. For example, when the total number of customers is 100, the gap increases by a factor of 3.24 as the minimum number of vehicles at the port decreases from five to two. Similarly, with a total of 90 customers, the gap grows nearly seventeen-fold under the same reduction in the minimum vehicle constraint. To illustrate these patterns more clearly, Figure 14 and Figure 15 provide a detailed visual analysis.
Figure 14 presents a unidimensional analysis of the optimality gaps observed in the experiments. A pronounced downward trend is evident as the minimum number of vehicles at the port increases. This behavior can be attributed to the substantial contraction of the solution space in the specified FTL problem when the minimum vehicle requirement is raised. A reduced solution space enhances the likelihood of attaining the optimal solution within the allotted computational time, thereby diminishing the potential optimality gaps encountered during the iterative process.
Figure 15 presents the optimality gaps as a function of the total number of customers. The results indicate a clear upward trend in the gap as the customer volume increases. This pattern arises from the substantial expansion of the feasible solution space associated with larger customer sets, which in turn increases the complexity of identifying the optimal solution, thereby leading to higher optimality gaps.
The synthesis of the results in Table 11 and Figure 14 and Figure 15 suggests that scenarios characterized by a low minimum number of vehicles at the port combined with a high total customer count are likely to exhibit markedly larger optimality gaps. Inevitably, such conditions also entail increased computational times, as corroborated by the patterns observed in Table 9 and Figure 9, Figure 10 and Figure 11.
As shown in the discussion, the proposed approach achieves very low optimality gaps within reasonable computational times. Since the VRP is a partitioning problem and column generation algorithms are highly effective for such problems due to their pseudo-polynomial time complexity, the literature has increasingly focused on branch-price-and-cut algorithms and their acceleration techniques as exact solution methods. Because this study also addresses a VRP variant, the application of column generation similarly enables the attainment of low optimality gaps within moderate computational times. Indeed, the literature consistently reports that column generation-based algorithms outperform mixed-integer programming models, branch and cut algorithms, and branch and bound algorithms across many VRP variants. For example, He et al. [26] achieved low optimality gaps within reasonable times in the context of customized bus routing, while Joo et al. [27] and Wu et al. [38] reported similar results for truck–drone routing and capacitated single-allocation hub location routing problems, respectively.

6. Conclusions

This study addresses the integration of prolonged liquid-based ship unloading operations with a VRP framework that incorporates truck driver scheduling in compliance with United States regulatory standards. The proposed methodology enables logistics companies to determine cost-optimal routing strategies for their heterogeneous fleets while adhering to the stringent operational constraints imposed by both port authorities and driver regulations. By doing so, the approach not only minimizes the total transportation costs, but also ensures operational safety through adherence to driver scheduling requirements and maintenance of the mandated minimum number of standby vehicles, as stipulated by port regulations. Thus, the excessive allocation of vehicles to ship unloading operations, unnecessary prolongation of driver rest and break periods, and violations of port regulations can be effectively prevented, eliminating practitioners’ concerns with regard to the specified FTL problem. It should also be noted that whenever a ship remains at the port beyond its scheduled time, substantial costs are incurred by the port authority, which constitutes a major concern from the managerial perspective of practitioners. However, the proposed algorithm guarantees ship unloading without any extension of the vessel’s stay at the port. Practitioners in logistics firms can utilize the algorithm to yield precise solutions when complete information regarding the ship, vehicles, and customers is available. Specifically, given the data on ship berthing duration, vehicle-type-specific costs and travel times, fleet composition, the time windows of vehicle unloading zones, minimum vehicle requirements at the port, minimum customer service obligations per vehicle, and driver rest–break–drive constraints, the system can determine the most cost effective transport plan, optimal routing, and associated rest–break–drive schedules for the assigned fleet. Undoubtedly, this algorithm is applicable to any logistics company engaged in liquid-based transportation involving port operations.
The performance analysis indicates that computationally manageable runtimes can yield minimal optimality gaps, below 1%, even in large-scale instances where the logistics company serves as the study’s case context. Notably, in scenarios involving up to 100 customers, with a minimum of five vehicles stationed at the port and at least two customer nodes assigned to each vehicle, optimal solutions can be achieved within approximately three hours of computation. Nevertheless, scenarios characterized by an increasing total customer base coupled with a reduction in the mandated minimum number of vehicles stationed at the port tend to exhibit elevated computational times and larger optimality gaps.
A key limitation of this study is the absence of benchmark datasets for the specified FTL problem, as benchmark sets do not exist for every VRP variant. To address this, artificial instances whose design was grounded in the operational practices of a major local logistics company were generated. Another limitation concerns the regulatory scope: the proposed algorithm is aligned with United States driver regulations and therefore does not yield feasible routes under European Union regulations. Furthermore, since the study is primarily oriented towards large-scale instances, conducting extensive and reliable sensitivity analysis would require substantial computational time.
This study also presents several key pseudo code structures related to the overall algorithmic flow. However, for reproducibility, it should be noted that the pseudo codes provide general frameworks, and that the specific implementation details may vary substantially due to the significant differences among VRP variants.
Future research directions may encompass the exploration of more advanced network architectures, a wider array of vehicle categories in FTL operations, and additional driver factors. In the logistics sector, drivers may differ in terms of their capabilities and salaries; therefore, the assignment of drivers to vehicles can have significant implications for the company, complicating its optimal decision mechanism. The anticipated shift toward hybrid and electric vehicle fleets will necessitate the seamless integration of these emerging technologies, with regulatory frameworks governing driver scheduling. Port operations, when coupled with driver-related constraints, are expected to introduce considerable analytical and computational complexity. This complexity becomes even more pronounced in multiple-ship scenarios, where vessels may have differing berthing durations and multiple compartments, each potentially carrying distinct product types. Such configurations demand diverse trailer types, and the inclusion of trailer-swapping or trailer-washing requirements further amplifies the difficulty of inland truck routing. Moreover, the inherent uncertainties associated with operational workflows and travel times highlight the pressing need for stochastic and dynamic optimization approaches. Consequently, future investigations should devote particular attention to the evolving interplay between network design, vehicle technology, and operational strategies in FTL logistics.

Author Contributions

Conceptualization, Methodology, Formal Analysis, Writing—original draft, Writing—review and editing, T.E. and R.E.; Software, Validation, T.E.; Supervision, R.E. All authors have read and agreed to the published version of the manuscript.

Funding

This research received no funding.

Data Availability Statement

The original contributions presented in this study are included in the article. Further inquiries can be directed to the corresponding author.

Conflicts of Interest

The authors declare no conflicts of interest.

References

  1. Konstantakopoulos, G.D.; Gayialis, S.P.; Kechagias, E.P. Vehicle routing problem and related algorithms for logistics distribution: A literature review and classification. Oper. Res. 2022, 22, 2033–2062. [Google Scholar] [CrossRef]
  2. Kennedy, J.; Russell, E. Particle swarm optimization. In Proceedings of the ICNN’95-International Conference on Neural Networks, Perth, WA, Australia, 27 November–1 December 1995; IEEE: Piscataway, NJ, USA; Volume 4. [Google Scholar]
  3. Ropke, S.; Pisinger, D. An adaptive large neighborhood search heuristic for the pickup and delivery problem with time windows. Transp. Sci. 2006, 40, 455–472. [Google Scholar] [CrossRef]
  4. Glover, F. Future paths for integer programming and links to artificial intelligence. Comput. Oper. Res. 1986, 13, 533–549. [Google Scholar] [CrossRef]
  5. Moscato, P. On evolution, search, optimization, genetic algorithms and martial arts: Towards memetic algorithms. Caltech Concurr. Comput. Program C3P Rep. 1989, 826, 37. [Google Scholar]
  6. Holland, J.H. Adaptation in Natural and Artificial Systems, 1st ed.; University of Michigan Press: Ann Arbor, MI, USA, 1975; pp. 29–41. [Google Scholar]
  7. Solomon, M.M. Algorithms for the vehicle routing and scheduling problems with time window constraints. Oper. Res. 1987, 35, 254–265. [Google Scholar] [CrossRef]
  8. Lin, S. Computer solutions of the traveling salesman problem. Bell Syst. Tech. J. 1965, 44, 2245–2269. [Google Scholar] [CrossRef]
  9. Righini, G.; Salani, M. Symmetry helps: Bounded bi-directional dynamic programming for the elementary shortest path problem with resource constraints. Discret. Optim. 2006, 3, 255–273. [Google Scholar] [CrossRef]
  10. Desaulniers, G.; Lessard, F.; Hadjar, A. Tabu search, partial elementarity, and generalized k-path inequalities for the vehicle routing problem with time windows. Transp. Sci. 2008, 42, 387–404. [Google Scholar] [CrossRef]
  11. Ball, M.O.; Golden, B.L.; Assad, A.A.; Bodin, L.D. Planning for truck fleet size in the presence of a common-carrier option. Decis. Sci. 1983, 14, 103–120. [Google Scholar] [CrossRef]
  12. Desrosiers, J.; Laporte, G.; Sauve, M.; Soumis, F.; Taillefer, S. Vehicle routing with full loads. Comput. Oper. Res. 1988, 15, 219–226. [Google Scholar] [CrossRef]
  13. Tilk, C. Branch-and-Price-and-Cut for the Vehicle Routing and Truck Driver Scheduling Problem; No. 1616; Gutenberg School of Management and Economics, Johannes Gutenberg-University Mainz: Mainz, Germany, 2016. [Google Scholar]
  14. Goel, A.; Irnich, S. An exact method for vehicle routing and truck driver scheduling problems. Transp. Sci. 2017, 51, 737–754. [Google Scholar] [CrossRef]
  15. Tilk, C.; Goel, A. Bidirectional labeling for solving vehicle routing and truck driver scheduling problems. Eur. J. Oper. Res. 2020, 283, 108–124. [Google Scholar] [CrossRef]
  16. El Bahi, Y.F.; Ezzine, L.; Aman, Z.; El Moussami, H. Distribution management problem: Case of vehicle routing problem with capacity constraints “CVRP” in the Moroccan petroleum sector. In Proceedings of the 2022 8th International Conference on Control, Decision and Information Technologies (CoDIT), Istanbul, Turkey, 17–20 May 2022; IEEE: Piscataway, NJ, USA; Volume 1. [Google Scholar]
  17. Budiyanto, M.A.; Novrian, G.R.; Riadi, A.; Putra, G.L.; Theotokatos, G. Shipping cost feasibility of LNG distribution with multiple island gas power plant destinations. Front. Energy Res. 2025, 13, 1502518. [Google Scholar] [CrossRef]
  18. Heidari, N.; Hemmati, A. An ALNS-based matheuristic algorithm for a multi-product many-to-many maritime inventory routing problem. Comput. Manag. Sci. 2023, 20, 44. [Google Scholar] [CrossRef]
  19. Shafipour-Omrani, B.; Komijan, A.R.; Ghasemi, P.; Ghasemzadeh, E.; Babaeinesami, A. A simulation-optimization model for liquefied natural gas transportation considering product variety. Int. J. Manag. Sci. Eng. Manag. 2021, 16, 279–289. [Google Scholar] [CrossRef]
  20. Santos, A.; Soares, C.G. Cost optimization of shuttle tanker offloading operations. Ocean Eng. 2024, 301, 117378. [Google Scholar] [CrossRef]
  21. Budiyanto, M.A.; Singgih, I.K.; Riadi, A.; Putra, G.L. Study on the LNG distribution to Mobile Power Plants using a Small-Scale LNG Carrier for the case of the Sulawesi region of Indonesia. Energy Rep. 2022, 8, 374–380. [Google Scholar] [CrossRef]
  22. Gao, Z.; Sun, D.; Zhao, R.; Dong, Y. Ship-unloading scheduling optimization for a steel plant. Inf. Sci. 2021, 544, 214–226. [Google Scholar] [CrossRef]
  23. Fu, J.; Pan, S.; Liao, J.; Zhang, S. Application of Hybrid Optimization Algorithm Considering Yard Priority to Port Vehicle Scheduling. In Proceedings of the 2025 8th World Conference on Computing and Communication Technologies (WCCCT), Shenzhen, China, 11–13 April 2025; IEEE: Piscataway, NJ, USA. [Google Scholar]
  24. Larsen, R.B.; Atasoy, B.; Negenborn, R.R. Model predictive control for simultaneous planning of container and vehicle routes. Eur. J. Control 2021, 57, 273–283. [Google Scholar] [CrossRef]
  25. Baldouski, D.; Krész, M.; Dávid, B. Scheduling truck arrivals for efficient container flow management in port logistics. Central Eur. J. Oper. Res. 2025, 33, 791–818. [Google Scholar] [CrossRef]
  26. He, X.; Yang, Z.; Fan, T.; Gao, J.; Zhen, L.; Lyu, J. Branch and price algorithm for route optimization on customized bus service. Ann. Oper. Res. 2024, 335, 205–236. [Google Scholar] [CrossRef]
  27. Joo, J.; Lee, C. A branch-and-price algorithm for robust drone-vehicle routing problem with time windows. Inf. J. Comput. 2025; ahead of print. [Google Scholar] [CrossRef]
  28. Dantzig, G.B.; Wolfe, P. Decomposition principle for linear programs. Oper. Res. 1960, 8, 101–111. [Google Scholar] [CrossRef]
  29. Desrosiers, J.; Soumis, F.; Desrochers, M. Routing with time windows by column generation. Networks 1984, 14, 545–565. [Google Scholar] [CrossRef]
  30. Barnhart, C.; Johnson, E.L.; Nemhauser, G.L.; Savelsbergh, M.W.P.; Vance, P.H. Branch-and-price: Column generation for solving huge integer programs. Oper. Res. 1998, 46, 316–329. [Google Scholar] [CrossRef]
  31. Ropke, S.; Cordeau, J.-F. Branch and cut and price for the pickup and delivery problem with time windows. Transp. Sci. 2009, 43, 267–286. [Google Scholar] [CrossRef]
  32. Costa, L.; Contardo, C.; Desaulniers, G. Exact branch-price-and-cut algorithms for vehicle routing. Transp. Sci. 2019, 53, 946–985. [Google Scholar] [CrossRef]
  33. Kohl, N.; Desrosiers, J.; Madsen, O.B.G.; Solomon, M.M.; Soumis, F. 2-path cuts for the vehicle routing problem with time windows. Transp. Sci. 1999, 33, 101–116. [Google Scholar] [CrossRef]
  34. Kallehauge, B.; Larsen, J.; Madsen, O.B.G.; Solomon, M.M. Vehicle Routing Problem with Time Windows; Springer: Berlin/Heidelberg, Germany, 2005. [Google Scholar]
  35. Dial, R.; Glover, F.; Karney, D.; Klingman, D. A computational analysis of alternative algorithms and labeling techniques for finding shortest path trees. Networks 1979, 9, 215–248. [Google Scholar] [CrossRef]
  36. Feillet, D.; Dejax, P.; Gendreau, M.; Gueguen, C. An exact algorithm for the elementary shortest path problem with resource constraints: Application to some vehicle routing problems. Netw. Int. J. 2004, 44, 216–229. [Google Scholar] [CrossRef]
  37. Floyd, R.W. Algorithm 97: Shortest path. Commun. ACM 1962, 5, 345. [Google Scholar] [CrossRef]
  38. Wu, Y.; Qureshi, A.G.; Yamada, T.; Yu, S. Branch-and-price-and-cut algorithm for the capacitated single allocation hub location routeing problem. J. Oper. Res. Soc. 2024, 75, 410–422. [Google Scholar] [CrossRef]
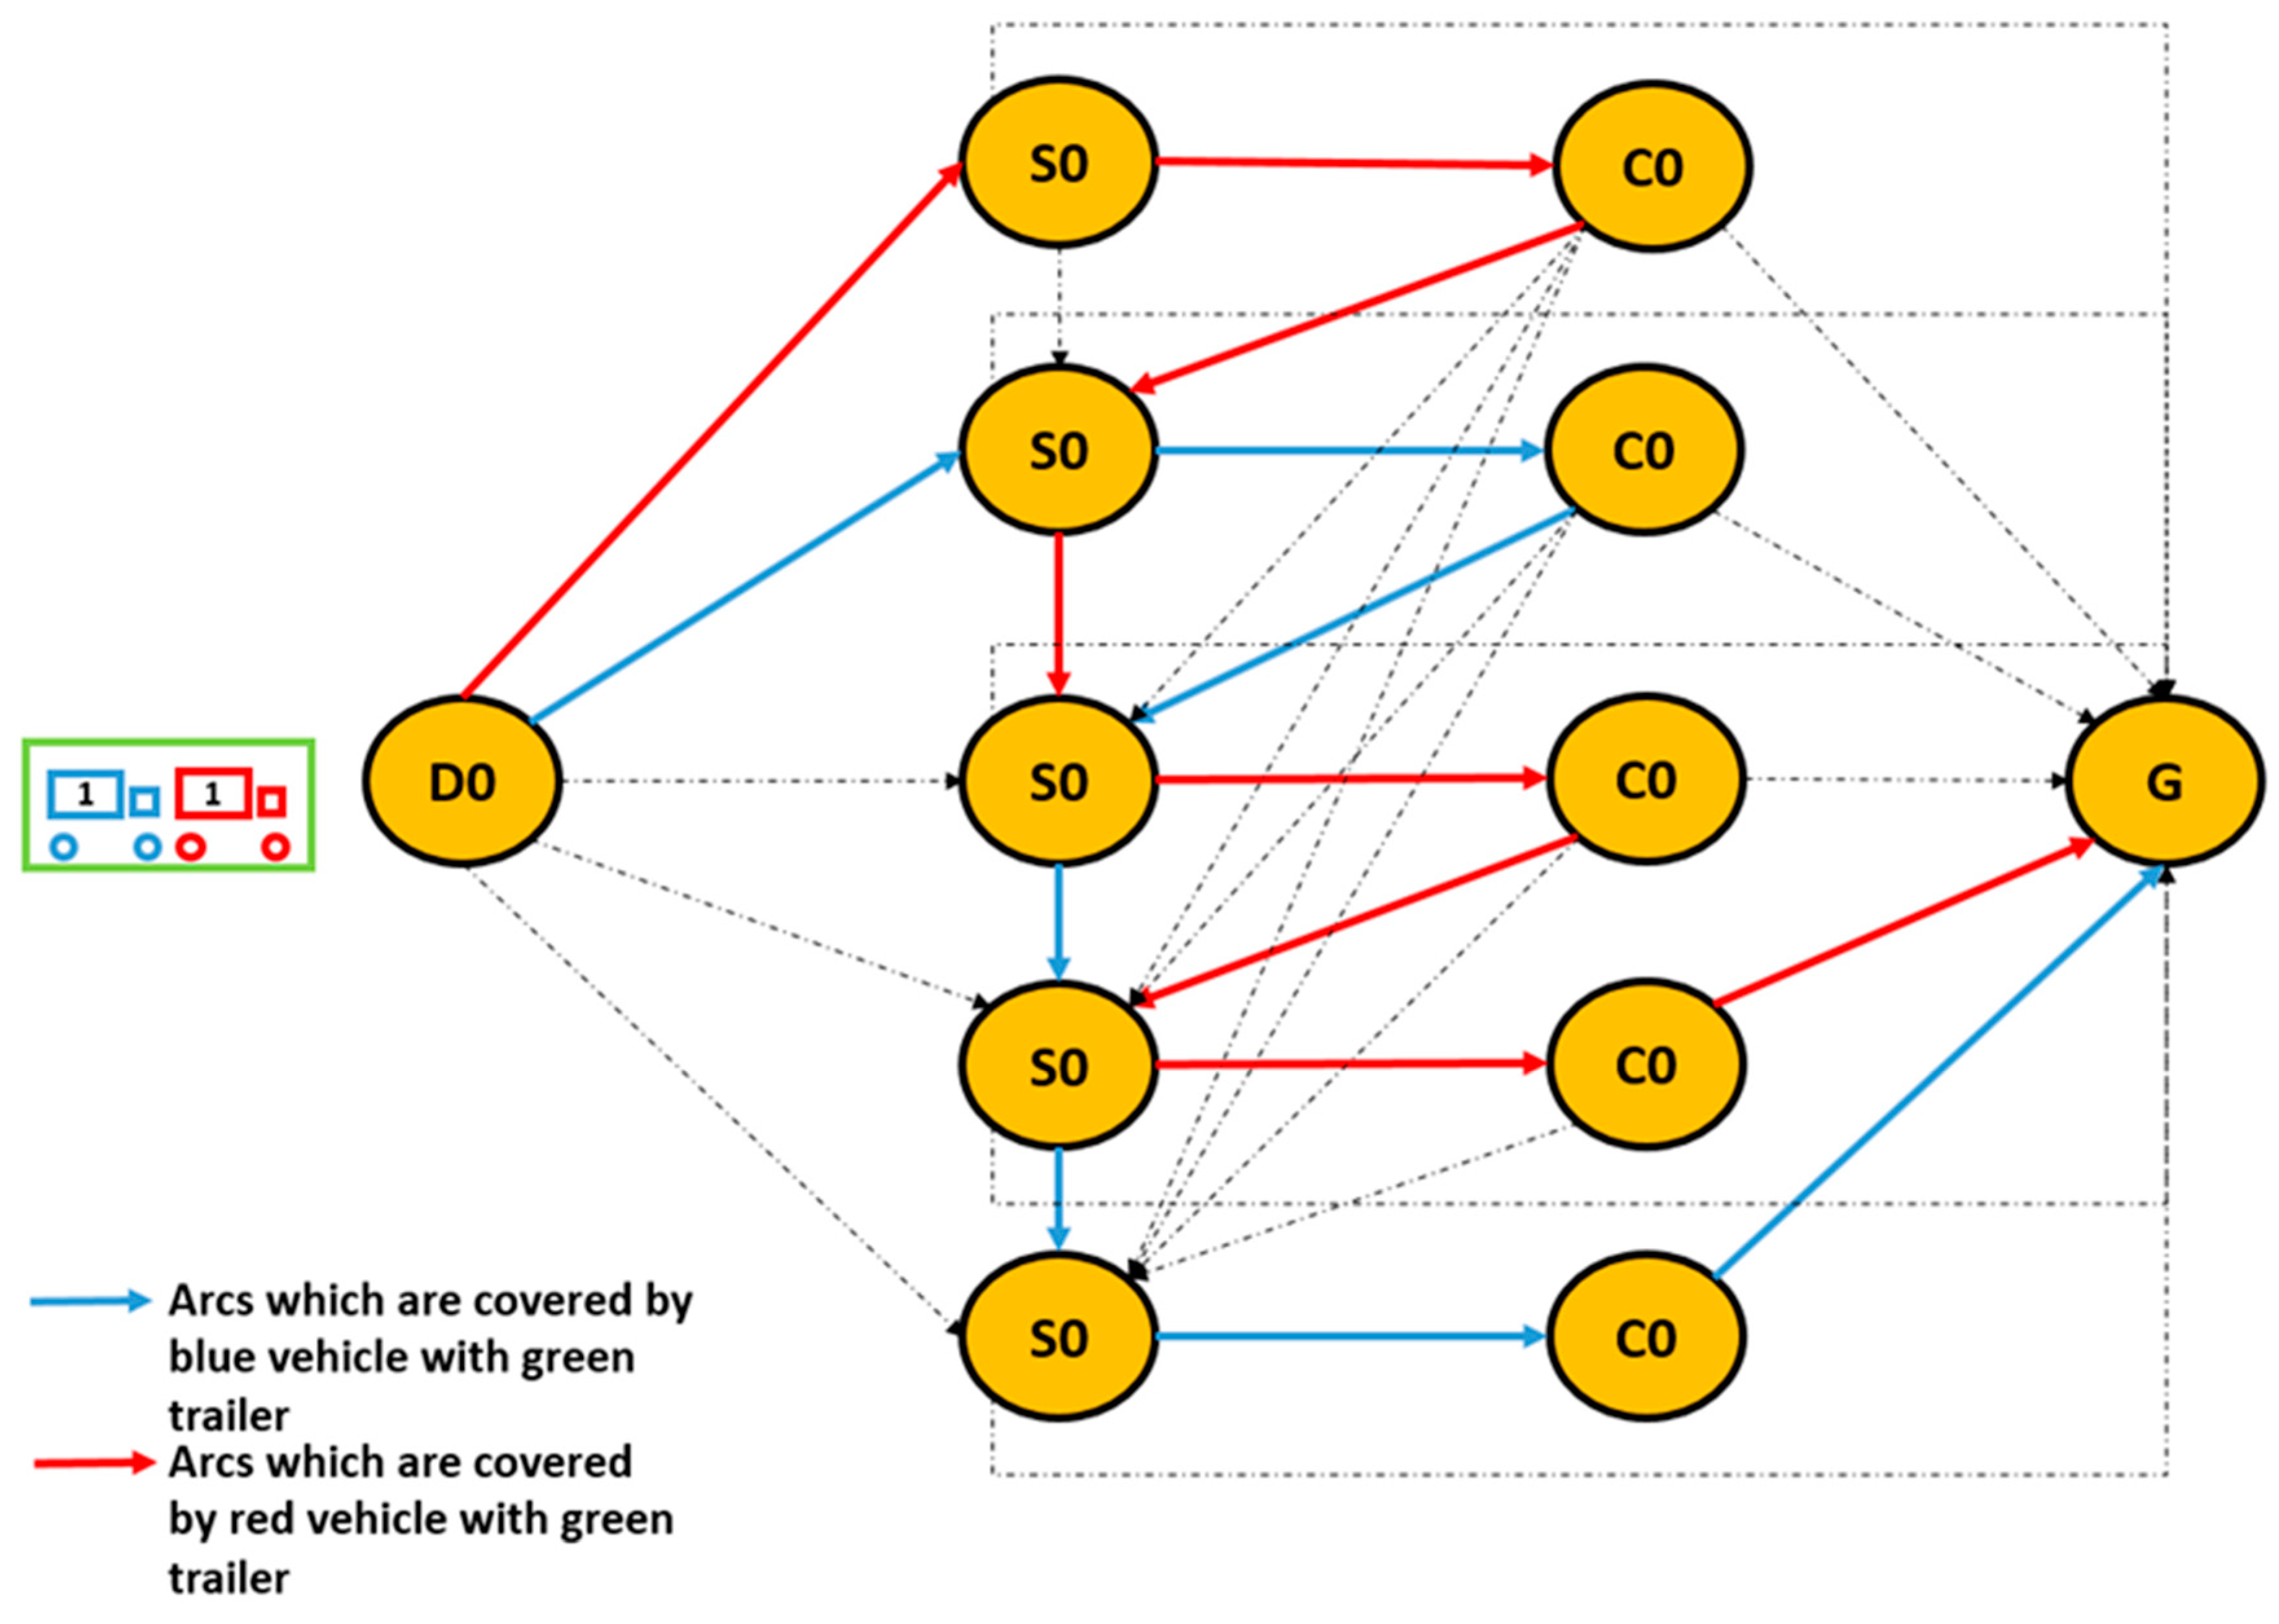
Figure 1. Example of routes for vehicles.
Systems 13 00883 g001
Figure 2. A vehicle route in detailed form.
Systems 13 00883 g002
Figure 3. The scheme of the construction heuristic algorithm.
Systems 13 00883 g003
Figure 4. The outline of heuristic column generation.
Systems 13 00883 g004
Figure 5. The outline of subproblem selection technique.
Systems 13 00883 g005
Figure 6. The outline of bi-directional search.
Systems 13 00883 g006
Figure 7. The outline of concatenation.
Systems 13 00883 g007
Figure 8. CPU(s) regarding total number of customers.
Systems 13 00883 g008
Figure 9. CPU(s) regarding total number of customers and minimum number of vehicles at port.
Systems 13 00883 g009
Figure 10. CPU(s) regarding minimum number of vehicles at port.
Systems 13 00883 g010
Figure 11. CPU(s) regarding minimum number of vehicles at port and total number of customers.
Systems 13 00883 g011
Figure 12. Number of chosen vehicles regarding the minimum number of vehicles at port and total number of customers.
Systems 13 00883 g012
Figure 13. Number of chosen vehicles regarding the total number of customers and minimum number of vehicles at port.
Systems 13 00883 g013
Figure 14. Analysis of optimality gap based on the minimum number of vehicles at port.
Systems 13 00883 g014
Figure 15. Analysis of optimality gap based on the total number of customers.
Systems 13 00883 g015
Table 1. Comparison of some studies in the literature based on critical aspects.
StudiesABCDEFGH
El Bahi et al. [16]XX X
Tilk and Goel [15] X XXXX
Goel and Irnich [14] X XXXX
Budiyanto et al. [17]X X X X
Heidari et al. [18] X X XX
Gao et al. [22] X XXXX
Fu et al. [23] X XX
Shafipour et al. [19]X X X X
Santos et al. [20]X X X
Our WorkXXXXXXXX
Table 2. Notation for the mathematical formulation.
Sets
C Set of customer nodes
S Set of supply nodes
D Set of departure nodes
G Terminal/garage node
J Set of vehicle types
H j Number of idle vehicles at the relevant departure node for given j J
K Set of feasible routes
A * S C for each arc i , j , where i S and j C   A * i , j includes just i , j if ( j , i ) does not exist, otherwise it includes both i , j and ( j , i )
P C Set of subsets, each of which consists of two customers
A U Subset of inward arcs for U   P C
Variables
θ j k Binary route variable
Parameters
a j k q How many times q C exists in θ j k
a j k q How many times q S exists in θ j k
b j k m n How many times an arc m , n takes place in θ j k
c j k Cost of θ j k
Table 3. Parameters enforced by current U.S. service regulations.
ParametersValueExplanation
t d r i v e | R 11 hMaximum driving time between two consecutive rest periods
t b r e a k 30 minMinimum length of a break period
t r e s t 10 hMinimum length of a rest period
t e l a p s e d | B 8 hMaximum time after the end of the rest or break period until a driver can drive
t e l a p s e d | R 14 hMaximum time period after the end of the rest period until a driver can drive
Table 4. Labels during the forward labeling in nested label setting algorithm.
LabelsExplanation
l c o s t Reduced cost of the forward path
l t i m e Elapsed time since the start of the forward path
l d i s t Remaining drive time to next customer on the forward path
l d r i v e | R Accumulated drive time since the last rest on the forward path
l e l a p s e d | R Elapsed time starting from the end of the previous rest on the forward path
l e l a p s e d | B Elapsed time starting from the end of the previous break on the forward path
l l a t e s t | R Latest possible time point to which previous rest period can be extended without violating scheduling constraints
l l a t e s t | B Latest possible time point to which previous break period can be extended without violating scheduling constraints
Table 5. Drive/rest/break functions during the forward labeling in nested label setting algorithm.
Labels/Functions f i j s t a r t f i j d r i v e ( ) f i j b r e a k ( ) f i j r e s t ( )
l c o s t l c o s t + c ¯ i j
l t i m e l t i m e + l t i m e + l t i m e +
l d i s t t i j l d i s t
l d r i v e | R l d r i v e | R 0
l e l a p s e d | R l e l a p s e d | R + l e l a p s e d | R + 0
l e l a p s e d | B l e l a p s e d | B + 00
l l a t e s t | R
l l a t e s t | B m i n ( l l a t e s t | B ,   l l a t e s t | R + t e l a p s e d | R l e l a p s e d | B )
Table 6. Visit function during the forward labeling in nested label setting algorithm.
Labels/Function f i j v i s i t
l c o s t
l t i m e max a j , l t i m e + s j
l d i s t
l d r i v e | R
l e l a p s e d | R max l e l a p s e d | R ,   a j l l a t e s t | R   + s j
l e l a p s e d | B max l e l a p s e d | B ,   a j l l a t e s t | B   + s j
l l a t e s t | R max l l a t e s t | R ,   b j + s j l e l a p s e d | R  
l l a t e s t | B max l l a t e s t | B ,   b j + s j l e l a p s e d | B  
Table 7. Visiting function during backward labeling in nested label setting algorithm.
Labels/Function f i j v i s i t b
l e l a p s e d | R b 0 , I f   l e l a p s e d | R b = 0 max l e l a p s e d | R b ,   a j b l l a t e s t | R b   + s j , o t h e r w i s e
l e l a p s e d | B b 0 , I f   l e l a p s e d | B b = 0 max l e l a p s e d | B b ,   a j b l l a t e s t | B b   + s j , o t h e r w i s e
l l a t e s t | R b ,   I f   l e l a p s e d | R b = 0 max l l a t e s t | R b ,   b j b + s j l e l a p s e d | R b   , o t h e r w i s e
l l a t e s t | B b , I f   l e l a p s e d | B b = 0 max l l a t e s t | B b ,   b j + s j l e l a p s e d | B b   , o t h e r w i s e
Table 8. Performance results of instances.
Number of Total CustomersMinimum Number of Vehicles at PortTime (s)Optimality Gap (%)Number of Used Vehicles
40220709
40219109
40218309
402211010
403148011
403171010
403144012
403129012
40494014
40477015
40480012
40489013
40565018
40545017
40549016
40556019
502428010
50238009
502455012
502470010
503385012
503342011
503416010
503401014
504327017
504303015
504298019
504367019
505151022
505111017
505142025
505189020
6021090017
602987017
602950016
6021290017
603634021
603443019
603489023
603890022
6045680.00007024
6045050.00007222
6044990.00012824
6046290.00103722
6054420.00008727
6054010.00044527
6054820.00005728
6055070.00042826
7022115023
7021910025
7022386024
7022217021
7031841025
7031663027
7031998026
7032100025
7041194028
7041318030
704961030
7041001027
7051100032
705911031
705855031
7051295033
8027337025
8026802026
8027821027
8027265025
8035318029
8035148029
8035599028
8034923028
80431190.00004833
80433340.00127733
80428210.00022333
80435060.00094133
80522230.00006438
80520010.00176937
80521330.00012035
80522540.00024235
90210,9750.00061126
90297120.00288327
90210,1020.00176924
90211,6340.00241825
9038402030
90378410.00180131
90381390.00324231
90386660.00145031
90467170.00009936
9046265033
90466110.00010739
90471150.00218937
9053321043
9052978039
90535040.00042143
9053334045
100214,2220.00008130
100212,0320.00319429
100213,9910.00160830
100212,8160.00302629
100312,061034
100311,3120.00242434
100311,8280.00162033
100311,5540.00207935
100497910.00002140
100495440.00176843
100494190.00141341
100410,0560.00030142
100550230.00037047
100543220.00088847
100548390.00077345
100549290.00038946
Table 9. CPU(s) regarding total number of customer nodes and minimum number of vehicles at the port.
Minimum Number of Vehicles at the Port
2345
Total Number of Customers40Avg CPU(s)1981488553.75
Min CPU(s)1831297745
Max CPU(s)2111719465
Number of Instances4444
50Avg CPU(s)433.25386323.75148.25
Min CPU(s)380342298111
Max CPU(s)470416367189
Number of Instances4444
60Avg CPU(s)1079.25614550.25458
Min CPU(s)950443499401
Max CPU(s)1290890629507
Number of Instances4444
70Avg CPU(s)21571900.51118.51040.25
Min CPU(s)19101663961855
Max CPU(s)2386210013181295
Number of Instances4444
80Avg CPU(s)7306.25524731952152.75
Min CPU(s)6802492328212001
Max CPU(s)7821559935062254
Number of Instances4444
90Avg CPU(s)10,605.75826266773284.25
Min CPU(s)9712784162652978
Max CPU(s)11,634866671153504
Number of Instances4444
100Avg CPU(s)13,265.2511,688.759702.54778.25
Min CPU(s)12,03211,31294194322
Max CPU(s)14,22212,06110,0565023
Number of Instances4444
Table 10. Total number of used vehicles regarding total number of customer nodes and minimum number of vehicles at the port.
Minimum Number of Vehicles at the Port
2345
Total Number of Customers40Avg Number of Used Vehicles9.2511.2513.517.5
Min Number of Used Vehicles9101216
Max Number of Used Vehicles10121519
Number of Instances4444
50Avg Number of Used Vehicles10.2511.7517.521
Min Number of Used Vehicles9101517
Max Number of Used Vehicles12141925
Number of Instances4444
60Avg Number of Used Vehicles16.7521.252327
Min Number of Used Vehicles16192226
Max Number of Used Vehicles17232428
Number of Instances4444
70Avg Number of Used Vehicles23.2525.7528.7531.75
Min Number of Used Vehicles21252731
Max Number of Used Vehicles25273033
Number of Instances4444
80Avg Number of Used Vehicles25.7528.53336.25
Min Number of Used Vehicles25283335
Max Number of Used Vehicles27293338
Number of Instances4444
90Avg Number of Used Vehicles25.530.7536.2542.5
Min Number of Used Vehicles24303339
Max Number of Used Vehicles27313945
Number of Instances4444
100Avg Number of Used Vehicles29.53441.546.25
Min Number of Used Vehicles29334045
Max Number of Used Vehicles30354347
Number of Instances4444
Table 11. Optimality gap regarding total number of customer nodes and minimum number of vehicles at the port.
Minimum Number of Vehicles at the Port
2345
Total Number of Customers40Avg Optimality Gap (%)0000
Min Optimality Gap (%)0000
Max Optimality Gap (%)0000
Number of Instances4444
50Avg Optimality Gap (%)0000
Min Optimality Gap (%)0000
Max Optimality Gap (%)0000
Number of Instances4444
60Avg Optimality Gap (%)000.000330.00025
Min Optimality Gap (%)000.000070.00006
Max Optimality Gap (%)000.001040.00044
Number of Instances4444
70Avg Optimality Gap (%)0000
Min Optimality Gap (%)0000
Max Optimality Gap (%)0000
Number of Instances4444
80Avg Optimality Gap (%)000.000620.00055
Min Optimality Gap (%)000.000050.00006
Max Optimality Gap (%)000.001280.00177
Number of Instances4444
90Avg Optimality Gap (%)0.001920.001620.000600.00011
Min Optimality Gap (%)0.00061000
Max Optimality Gap (%)0.002880.003240.002190.00042
Number of Instances4444
100Avg Optimality Gap (%)0.001980.001530.000880.00061
Min Optimality Gap (%)0.0000800.000020.00037
Max Optimality Gap (%)0.003190.002420.001770.00089
Number of Instances4444
Disclaimer/Publisher’s Note: The statements, opinions and data contained in all publications are solely those of the individual author(s) and contributor(s) and not of MDPI and/or the editor(s). MDPI and/or the editor(s) disclaim responsibility for any injury to people or property resulting from any ideas, methods, instructions or products referred to in the content.