This paper primarily encompasses research from the following three angles: investigation of driving characteristics under high traffic volume, analysis of parking demand allocation, and calibration of traffic simulation parameters.
In the theoretical research on high-volume traffic, Reference [
1] introduced bounded rationality into the field of transportation, arguing that travelers cannot and do not always choose the option with the highest utility when making decisions. Reference [
2] started with individual travelers and then expanded the model to heterogeneous travelers, thereby achieving a Rationally Inattentive User Equilibrium (RIUE). Reference [
3] assumed that the inflow and outflow of road segments were equal, averaging the queueing delays across all demand flows, and posited that all demand flows experience delays when traversing the road network. After a detailed discussion of the characteristics of traffic flow in complex networks, Reference [
4] analyzed network congestion. To describe the dynamic traffic flow characteristics of urban road networks, Reference [
5] employed Morlet wavelet analysis to analyze the traffic flow characteristics. Reference [
6] conducted an in-depth analysis of the traffic flow characteristics on King Fahad Road in the Al-Ahsa region of Saudi Arabia, utilizing survey data to assess the various factors affecting traffic flow. The study primarily focuses on key characteristics such as flow, density, and speed, aiming to establish a relationship between flow and density. Reference [
7] clustered the traffic congestion patterns in Beijing under different flow conditions, revealing that these patterns vary significantly during the morning and evening peak hours. Notably, Monday and severely congested weekday morning peaks are particularly pronounced, while Friday and regular weekdays exhibit more severe characteristics during the evening peak. Reference [
8] evaluated the traffic characteristics of the road network in Ramadi, Iraq, using sustainability indicators to analyze road efficiency. Reference [
9] focused on the highways connecting urban agglomerations characterized by high traffic flow and density, establishing a dynamic collision risk assessment model that effectively evaluates traffic safety risks in high-flow vehicle environments.
In the study of parking demand allocation, Reference [
10] considered the personalized needs of parking users and the avoidance of traffic conflicts, proposing an automatic parking allocation mechanism. They selected decision factors such as lane occupancy, travel distance, walking distance, and the occupancy of adjacent parking spaces to establish an optimal parking allocation model. Reference [
11] investigated the problem of optimal allocation of vehicles for parking. Reference [
12] proposed a novel intelligent parking system based on matching theory, which allocates parking spaces while simultaneously considering the preferences of both drivers and parking managers. Reference [
13] proposed a Personalized Parking Guidance Service (PPGS) by constructing a bi-level programming model to describe the relationship between the personalized parking guidance information system and drivers. The simulation results show that under this model’s guidance, peak congestion time is significantly reduced. Reference [
14] introduced a distributed parking space allocation framework based on an adaptive pricing algorithm and virtual voting, providing users with a fair, fast, and cost-optimal parking allocation method. Reference [
15] discussed parking demand, drivers’ parking choice behavior, and parking-related policies, suggesting that factors such as accessibility, walking time, and parking fees should be given more attention in planning and policymaking to improve the efficiency and resource utilization of parking systems. Reference [
16] proposed a parking space allocation model that considers the transition between dynamic and static traffic, optimizing parking space allocation by minimizing travelers’ total travel time, thereby alleviating the resource waste and traffic congestion caused by the temporal and spatial concentration of parking demand. Reference [
17] proposed a data-driven parking demand estimation framework, first dividing parking areas through statistical information grids and multi-density clustering algorithms and then estimating parking demand using support vector machines. Reference [
18] proposed an integrated optimization strategy for dynamic parking space allocation, aimed at systematically optimizing the use of curbside parking spaces. Reference [
19] proposed a machine learning- and game theory-based approach for dynamic pricing and the allocation of parking spaces in curbside parking scenarios. The problem is modeled as a Stackelberg game and solved by finding its Nash equilibrium. Reference [
20] developed a polynomial logit model to study drivers’ parking choice behavior, based on data obtained from a revealed preference survey on drivers’ parking type choices and related factors in urban areas. Reference [
21] established a rolling shared parking allocation model, optimizing the supply–demand matching in parking-dense areas by maximizing platform revenue and minimizing parking users’ travel costs. Reference [
22] proposed a multi-agent deep reinforcement learning framework to generate efficient online parking allocation strategies. Reference [
23] viewed urban parking management as an online localized resource allocation problem and proposed a multi-agent system to address it. Reference [
24] presented a framework for shared parking allocation and guidance optimization for autonomous vehicles and validated its effectiveness on the urban road network of Xi’an. Reference [
25] designed a two-stage network-level parking space allocation method, first assigning parking lots to users using a polynomial logit model and then solving the constructed model using the NSGA-II algorithm by collecting indicators such as the number of rejections, occupancy rates, and profits of each parking lot to ensure the most favorable profits. Reference [
26] proposed two linear integer programming models, the first for assigning a parking space to each driver and the second for assigning two parking spaces when no single space was suitable, solving the models using genetic algorithms and tabu search algorithms. Reference [
27] designed a scalable dynamic parking allocation framework that effectively improves the quality of parking space allocation. Reference [
28] formulated the parking resource allocation optimization problem as an integer linear programming (ILP) problem to minimize total costs and validated the feasibility and effectiveness of the proposed method based on real data. Reference [
29] studied the parking allocation problem for multiple destinations and multiple parking lots, establishing and solving an equivalent mathematical programming model by analyzing the various factors influencing drivers’ parking choices. Reference [
30] addressed the issue of nighttime parking difficulties by proposing an integer linear programming model for the nighttime sharing of large shopping mall parking spaces. Reference [
31] introduced an adaptive ant colony optimization algorithm for solving the parking allocation problem, which shows better performance compared to traditional algorithms. Reference [
32] considered the impact of heterogeneity in temporary parking demand on allocation decisions and optimized parking space allocation through modeling to improve the utilization rate of parking resources. Reference [
33] studied the following two allocation models for shared parking spaces in residential areas: “real-time allocation” and “fixed-time allocation”. The results showed that the real-time allocation model exhibited user optimization advantages when supply exceeded demand, while the fixed-time allocation model demonstrated a more balanced performance in terms of resource utilization efficiency and system revenue. Reference [
34] proposed a constrained optimization model for dynamic parking space allocation based on user priorities, parking lot organization structure, and shift scheduling to intelligently allocate parking spaces. Reference [
35] investigated the allocation of shared parking spaces in hospitals and proposed an allocation model based on cumulative prospect theory to alleviate parking difficulties. Reference [
36] proposed a nonlinear mixed-integer programming model to achieve optimal matching between parking supply and demand and solved the model, with the effectiveness of the model being validated through a case study in Beijing. Reference [
37] proposed an optimization model based on the Nondominated Sorting Genetic Algorithm (NSGA-II) with an elite strategy, aiming to enhance the planning efficiency of autonomous vehicle parking facilities. Reference [
38] uses the Technology Acceptance Model to analyze factors affecting users’ adoption of shared autonomous vehicles (SAVs) and their parking choices, with the goal of improving urban traffic efficiency and sustainability. Reference [
39] applies a Multinomial Logit Model (MNL) to examine users’ behavior and influencing factors when choosing parking applications, providing practical guidance for the development of smart parking solutions, particularly in Ningbo’s context.
In the area of traffic simulation parameter calibration, Reference [
40] proposed the following nine-step process for calibrating the parameters in microscopic traffic simulation models: selecting evaluation indicators, collecting observational data, determining the parameters to be calibrated, designing experimental schemes, conducting simulation experiments, establishing intuitive functions, identifying alternative calibration parameters, evaluating simulation results, and verifying model validity. Reference [
41] focused on the calibration of urban traffic microscopic simulation models, emphasizing the multivariate distribution of traffic characteristics. Reference [
42] reviewed research on calibration methods for heterogeneous traffic conditions based on VISSIM and discussed the various methods for identifying and optimizing calibration parameters in VISSIM microscopic simulation software. Reference [
43] conducted a detailed analysis of the advantages of VISSIM in microscopic traffic simulation and developed a collaborative simulation platform based on it. Reference [
44] used VISSIM to calibrate and validate the car-following model based on peak-hour traffic flow and driving data from Medina, Saudi Arabia. Reference [
45] calibrated the model using traffic flow and accident data from highways in Florida and simulated the conditions to obtain delay results. Reference [
46] analyzed and compared 29 different traffic simulation software programs to evaluate their applicability to various real-world traffic scenarios. Reference [
47] demonstrated the consistency between VISSIM simulation results and actual measured values through field data analysis of four signalized intersections in Miami, showing the effectiveness of this data-driven calibration method. Reference [
48] proposed a dynamic calibration method based on detection data and validated the calibration of driving behavior parameters in a case model using VISSIM software.
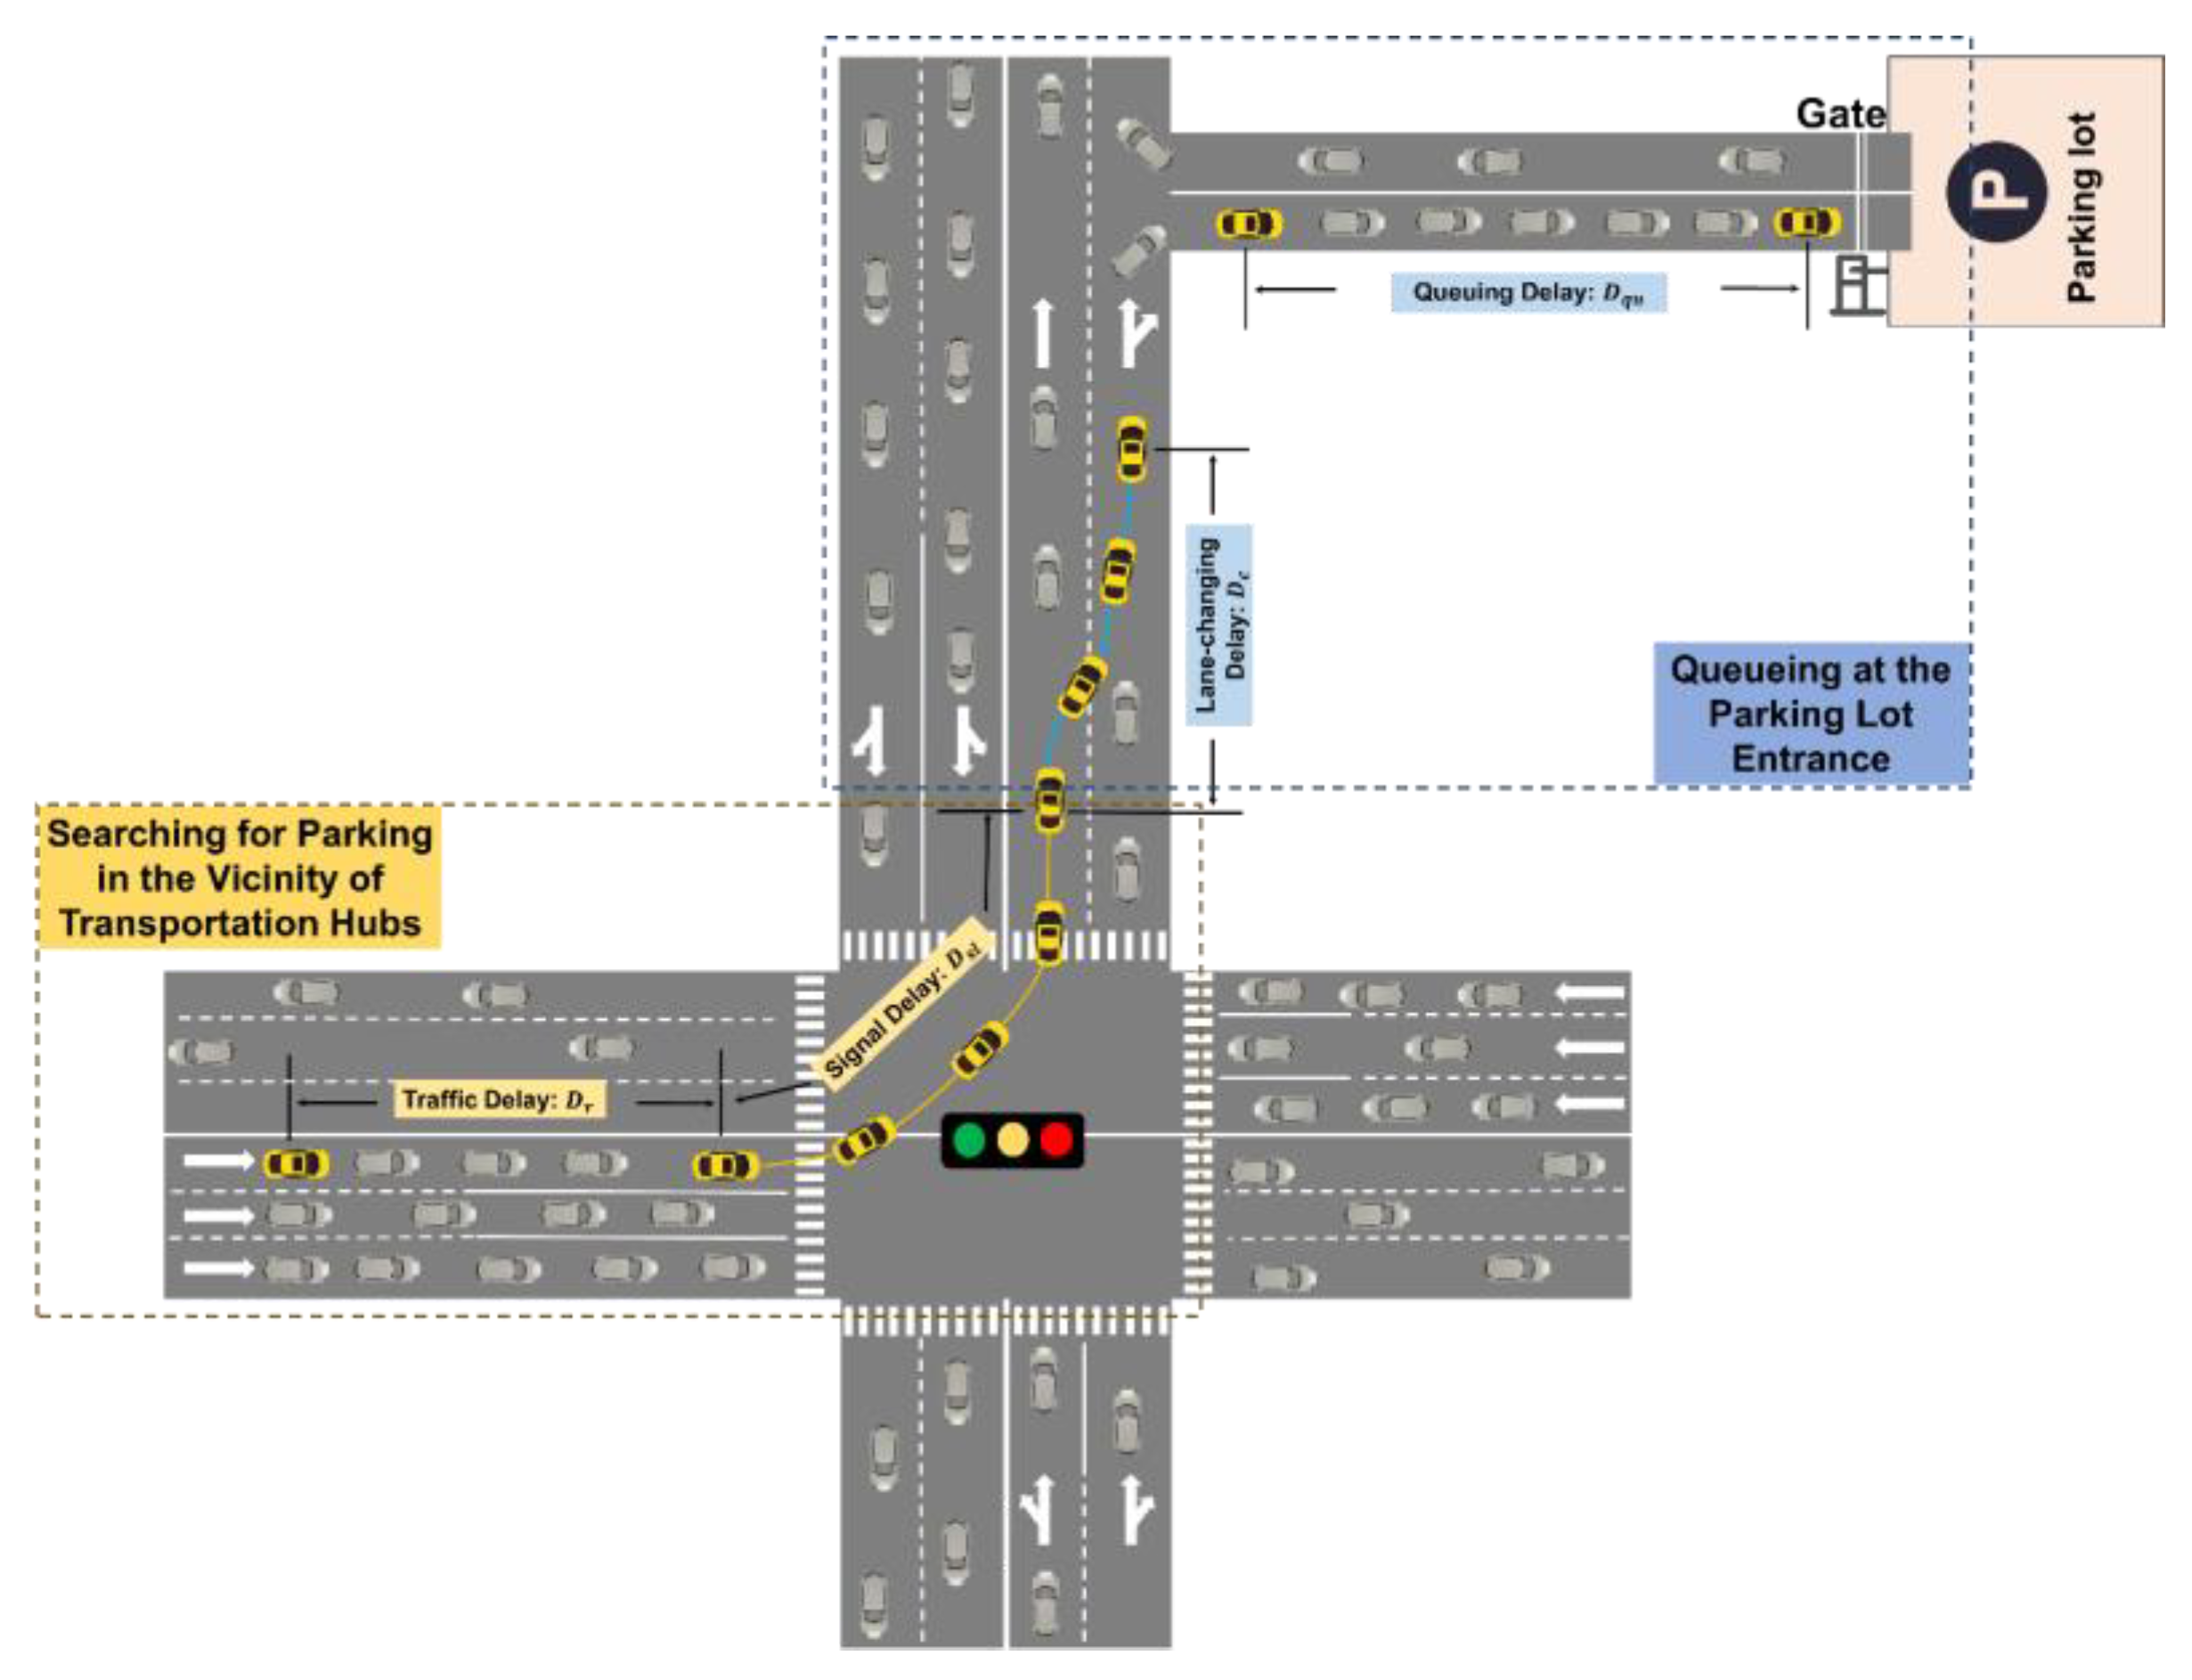
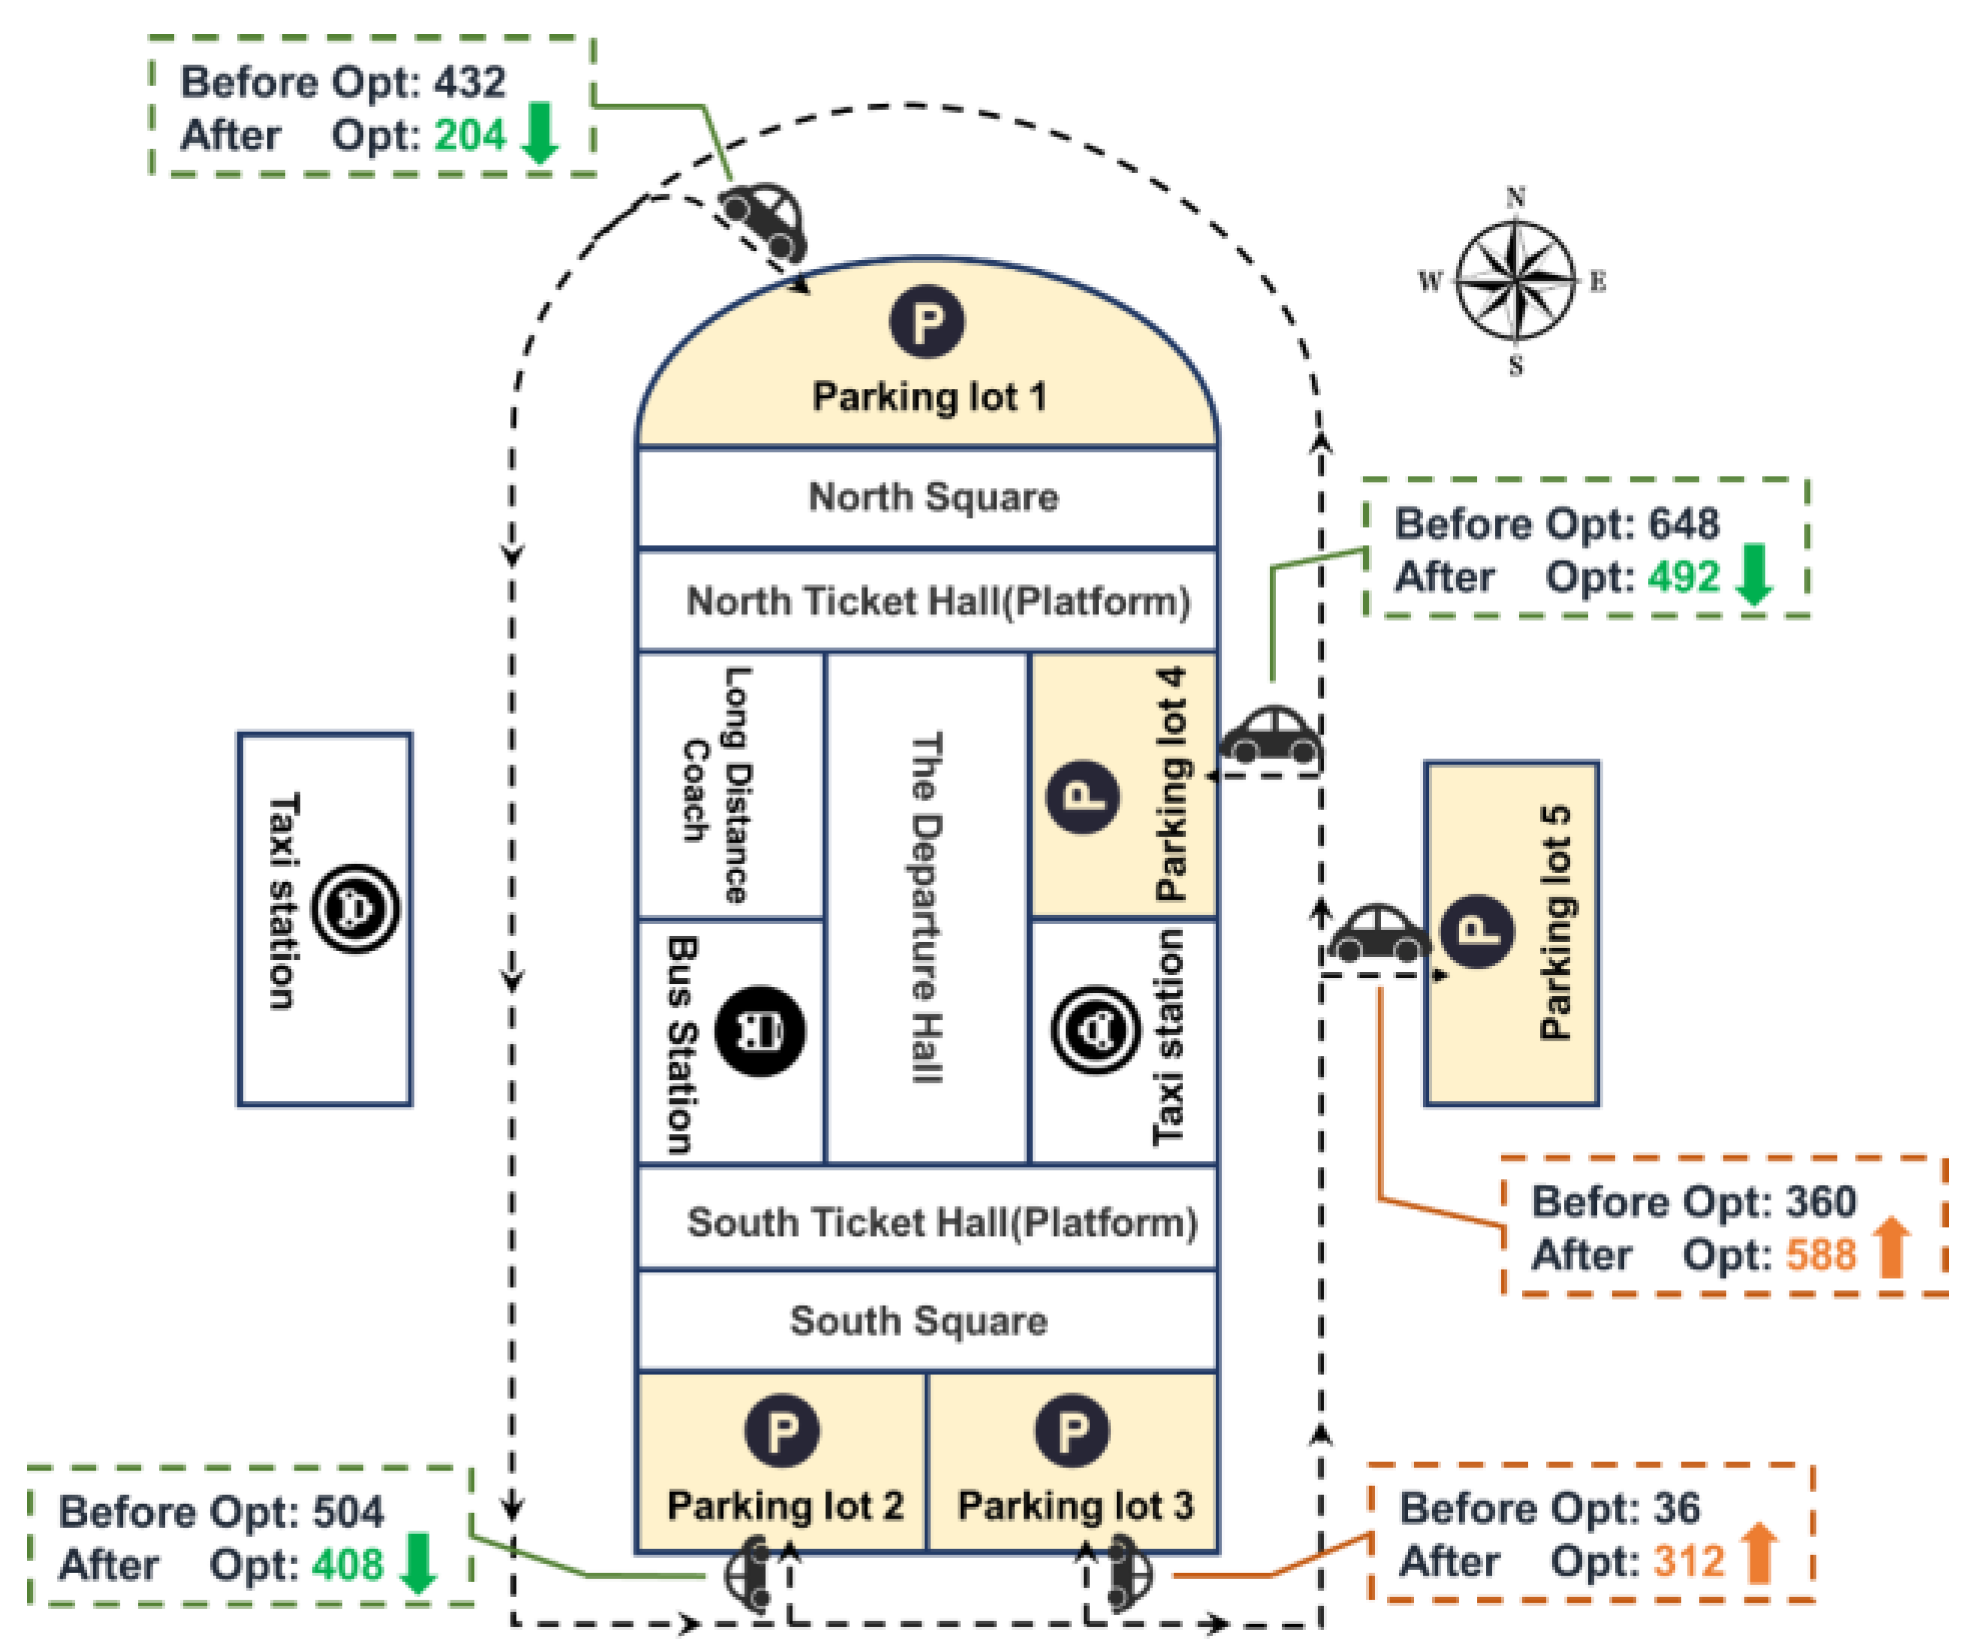
According to the existing research, most studies focus on scenarios such as residential areas, commercial districts, and hospitals, while there is relatively little research on large transportation hubs. As critical nodes in urban transportation networks, transportation hubs are characterized by high parking demand and turnover rates. Additionally, the current studies often focus on parking demand allocation at the level of individual parking spaces or static parking optimization. However, parking lots at transportation hubs are typically organized in clusters, with multiple parking lots simultaneously serving a large number of vehicles and vehicles dynamically choosing between different lots. Therefore, optimizing parking demand allocation among parking lot clusters from a more macro-level perspective, rather than merely focusing on individual parking spaces, is essential for effectively guiding vehicle flow and reducing the delays caused by chaotic parking searches. This study aims to fill this research gap through the following methods:


