
A Study on the Spatial Correlation Effects of Digital Economy Development in China from a Non-Linear Perspective


Abstract
1. Introduction
2. Literature Review
3. Methodology and Data
3.1. Non-Linear Granger Causality Test
3.2. Social Network Analysis
3.3. Quadratic Assignment Procedure Analysis
3.4. Sample and Data
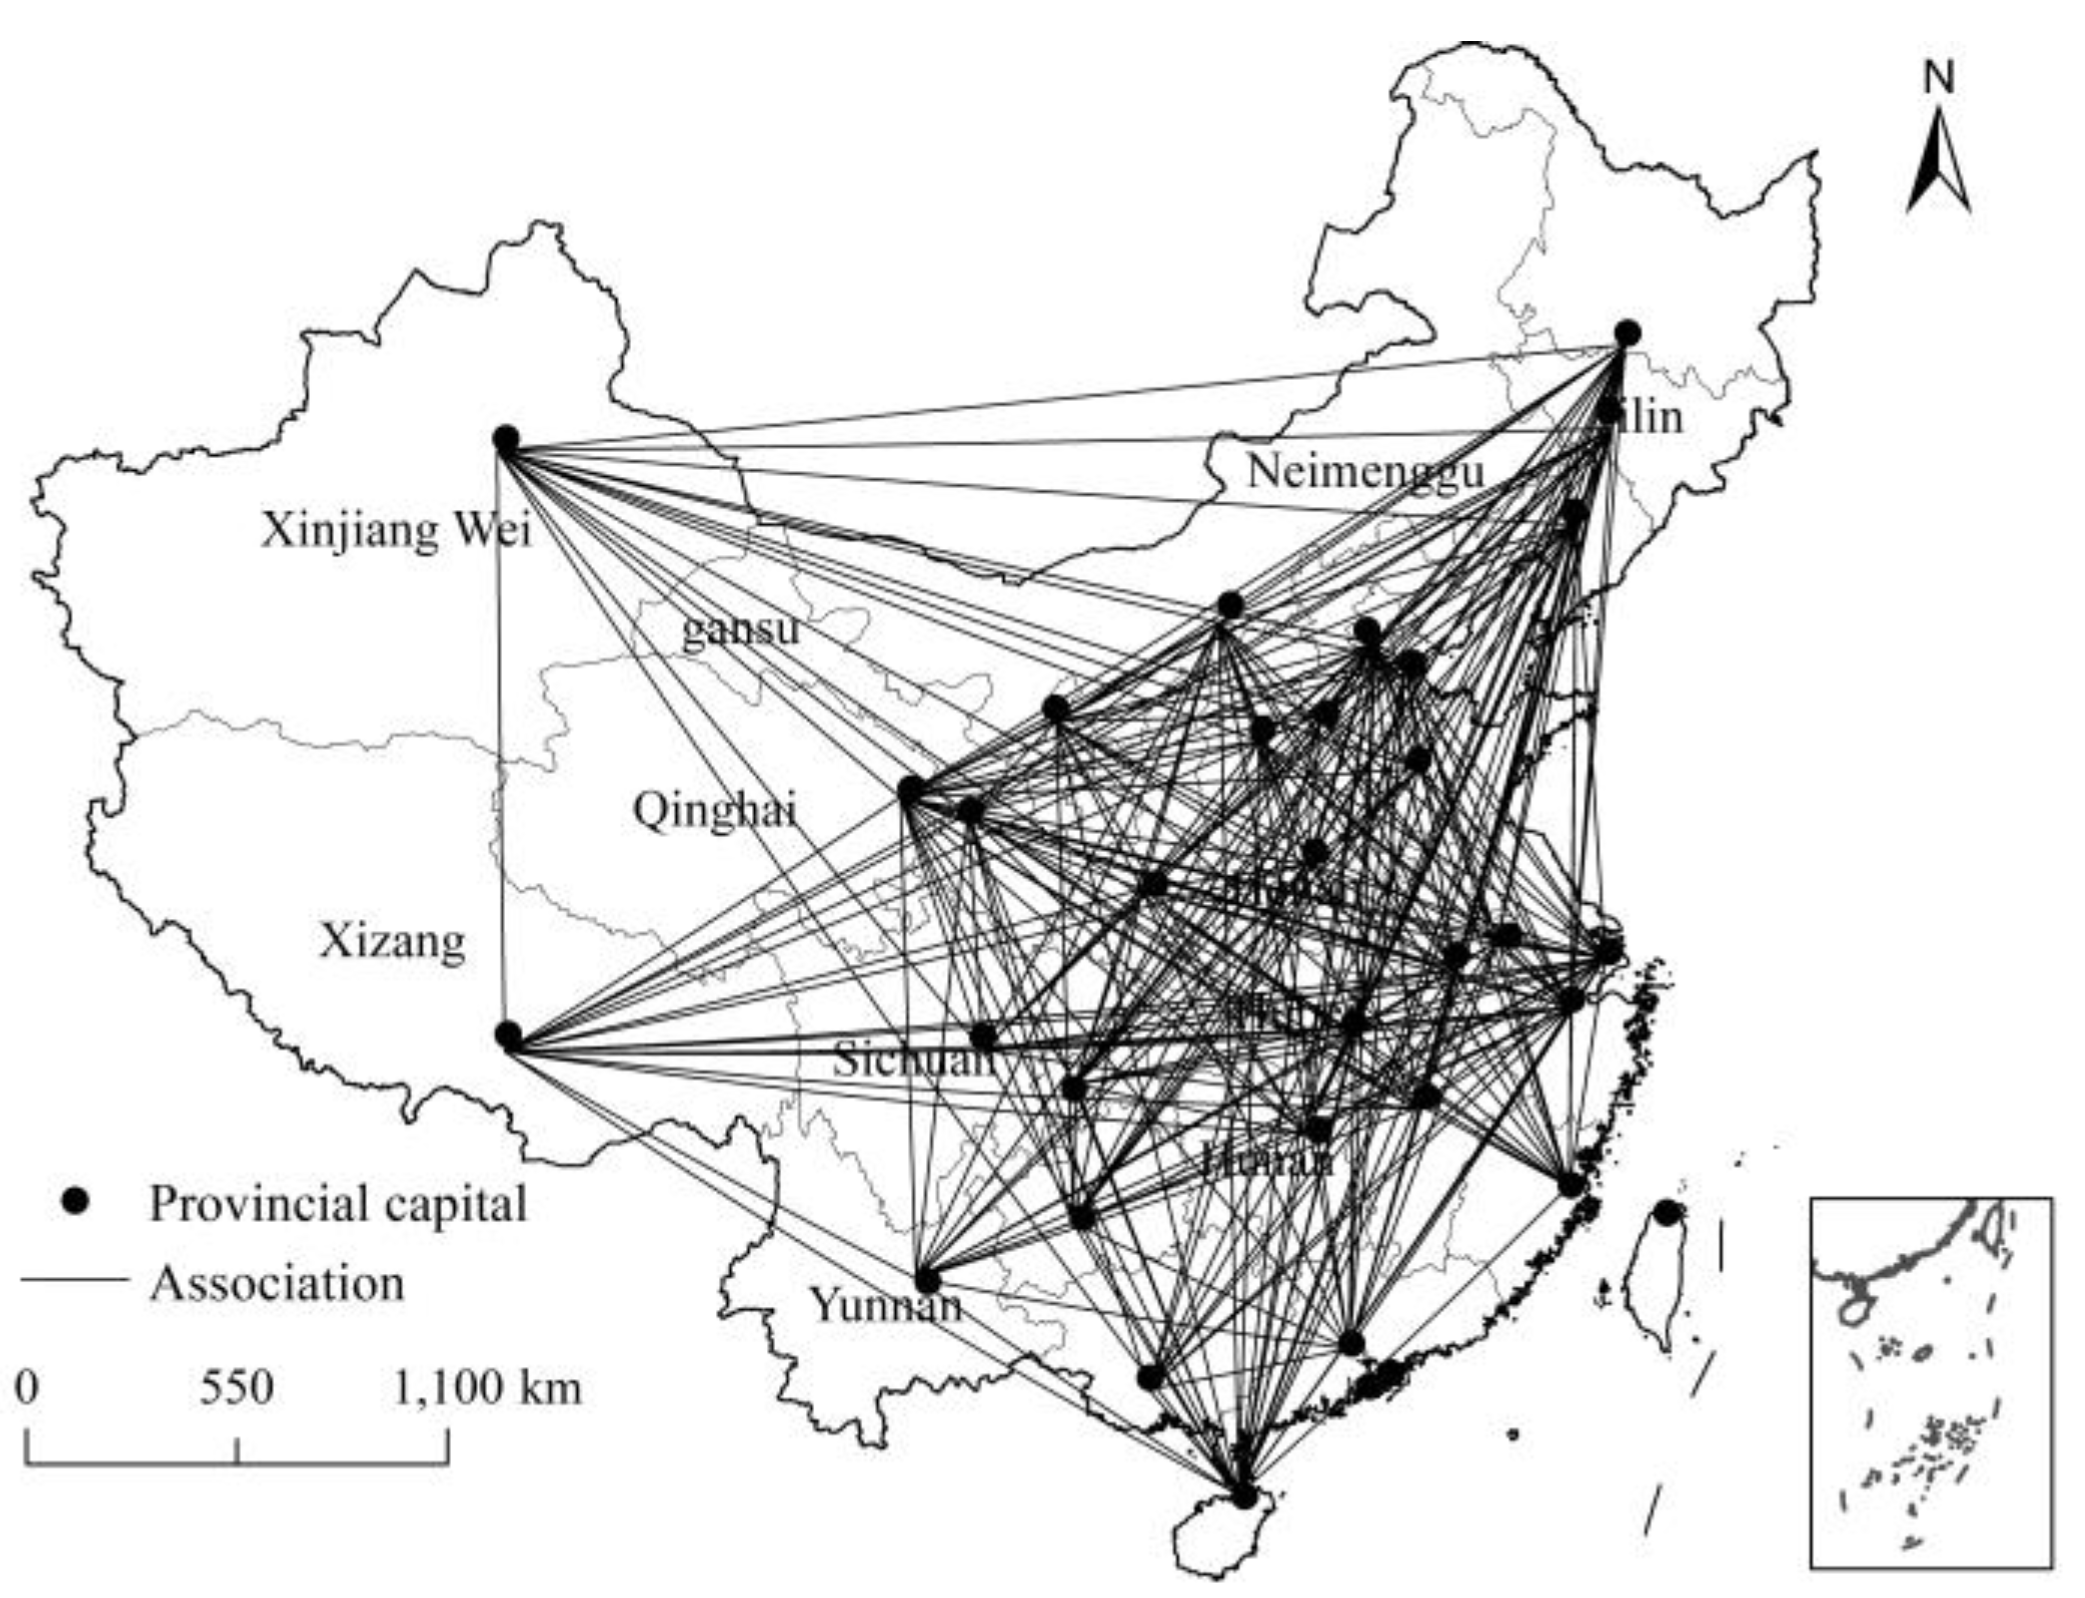
4. Spatially Correlated Network Characteristics of China’s Digital Economy
4.1. Overall Network Characteristics
4.2. Individual Network Characteristics
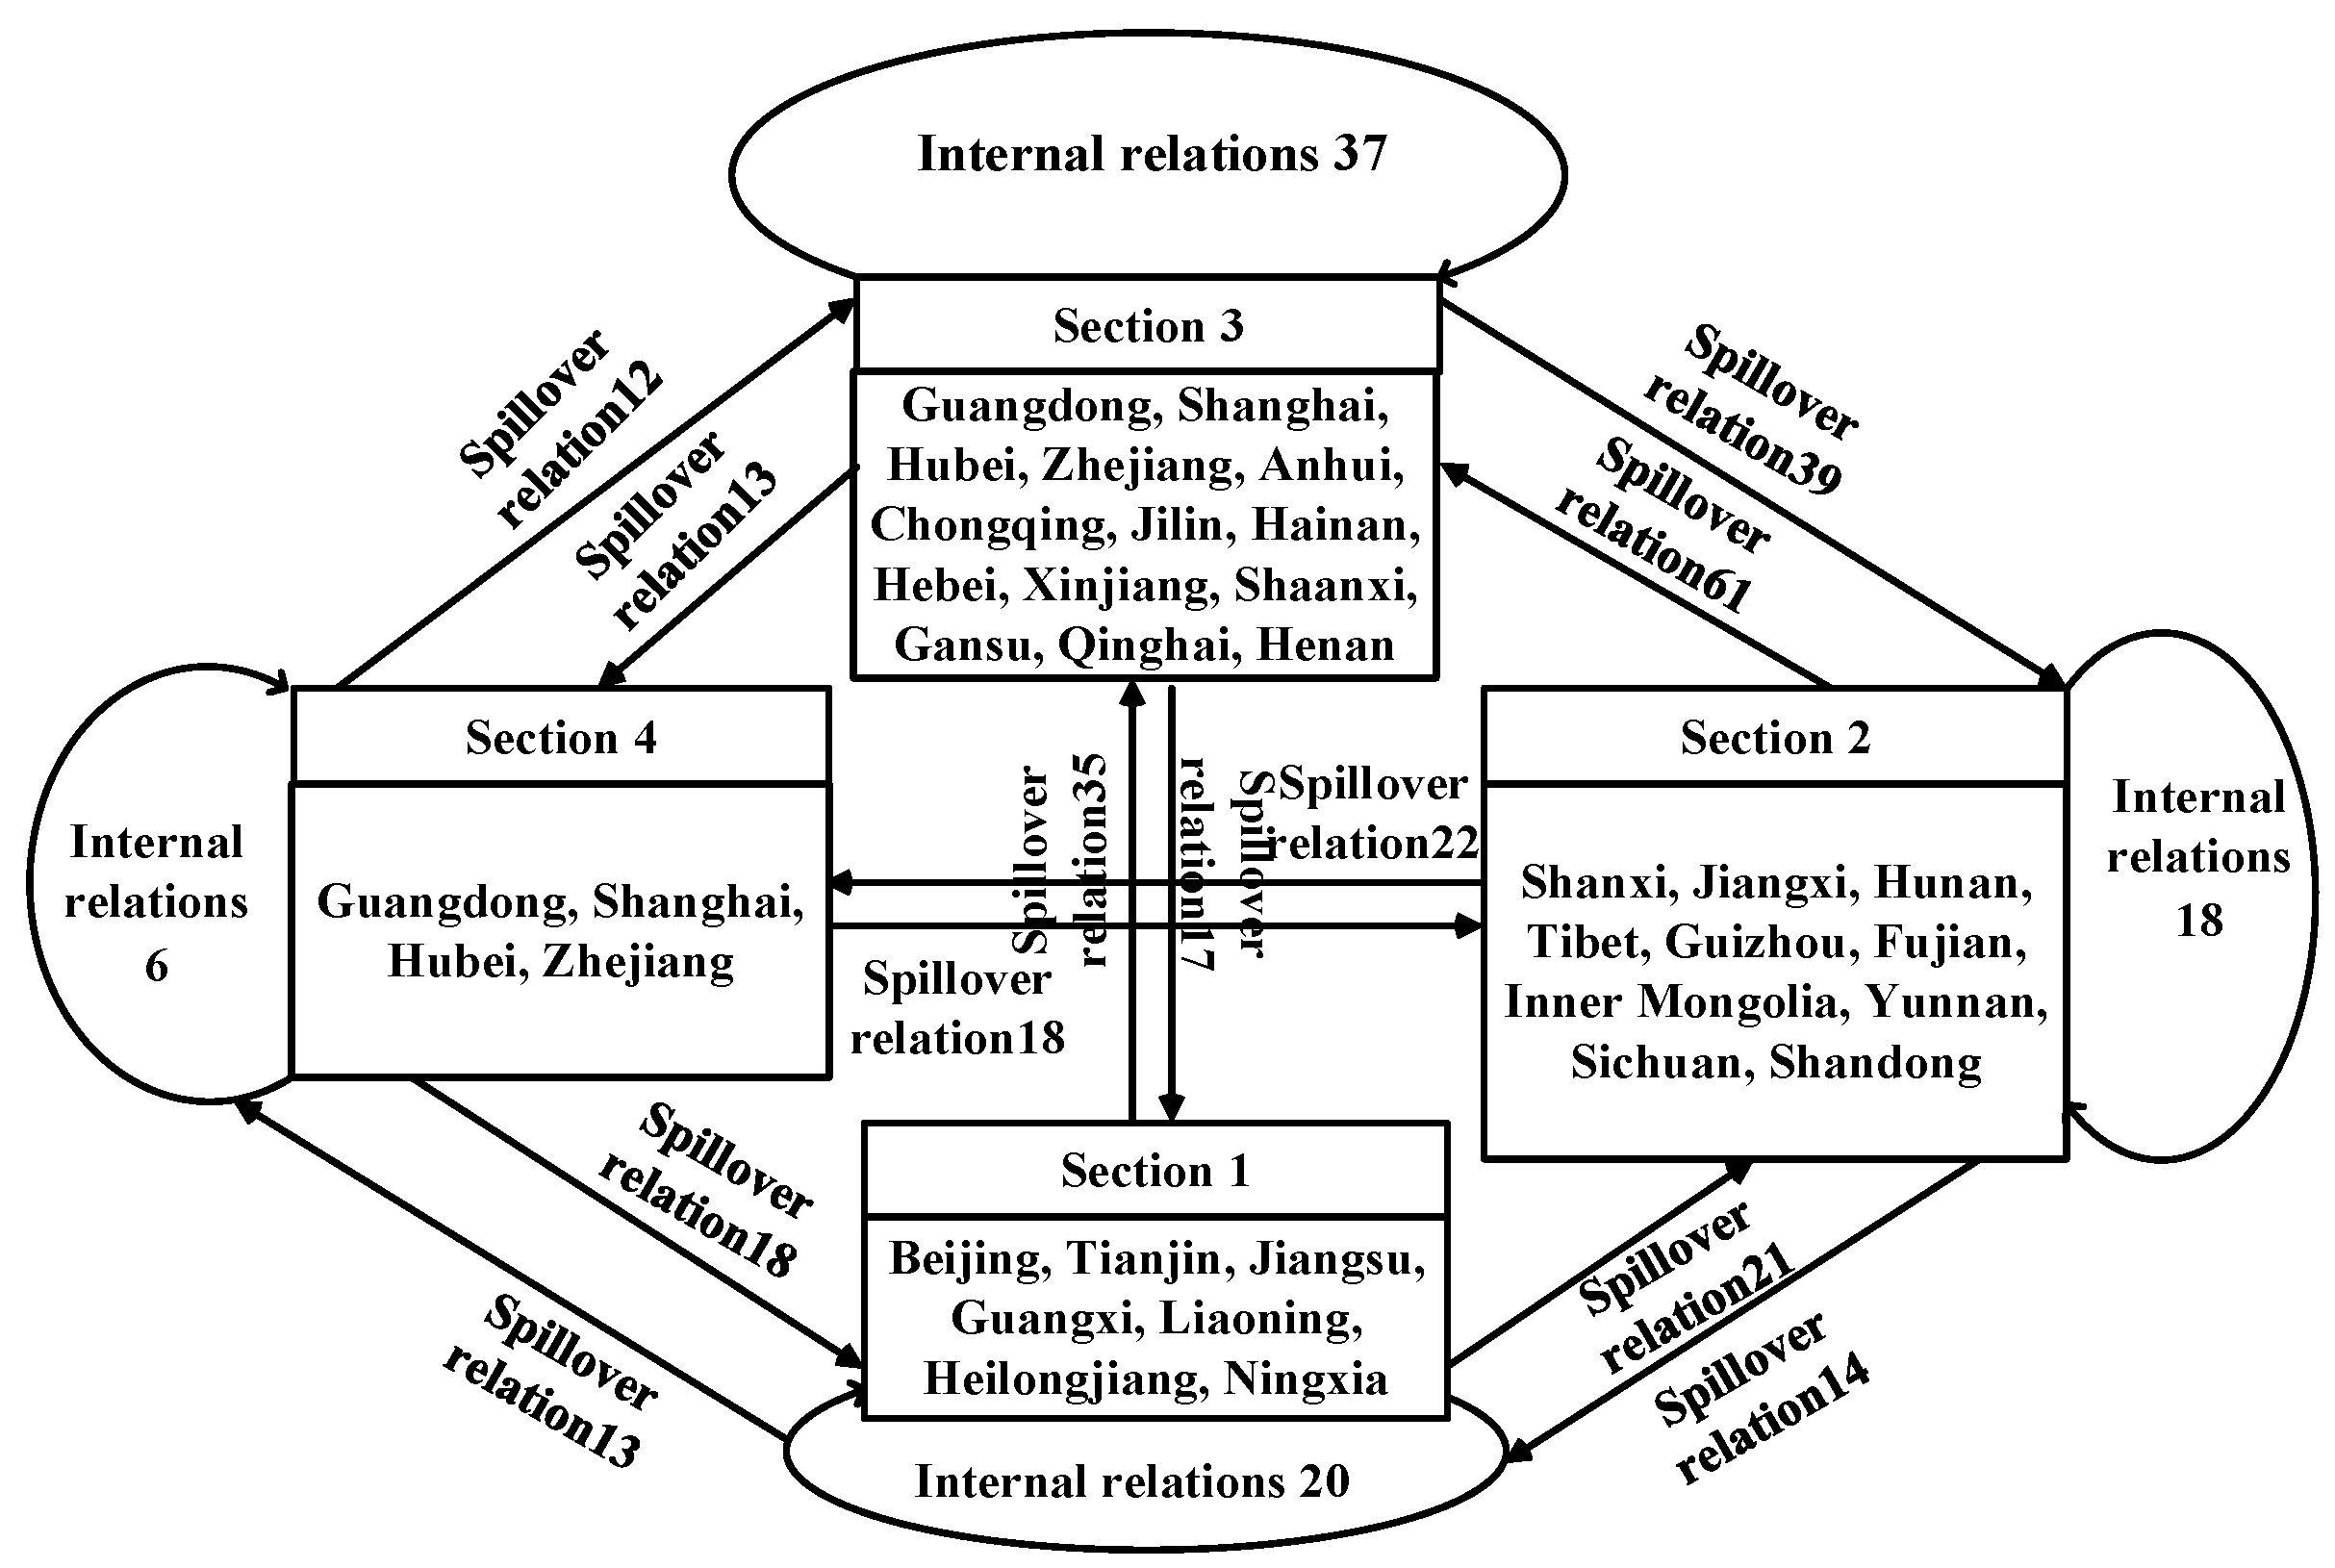
4.3. Block Model Analysis
4.3.1. Distribution of Block Members
4.3.2. Inter-Block Spillover and Reception Relationships
5. Analysis of the Factors Influencing the Spatial Correlation of the Digital Economy
5.1. Econometric Model Construction
5.2. QAP Regression Analysis
6. Conclusions and Contributions
Author Contributions
Funding
Institutional Review Board Statement
Informed Consent Statement
Data Availability Statement
Conflicts of Interest
References
- Ding, C.H.; Liu, C.; Zheng, C.Y.; Li, F. Digital economy, technological innovation and high-quality economic development: Based on spatial effect and mediation effect. Sustainability 2021, 14, 216. [Google Scholar] [CrossRef]
- Tang, L.Y.; Lu, B.K.; Tian, T.H. Spatial correlation network and regional differences for the development of digital economy in China. Entropy 2021, 23, 1575. [Google Scholar] [CrossRef] [PubMed]
- Tapscott, D. The Digital Economy: Promise and Peril in the Age of Networked Intelligence; McGraw-Hill: New York, NY, USA, 1996. [Google Scholar]
- Tapscott, D. Blueprint to the Digital Economy: Creating Wealth in the Era of e-Business; McGraw-Hill: New York, NY, USA, 1998. [Google Scholar]
- Jorgenson, D.W.; Vu, K.M. The ICT revolution, world economic growth, and policy issues. Telecommun. Policy 2016, 40, 383–397. [Google Scholar] [CrossRef]
- Moulton, B.R. GDP and the Digital Economy: Keeping up with the Changes; MIT Press: Cambridge, MA, USA, 2000. [Google Scholar]
- Pan, W.R.; Xie, T.; Wang, Z.W.; Ma, L.S. Digital economy: An innovation driver for total factor productivity. J. Bus. Res. 2022, 139, 303–311. [Google Scholar] [CrossRef]
- Ma, Q.; Tariq, M.; Mahmood, H.; Khan, Z. The nexus between digital economy and carbon dioxide emissions in China: The moderating role of investments in research and development. Technol. Soc. 2022, 68, 101910. [Google Scholar] [CrossRef]
- Wang, S.; Zhang, T. Research on the Spatial Effect of Government Science and Technology Expenditure on the Development of Digital Economy. J. Risk Anal. Crisis Response 2022, 12, 170–188. [Google Scholar] [CrossRef]
- Zhou, J.; Lan, H.L.; Zhao, C.; Zhou, J.P. Haze Pollution Levels, Spatial Spillover Influence, and Impacts of the Digital Economy: Empirical Evidence from China. Sustainability 2021, 13, 9076. [Google Scholar] [CrossRef]
- Zhu, W.J.; Chen, J.J. The spatial analysis of digital economy and urban development: A case study in Hangzhou, China. Cities 2022, 123, 103563. [Google Scholar] [CrossRef]
- Jiao, S.T.; Sun, Q.B. Digital Economic Development and Its Impact on Econimic Growth in China: Research Based on the Prespective of Sustainability. Sustainability 2021, 13, 10245. [Google Scholar] [CrossRef]
- Ma, D.; Zhu, Q. Innovation in emerging economies: Research on the digital economy driving high-quality green development. J. Bus. Res. 2022, 145, 801–813. [Google Scholar] [CrossRef]
- Cuaresma, J.C.; Lutz, S.U. Modelling and projecting digital trends in European regions: An econometric framework. Reg. Stud. 2021, 55, 1696–1710. [Google Scholar] [CrossRef]
- Zhao, S.Q.; Peng, D.Y.; Wen, H.W.; Wu, Y.Z. Nonlinear and spatial spillover effects of the digital economy on green total factor energy efficiency: Evidence from 281 cities in China. Environ. Sci. Pollut. Res. 2022, 1–21. [Google Scholar] [CrossRef]
- Zhang, W.; Liu, X.M.; Wang, D.; Zhou, J.P. Digital economy and carbon emission performance: Evidence at China’s city level. Energy Policy 2022, 165, 112927. [Google Scholar] [CrossRef]
- Lu, G.Y.; Wong, D.W. An adaptive inverse-distance weighting spatial interpolation technique. Comput. Geosci. 2008, 34, 1044–1055. [Google Scholar] [CrossRef]
- Barbieri, M.M.; Berger, J.O.; George, E.I.; Rockova, V. The median probability model and correlated variables. Bayesian Anal. 2022, 16, 1085–1112. [Google Scholar] [CrossRef]
- Koibichuk, V.; Ostrovska, N.; Kashiyeva, F.; Kwilinski, A. Innovation technology and cyber frauds risks of neobanks: Gravity model analysis. Mark. Manag. Innov. 2021, 1, 252–265. [Google Scholar] [CrossRef]
- Razniak, P.; Dorocki, S.; Winiarczyk-Razniak, A. Spatial changes in the command and control function of cities based on the corporate centre of gravity model. Misc. Geogr. 2020, 24, 35–41. [Google Scholar] [CrossRef]
- Hindman, M. The Internet Trap: How the Digital Economy Builds Monopolies and Undermines Democracy; Princeton University Press: Princeton, NJ, USA, 2018. [Google Scholar]
- Murray, A.D. Nodes and gravity in virtual space. Legisprudence 2011, 5, 195–221. [Google Scholar] [CrossRef]
- Jungmittag, A.; Welfens, P.J.J. Liberalization of EU telecommunications and trade: Theory, gravity equation analysis and policy implications. Int. Econ. Econ. Policy 2009, 6, 23–39. [Google Scholar] [CrossRef]
- Murthy, K.V.B.; Kalsie, A.; Shankar, R. Digital economy in a global perspective: Is there a digital divide? Transnatl. Corp. Rev. 2021, 13, 1–15. [Google Scholar] [CrossRef]
- Pradhan, R.P.; Arvin, M.B.; Nair, M.; Bennett, S.E.; Bahmani, S. Short-term and long-term dynamics of venture capital and economic growth in a digital economy: A study of European countries. Technol. Soc. 2019, 57, 125–134. [Google Scholar] [CrossRef]
- Dutta, A. Telecommunications and economic activity: An analysis of Granger causality. J. Manag. Inf. Syst. 2001, 17, 71–95. [Google Scholar]
- Chiou-Wei, S.Z.; Chen, C.F.; Zhu, Z. Economic growth and energy consumption revisited—Evidence from linear and nonlinear Granger causality. Energy Econ. 2008, 30, 3063–3076. [Google Scholar] [CrossRef]
- Song, M.L.; Zheng, C.B.; Wang, J.Q. The role of digital economy in China’s sustainable development in a post-pandemic environment. J. Enterp. Inf. Manag. 2021, 35, 58–77. [Google Scholar] [CrossRef]
- Liu, J.; Jia, F.X. Construction of a Nonlinear Model of Tourism Economy Forecast Based on Wireless Sensor Network from the Perspective of Digital Economy. Wirel. Commun. Mob. Comput. 2021, 2021, 8576534. [Google Scholar] [CrossRef]
- Granger, C.W.; Newbold, P. Forecasting Economic Time Series, 2nd ed.; Academic Press: Cambridge, MA, USA, 1986; pp. 67–68. [Google Scholar]
- Hiemstra, C.; Jones, J.D. Testing for linear and nonlinear Granger causality in the stock price-volume relation. J. Financ. 1994, 49, 1639–1664. [Google Scholar] [CrossRef]
- Zhao, L.L.; Wen, F.H.; Wang, X. Interaction among China carbon emission trading markets: Nonlinear Granger causality and time-varying effect. Energy Econ. 2020, 91, 104901. [Google Scholar] [CrossRef]
- Chow, S.C.; Cunado, J.; Gupta, R.; Wong, W.K. Causal relationships between economic policy uncertainty and housing market returns in China and India: Evidence from linear and nonlinear panel and time series models. Stud. Nonlinear Dyn. Econom. 2018, 22, 1–31. [Google Scholar] [CrossRef]
- Diks, C.; Panchenko, V. A new statistic and practical guidelines for nonparametric Granger causality testing. J. Econ. Dyn. Control. 2006, 30, 1647–1669. [Google Scholar] [CrossRef]
- Dergiades, T.; Martinopoulos, G.; Tsoulfidis, L. Energy consumption and economic growth: Parametric and non-parametric causality testing for the case of Greece. Energy Econ. 2013, 36, 686–697. [Google Scholar] [CrossRef]
- Wasserman, S.; Faust, K. Social Network Analysis: Methods and Applications; Cambridge University Press: Cambridge, UK, 1994. [Google Scholar]
- Liu, J. Whole Network Analysis: A Practical Guide to UCINET Software; People’s Publishing House: Shanghai, China, 2014; pp. 144–184. [Google Scholar]
- Headquarters, U.N. 2019 Digital Economy Report; United Nations Conference on Trade and Development: New York, NY, USA, 2019. [Google Scholar]
- Li, S.; Tang, G.; Yang, D.; Du, S. Research on the relationship between CPI and PPI based on VEC model. Open J. Stat. 2019, 9, 218–229. [Google Scholar] [CrossRef]
- Lopez, L.; Weber, S. Testing for Granger causality in panel data. Stata J. 2017, 17, 972–984. [Google Scholar] [CrossRef]
- Francis, B.B.; Mougoue, M.; Panchenko, V. Is there a symmetric nonlinear causal relationship between large and small firms? J. Empir. Financ. 2010, 17, 23–38. [Google Scholar] [CrossRef]
- Shu, J.H.; Zhang, J.E. Causality in the VIX futures market. J. Futures Mark. 2012, 32, 24–46. [Google Scholar] [CrossRef]
- Zhang, L.L.; Pan, A.; Feng, S.S.; Qin, Y.Y. Digital economy, technological progress, and city export trade. PLoS ONE 2022, 17, e0269314. [Google Scholar] [CrossRef]
- Zhang, J. Estimation of China’s provincial capital stock (1952–2004) with applications. J. Chin. Econ. Bus. Stud. 2008, 6, 177–196. [Google Scholar] [CrossRef]
- Zhang, L.X.; Liu, X.; Li, D.L.; Fu, Z.T. Evaluation of the rural informatization level in four Chinese regions: A methodology based on catastrophe theory. Math. Comput. Model. 2013, 58, 868–876. [Google Scholar] [CrossRef]
- Guan, X.L.; Wei, H.K.; Lu, S.S.; Dai, Q.; Su, H.J. Assessment on the urbanization strategy in China: Achievements, challenges and reflections. Habitat Int. 2018, 71, 97–109. [Google Scholar] [CrossRef]
- Hao, Y.; Zheng, S.Q.; Zhao, M.Y.; Wu, H.T.; Guo, Y.X.; Li, Y.W. Reexamining the relationships among urbanization, industrial structure, and environmental pollution in China-New evidence using the dynamic threshold panel model. Energy Rep. 2020, 6, 28–39. [Google Scholar] [CrossRef]
- Lin, S.F.; Xiao, L.; Wang, X.J. Does air pollution hinder technological innovation in China? A perspective of innovation value chain. J. Clean. Prod. 2021, 278, 123326. [Google Scholar] [CrossRef]
- Acosta, P.; Gasparini, L. Capital accumulation, trade liberalization, and rising wage inequality: The case of Argentina. Econ. Dev. Cult. Change 2007, 55, 793–812. [Google Scholar] [CrossRef]
- Mendez, C.; Kataoka, M. Disparities in regional productivity, capital accumulation, and efficiency across Indonesia: A club convergence approach. Rev. Dev. Econ. 2021, 25, 790–809. [Google Scholar] [CrossRef]
- Deng, H.Y.; Bai, G.; Shen, Z.Y.; Xia, L.Q. Digital economy and its spatial effect on green productivity gains in manufacturing: Evidence from China. J. Clean. Prod. 2022, 378, 134539. [Google Scholar] [CrossRef]
- Milskaya, E.; Seeleva, O. Main directions of development of infrastructure in digital economy. IOP Publ. 2019, 497, 012081. [Google Scholar] [CrossRef]
- Wang, H.T.; Hu, X.H.; Ali, N. Spatial Characteristics and Driving Factors toward the Digital Economy: Evidence from Prefecture-Level Cities in China. J. Asian Financ. Econ. Bus. 2022, 9, 419–426. [Google Scholar] [CrossRef]
- Chen, Z.; Ke, R.; Li, H. A study on the development of China’s digital economy based on provincial panel data. Acad. J. Bus. Manag. 2022, 4, 19–25. [Google Scholar]


| Province | Degree Centrality | Proximity Centrality | Intermediate Centrality | |||||
|---|---|---|---|---|---|---|---|---|
| Point-Out Degree | Point-In Degree | Centrality | Ranking | Centrality | Ranking | Centrality | Ranking | |
| Beijing | 20 | 10 | 86.667 | 1 | 88.235 | 1 | 3.533 | 1 |
| Tianjin | 20 | 9 | 53.333 | 18 | 68.182 | 18 | 0.875 | 19 |
| Hebei | 18 | 14 | 63.333 | 12 | 73.171 | 12 | 1.629 | 10 |
| Shanxi | 16 | 19 | 50.000 | 22 | 66.667 | 22 | 0.868 | 21 |
| Inner Mongolia | 15 | 13 | 70.000 | 7 | 76.923 | 7 | 2.049 | 7 |
| Liaoning | 15 | 10 | 53.333 | 18 | 68.182 | 18 | 0.871 | 20 |
| Jilin | 13 | 17 | 70.000 | 7 | 76.923 | 7 | 1.624 | 12 |
| Heilongjiang | 13 | 9 | 66.667 | 9 | 75.000 | 9 | 1.808 | 8 |
| Shanghai | 13 | 14 | 76.667 | 5 | 81.081 | 5 | 2.888 | 3 |
| Jiangsu | 13 | 14 | 56.667 | 14 | 69.767 | 14 | 1.198 | 14 |
| Zhejiang | 12 | 7 | 80.000 | 3 | 83.333 | 3 | 2.815 | 4 |
| Anhui | 12 | 12 | 66.667 | 9 | 75.000 | 9 | 1.713 | 9 |
| Fujian | 12 | 10 | 50.000 | 22 | 66.667 | 22 | 0.561 | 28 |
| Jiangxi | 12 | 8 | 50.000 | 22 | 66.667 | 22 | 0.513 | 29 |
| Shandong | 11 | 9 | 50.000 | 22 | 66.667 | 22 | 0.730 | 23 |
| Henan | 11 | 9 | 46.667 | 28 | 65.217 | 28 | 0.728 | 24 |
| Hubei | 11 | 13 | 73.333 | 6 | 78.947 | 6 | 2.311 | 6 |
| Hunan | 11 | 11 | 53.333 | 18 | 68.182 | 18 | 0.674 | 25 |
| Guangdong | 11 | 11 | 46.667 | 28 | 65.217 | 28 | 0.820 | 22 |
| Guangxi | 10 | 12 | 36.667 | 31 | 61.224 | 31 | 0.269 | 31 |
| Hainan | 10 | 11 | 80.000 | 3 | 83.333 | 3 | 2.489 | 5 |
| Chongqing | 9 | 16 | 53.333 | 18 | 68.182 | 18 | 0.646 | 26 |
| Sichuan | 9 | 6 | 46.667 | 28 | 65.217 | 28 | 0.383 | 30 |
| Guizhou | 9 | 7 | 56.667 | 14 | 69.767 | 14 | 0.982 | 15 |
| Yunnan | 9 | 12 | 50.000 | 22 | 66.667 | 22 | 0.908 | 17 |
| Tibet | 9 | 24 | 56.667 | 14 | 69.767 | 14 | 0.948 | 16 |
| Shaanxi | 9 | 11 | 60.000 | 13 | 71.429 | 13 | 1.452 | 13 |
| Gansu | 8 | 10 | 66.667 | 9 | 75.000 | 9 | 1.628 | 11 |
| Qinghai | 8 | 10 | 83.333 | 2 | 85.714 | 2 | 3.385 | 2 |
| Ningxia | 8 | 13 | 56.667 | 14 | 69.767 | 14 | 0.885 | 18 |
| Xinjiang | 7 | 13 | 50.000 | 22 | 66.667 | 22 | 0.577 | 27 |
| Mean value | 12 | 12 | 60.000 | 72.025 | 1.379 | |||
| Block | Number of Relations Received | Total Volume Analysis | Intensity Analysis | |||||
|---|---|---|---|---|---|---|---|---|
| Block I | Block II | Block III | Block IV | Total External Spillover | Total Spillover Received | Spillover Intensity | Reception Intensity | |
| Block I | 20 | 21 | 35 | 13 | 69 | 49 | 0.411 | 0.292 |
| Block I | 14 | 18 | 61 | 22 | 97 | 78 | 0.462 | 0.371 |
| Block I | 17 | 39 | 37 | 13 | 69 | 108 | 0.329 | 0.514 |
| Block I | 18 | 18 | 12 | 6 | 48 | 48 | 0.444 | 0.444 |
| Block | Number of Relations Received | Image Matrix | ||||||
|---|---|---|---|---|---|---|---|---|
| Block I | Block II | Block III | Block IV | Block I | Block II | Block III | Block IV | |
| Block I | 20 | 21 | 35 | 13 | 69 | 49 | 0.411 | 0.292 |
| Block II | 14 | 18 | 61 | 22 | 97 | 78 | 0.462 | 0.371 |
| Block III | 17 | 39 | 37 | 13 | 69 | 108 | 0.329 | 0.514 |
| Block IV | 18 | 18 | 12 | 6 | 48 | 48 | 0.444 | 0.444 |
| Variables | Non-Standardized Regression Coefficient | Standardized Regression Coefficient | Probability of Significance | Probability A | Probability B |
|---|---|---|---|---|---|
| Intercept term | 0.379 | 0.000 | --- | --- | --- |
| 0.003 | 0.162 | 0.042 | 0.042 | 0.958 | |
| 0.000001 | 0.080 | 0.038 | 0.038 | 0.962 | |
| 0.111 | 0.047 | 0.279 | 0.279 | 0.722 | |
| −0.001 | −0.013 | 0.408 | 0.592 | 0.408 | |
| −0.000001 | −0.153 | 0.042 | 0.959 | 0.042 | |
| 0.085 | 0.062 | 0.029 | 0.029 | 0.971 |
Disclaimer/Publisher’s Note: The statements, opinions and data contained in all publications are solely those of the individual author(s) and contributor(s) and not of MDPI and/or the editor(s). MDPI and/or the editor(s) disclaim responsibility for any injury to people or property resulting from any ideas, methods, instructions or products referred to in the content. |
© 2023 by the authors. Licensee MDPI, Basel, Switzerland. This article is an open access article distributed under the terms and conditions of the Creative Commons Attribution (CC BY) license (https://creativecommons.org/licenses/by/4.0/).
Share and Cite
Huang, J.; Jin, H.; Ding, X.; Zhang, A. A Study on the Spatial Correlation Effects of Digital Economy Development in China from a Non-Linear Perspective. Systems 2023, 11, 63. https://doi.org/10.3390/systems11020063
Huang J, Jin H, Ding X, Zhang A. A Study on the Spatial Correlation Effects of Digital Economy Development in China from a Non-Linear Perspective. Systems. 2023; 11(2):63. https://doi.org/10.3390/systems11020063
Chicago/Turabian StyleHuang, Jie, Huali Jin, Xuhui Ding, and Aihua Zhang. 2023. "A Study on the Spatial Correlation Effects of Digital Economy Development in China from a Non-Linear Perspective" Systems 11, no. 2: 63. https://doi.org/10.3390/systems11020063
APA StyleHuang, J., Jin, H., Ding, X., & Zhang, A. (2023). A Study on the Spatial Correlation Effects of Digital Economy Development in China from a Non-Linear Perspective. Systems, 11(2), 63. https://doi.org/10.3390/systems11020063