Article

Spatiotemporal Analysis of the Coupling Coordination Degree between Haze Disaster and Urbanization Systems in China from 2000 to 2020

1
School of Geography Science and Geomatics Engineering, Suzhou University of Science and Technology, Suzhou 215009, China
2
College of Resources and Environment, Xingtai University, Xingtai 054001, China
3
Aerospace Information Research Institute, Chinese Academy of Sciences, Beijing 100094, China
4
Department of Geography and Environmental Studies, Wollo University, Dessie P.O. Box 1145, Ethiopia
5
School of Civil Architectural Engineering, Shandong University of Technology, Zibo 255000, China
*
Author to whom correspondence should be addressed.
Systems 2022, 10(5), 150; https://doi.org/10.3390/systems10050150
Submission received: 15 August 2022 / Revised: 4 September 2022 / Accepted: 8 September 2022 / Published: 12 September 2022
(This article belongs to the Section Systems Practice in Natural Science)

Abstract

:
Quantitative evaluation of the coupling coordination degree (CCD) between regional haze the disaster risk index (HRI) and urbanization development index level (UDI) is of great significance for the realization of regional sustainable development goals. Given the lack of the combination of remote sensing and statistical data to evaluate the CCD between two systems, the Chinese mainland’s 31 provinces and autonomous regions were taken to evaluate their HRI and UDI by building index systems. Then, an entropy method and one improved coupling coordination model were used to calculate and analyze the spatiotemporal characteristics of CCD between HRI and UDI during 2000–2020. The results showed that: (1) From 2000 to 2020, the value of HRI in China showed a “W” type change trend with its value increased from 0.7041 in 2000 to 0.8859 in 2020, indicating that haze pollution level showed a fluctuating downward trend; (2) From 2000 to 2020, China’s UDI values showed a gradual upward trend with its value increased from 0.1647 in 2000 to 0.4640 in 2020, with an average annual growth rate of 8.63%; (3) From 2000 to 2020, CCD values between HRI and UDI showed a fluctuating upward trend with its value increased from 0.5374 in 2000 to 0.7781 in 2020, with an average annual growth rate of 2.13%; the overall level of China’s CCD had raised from low coordination to moderate coordination, and eastern coastal provinces had higher CCD values, while those of central and western provinces had lower CCD values; (4) HRI, UDI and CCD could be well fitted with the R2 of 0.9869. Specifically, UDI had a higher contribution to improving the CCD than the HRI.

1. Introduction

Since 1978, when China implemented the policy of reform and opening up, the level of urbanization has continuously increased [1]. According to the China Statistical Yearbook (2021) published by the National Bureau of Statistics, the proportion of China’s urban population increased from 17.92% in 1978 to 63.89% in 2020, with an average annual growth rate of 1.09% [2]. Based on the United Nations report, the global share of urban population is expected to reach 66% by 2050 [3]. However, along with the rapid increase in the level of urbanization in China, a series of environmental problems have arisen accordingly, such as the decline of air quality [4] and the frequent occurrence of haze disasters [5]. In recent years, however, the country has introduced a series of policies and measures to rectify the haze disaster, although local areas showed a tendency to deteriorate, instead of being cured [6]. In northern China, for example, the phenomenon of “haze urban agglomeration” occurs frequently in winter [6]. In addition, the continuous occurrence of haze disasters not only affects the normal production and life of the region, but also has a certain hindering effect on the healthy development of the regional urbanization process [6,7]. Therefore, it is important to quantitatively evaluate the spatial and temporal evolution of the coupling and coordination level between regional haze disaster occurrence risk and urbanization.
Until now, many scholars at home and abroad have conducted studies on haze disaster risk and urbanization levels. Specifically, in terms of haze disaster research: Liu et al. analyzed the spatiotemporal distribution of haze disaster and its interaction relationship with the economy and the energy structure system [8]; Han and Cao utilized a spatial lag model to test the haze disaster pollution level and found that PM2.5 was a representative index of the urban agglomeration haze disaster pollution level [9]; Liu et al. adopted a principal component analysis method and quantitatively evaluated the risk of haze disaster in Hunan prefecture-level cities by selecting 12 indicators from three aspects: the sensitivity of the pregnant environment; the hazard of haze components and the vulnerability of disaster-bearing bodies [10]; Dotse et al. examined the spatiotemporal distribution of PM10 based on MODIS data and concluded that temperature, rainfall and humidity were positively correlated with PM10 values [11]; Zha et al. derived one normalized difference haze index by analyzing the spectral difference of haze and haze-free days and found that the average correlation coefficient with in situ observed PM10 was 0.66 [12]; Han et al. promoted one modified normalized difference haze index and found that the average correlation coefficient with in situ observed PM2.5 was 0.59 [13]. In sum, existing studies mainly utilized statistical data and remote sensing data. Specifically, remote sensing data included satellite-derived datasets, such as PM10, PM2.5, SO2, NOx, CO2, and as such, PM2.5 and PM10 were widely used [14,15]. As for research methods, existing studies mainly used principal component analysis [10], indicator construction [12,13], fuzzy mathematics [16] and linear propensity estimation method [17]. Regarding research scale, existing studies mainly focused on the city or urban agglomeration scale.
Urbanization is one dimension of the social change process and a complicated concept with demographic, sociocultural, economic, and administrative dimensions [18,19]. Until now, the main method of urbanization evaluation has been the index evaluation method. Specifically, the urbanization level was evaluated by scientifically selecting indicators from different aspects, including economy, society, spatiality and population [20,21]. For instance, Fu et al. evaluated the urbanization level by selecting 15 indicators and examined its coupling coordination degree with the eco-environment [22]. Generally, existing studies had achieved fruitful results, however, there still existed several shortcomings. Firstly, existing studies had mainly focused on the city or urban agglomeration scale, however, there was a relative lack of long-time series studies at the country scale. Secondly, existing studies had mainly focused on single urbanization or a single haze disaster risk study, while studies evaluating the level of coupling coordination between the two were rare. Coupling, originating from physics, is a phenomenon in which two or more subsystems in a whole physical system affect each other via miscellaneous interactions [23,24]. From a synergetic point of view, the coupling action and its degree of coordination determine what sequence and structure the system goes to when it reaches a critical region. For example, Fan et al. investigated the coupling relationship between the air quality and urbanization level in Shandong province [25]. Thirdly, existing studies mainly applied the coupling coordination degree model (CCDM) directly, however, the CCDM had only been used to calculate the geometric mean of the coupling degree and comprehensive development level. Therefore, CCDM had failed to distinguish cases with different coupling degrees and comprehensive development levels but the same coupling coordination degree [26].
Therefore, in response to these shortcomings, this paper adopted statistical yearbook data and PM2.5 data retrieved from remote sensing data and took China as the study area. Initially, the haze risk and urbanization level index systems were obtained. Next, the entropy method was used to assign weight to each indicator. Then, the haze disaster risk index (HRI) and urbanization development index (UDI) were employed to analyze China’s haze disaster risk and urbanization level from 2000 to 2020. Finally, one coupling coordination degree model was modified and applied to calculate the coupling coordination degree (CCD). In addition, spatiotemporal analysis of CCD was performed at the county and province levels. This paper is organized as follows: the Material and Methods section describes the study area and methods, which include the index system construction, indicator weights determination, comprehensive index calculation and calculation of CCD; the Results section presents the spatiotemporal distribution and change trend of the HRI, UDI and CCD at country and provincial scales; the Discussion section validates four aspects of urbanization, explores the relationship among the HRI, UDI and CCD, and presents the implications and limitations of this study; the Conclusion section presents the main findings of this paper.

2. Materials and Methods
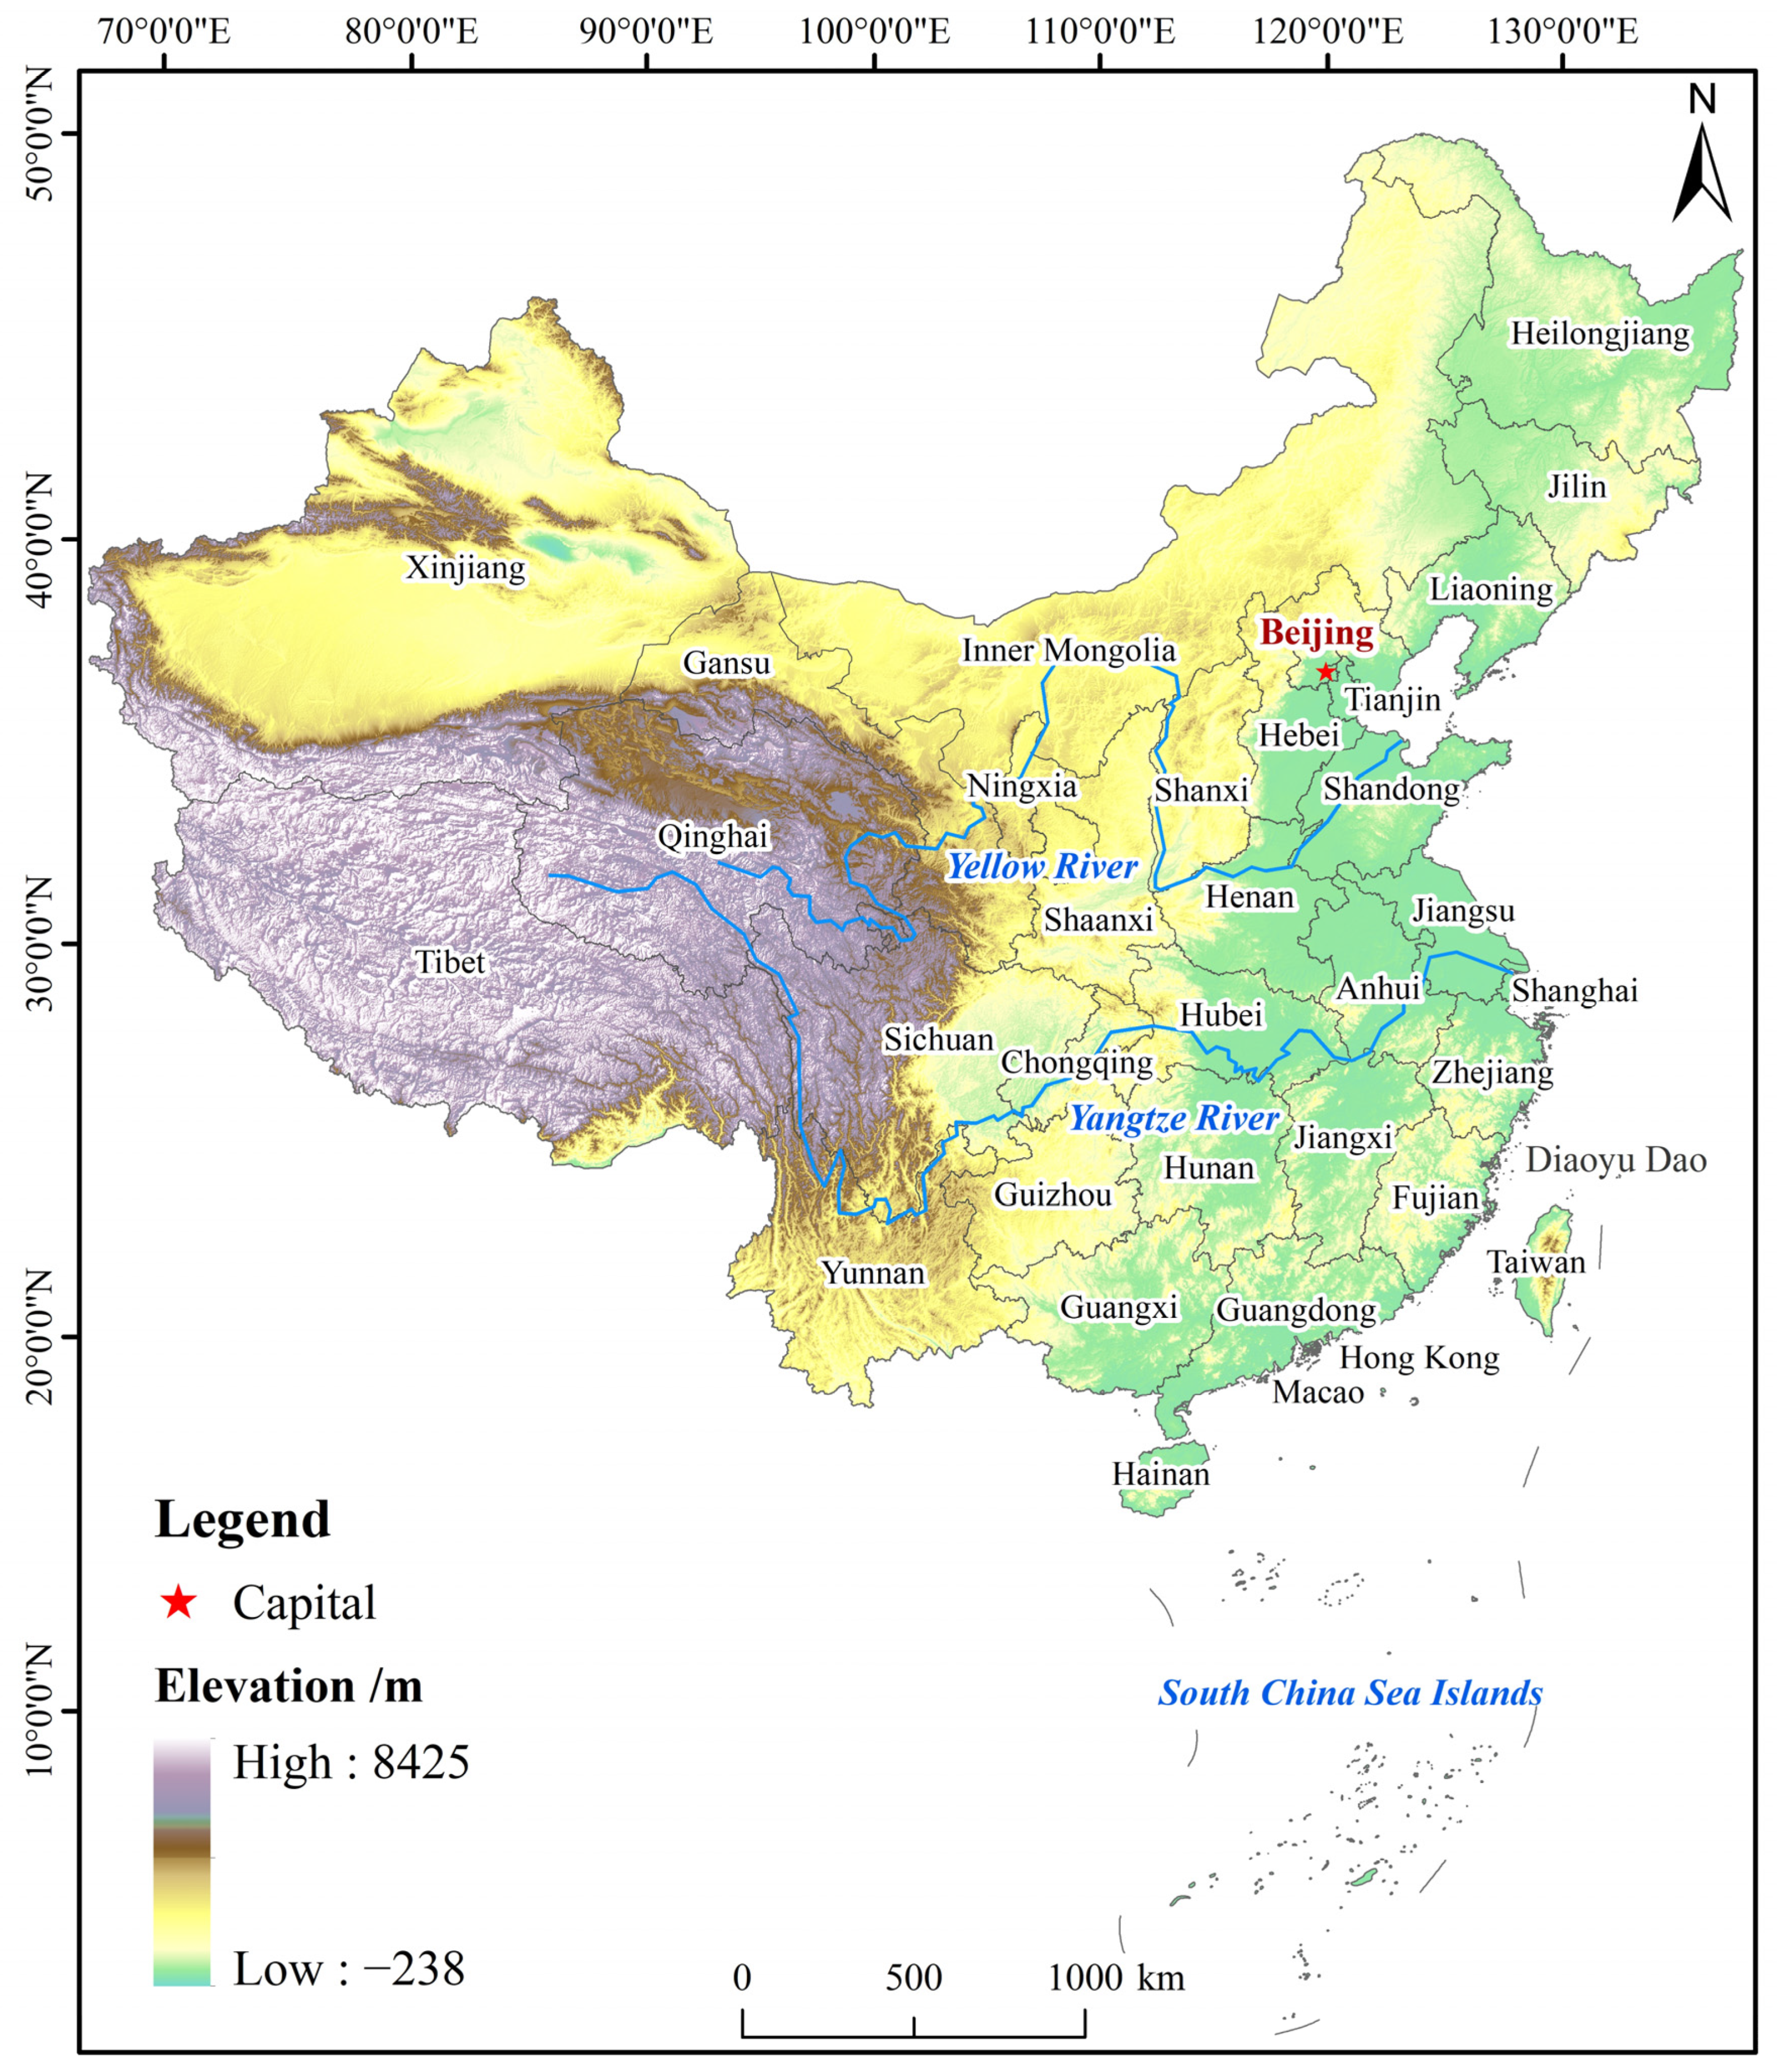
2.1. Study Area

China is located in eastern Asia, its latitude and longitude range is 73°29′∼135°20′ E, 3°31′∼53°33′ N and its territory covers approximately 9.6 million square kilometers (Figure 1). It includes 23 provinces, five autonomous regions, four municipalities, and two special administrative regions. China has a complex topography, diverse climate types, and complex natural conditions. In addition, China is one of the richest countries in the world in terms of biodiversity [27]. According to the China Statistical Yearbook (2021) [2], China’s total population and regional GDP in 2020 were about 1.412 billion people and 101.59 trillion yuan, respectively. However, with the gradual acceleration of urbanization, the total emission of pollutants in the country was still relatively high, for example, the total emission of sulfur dioxide in 2020 was 3.182 million tons [2], which hindered the healthy development of the urbanization process to some extent. To this end, quantitative evaluation of the spatiotemporal evolution of CCD between HRI and UDI not only helped to increase the understanding of the interaction status between the two in a timely manner, but also provided a certain reference basis for policymakers in the government and other related departments. In this study, Hong Kong, Macao and Taiwan were excluded; only mainland China was analyzed.

2.2. Data Sources

In this study, the data sources included remote sensing datasets and statistical yearbooks. Remote sensing data included the annual average PM2.5 dataset with 1 km spatial resolution in China (https://zenodo.org/record/6398971, accessed on 15 January 2022), which was produced from the MCD19A2, hourly PM2.5 in situ data, and other auxiliary datasets using artificial intelligence by considering the spatiotemporal heterogeneity of air pollution. Specifically, MCD19A2 provided daily land aerosol optical depth (AOD) product (https://lpdaac.usgs.gov/products/mcd19a2v006/, accessed on 15 January 2022). This dataset was of high quality, with a cross-validation coefficient of determination of 0.92 and a root mean square error of 10.76 ug/m3 on a daily basis [28,29]. The statistical yearbooks used included the China Statistical Yearbook, China City Statistical Yearbook and provincial statistical yearbooks from 2001 to 2021.

2.3. Methods

The research methodology of this paper consisted of four main parts, which were: (1) construction of the index system; (2) determination of the index weights; (3) calculation of the comprehensive index (including the haze disaster risk index and the urbanization development index); and (4) calculation of the coupling coordination degree index. Section 2.3.1, Section 2.3.2, Section 2.3.3 and Section 2.3.4 introduce the calculation formula in detail.

2.3.1. Index System Construction

When constructing the haze disaster risk index system, it is necessary to consider not only fine particulate matter but also pollutant emissions, which are related to the main components of haze. Currently, researchers believed that haze was mainly composed of sulfur dioxide, smoke and dust, nitrogen oxides, and respirable particulate matter, which can give the sky a yellow or gray color [14,15]. In academia, haze pollution is generally accepted as a weather condition where visibility is less than 10 km, and humidity is less than 90% [30]. Among them, respirable particulate matter mainly included PM10 and PM2.5. PM2.5 has a small particle size, and long transmission distance, is rich in toxic substances and can cause harm to the human blood circulation system [6,30]. Therefore, a large number of studies had used this indicator to characterize the risk of regional haze occurrence [31,32]. In this paper, based on the reference of previous studies [9,14,15,32,33,34,35,36,37], a total of three indicators were selected to construct the haze disaster risk index following the principles of validity, representativeness, comprehensiveness and data accessibility. The three indicators were the annual average concentration of PM2.5 (μg/m3), sulfur dioxide emissions per 10,000 people (t) and smoke and dust emissions per 10,000 people (t).
When constructing the urbanization development index, indicators included not only urban population, but also economic, social and spatial aspects. Therefore, based on existing studies [20,38,39,40,41,42,43,44,45,46], this paper selected a total of 11 indicators from four attributes: economy; society; spatiality; and population. These attributes and their corresponding indicators were summarized in Table 1.

2.3.2. Determination of the Index Weights

At present, the weight determination methods could include three main categories, which were subjective weighting methods, including the Delphi method and analytic hierarchy process (AHP), objective weighting methods, including principal component analysis (PCA) and the entropy method (EM), and combined weighting methods. Among them, the subjective weighting method required experts to reasonably determine the weights based on actual problems, knowledge and experience, so it is highly subjective. In contrast, the objective weighting method determines the weights based on the relationship between the original data, which is objective and usually has a strong mathematical theoretical basis, and therefore has wide application in practice. The EM is based on the concept of entropy in physics, and its meaning indicates a measure of the degree of uncertainty in the state of the system. Therefore, the weight of each sub-indicator is determined based on the magnitude of the entropy value, i.e., the degree of variation in each indicator value. Hence, this paper used the entropy method to calculate the weight values of each sub-indicator. Before calculating the weights, the indicators needed to be standardized according to their positive and negative directions using Equations (1) and (2), after which the weight values of each sub-indicator were calculated using Equations (3)–(7), as shown in Table 1.
X n o r + = X i X min X max X min
X n o r = X max X i X max X min
where X n o r + denotes the standardized value of the positive indicator; X n o r denotes the standardized value of the negative indicator; X max and X min is the maximum and minimum value of the original sample data, respectively; X i is the value of the ith indicator.
p i j = r i j i = 1 m r i j
e j = k i = 1 m p i j ln p i j
D j = 1 e j
w j = D j j = 1 n D j
k = 1 ln m
where p i j denotes the contribution of the ith evaluation unit to the jth indicator; e j denotes the total contribution of all evaluation units to the jth indicator; D j denotes the information redundancy of indicator j; w j denotes the indicator weighting factor.

2.3.3. Calculation of the Comprehensive Index

After the weights were determined based on the entropy method, the haze disaster risk index (HRI) and urbanization development index (UDI) values were finally determined using the integrated weighting method, and their calculation formulas were shown in Equations (8) and (9), respectively.
H R I = j = 1 3 ( X n o r w j )
U D I = 1 4 ( P U + E U + T U + S U )
where P U , E U , T U and S U , respectively, are the values of population urbanization, economy urbanization, society urbanization and spatiality urbanization indicators. Both H R I and U D I were between zero and one, where a higher value of H R I indicated a lower haze pollution as all sub-indicators belonged to negative indicators and all were normalized based on Equation (2); while a higher value of U D I indicated a higher level of regional urbanization development. The calculation formula of each index value was shown in Equations (10)–(13).
P U = j = 1 2 ( X n o r + w j )
E U = j = 1 4 ( X n o r + w j )
T U = j = 1 3 ( X n o r + w j )
S U = j = 1 2 ( X n o r + w j )

2.3.4. Calculation of the Coupling Coordination Degree Index

Since existing CCDM had only been used to calculate the geometric mean of the coupling degree and comprehensive development level, it failed to distinguish cases with different coupling degrees and comprehensive development levels but the same coupling coordination degree [26]. In this context, Ji et al. improved the existing CCDM from the distance perspective [26]. Specifically, taking coupling degree and comprehensive development degree values as the X-axis and Y-axis, the distance from the origin point to the line segment composed of coupling degree and comprehensive development degree values was the initial CCD value, thus a new CCD index was established by normalizing the initial CCD index. The calculation formulas are shown in Equations (14)–(16).
C = 2 × { U 1 × U 2 ( U 1 + U 2 ) 2 } 1 2
T = α × U 1 + β × U 2
C C D = 2 × C × T C 2 + T 2
where C is the coupling degree of the subsystems; T is the comprehensive development degree of the two subsystems; C C D represents the improved coupling coordination index value; U 1 and U 2 represented the haze disaster risk and urbanization development subsystems. α and β were the weight value of the two subsystems. This paper believed that haze disaster risk and urbanization development subsystems were equally important, and their values were both equal to 0.5; C C D was between 0–1, and the larger the value, the higher the coupling coordination degree between haze disaster risk and urbanization development level. Based on the existing studies [26,40,44,47,48,49], C C D was divided into five grades equally, and the classification criteria of each class is shown in Table 2.

3. Results

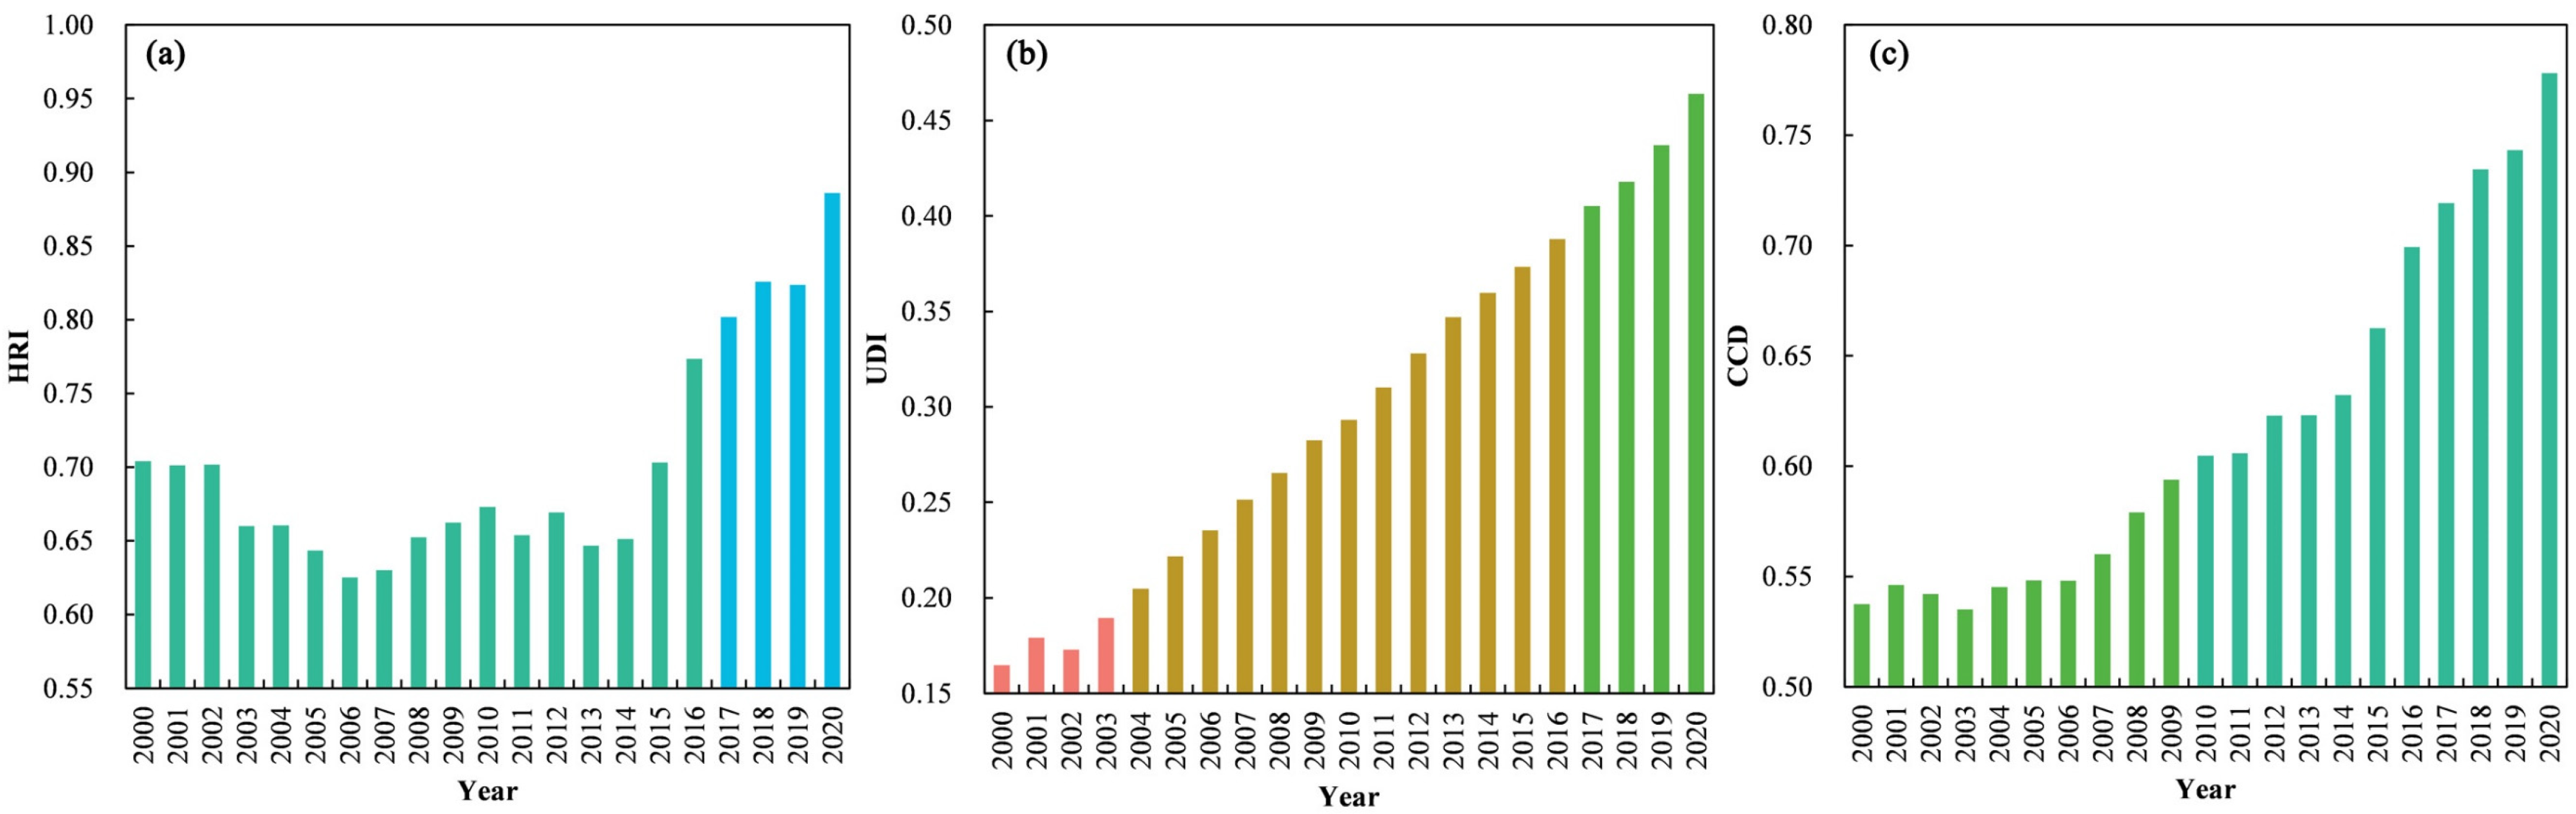
3.1. Time Series Change Characteristics of Haze Disaster Risk Level, Urbanization Development Level and the Coupling Coordination between the Two

The time series change characteristics of the haze disaster risk level, urbanization development level and the coupling coordination between the two were shown in Figure 2.
According to Figure 2a, the haze disaster risk index in China showed a fluctuating upward trend during the period 2000–2020, showing a “W”-shaped change. The haze disaster risk index value increased from 0.7041 in 2000 to 0.8859 in 2020, an increase of 25.82%, indicating that, overall, the haze pollution level in China showed a decreasing trend. Specifically, the haze disaster risk index could be divided into four periods based on its changing trend. In the first period (2000–2006), in which the haze disaster risk index values showed a decreasing trend, the overall haze pollution level increased gradually. The haze disaster risk index gradually increased in the second period (2006–2010), reflecting a gradual decrease in the pollution level. In the third period (2011–2014), the haze disaster risk index was relatively stable, but the index value was closer to that of the second stage, indicating that the pollution level had entered a relatively stable period. The haze disaster risk index was increasing in the fourth period (2015–2020), reflecting the decreasing level of haze disaster risk level in China, which was related to the various environmental management measures implemented during the 13th Five-Year Plan, including the implementation of the new development framework and the green development concept. According to Figure 2b, China’s urbanization development index showed a steady upward trend as its index value increased from 0.1647 in 2000 to 0.4640 in 2020, with an average annual growth rate of 8.63%. Since the implementation of reform and opening up of China, the economic level of the people has steadily improved and the urban population has been increasing. In addition, infrastructure investment and construction have been steadily promoted, the comprehensive national power has been improving, and people’s sense of access to infrastructure has been increasing. However, compared with developed countries, there is still a certain gap. In 2020, China’s urbanization development index was only 0.4640. According to Figure 2c, the value of coupling coordination between the two shows a fluctuating upward trend, and its value increased from 0.5374 in 2000 to 0.7781 in 2020, with an average annual growth rate of 2.13%. According to the ranking in Table 2, the coordination ranking improved from low coordination in 2000 to moderate coordination in 2020 and was close to the minimum threshold of high coordination (0.8), indicating a gradual increase in the level of coupling coordination between the two.

3.2. Spatial Change Characteristics of Haze Disaster Risk Level, Urbanization Development Level and the Coupling Coordination Degree of the Two

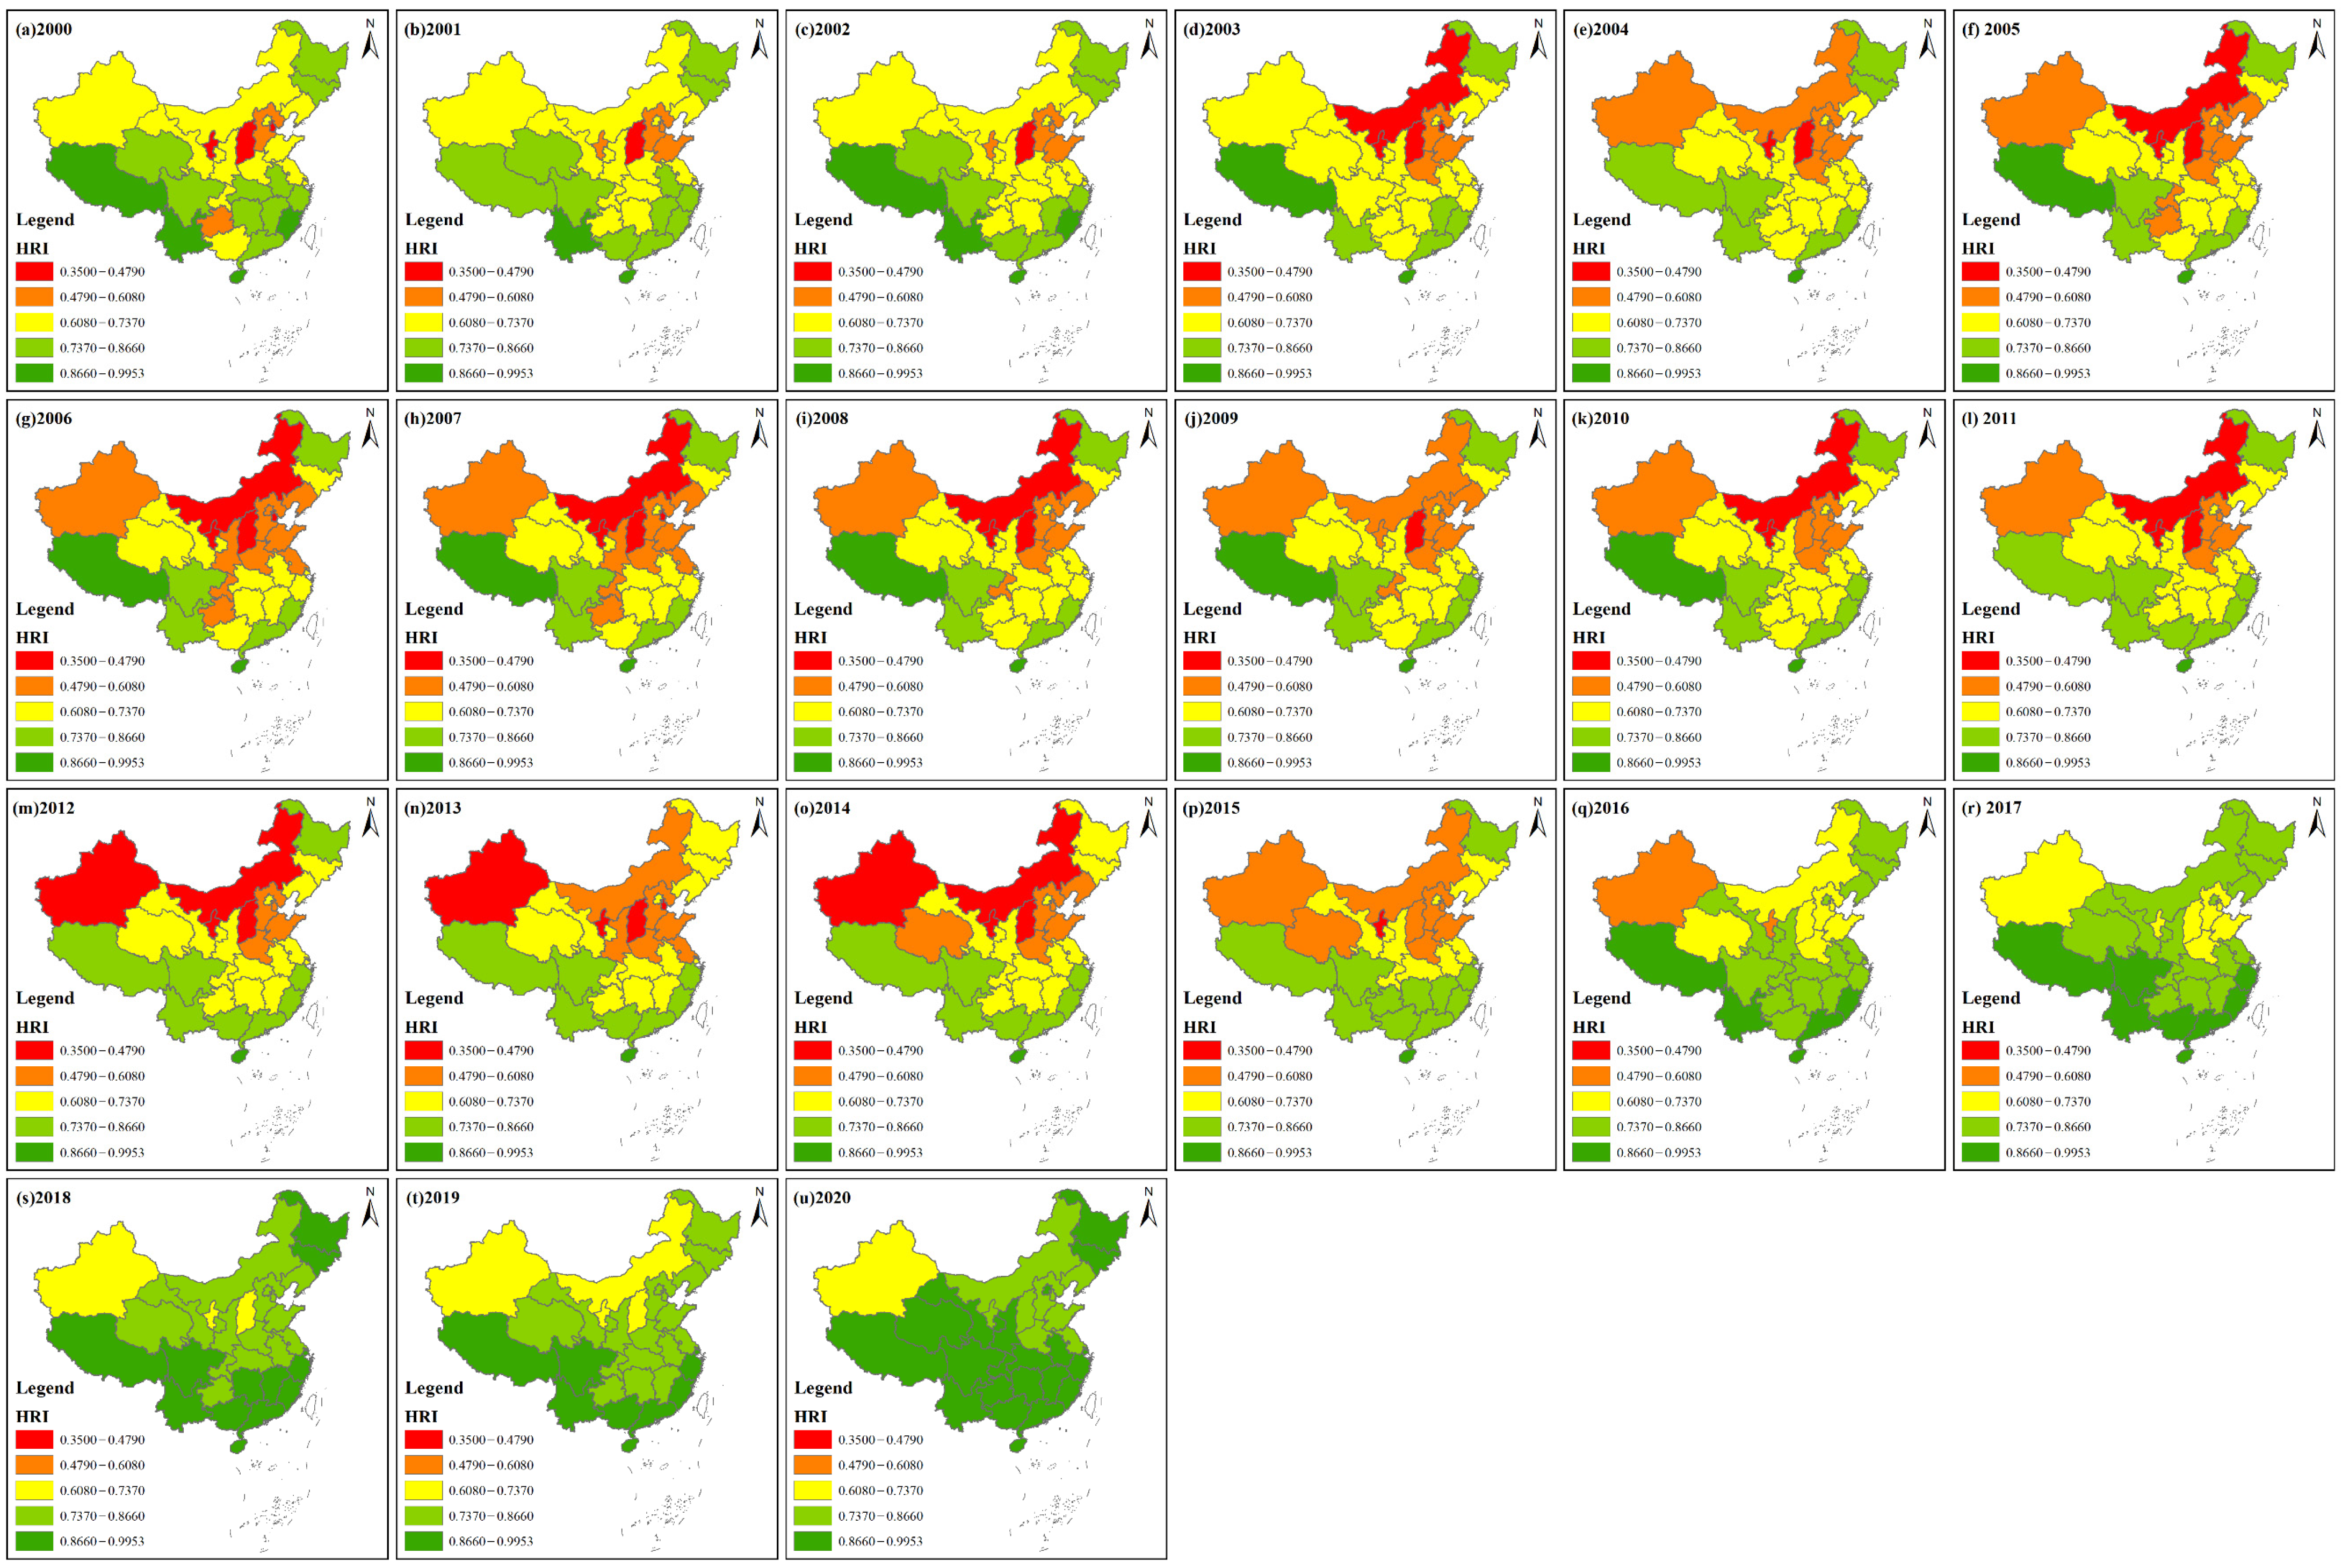
3.2.1. Spatial Change Characteristics of Haze Disaster Risk Level

Figure 3 showed the spatial distribution of haze disaster risk index in China from 2000 to 2020.
According to Figure 3, the overall distribution of haze disaster risk levels in China showed the characteristics of “high in the south and west but low in the north and east”, which is consistent with previous studies. For example, Qi et al. found that northern China had a higher PM2.5 concentration, especially in the North China Plain, which was a center of gravity for haze pollution [32]. In terms of spatial distribution, Shanxi and Ningxia were at the lowest level in 2000, indicating that their haze disaster pollution levels were more serious. Shanxi province, a major coal mining province, also has its pollutant emissions at a high level. In addition to Shanxi, Ningxia and Inner Mongolia haze disaster pollution levels are also located at the highest level, which may be related to overgrazing in Inner Mongolia in recent years. In addition, the increasing desertification in Inner Mongolia exacerbated the occurrence of extreme weather, such as dust storms. The provinces with high haze disaster risk index values were Fujian, Zhejiang, Hainan, Guangdong and Yunnan provinces. These provinces are located in the south, with high forest cover, and most of them are coastal provinces where airflow exchange is not easy for haze pollutants to accumulate. Collectively, during 2000–2020, the haze disaster pollution levels in all provinces except Xinjiang, Yunnan and Hainan showed a reduction to some extent, and their index values show a fluctuating upward trend, indicating that the haze disaster pollution levels in China have been reduced during this 21-year period.

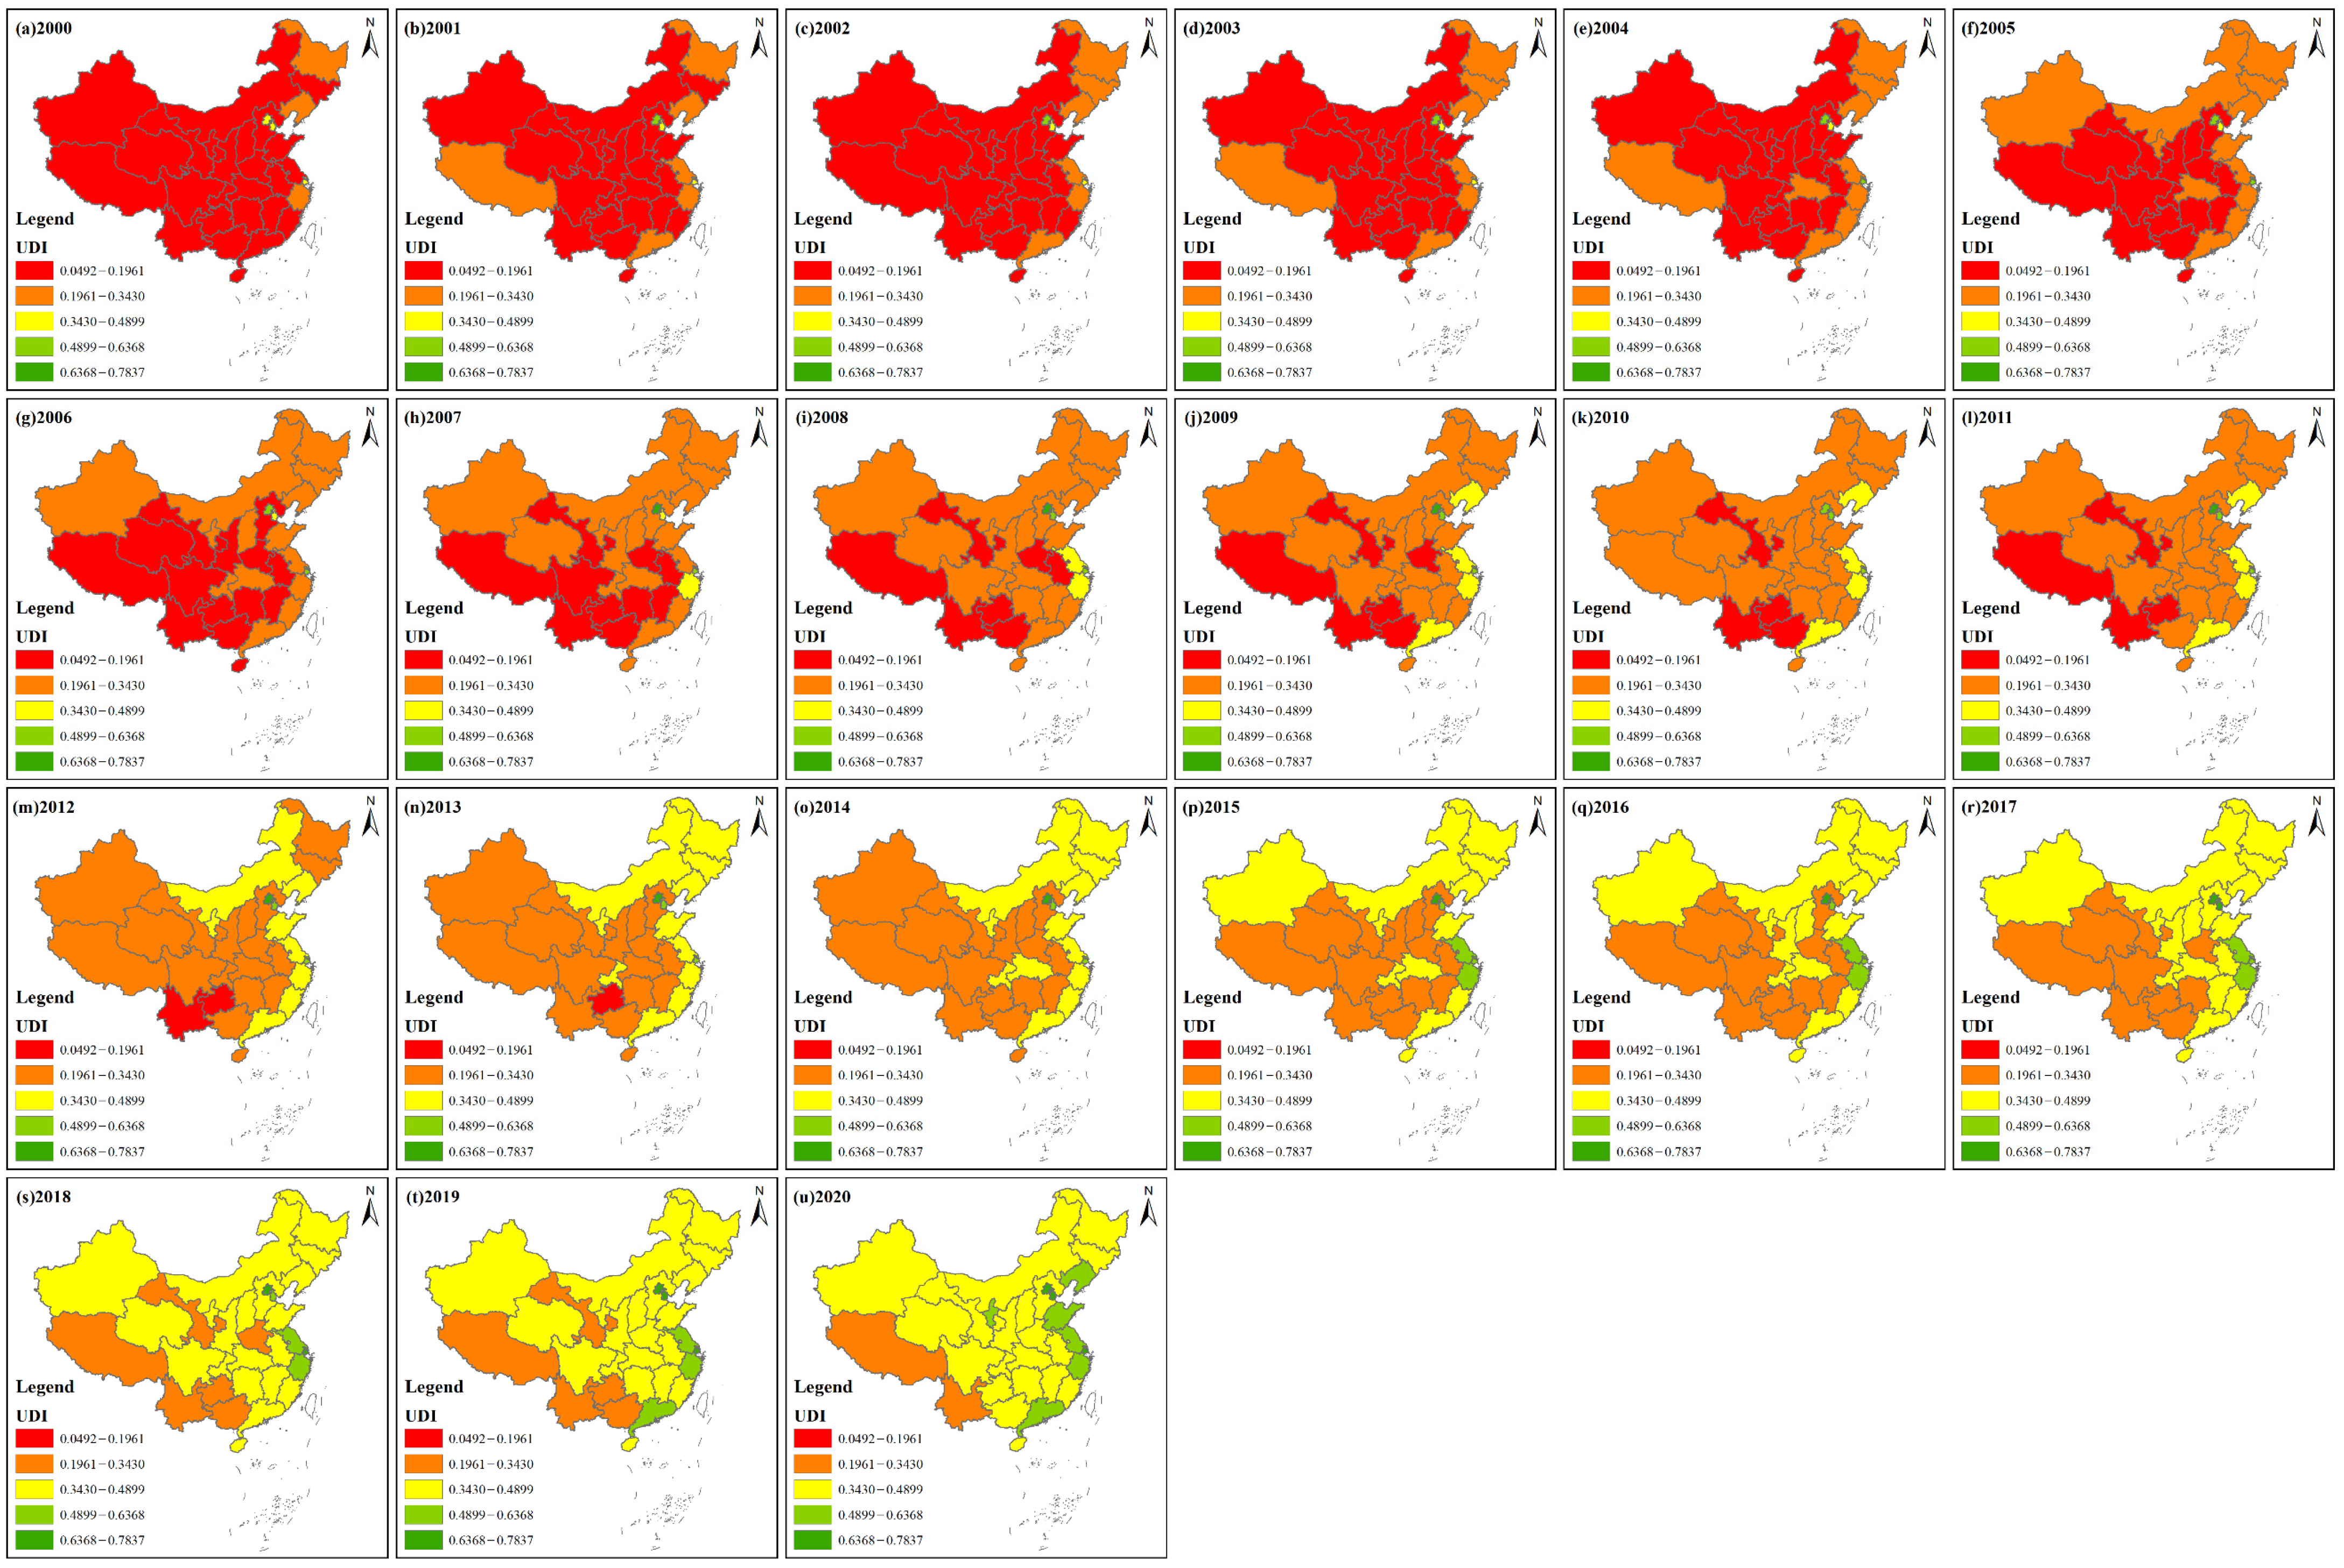
3.2.2. Characteristics of Changes in the Spatial Sequence of Urbanization Development Level

Figure 4 showed the spatial distribution of China’s urbanization development index from 2000 to 2020.
According to Figure 4, the overall urbanization development level of each province in China during 2000–2020 showed a distribution trend of “high in the east and low in the west”. With the exceptions of Beijing, Shanghai and Tianjin, the urbanization development level of all provinces was low before 2007 (UDI < 0.3430). During the period 2007–2013, all provinces were divided into three echelons of urbanization development. Specifically, the first tier is Beijing, Tianjin, and Shanghai; the second tier is Guangdong, Liaoning, Zhejiang, and Jiangsu, all of which are located on the coast and are among the pioneering reform and opening-up areas with the highest level of economic development in China. The third tier is the majority of the central and western provinces, especially Gansu, Tibet, Yunnan and Guizhou, whose urbanization development levels were located in the third tier for most of the periods. During the period 2014–2020, all provinces were located in the fourth tier and above in terms of the urbanization development level. Specifically, the urbanization development levels of Beijing, Tianjin and Shanghai were located in the highest rank, which means that the urbanization development level values of these regions were higher than 0.6368; the provinces of Jiangsu, Zhejiang and Guangdong were located in the second rank in most of the periods, indicating that their urbanization development level values were higher than 0.4899. For the remaining provinces, especially the central and western provinces, their urbanization development levels were mostly located in the third and fourth ranks, indicating that the urbanization development index values of these provinces were lower than 0.3430. Overall, all provinces manifested improvements in their urbanization development index values by different degrees during 2000–2020, especially Jiangsu and Guangdong, which showed improvement in urbanization development by three levels.

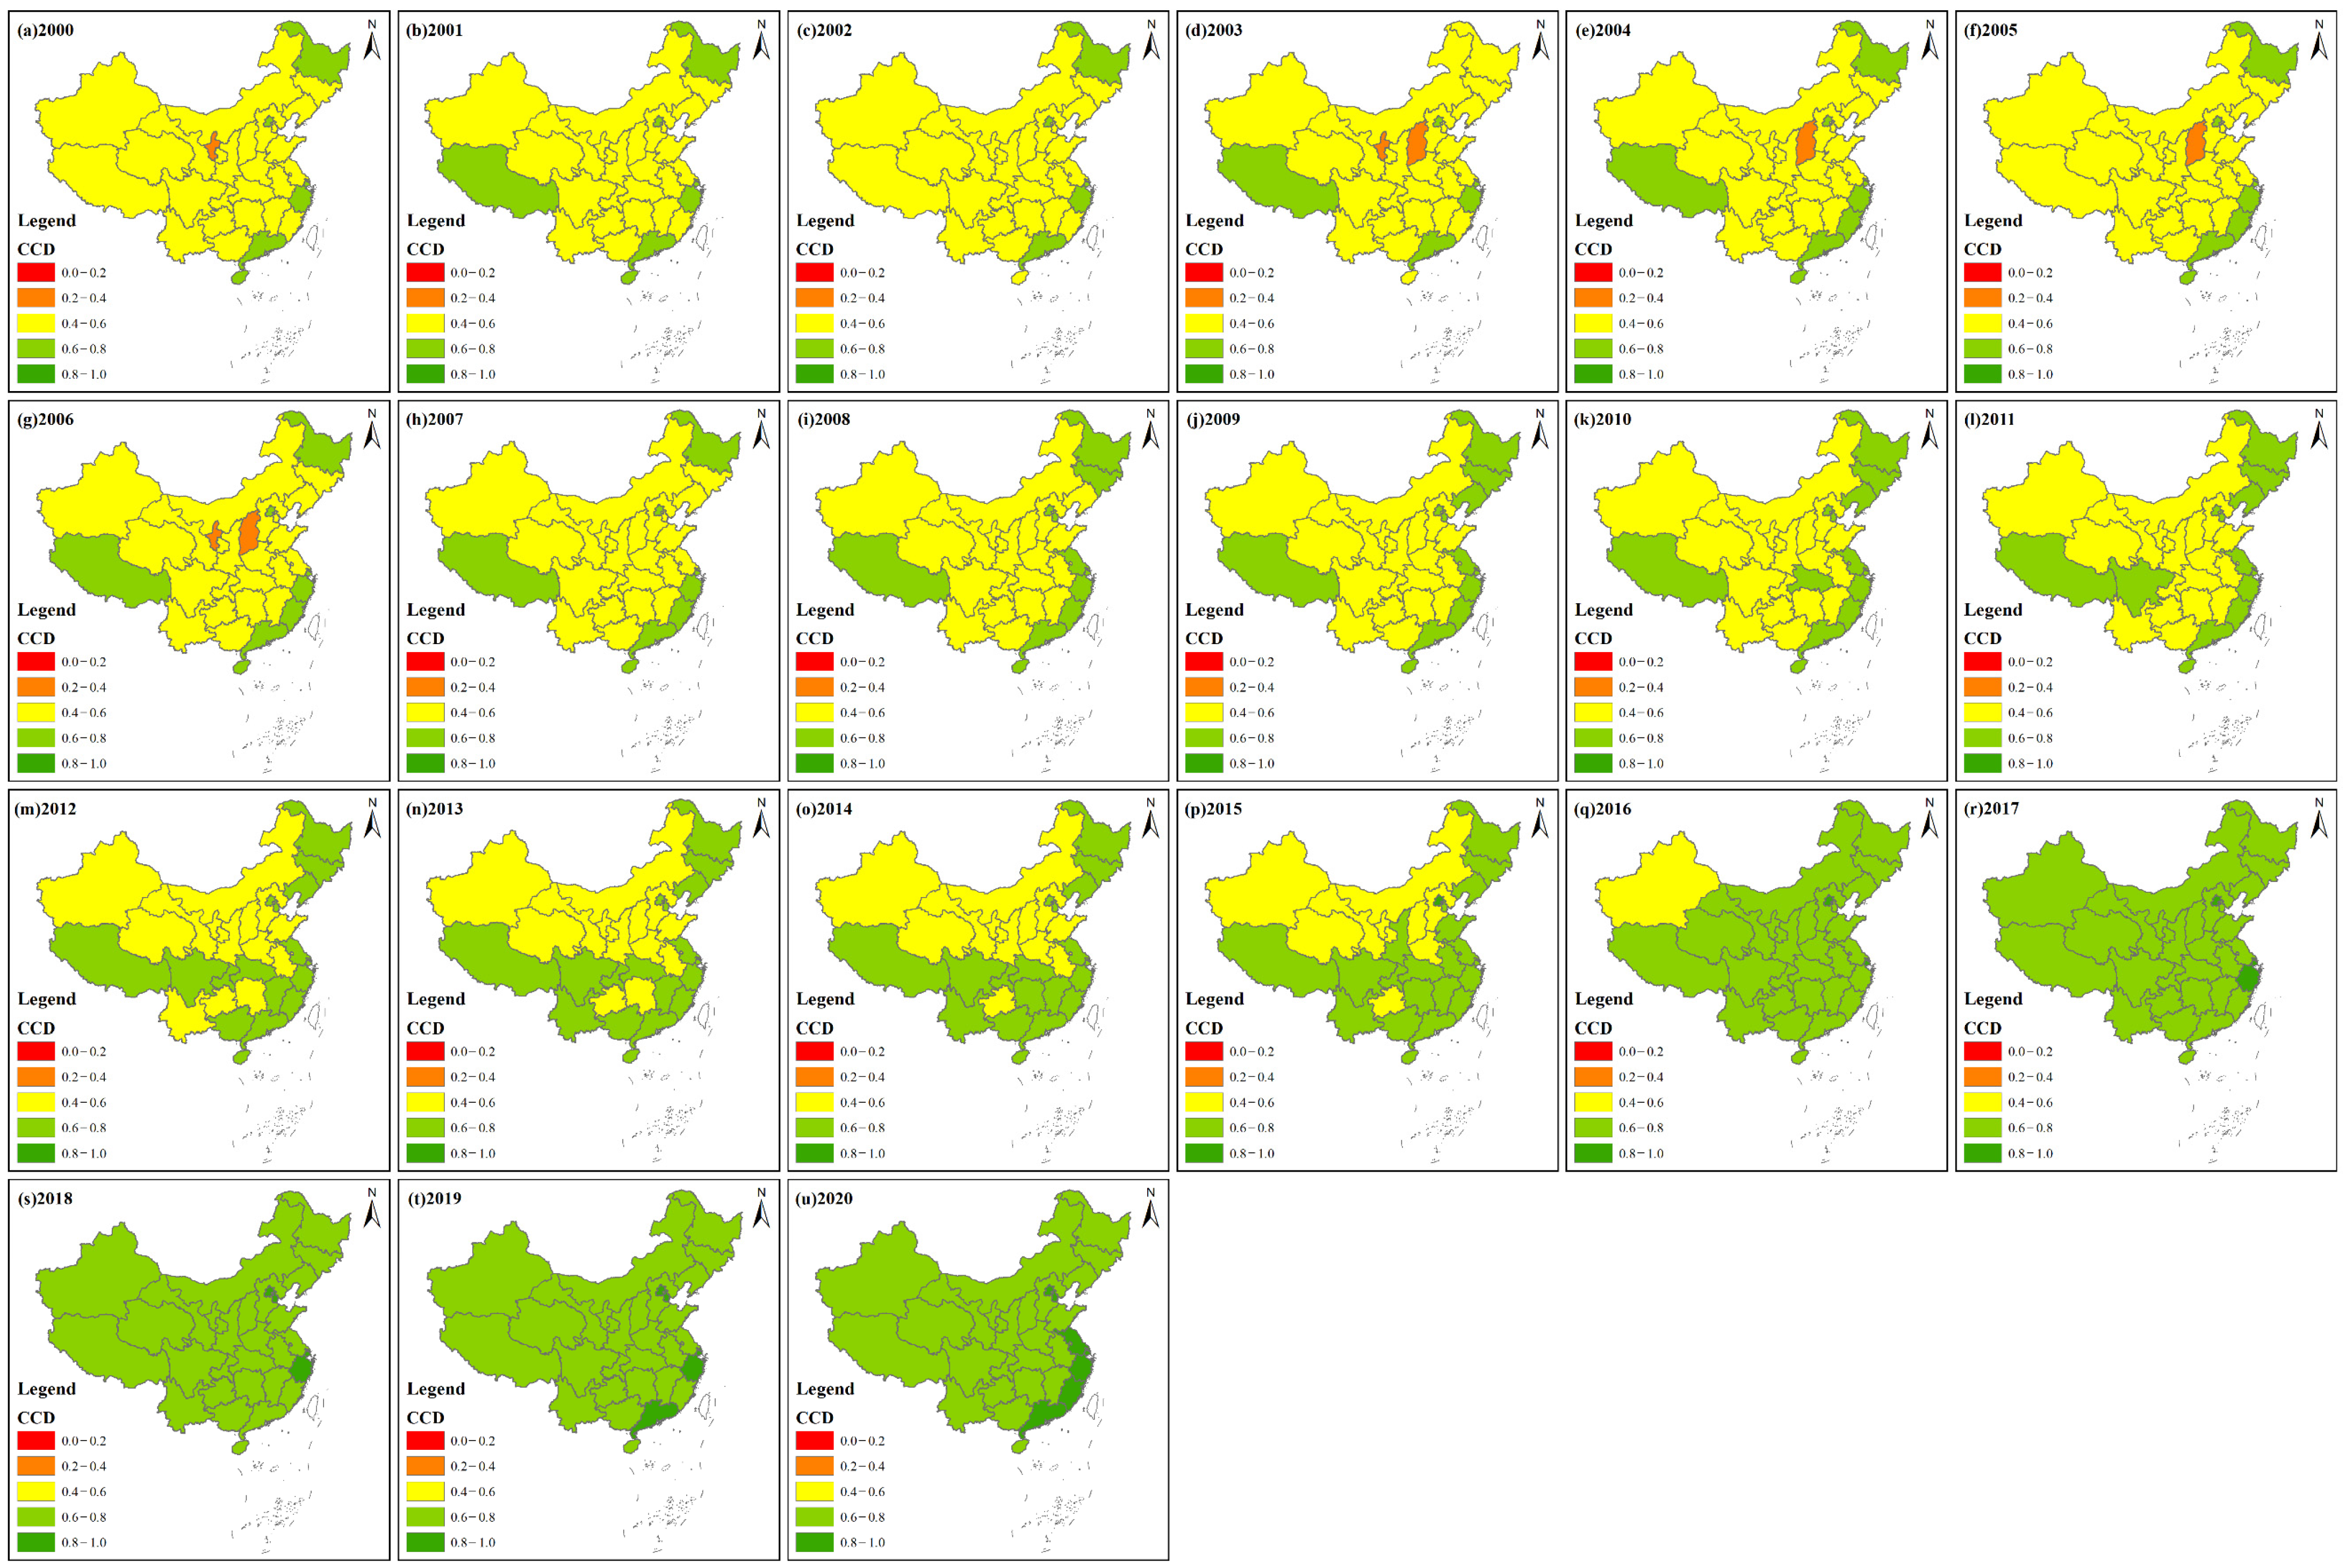
3.2.3. Spatial Sequence Variation in Coupling Coordination

Figure 5 shows the spatial distribution of coupling coordination degree in China from 2000 to 2020.
According to Figure 5, the spatial distribution trend of the coupling coordination between haze disaster risk and urbanization level in China was “high in the east and low in the west”. Specifically, the coupling coordination degree of all provinces was greater than 0.2 in all years. In 2000–2006, Shanxi and Ningxia had low coupling coordination and were in the moderate incoordination level, indicating that their urbanization development and haze disaster pollution levels were relatively low; Guangdong, Zhejiang, Beijing and Shanghai had relatively high coupling coordination in the moderate level; the remaining provinces were basically in the low coordination level. From 2007 to 2014, the coupling coordination of all provinces showed low and moderate coordination, and the number of provinces with low coordination showed a gradually decreasing trend, from the number of 23 in 2007 to 12 in 2014. On the contrary, the number of provinces with a moderate coordination level increased from eight in 2007 to 19 in 2014. In 2015–2016, the coupling coordination of all provinces showed three levels, namely, low, moderate and high coordination. Beijing and Shanghai were found at a high coordination level. With the exception of Xinjiang, in 2016, the remaining provinces were located at the moderate coordination level and above, indicating that the coupling coordination values of these provinces were greater than 0.6. During 2017–2020, all provinces exhibited two levels of coupling coordination— moderate and good coordination. Specifically, the number of provinces with a good coordination level increased from three in 2017 to seven in 2020, including Beijing, Tianjin, Shanghai, Jiangsu, Zhejiang, Fujian and Guangdong. By the end of the study period (2020), with the exception of Beijing, all coastal provinces had lower levels of haze disaster pollution, but their urbanization development levels were in the upper reaches of the country. Collectively, all provinces revealed an increasing trend in the coupling coordination index value during 2000–2020. With the exception of Heilongjiang and Hainan, all provinces improved their coupling coordination rank at different degrees.

4. Discussion

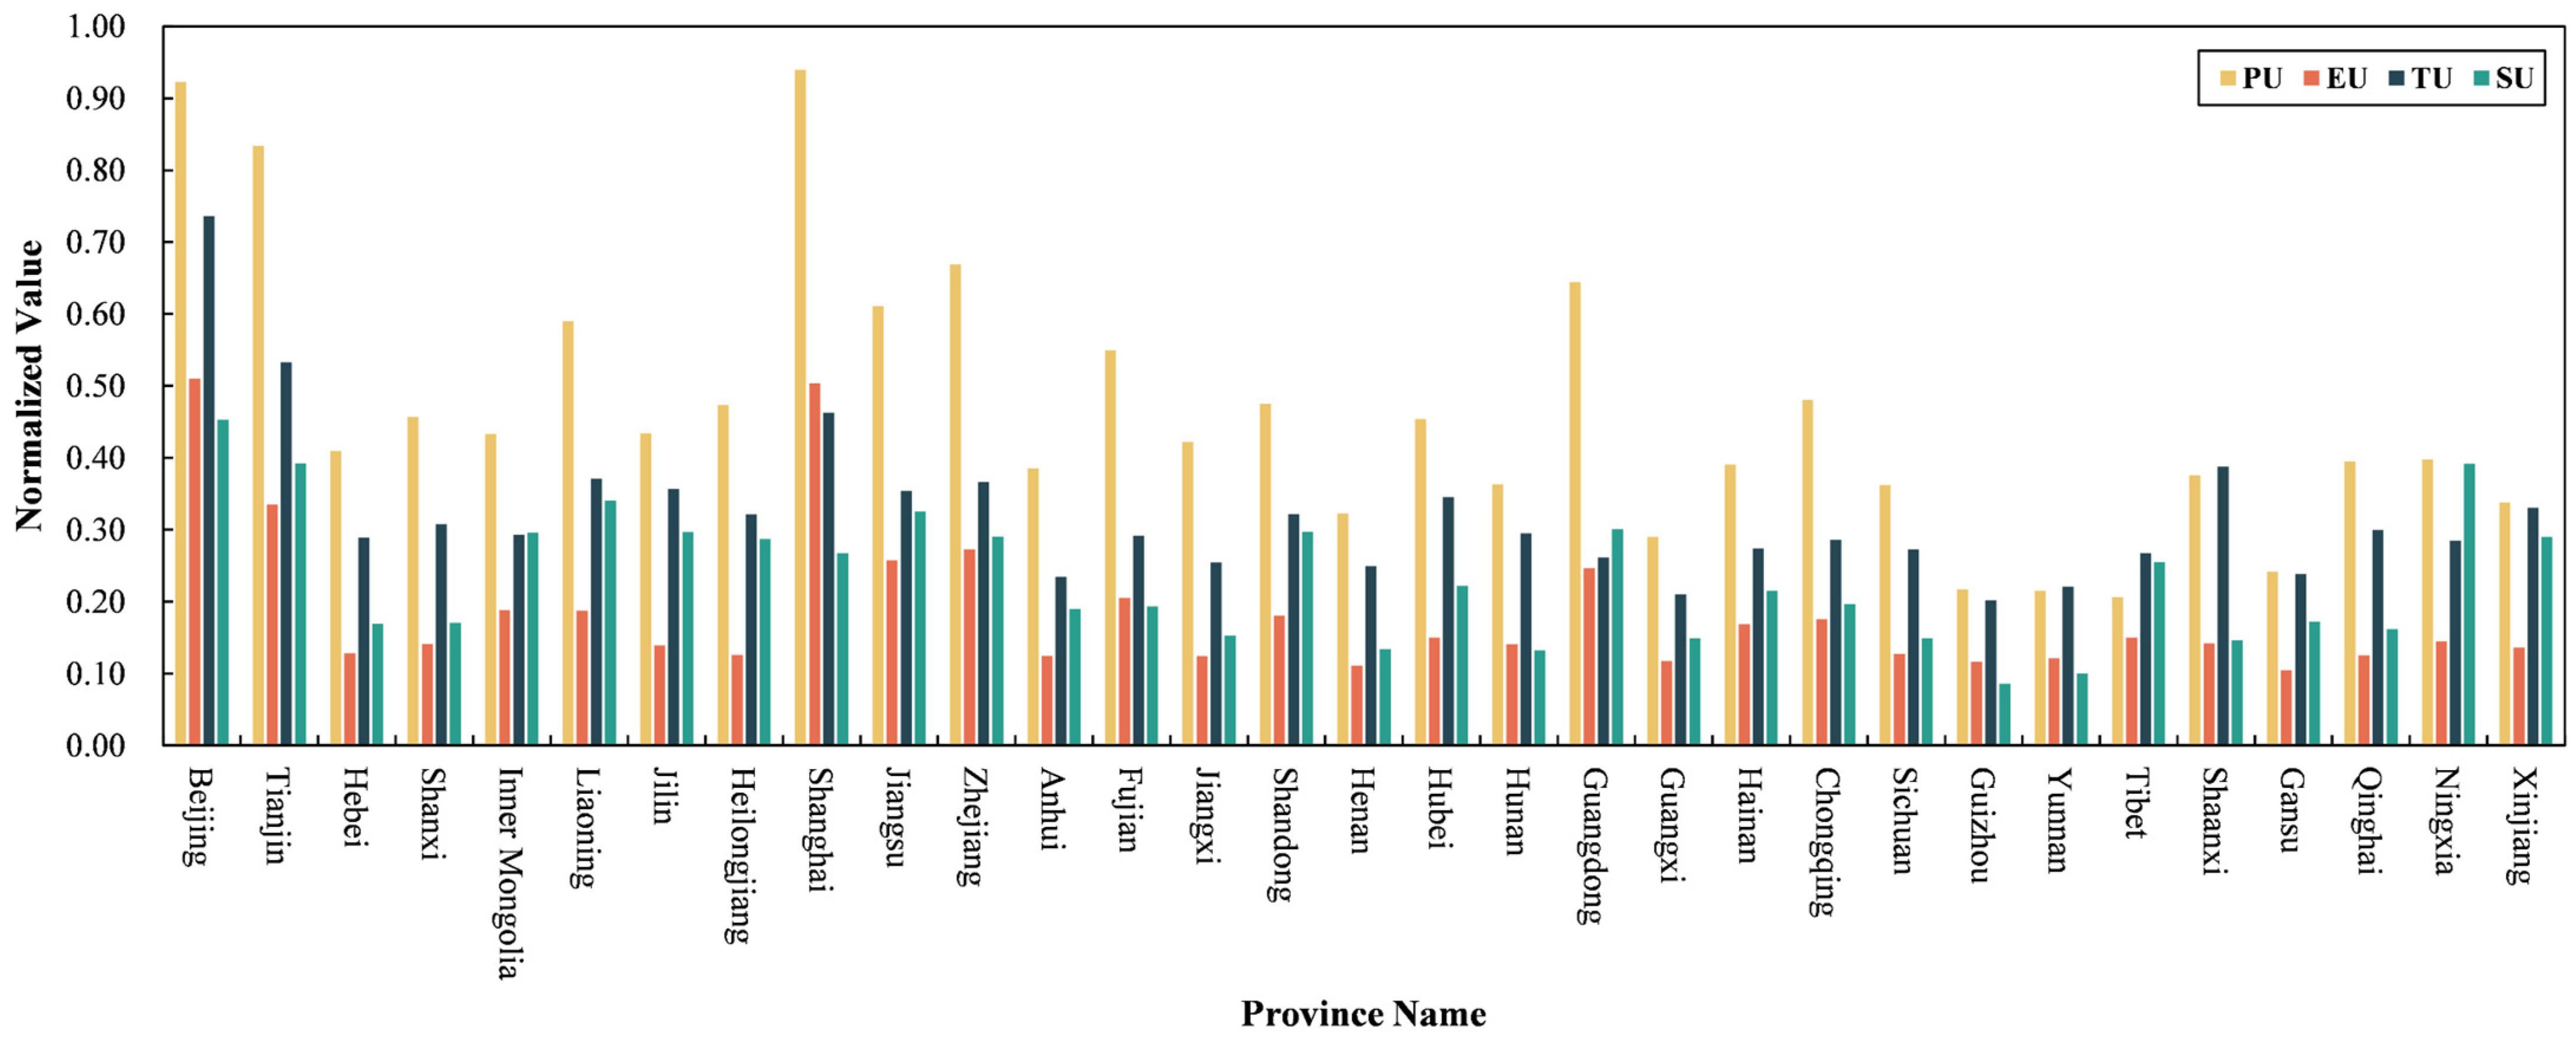
4.1. Validation of Four Aspects of Urbanization

Based on the aforementioned analysis, average values of four aspects of urbanization were calculated and illustrated (Figure 6).
According to Figure 6, variations were observed among different provinces. For instance, Shanghai, Beijing and Tianjin were the top three provinces with the highest population urbanization value (≥0.8340). Provinces with a population urbanization value higher than 0.50 were Zhejiang (0.6691), Guangdong (0.6444), Jiangsu (0.6444), Liaoning (0.6110) and Fujian (0.5897). In contrast, provinces that had a lower population urbanization value (≤0.2171) were Tibet, Yunnan and Guizhou. These results were consistent with the actual situation. As the economic center of China, Shanghai had experienced rapid expansion since the implementation of the reform and opening up policy in the late 1970s [33], with an increase in proportion of the urban population from 88.31% (2000) to 89.30% (2020) [2]. Moreover, the value of proportion of employees in secondary and tertiary industries in Shanghai increased from 86.90% in 2000 to 98.30% in 2020. The population urbanization value of Beijing was slightly lower than that of Shanghai. Owing to its prominent administrative position, Beijing had also experienced huge expansion, with a rising proportion of urban population from 77.54% in 2000 to 87.55% in 2020 [2]. Provinces with a population urbanization value higher than 0.50 were found in the eastern-coastal regions. Tibet, which is located in the southwestern China, had the lowest population urbanization value. In 2020, the proportion of urban population and employees in secondary and tertiary industries of Tibet were 35.73% and 64.25%, respectively. Concerning the economy urbanization, Beijing and Shanghai had the highest value, while Gansu had the lowest value. To be specific, Beijing had the highest per capita GDP (CNY 164889.00) in 2020, which was 4.58 times that of Gansu. As for the share of the tertiary sector in GDP, the value of Beijing was 83.90%, while the value of Gansu was only 55.10%. In addition, the per capita fiscal revenue of Beijing was CNY 25052.03, while the value of Gansu was CNY 3496.80. The per capita urban resident disposable income of Beijing was CNY 69433.50, while that of Gansu was CNY 20335.10. As for society urbanization, Beijing also had the highest value (0.7361), while Guizhou had the lowest value (0.2020). As to spatially urbanization, Beijing still had the highest value (0.4529), while Guizhou had the lowest value (0.0861). In 2020, the values per capita of the built-up areas of Beijing and Guizhou were 67.57 m2 and 28.99 m2, respectively [2]. Generally, eastern China provinces had a higher urbanization value, followed by most central provinces.

4.2. Comparison with Existing Studies about HRI, UDI and CCD

Based on Figure 3, southern and western China provinces had higher HRI values, while northern and eastern provinces had lower HRI values, indicating that the haze pollution levels of southern and western China provinces were lower than those northern and eastern provinces. As mentioned in Section 3.2.1, an existing study found that the haze pollution level in North China Plain was high [32]. Yang et al. analyzed the haze pollution level of China in 2018 and found that the haze pollution level of Shanxi province was high [15], which is consistent with our result. However, contrary to Yang’s study [15], the haze pollution level of some northern provinces in 2018 were also low. This may be caused by the difference of index system. In this study, with the exception of PM2.5 indicator, two indicators of sulfur dioxide emissions per 10,000 people and smoke and dust emissions per 10,000 people were also taken into consideration. In addition, in Yang’s study [15], the actual value of a single year was used to map the distribution of haze pollution, rather than the normalized value of multiple years. Liu et al. adopted the AQI index to describe the haze pollution level of Chinese cities and found that the haze pollution level of southern Hebei province was high [37]. Liu et al. utilized air pollution index (API) to study China’s haze pollution level [8] and also found that southern China regions had a lower haze pollution level, which further validated our results. Furthermore, Han and Cao took Yangtze River Delta urban agglomeration as the study area to analyze the regional haze pollution levels, and they found that cities in Zhejiang provinces had low haze pollution levels [9], which was also consistent with our findings. In our study, from 2000 to 2020, the HRI value of Zhejiang province was higher than Anhui province, Jiangsu province and Shanghai city. As for the UDI value, combined with Figure 4, eastern coastal provinces had higher UDI values, following by central and western provinces. Similar studies also shared this finding. For instance, Zhang and Li studied the coupling coordination level between urbanization and geological hazards, and they found that Beijing had the highest comprehensive urbanization value [50]. As with our study, Beijing also had the highest UDI value in 2020 (0.7786). In addition, both studies found that the comprehensive urbanization level of Tibet was the lowest and was smaller than 0.40. In 2020, the UDI value of Tibet was only 0.3225. In Yang’s study, they also found that eastern coastal provinces had higher urbanization rates, especially for Beijing, Tianjin and Shanghai, they belonged to the first urbanization level, with an urbanization rate value higher than 82.4% [15]. From the perspective of UDI change trend, combined with Figure 2b, the UDI value of China showed a continuous increasing trend, with the value increased from 0.1647 in 2000 to 0.4640 in 2020. Several studies also found a similar change trend in some regions. For instance, in Kashgar metropolitan area, all cities’ urbanization level displayed an increasing trend from 1999 to 2016 [20]. Wang et al. took Beijing–Tianjin–Hebei urban agglomeration as a study area and found that the regional urbanization level displayed an increasing trend [39]. Xu et al. utilized corrected nighttime light remote sensing data to analyze China’s urbanization level [51], and found that three urban agglomerations (Beijing–Tianjin–Hebei, Yangtze River Delta and Pearl River Delta) had higher nighttime light intensity values, indicating that these regions had higher urbanization levels [51]. Li et al. chose Chongqing municipality as the area and found comprehensively that each subsystem’s urbanization level showed an increasing trend [40]. These studies aside, other studies’ findings were also consistent with our study [22,41,43,44,45,49]. As for CCD, which was different from previous studies [39,40], in this paper the coupling coordination degree model was improved from the distance perspective. Specifically, traditional CCDM considered the interaction of two or more subsystems, however, it only calculated the geometric mean of two or more subsystems. However, traditional CCD value could not differentiate cases with a different coupling degree and comprehensive development degree but the same coupling coordination degree [26]. For instance, although the coupling degree is equal to 0.90, 0.30 and 0.10, the comprehensive development degree is equal to 0.10, 0.30 and 0.90, and the coupling coordination degree equals 0.30 in all cases [26]. To improve this shortcoming, improved CCD could distinguish these cases. Certainly, both traditional and improved CCDM could describe the change trend of two or more subsystems. To date, investigating the CCD between haze disaster and urbanization systems was seldom reported. Therefore, studies about urbanization and eco-environment systems were chosen to compare with our studies. Li et al. found that the coupling coordination degree of two subsystems in Kashgar metropolitan area displayed an increasing change trend [20]. Li et al. also found that the coupling coordination degree displayed a continuous increasing trend, with the grade improved from moderately unbalanced to moderately balanced [40]. Other similar studies also found that the CCD level between urbanization and eco-environment showed an increasing trend; these regions included Yangtze River Delta urban agglomeration [43], Wuhan city [49], Lianyungang city [46]. Generally, although differences existed in the index selection, the CCD calculation compared with existing studies, the spatial distribution of URI, change trend of UDI and CCD were similar to existing studies, which further validated our study.

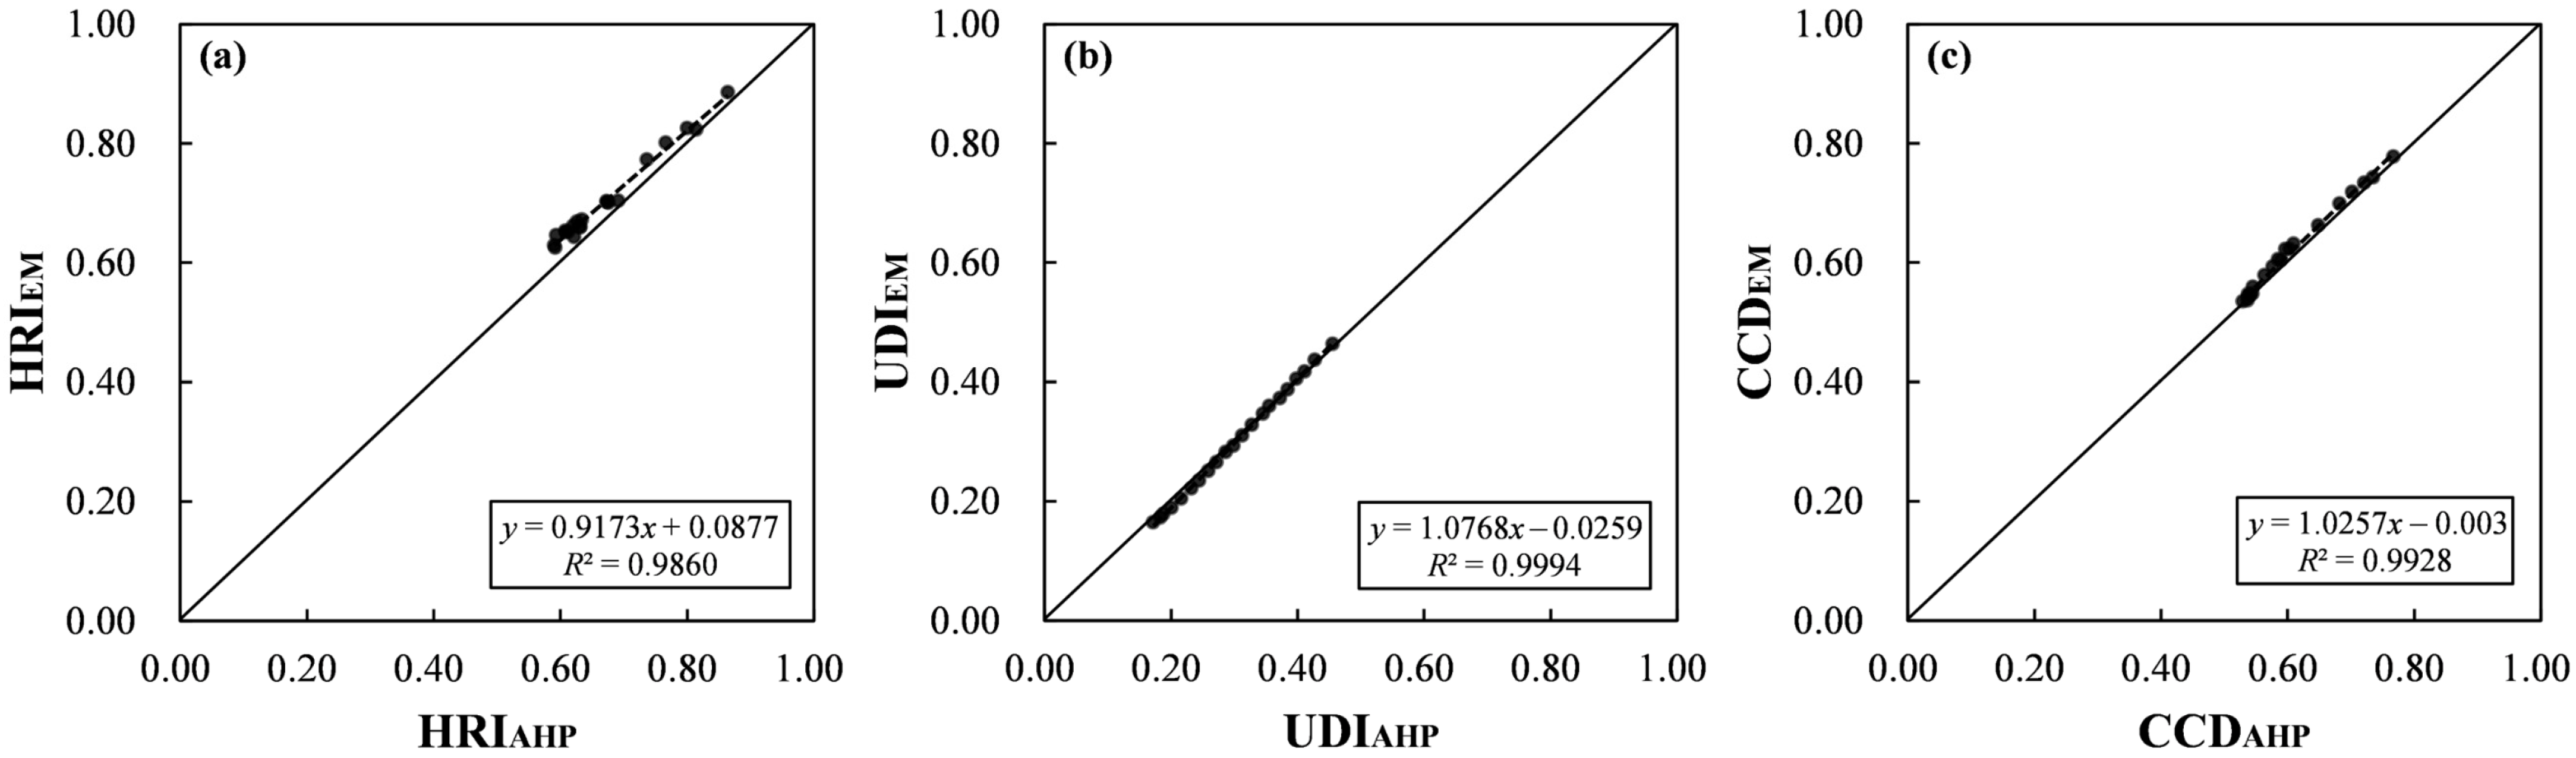
4.3. Comparison with HRI, UDI and CCD Results Using AHP Method

To validate our calculated HRI, UDI and CCD result, the AHP method was adopted to calculate each indicator’s weight and compare HRI, UDI and CCD result with HRIAHP, UDIAHP and CCDAHP.
Table 3 was the weight of each indicator calculated by AHP method. In addition, the consistency ratio value of haze disaster and urbanization systems were 0.0150 and 0.0484, which both were far less than 0.1, indicating that the judgement matrix had a good consistency and the weights were reasonable [47].
Based on Table 1 and Table 3, although the weights were different, the relative weight value in each method was similar. In Table 3, the weight of PM2.5 annual average concentration was 0.6333, which was higher than other two indicators. Similar results were found in Table 1. As for urbanization systems, the per capita built-up area had the highest weight (0.2103), which was higher than that weight calculated by the entropy method (0.1376). Generally, compared with Table 1, the weight calculated by the entropy method was appropriate and reasonable. However, the entropy method had the advantage of considering the objective characteristics of the data itself.
To further validate our result, HRIAHP, UDIAHP and CCDAHP were calculated (Table 4). Moreover, a scatter plot was drawn (Figure 7).
According to Table 4, the change trend of HRIAHP, UDIAHP and CCDAHP were similar to our study. In addition, average value of HRIAHP, UDIAHP and CCDAHP were 0.6700, 0.3023 and 0.6046, respectively. In our study, the average value of HRI, UDI and CCD were 0.7023, 0.2995 and 0.6172. These results indicated that there existed good consistency of two weighting methods. In Figure 7, the fitting formula’s R2 of HRI, UDI and CCD were 0.9860, 0.9994 and 0.9928, respectively. The slopes of three fitting formulas were 0.9173, 1.0768 and 1.0257, respectively, which were all close to 1:1 line, further validating that there had been good consistency.

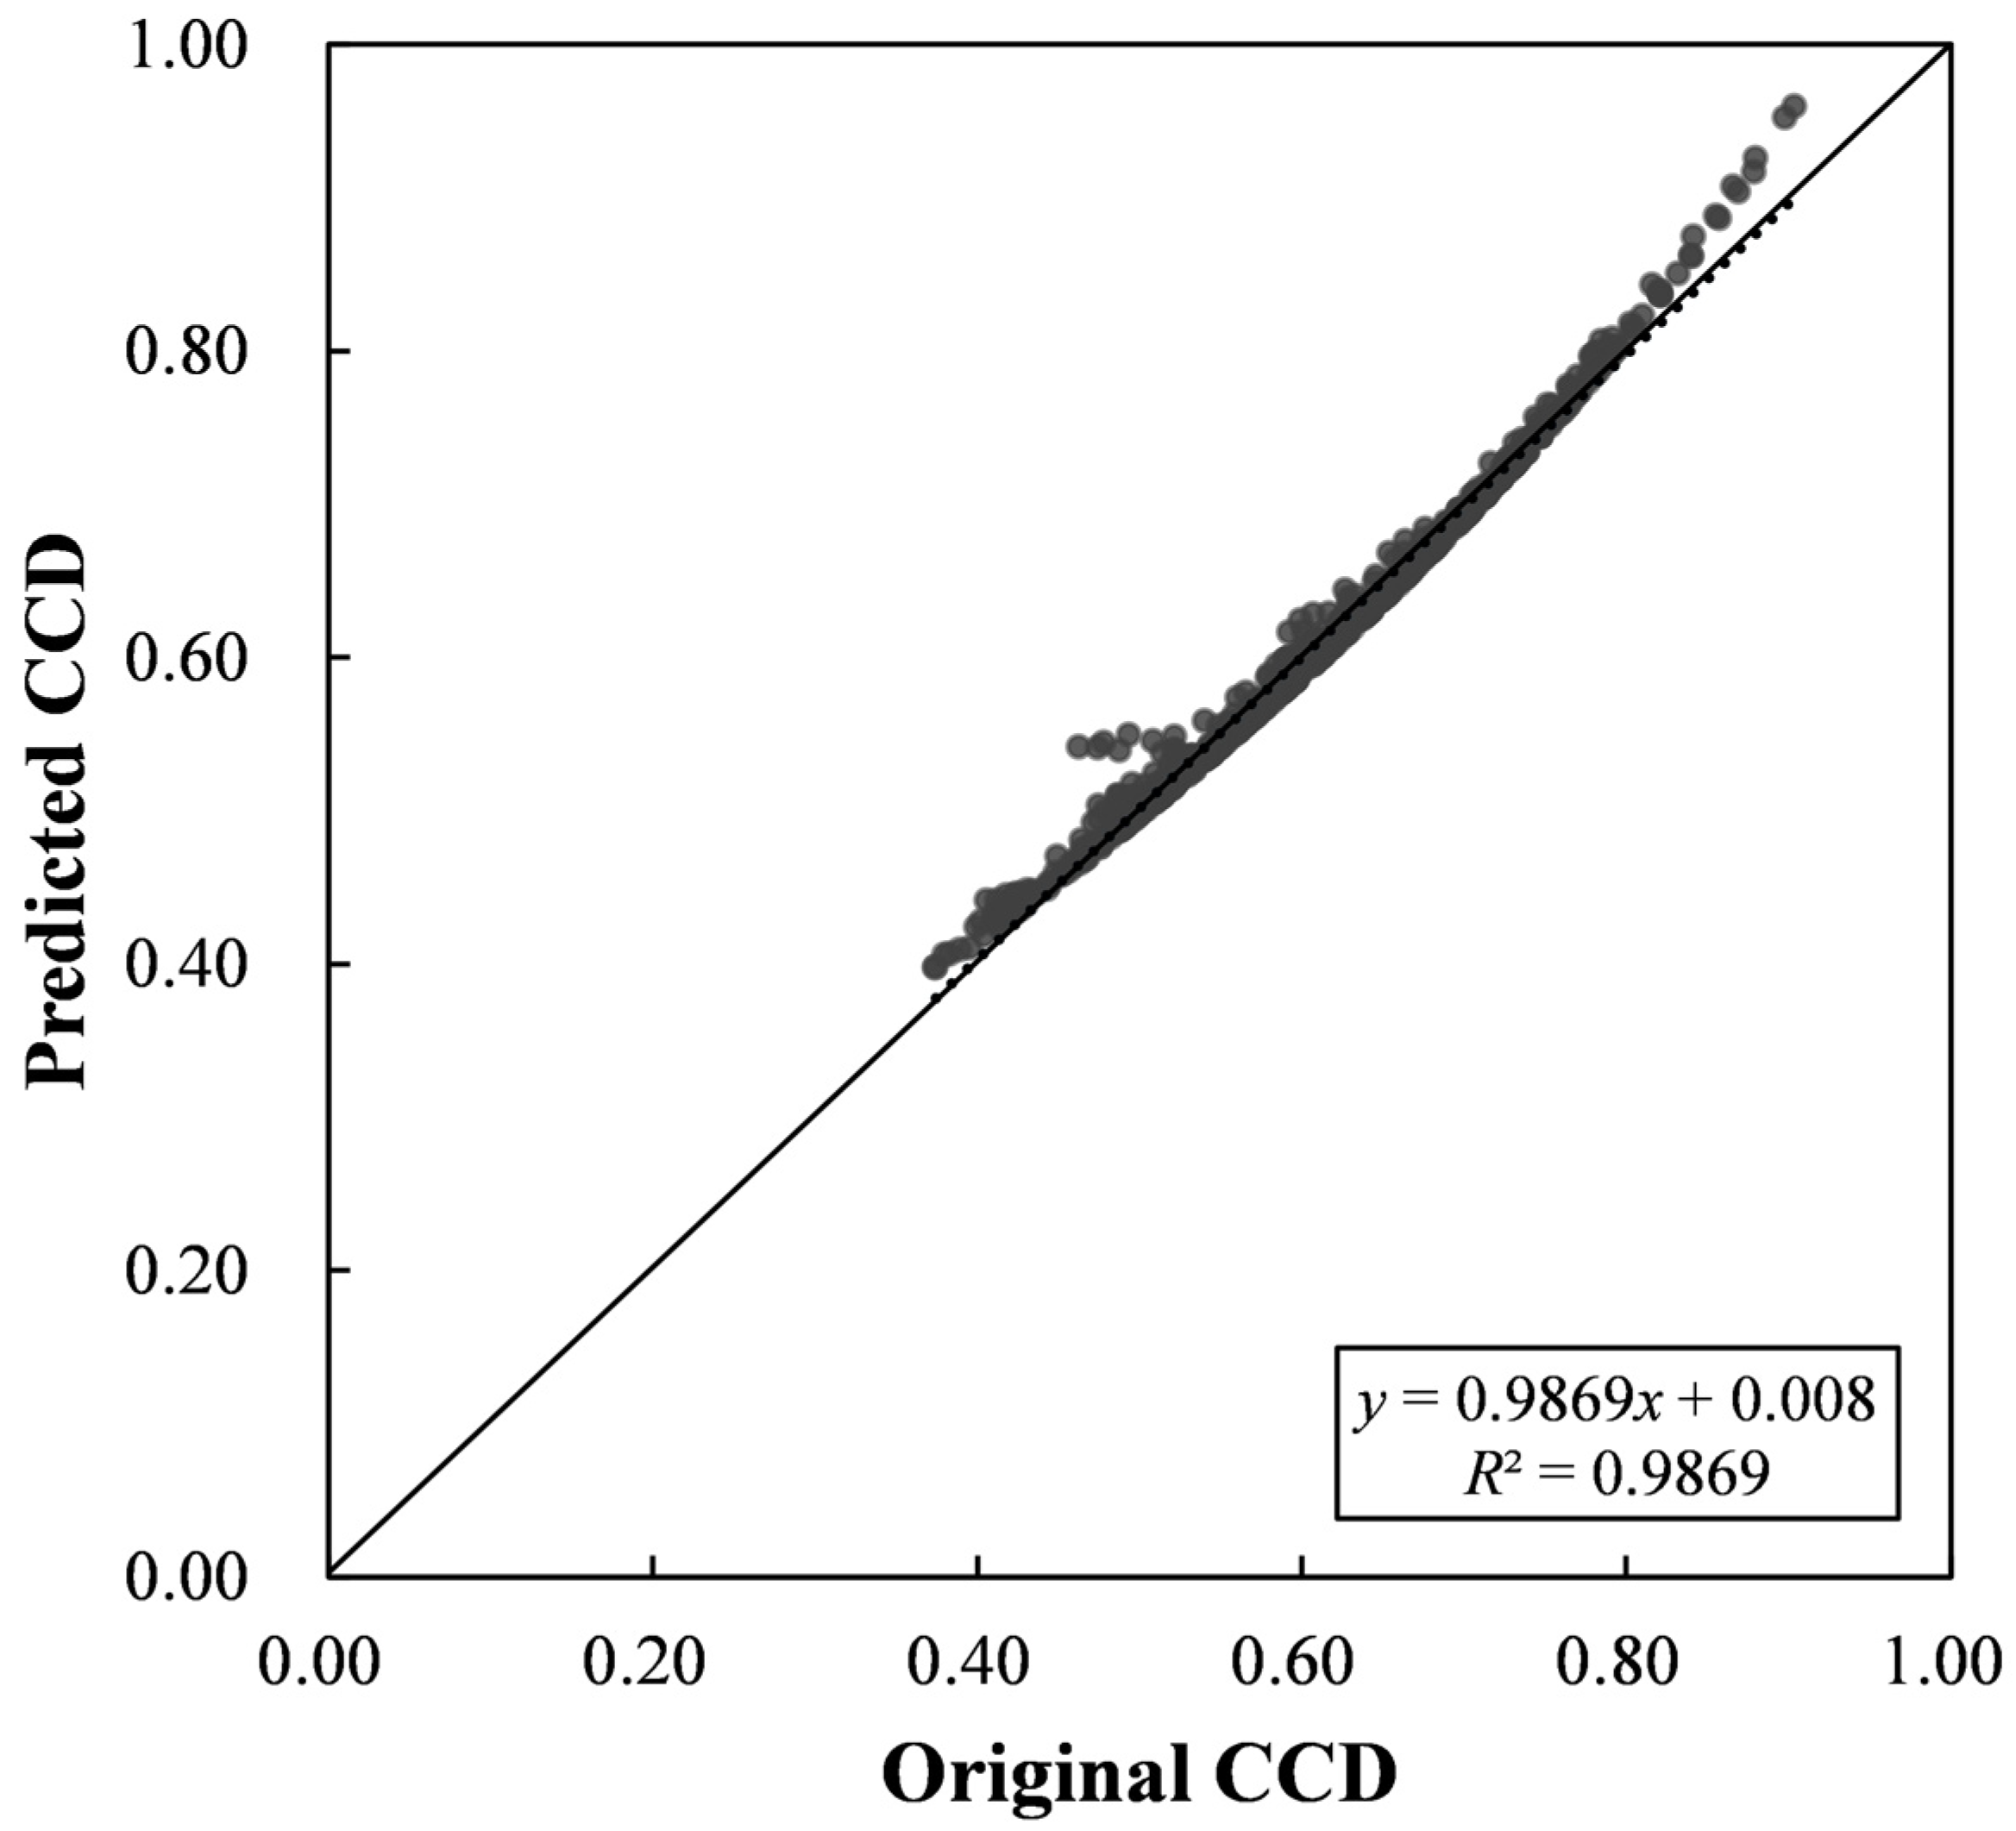
4.4. Relationship Exploration among the HRI, UDI and CCD

To explore the relationship among the HRI, UDI and CCD, 651 samples of all provinces from 2000 to 2020 were used to perform a multiple linear regression analysis. In addition, collinearities of HRI and UDI were also calculated using IBM SPSS Statistics 26. It can be found that the tolerance value between HRI and UDI was 0.983, which was higher than 0.1 and less than one. Moreover, the variance inflation factor (VIF) value between two independent variables was 1.017, which was lower than 10. Generally, both tolerance and VIF values showed that HRI and UDI did not have collinearities [51,52,53], indicating that it was acceptable to perform a multiple linear regression analysis. A fitting formula was shown in Equation (17).
C C D = 0.1379 + 0.4285 × H R I + 0.5676 × U D I R 2 = 0.9869
Based on Equation (17), the coefficients of HRI and UDI were all positive, indicating that improving the HRI or UDI would promote one province’s CCD. However, compared with HRI, UDI had a higher contribution to CCD. Specifically, when one province’s UDI increased by one unit, the CCD would increase by 0.5676. However, if a province’s HRI increased by one unit, the CCD would increase by 0.4285, which was lower than that of UDI.
To test our fitting formula’s accuracy, a scatter plot between the original and predicted CCD was drawn (Figure 8).
Based on Figure 8, the original and predicated CCD displayed a good relationship with R2 of 0.9869. The slope of the fitting formula was 0.9869, which was close to one. Moreover, the intercept value was only 0.008, which was close to zero. Generally, the fitting formula was close to the 1:1 line, indicating that this formula could well predict CCD.

4.5. Policy Implications, Limitations and Further Study

In order to promote the coupling coordinated degree between the haze disaster risk and urbanization level, based on aforementioned analysis, several suggestions were given. Firstly, in terms of population urbanization, western provinces, such as Guizhou, Yunnan and Tibet, should improve the proportion of urban population and the proportion of employees in secondary and tertiary industries. As for economy urbanization, with the exceptions of Beijing and Shanghai, other provinces and municipalities had lower economy urbanization values (<0.40). For society urbanization, Beijing, Tianjin and Shanghai had higher values (>0.40). In addition, Beijing had the highest society urbanization value, which was 0.2034 higher than Tianjin. Therefore, more measures should be implemented by government to reduce the social development gap, including medical resources, educational resources and transportation resources. For spatiality urbanization, with the exception of Beijing, spatiality urbanization values of all other provinces and municipalities were less than 0.40. In the future, government should continue to improve the urban development level, including the increase in built-up areas and paved road areas. Secondly, from 2000 to 2020, average HRI values showed an increasing trend, indicating that the overall haze pollution level on a provincial scale was decreasing. This owed to the promotion of clean energy and implementation of regional collaborative governance policies. For instance, Beijing–Tianjin–Hebei urban agglomeration had signed multiple documents to promote regional coordinated development in many key areas such as joint prevention and control of air pollution, joint protection and control of water environment, and joint law enforcement. Finally, for those provinces or municipalities with lower CCD values, in the future, government should promote both HRI and UDI values at different amplitudes. For example, Ningxia had a lower CCD value in 2000 due to its low UDI. Although in 2020, CCD values of all provinces and municipalities were higher than 0.6900, there was still room for improvement.
This paper revealed the changes in the coupling coordination level between haze disaster risk and urbanization level in China, however, this paper still has some limitations. On one hand, both haze disaster and urbanization systems belonged to complex systems. However, due to data unavailability, several indicators were not taken into consideration. For instance, population mobility was an important indicator to reflect regional population urbanization. In China, it was difficult to acquire population mobility data each year. Fortunately, with the coming of the big data era, numerous smart phone apps had location-based services, which could collect users’ locations in real time. These data could be fully utilized to mine valuable information. On the other hand, in this study, only provincial cases were analyzed, which failed to describe differences at a city scale. As mentioned above, combined with big data collection and analysis technologies, HRI, UDI and CCD analysis at a city scale will become available. In addition, the utilization of more new remote sensing spatial datasets would also be of great help.

5. Conclusions

Based on remote sensing and statistical yearbook data, this paper constructed the index system of haze disaster risk and urbanization development levels. The weight of each index was determined by using the entropy method. Then, the spatial change characteristics of the coupling coordination level of the haze disaster risk index and urbanization development index were calculated using coupling coordination degree model (2000 to 2020). The main research findings of this paper were as follows: (1) During the period 2000–2020, the haze pollution level in China showed a fluctuating downward trend, and its haze disaster risk index value revealed a “W”-shaped change, with its index value increasing from 0.7041 in 2000 to 0.8859 in 2020. In spatial terms, the haze pollution level showed a distribution of “low in the south and in the west” and “high in the east and in the north”; (2) China’s urbanization development index indicated a gradual upward trend (from 0.1647 in 2000 to 0.4640 in 2020), with an average annual growth rate of 8.63%. Spatially, the urbanization development level roughly highlighted the decreasing distribution characteristics from coastal to inland regions; (3) The coupling coordination level between haze disaster risk and urbanization development had a fluctuating upward trend, i.e., from 0.5374 in 2000 to 0.7781 in 2020, with an average annual growth rate of 2.13%. The overall level of coupling coordination improved from low to moderate coordination. Spatially, the coupling coordination level is higher in the eastern coastal provinces and lower in the central and western regions; (4) A multiple linear regression formula could well fit the relationship of HRI, UDI and CCD, with the R2 of 0.9869. Furthermore, the UDI had a higher contribution to improving the CCD than the HRI.

Author Contributions

Conceptualization, J.J.; methodology, Z.T.; software, J.J. and E.S.; validation, L.W., W.L. and B.G.; formal analysis, J.J.; investigation, J.J.; resources, W.Z.; data curation, J.J.; writing—original draft preparation, J.J; writing—review and editing, W.Z. and E.S.; visualization, L.W.; supervision, J.J.; project administration, J.J. and W.L.; funding acquisition, J.J. and W.L. All authors have read and agreed to the published version of the manuscript.

Funding

This research was funded by the Humanities and Social Sciences Foundation of Suzhou University of Science and Technology (No. XKR202102), Philosophy and Social Science Research in Colleges and Universities of Jiangsu Province (No. 2022SJYB1465), Starting Research Program of Suzhou University of Science and Technology (No. 332114809) and the National Key Research and Development Program of China (No. 2017YFB0503805).

Institutional Review Board Statement

Not applicable.

Informed Consent Statement

Not applicable.

Data Availability Statement

The data presented in this study are available on request from the corresponding author.

Acknowledgments

We thank the National Geomatics Center of China and Jing Wei for supplying the administrative division data and remote sensing datasets.

Conflicts of Interest

The authors declare no conflict of interest.

Abbreviations

AHPAnalytic hierarchy processA subjective method to determine indicator’s weight
AODAerosol optical depthA measure of aerosols distribution within a column of air from the instrument to the top of the atmosphere
CCDCoupling coordination degreeA measure of coupling coordination level between systems
CCDMCoupling coordination degree modelA model of calculating coupling coordination degree
EUEconomy urbanizationAn indicator of reflecting regional economy urbanization level
HRIHaze disaster risk indexA measure of regional haze disaster risk level
PCAPrincipal component analysisA method of aggregating multi-dimensional information
PUPopulation urbanizationAn indicator of reflecting regional population urbanization level
SUSpatiality urbanizationAn indicator of reflecting regional spatiality urbanization level
TUSociety urbanizationAn indicator of reflecting regional society urbanization level
UDIUrbanization development indexA measure of regional urbanization level

References

  1. Wen, Q.; Zhang, Z.; Shi, L.; Zhao, X.; Liu, F.; Xu, J.; Yi, L.; Liu, B.; Wang, X.; Zuo, L.; et al. Extraction of basic trends of urban expansion in China over past 40 years from satellite images. Chin. Geogr. Sci. 2016, 26, 129–142. [Google Scholar] [CrossRef]
  2. National Bureau of Statistics of the People’s Republic of China. China Statistical Yearbook (2021); China Statistics Press: Beijing, China, 2021. [Google Scholar]
  3. United Nations. World Urbanization Prospects: The 2013 Revision; United Nations: New York, NY, USA, 2014. [Google Scholar]
  4. Zhang, L.; Wu, P.; Niu, M.; Zheng, Y.; Wang, J.; Dong, G.; Zhang, Z.; Xie, Z.; Du, M.; Jiang, H.; et al. A systematic assessment of city-level climate change mitigation and air quality improvement in China. Sci. Total Environ. 2022, 839, 156274. [Google Scholar] [CrossRef] [PubMed]
  5. Liu, Q.; Sheng, L.; Chen, G. Climatological intraseasonal oscillation of the summertime haze-fog in eastern China. Sci. Total Environ. 2021, 244, 117951. [Google Scholar] [CrossRef]
  6. Xie, Z.; Qin, Y.; Li, Y.; Shen, W. Evaluation of haze press risk in China based on PM2.5. Acta Sci. Circu. 2017, 37, 4503–4510. (In Chinese) [Google Scholar]
  7. Feng, W.; Yuan, H. Haze pollution and economic fluctuations: An empirical analysis of Chinese cities. Clean. Environ. Syst. 2021, 2, 100010. [Google Scholar] [CrossRef]
  8. Liu, Y.; Tian, J.; Zheng, W.; Yin, L. Spatial and temporal distribution characteristics of haze and pollution particles in China based on spatial statistics. Urban Clim. 2022, 41, 101031. [Google Scholar] [CrossRef]
  9. Han, X.; Cao, T. Urbanization level, industrial structure adjustment and spatial effect of urban haze pollution: Evidence from China’s Yangtze River Delta urban agglomeration. Atmos. Pollut. Res. 2022, 13, 101427. [Google Scholar] [CrossRef]
  10. Liu, L.; Tan, B.; Zhang, K.; Wu, J. Risk assessment of urban haze disaster in Hunan province based on principal component analysis. J. Catas. 2021, 36, 76–81. (In Chinese) [Google Scholar]
  11. Dotse, S.; Dagar, L.; Petra, M.; Silva, L. Influence of southeast Asian haze episodes on high PM10 concentrations across Brunei Darussalam. Environ. Pollut. 2016, 219, 337–352. [Google Scholar] [CrossRef]
  12. Zha, Y.; Gao, J.; Jiang, J.; Lu, H.; Huang, J. Normalized difference haze index: A new spectral index for monitoring urban air pollution. Int. J. Remote Sens. 2012, 33, 309–321. [Google Scholar] [CrossRef]
  13. Han, X.; Yao, F.; Zhang, J.; Waqar, M.; Zha, Y.; He, J. Haze detection by using modified normalized difference haze index in Beijing, Tianjin, and Hebei province. J. Appl. Remote Sens. 2016, 10, 025025. [Google Scholar] [CrossRef]
  14. Hao, Y.; Liu, Y. The influential factors of urban PM2.5 concentrations in China: A spatial econometric analysis. J. Clean Prod. 2016, 112, 1443–1453. [Google Scholar] [CrossRef]
  15. Yang, Y.; Tang, D.; Yang, X. Investigating the spatio-temporal variations of the impact of urbanization on haze pollution using multiple indicators. Stoch. Environ. Res. Risk Assess. 2021, 35, 703–717. [Google Scholar] [CrossRef]
  16. Huang, W.; Fan, H.; Qian, Y. Modeling and efficient quantified risk assessment of haze causation system in China related to vehicle emissions with uncertainty consideration. Sci. Total Environ. 2019, 668, 74–83. [Google Scholar] [CrossRef] [PubMed]
  17. Yu, W.; Wen, Y.; Yu, B.; Wu, Y.; Huang, Y.; Qiu, X. Evolution characteristics of fog and haze disaster weather in Hengshui city of Hebei province. J. Catas. 2015, 30, 79–84. (In Chinese) [Google Scholar]
  18. Aladağ, C. Opinions of geography and social sciences student-teachers on the concepts of urbanization and urbanizing. Educ. Urban Soc. 2019, 51, 351–373. [Google Scholar] [CrossRef]
  19. Feng, Y.; He, S.; Li, G. Interaction between urbanization and the eco-environment in the Pan-Third Pole region. Sci. Total Environ. 2021, 789, 148011. [Google Scholar] [CrossRef]
  20. Li, J.; Lei, J.; Li, S.; Yang, Z.; Tong, Y.; Zhang, S.; Duan, Z. Spatiotemporal analysis of the relationship between urbanization and the eco-environment in the Kashgar metropolitan area, China. Ecol. Indic. 2022, 135, 108524. [Google Scholar] [CrossRef]
  21. Ariken, M.; Zhang, F.; Liu, K.; Fang, C.; Kung, H. Coupling coordination analysis of urbanization and eco-environment in Yanqi Basin based on multi-source remote sensing data. Ecol. Indic. 2020, 114, 106331. [Google Scholar] [CrossRef]
  22. Fu, S.; Zhuo, H.; Song, H.; Wang, J.; Ren, L. Examination of a coupling coordination relationship between urbanization and the eco-environment: A case study in Qingdao, China. Environ. Sci. Pollut. Res. 2020, 27, 23981–23993. [Google Scholar] [CrossRef]
  23. Liu, L.; Caloz, C.; Chang, C.; Itoh, T. Forward coupling phenomena between artificial left-handed transmission lines. J. Appl. Phys. 2002, 92, 5560–5565. [Google Scholar] [CrossRef]
  24. Fan, Y.; Fang, C.; Zhang, Q. Coupling coordinated development between social economy and ecological environment in Chinese provincial capital cities-assessment and policy implications. J. Clean Prod. 2019, 229, 289–298. [Google Scholar] [CrossRef]
  25. Fan, W.; Wang, H.; Liu, Y.; Liu, H. Spatio-temporal variation of the coupling relationship between urbanization and air quality: A case study of Shandong Province. J. Clean. Prod. 2020, 272, 122812. [Google Scholar] [CrossRef]
  26. Ji, J.; Tang, Z.; Zhang, W.; Liu, W.; Jin, B.; Xi, X.; Wang, F.; Zhang, R.; Guo, B.; Xu, Z.; et al. Spatiotemporal and multiscale analysis of the coupling coordination degree between economic development equality and eco-environmental quality in China from 2001 to 2020. Remote Sens. 2022, 14, 737. [Google Scholar] [CrossRef]
  27. Chi, Y.; Qian, T.; Sheng, C.; Xi, C.; Wang, J. Analysis of Differences in the Spatial Distribution among Terrestrial Mammals Using Geodetector—A Case Study of China. ISPRS Int. J. Geo-Inf. 2021, 10, 21. [Google Scholar] [CrossRef]
  28. Wei, J.; Li, Z.; Cribb, M.; Huang, W.; Xue, W.; Sun, L.; Guo, J.; Peng, Y.; Li, J.; Lyapustin, A.; et al. Improved 1 km resolution PM2.5 estimates across China using enhanced space-time extremely randomized trees. Atmos. Chem. Phys. 2020, 20, 3273–3289. [Google Scholar] [CrossRef]
  29. Wei, J.; Li, Z.; Lyapustin, A.; Sun, L.; Peng, Y.; Xue, W.; Su, T.; Cribb, M. Reconstructing 1-km-resolution high-quality PM2.5 data records from 2000 to 2018 in China: Spatiotemporal variations and policy implications. Remote Sens. Environ. 2021, 252, 112136. [Google Scholar] [CrossRef]
  30. Peng, J. Literature review and economic analysis of haze pollution. Financ. Econ. 2015, 14, 68–71. [Google Scholar]
  31. Xu, C.; Zhang, Q.; Huang, G.; Huang, J.; Zhang, H. The impact of PM2.5 on kidney. J. Appl. Toxicol. 2022, 42, 4356. [Google Scholar] [CrossRef]
  32. Qi, G.; Wang, Z.; Wei, L.; Wang, Z. Multidimensional effects of urbanization on PM2.5 concentration in China. Environ. Sci. Pollut. Res. 2022, 29, 1–16. [Google Scholar] [CrossRef]
  33. Cui, L.; Shi, J. Urbanization and its environmental effects in Shanghai, China. Urban Clim. 2012, 2, 1–15. [Google Scholar] [CrossRef]
  34. Shen, R.; Schäfer, K.; Shao, L.; Schnelle-Kreis, J.; Wang, Y.; Li, F.; Liu, Z.; Emeis, S.; Schmid, H. Chemical characteristics of PM2.5 during haze episodes in spring 2013 in Beijing. Urban Clim. 2017, 22, 51–63. [Google Scholar] [CrossRef]
  35. Wang, Z.; Yang, J.; Jiang, J. Urban Sprawl and Haze Pollution: Based on Raster Data of Haze PM2.5 Concentrations in 283 Cities in Mainland China. Front. Environ. Sci. 2022, 10, 929558. [Google Scholar] [CrossRef]
  36. Yang, L.; Xu, H.; Yu, S. Estimating PM2.5 concentrations in Yangtze River Delta region of China using random forest model and the Top-of-Atmosphere reflectance. J. Environ. Manage. 2020, 272, 111061. [Google Scholar] [CrossRef]
  37. Liu, H.; Fang, C.; Zhang, X.; Wang, Z.; Bao, C.; Li, F. The effect of natural and anthropogenic factors on haze pollution in Chinese cities: A spatial econometrics approach. J. Clean. Prod. 2017, 165, 323–333. [Google Scholar] [CrossRef]
  38. Sun, P.; Song, W.; Xiu, C.; Liang, Z. Non-coordination in China’s Urbanization: Assessment and Affecting Factors. Chin. Geogra. Sci. 2013, 23, 729–739. [Google Scholar] [CrossRef]
  39. Wang, Z.; Liang, L.; Sun, Z.; Wang, X. Spatiotemporal differentiation and the factors influencing urbanization and ecological environment synergistic effects within the Beijing-Tianjin-Hebei urban agglomeration. J. Environ. Manage. 2019, 243, 227–239. [Google Scholar] [CrossRef]
  40. Li, W.; Wang, Y.; Xie, S.; Cheng, X. Coupling coordination analysis and spatiotemporal heterogeneity between urbanization and ecosystem health in Chongqing municipality, China. Sci. Total Environ. 2021, 791, 148311. [Google Scholar] [CrossRef]
  41. Dong, L.; Shang, J.; Ali, R.; Rehman, R. The Coupling Coordinated Relationship Between New-type Urbanization, Eco-Environment and its Driving Mechanism: A Case of Guanzhong, China. Front. Environ. Sci. 2021, 9, 638891. [Google Scholar] [CrossRef]
  42. Chu, N.; Wu, X.; Zhang, P. Spatiotemporal evolution characteristics of coordinated development of urbanization and ecological environment in eastern Russia—Perspectives from the 3D global trend and 2D plane analysis. PLoS ONE 2022, 17, e0267272. [Google Scholar] [CrossRef]
  43. Shao, Z.; Ding, L.; Li, D.; Altan, O.; Huq, M.; Li, C. Exploring the Relationship between Urbanization and Ecological Environment Using Remote Sensing Images and Statistical Data: A Case Study in the Yangtze River Delta, China. Sustainability 2020, 12, 5620. [Google Scholar] [CrossRef]
  44. Zou, C.; Zhu, J.; Lou, K.; Yang, L. Coupling coordination and spatiotemporal heterogeneity between urbanization and ecological environment in Shaanxi Province, China. Ecol. Indic. 2022, 141, 109152. [Google Scholar] [CrossRef]
  45. Wang, H.; Zhao, A.; Cao, Y.; Xie, Y.; Guo, L. Interaction between Urbanization and Eco-Environment in Hebei Province, China. Sustainability 2022, 14, 9214. [Google Scholar] [CrossRef]
  46. Li, Y.; Li, Y.; Zhou, Y.; Shi, Y.; Zhu, X. Investigation of a coupling model of coordination between urbanization and the environment. J. Environ. Manage. 2012, 98, 127–133. [Google Scholar] [CrossRef] [PubMed]
  47. Ji, J.; Wang, S.; Zhou, Y.; Liu, W.; Wang, L. Spatiotemporal Change and Coordinated Development Analysis of “Population-Society-Economy-Resource-Ecology-Environment” in the Jing-Jin-Ji Urban Agglomeration from 2000 to 2015. Sustainability 2021, 13, 4075. [Google Scholar] [CrossRef]
  48. Wang, S.; Fang, C.; Wang, Y. Quantitative investigation of the interactive coupling relationship between urbanization and eco-environment. Acta. Ecol. Sinica 2015, 35, 2244–2254. (In Chinese) [Google Scholar]
  49. Tang, P.; Huang, J.; Zhou, H.; Fang, C.; Zhan, Y.; Huang, W. Local and telecoupling coordination degree model of urbanization and the eco-environment based on RS and GIS: A case study in the Wuhan urban agglomeration. Sustain. Cities Soc. 2021, 75, 103405. [Google Scholar] [CrossRef]
  50. Zhang, Z.; Li, Y. Coupling coordination and spatiotemporal dynamic evolution between urbanization and geological hazards-A case study from China. Sci. Total Environ. 2020, 728, 138825. [Google Scholar] [CrossRef]
  51. Xu, D.; Cheng, J.; Xu, S.; Geng, J.; Yang, F.; Fang, H.; Xu, J.; Wang, S.; Wang, Y.; Huang, J.; et al. Understanding the Relationship between China’s Eco-Environmental Quality and Urbanization Using Multisource Remote Sensing Data. Remote Sens. 2022, 14, 198. [Google Scholar] [CrossRef]
  52. Chatterjee, S.; Hadi, A. Regression Analysis by Example, 4th ed.; Wiley: Hoboken, NJ, USA, 2006. [Google Scholar]
  53. Cheng, X.; Chen, L.; Sun, R.; Kong, P. Science of the Total Environment Land use changes and socio-economic development strongly deteriorate river ecosystem health in one of the largest basins in China. Sci. Total Environ. 2018, 616–617, 376–385. [Google Scholar] [CrossRef]
Figure 1. Location of the study area.
Systems 10 00150 g001
Figure 2. Time series change of haze disaster risk level (a), urbanization development level (b) and the coupling coordination degree (c) in China.
Systems 10 00150 g002
Figure 3. Spatial distribution of haze disaster risk index in China from 2000 to 2020.
Systems 10 00150 g003
Figure 4. Spatial distribution of urbanization development index in China from 2000 to 2020.
Systems 10 00150 g004
Figure 5. Spatial distribution of coupling coordination degree in China from 2000 to 2020.
Systems 10 00150 g005
Figure 6. Average values of four urbanization aspects in China provinces from 2000 to 2020.
Systems 10 00150 g006
Figure 7. Scatter plot of HRI (a), UDI (b) and CCD (c) calculated by AHP and EM method.
Systems 10 00150 g007
Figure 8. Scatter plot between the original and predicted CCD.
Systems 10 00150 g008
Table 1. Indicator system and weight of haze disaster risk and urbanization development index.
SystemsAttributesIndicatorsTrendWeight
Haze disaster risk indexHaze disasterPM2.5 annual average concentration (μg/m3)Negative0.4447
Sulfur dioxide emissions per 10,000 people (t)Negative0.3464
Smoke and dust emissions per 10,000 people (t)Negative0.2089
Urbanization development indexPopulation urbanizationProportion of urban population (%)Positive0.1316
Proportion of employees in secondary and tertiary industries (%)Positive0.1179
Economy urbanizationPer capita GDP (yuan)Positive0.0635
Share of tertiary sector in GDP (%)Positive0.0326
Per urban resident disposable income (yuan)Positive0.0554
Per capita fiscal revenue (yuan)Positive0.0945
Society urbanizationNumber of doctors per 10,000 people (person)Positive0.0967
Number of university students per 10,000 people (person)Positive0.0927
Number of public transport vehicles per 10,000 people (unit)Positive0.0651
Spatiality urbanizationPer capita built-up area (m2)Positive0.1376
Per capita paved road area (m2)Positive0.1124
Table 2. Coupling coordination level and classification criteria.
CCD Classification CriteriaCCD Level
0.0 < CCD ≤ 0.2Serious incoordination
0.2 < CCD ≤ 0.4Moderate incoordination
0.4 < CCD ≤ 0.6Low coordination
0.6 < CCD ≤ 0.8Moderate coordination
0.8 < CCD ≤ 1.0High coordination
Table 3. Indicator weight of AHP method.
IndicatorsWeight
PM2.5 annual average concentration (μg/m3)0.6333
Sulfur dioxide emissions per 10,000 people (t)0.2605
Smoke and dust emissions per 10,000 people (t)0.1062
Proportion of urban population (%)0.1673
Proportion of employees in secondary and tertiary industries (%)0.1324
Per capita GDP (yuan)0.0336
Share of tertiary sector in GDP (%)0.0162
Per urban resident disposable income (yuan)0.0250
Per capita fiscal revenue (yuan)0.0566
Number of doctors per 10,000 people (person)0.0566
Number of university students per 10,000 people (person)0.0566
Number of public transport vehicles per 10,000 people (unit)0.0355
Per capita built-up area (m2)0.2103
Per capita paved road area (m2)0.2099
Table 4. Calculated result of HRIAHP, UDIAHP and CCDAHP.
YearHRIAHPUDIAHPCCDAHP
20000.69180.17170.5370
20010.67640.18770.5413
20020.67370.18370.5374
20030.63100.20090.5291
20040.63200.21630.5394
20050.62170.23270.5447
20060.59220.24500.5378
20070.59060.25940.5458
20080.61270.27200.5641
20090.62030.28680.5765
20100.63400.29880.5900
20110.60810.31260.5855
20120.62670.32830.6033
20130.59370.34530.5970
20140.60860.35570.6100
20150.67360.37220.6490
20160.73650.38440.6825
20170.76630.39860.7020
20180.80000.41170.7218
20190.81510.42760.7354
20200.86460.45620.7671
Publisher’s Note: MDPI stays neutral with regard to jurisdictional claims in published maps and institutional affiliations.

