Abstract
The importance of perspective-taking crosses disciplines and is foundational to diverse phenomena such as point-of-view, scale, mindset, theory of mind, opinion, belief, empathy, compassion, analysis, and problem solving, etc. This publication gives predictions for and a formal description of point-view Perspectives (P) or the “P-rule”. This makes the P-rule foundational to systems, systems thinking and the consilience of knowledge. It is one of four universals of the organization of information as a whole. This paper presents nine empirical studies in which subjects were asked to complete a task and/or answer a question. The samples vary for each study (ranging from N = 407 to N = 34,398) and are generalizable to a normal distribution of the US population. As was evident in Cabrera, “These studies support—with high statistical significance—the predictions made by DSRP Theory (Distinctions, Systems Relationships, Perspectives) point-view Perspectives including its: universality as an observable phenomenon in both mind (cognitive complexity) and nature (material complexity) (i.e., parallelism); internal structures and dynamics; mutual dependencies on other universals (i.e., Distinctions, Systems, and Relationships); role in structural predictions; and, efficacy as a metacognitive skill”. These data suggest that point-view Perspectives (P) observably and empirically exist, and that universality, efficacy, and parallelism (between cognitive and material complexity) exist as well. The impact of this paper is that it provides empirical evidence for the phenomena of point-view perspective taking (“P-rule”) as a universal pattern/structure of systems thinking, a field in which scholarly debate is often based on invalidated opinioned frameworks; this sets the stage for theory building in the field.
1. Introduction
It is typical to provide an Introduction, Methods, Results, Discussion and Conclusion for empirical studies. We keep to the norm but we share seven studies rather than just one. It would have benefited the authors more to publish seven separate papers about each different study. However, the authors chose to keep the studies together and create an “ecology of empirical studies”. Four out of seven studies were relatively small. They were usually a single question that tested a particular hypothesis and isolated a specific effect. In addition, the results are better understood as a whole rather than as isolated parts because the studies focus on specific aspects of the same phenomena (point-view Perspectives Rule). If the reader wishes to read each study individually, they can do so simply by reading Section 2.1, Section 3.1 and Section 4.1 together.
Perspective is central to the field of systems thinking [1,2,3,4,5,6,7,8,9,10,11,12,13,14] or cognitive complexity. Perspective taking is a cognitive act that underlies numerous positive and negative phenomena (i.e., empathy, compassion, analytics, bias, stereotypes, conflict, prejudice, etc.). That is, perspective, in and of itself, is not inherently positive or negative but both [13,15,16,17,18]. The wider point we are making is that it is universal. Indeed, perspective taking underlies numerous other phenomena including: frame of reference [19,20,21,22], scale [23,24], point of view [25,26,27,28], viewpoint [6,29], mindset [30,31], beliefs [32,33], opinions [34], bias [13,16,35,36], compassion [37,38,39,40], empathy [41,42,43], analytical thinking [44], critical thinking [45], problem solving [46,47], and many more. Understanding perspective taking is an absolutely essential part of understanding not only the universe and natural systems (material complexity) but also systems thinking and human cognition (cognitive complexity) [44,48,49,50,51,52,53].
1.1. Empirical Findings of Perspectives Across the Disciplines
The ecology of nine studies exists in the context of a much wider literature of literature reviews and empirical studies on perspective taking. As Cabrera writes [54]
“There is an abundance of interest, literature, and empirical findings on perspective taking across the disciplinary spectrum (i.e., the physical, natural, social and applied sciences). Perspective is one of the most important aspects of human cognition, given our status as social animals. In a literature review of perspective taking [53] a number of empirical studies show the universality of perspectives across the disciplines [5,6,8,9,11,12,13,14,19,55,56,57,58,59,60,61,62,63,64,65,66,67,68,69,70,71,72,73,74,75,76,77,78]. In the cognitive sciences (as well as the physical and natural sciences) it is clear that perspectives are ever present [8,11,19,56,57,58,59,61,63,64,66,75].It is also clear that perspectives are not enough. That they are necessary but not sufficient to explain an underlying, universal, structural grammar of cognition. Empirical findings from the literature also reveal what DSRP Theory predicts: that point-view perspective is integral with other universals (i.e., Distinctions, Systems, Relationships) [49,79,80,81,82,83,84,85,86,87,88,89,90,91,92,93,94,95,96,97,98,99,100,101,102,103,104,105,106,107,108,109,110].”
Figure 1 shows the disciplinary distribution of this research.

Figure 1.
Point-view Perspectives (P) Research Across the Disciplines (adapted from [53]).
Cabrera’s 2021 review of research [53] is built upon other older literature reviews [48,51]. It is part of an accumulating body of evidence in support of the predictions made by DSRP Theory generally and point-view Perspectives in particular. Over 150 studies are included in this literature review. It therefore represents a “tip of the iceberg” because the studies presented are a small sample of the studies that exist. The findings, utility, and application of point-view Perspectives (P) are ubiquitous and pervasive. A few of the studies from the literature review [53] include:
- Zwick’s [61] findings that show experimentally (and not metaphorically, but materially) that atoms have their own perspective on their environment;
- Endler’s 2012 [55] research shows perspective taking in the mate-display building behavior of Bowerbirds;
- Baron-Cohen et al.’s 1985 [59] groundbreaking work on “theory of mind” in the Sally-Anne Experiments;
- Premack and Woodruff’s (1978) [8] research demonstrating that chimpanzees have “theory of mind” perspective taking;
- Chamovitz [57] and Montesinos-Navarro et al. [58] independently discovered that plants have been shown to take Perspective; and
- Vallar et al.’s 1998 [19] use of fMRI technology to investigate how the brain creates an “egocentric spatial frame of reference”.
1.2. Theoretical Work on Perspectives
The simplest accurate statement of DSRP Theory is thus [54]:
 |
DSRP Theory details quite a bit more than this simplification relays [48,51,54,111,112,113,114]. There is more empirical evidence supporting DSRP Theory than any other existing systems theory or framework (which is not a theory) [48,53,54,115,116,117,118,119,120,121]. The reader should look at the other citations in this publication for more information on DSRP Theory as this paper focuses only on the perspectives rule in DSRP.
Cabrera [48] expanded on perspective taking theoretically by proposing in DSRP Theory that: (1) perspectives are universal to mind and nature; (2) all perspectives (P) constitute an observer/observed relationship between point (p) and view () variables (what Cabrera calls elements); and (3) that Perspectives are not reserved merely for people or “things with eyes”. That is: any person, place, thing, or idea; any element in an ecology; or any node in any network has a unique perspective that exists in nature (material systems) and can be taken by the human mind. For example, an elk and wolf in a Yellowstone ecosystem have a perspective and humans can cognitively take their perspectives to better understand the system. Likewise, an item, like an atom or a blood cell has a unique perspective, as does a position in space, or any concept (thing: economic, structural, political, etc.). DSRP Theory explained that not only do these perspectives exist in the ’real’ material world, perspectives can also be taken cognitively to give us access to new insights. Cabrera explains [122], “DSRP Theory further stipulated that awareness of these existential perspectives (metacognition of P-rule) can increase one’s effectiveness in thinking about systems, modeling systems, or in increasing cognitive fluidity, complexity and robustness”. This critical insight—part of DSRP Theory—exposed the universality of point-view Perspectives (“P-rule”) at the theoretical level. Table 1 shows the structure of the point-view Perspectives rule according to DSRP Theory.

Table 1.
Point-view Perspective Rule or P-rule.
Note that DSRP theory comprises four dynamically interacting structures: identity-other Distinctions (D), part-whole Systems (S), action-reaction Relationships (R), and point-view Perspectives (P). Herein, we focus on point-view Perspectives (P). However, DSRP Theory also predicts that the four rules are dynamical and are necessary and sufficient. Thus, for a perspective to exist, the other rules need to be at play. Table 2 illustrates how Perspective itself, requires Distinctions, Systems, and Relationships to exist.
Table 2.
DSRP is Necessary and Sufficient for P-rule [54].
The nine studies described herein represent an “ecology of empirical studies” which are further supported by multiple meta-analytical reviews of the literature [48,53,116] and 3 other “ecologies” that focus on: identity-other Distinctions (D) [119], part-whole Systems (S) [121], and action-reaction Relationships (R) [120]. The reader may want focus on this ecology of nine studies (herein) by reading them as an integrated ecology of studies. Alternatively, the reader may want to digest each study one at a time by reading, for example the Methods (Section 2.1), Results (Section 3.1), and Findings (Section 4.1) for a single study.
1.3. Research Questions that Underlie the Hypotheses for P-Rule Studies
The studies presented in this paper are part of a larger ecology of research questions based on the predictions of DSRP Theory and their various implications. This ecology of studies empirically investigates these predictions. Table 3 shows the matrix of research questions upon which our hypotheses, null hypotheses, and research design and findings are based.
Table 3.
Research Questions that Underlie the Hypotheses for P-rule Studies.
Thus, this set of studies on the P-rule of DSRP Theory is part of a research program that attempts to answer the research questions. The first is to establish the existence of the Perspectives rule in Mind and Nature. The second is to apply the Perspectives rule to demonstrate the efficacy of the rule in understanding Mind and Nature. The following research questions are addressed in this publication:
- Existential (Basic research): focused on the question, as Cabrera [119] explains, “Does DSRP Exist? Does DSRP exist as universal, material, observable phenomena?”
- Efficacy (Applied research): focused on the question as Cabrera [122] explains, “Is DSRP Effective? Does metacognition of DSRP increase effectiveness in navigating cognitive complexity in order to understand system (material) complexity? This gets at the critically important question of ’parallelism’—defined as the probability that our cognitive organizational rules align with nature’s organizational rules—which is central to the idea of the Systems Thinking/DSRP Loop1 (Figure 2).
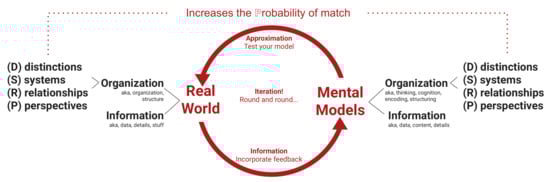 Figure 2. The ST/DSRP Loop [122].
Specifically, the empirical studies in this paper focus on the P-rule, or the “P” in DSRP Theory, although other papers offer research on the identity-other Distinctions (D) studies [119], part-whole Systems (S) studies [121], and action-reaction Relationships (R) studies [120]. The empirical studies discussed in this publication address specific questions about the Perspectives rule:
- Does the perspective rule exist in Mind and Nature? (in the same way Evolution or Heliocentrism exists)
- Does metacognitive awareness of the Perspective rule increase effectiveness in cognitive complexity, systems thinking, or fluidity, etc.?
There are nine studies presented herein. They include: Only See Blue Study, Where’s the Plant Study, What’s a Bat Study, Where’s Waldo Study, Fishtank Perspective Study, P-Mapping Study, P-STMI Study, and P-Fishtank Study. Although the design of these research studies focused on these questions separately, there is some overlap among these studies in their results. As a general guideline, however, one is safe to conclude that the Only See Blue Study, Where’s the Plant Study, What’s a Bat Study, Where’s Waldo Study and Fishtank Perspective Study focused on existential questions and the P-Mapping Study, P-STMI Study2, and P-Fishtank Study focused on efficacy.
The ecology of studies presented herein, aims to quantify the theoretical predictions made by DSRP Theory, and their various implications by showing that they are observable and significant. This research empirically tests and—with highly statistically significant results—supports these specific predictions. In what follows, we present nine empirical studies that together form an ecology of these findings.
2. Materials and Methods
The following is true for all studies, unless otherwise noted. Subjects were asked to respond to a task. Prior to deployment of the studies, several pilot tests were conducted with small samples to ensure construct validity and to correct language-based confusion. Sample size for the studies was based on generalizability such that given a Confidence Level (CL = 95%), Confidence Interval (CI = 5), and a US population of 350,000,000, the sample size was calculated to be 384. We chose samples larger than this number). The samples range from N = 407 to 34,398 (which are outlined per study below). Samples were based on normal distribution of US population. Samples were identified using the following demographics (unless otherwise noted): US population; 50/50 gender split; an age range of 22–65 years old to avoid underage subjects; and representative of the census numbers for education (e.g., completion of high school, community college, college, masters, PhD). All responses were voluntary and administered online in the respondent’s place of choice. Demographic variables were only used for sampling purposes to ensure representation proportional to the US population. These demographics were not the focus of these studies (although we do report on them where there was statistical significance in results). The purpose of these studies was to assess the universality and similarity across demographics. Stratified sampling methods matching the census of the US population and voluntary-response sampling was used for all studies unless otherwise noted. The Only See Blue, Ball-Dot-Hole, Where’s Waldo?, Financial Fish, What’s a Bat?, and Wheres the Plant? studies all utilized a single sample. The P-Mapping study utilized an independent, self-selecting sample of individuals who used systems mapping software. The P-STMI study used an independent, self-selecting sample of individuals who voluntarily completed a survey. For the P-Fishtank, a stratified sampling method matching the census of the US population and voluntary-response sampling was used with independent samples for D, S, R, and P.
Procedurally, the Only See Blue, Ball-Dot-Hole, Where’s Waldo?, Financial Fish, What’s a Bat?, and Wheres the Plant? studies were presented in a particular order (as listed above) to reduce possible priming effects between and among the questions.
Data was collected and analyzed. Incomplete/nonsense data were removed. Each study below has a detailed methods section. Examples of incomplete data are blank fields. Examples of nonsense data include only obvious nonsense such as “asfhjbasfh” or “cut and paste” of the question across all answers.
2.1. The Only See Blue Study Methods
Statistical analysis (N = 407) was performed using R v 3.6.3. (Statlib, Auckland, New Zealand) Counts and percentages were used to summarize categorical variables and the mean ± standard deviation (SD) or the median/interquartile range [IQR] was used for continuous normal and non-normal variables, respectively. Chi-square test of independence was used to assess the association between categorical variables. Those who preferred not to state any of the socio-demographic information were coded as missing. Age and education were recoded to simplify the analysis. Binary logistic regression was used to assess factors associated with choosing a number other than seven (following a different cognitive perspective). Chi-square test for goodness of fit assessed whether the probability of choosing a number other than four was significantly different from the expected probability of zero (i.e., there is a difference in the cognitive perspective between respondents). Hypothesis testing was performed at 5% level of significance.
2.2. The Where’s the Plant? Study Methods
Statistical analysis (N = 407) was performed using R v 3.6.3. Counts and percentages summarized categorical variables. Pairwise McNemar’s test was used to assess whether the proportion of correct answers was significantly different between each pair of the four scenarios. McNemar’s test was used to take into account the paired nature of the data (each respondent was presented with all possible scenarios). Generalized linear mixed modelling (GLMM) was used to assess the association between perspective, direction of the person in the image, and the probability of answering the question correctly. Hypothesis testing was performed at 5% level of significance. Procedurally, the questions where ordered as presented in the results.
2.3. The What’s a Bat? Study Methods
Statistical analysis (N = 407) was performed using R v 3.6.3. Counts and percentages were used to summarize categorical variables. Pairwise McNemar’s test was used to assess whether the distribution of answers was significantly different between the three situations. Chi-square test for goodness of fit assessed whether the observed proportions were significantly different from the proportions expected under the null hypothesis. McNemar’s test was used to take into account the paired nature of the data (each respondent was presented with all possible scenarios). Generalized multinomial logistic regression (GLMM) was used to assess the association between the situation and perception of the bat. Hypothesis testing was performed at 5% level of significance. Procedurally, this study had 3 questions presented in a particular order as detailed in the analysis.
2.4. The Ball-Dot-Hole Study Methods
Statistical (N = 407) analysis was performed using R v 3.6.3. Counts and percentages were used to summarize categorical variables. Chi-square test for goodness of fit was used to assess whether the observed proportions were significantly different from the proportions expected under the null hypothesis. We test four null hypotheses: the first three were that the observed probability would be significantly different from the expected probability of 100% for any of the three options. The fourth null hypothesis was that the responses would be equally distributed (33% for each response). Fisher-Exact test was used to assess the association between perspective (reason) and the chosen item. Hypothesis testing was performed at 5% level of significance. Procedurally, this study had 2 questions presented in a particular order with display logic based on the answer to the first question.
2.5. The Where’s Waldo Study Methods
Statistical analysis (N = 407) was performed using R v 3.6.3. Counts and percentages were used to summarize categorical variables. Procedurally, this study had 5 questions presented in order as shown in the analysis.
2.6. The Financial Fish Study Methods
R v 3.6.3 was used to perform statistical analysis on the sample (N = 407). The distribution of categorical variables were summarized using percentages and counts. To summarize the distribution of continuous variables, the median and interquartile range were used. Researchers used the Wilcoxon signed-rank test. This study had 2 questions presented in order.
2.7. The P-Mapping Study Methods
The sample (N = 34,398) consisted of self-selecting software users. The data are from use patterns in the Plectica Systems Mapping Software v1 (Plectica, New York, NY, USA) developed by Cabrera [123]. The data were collected from a self-service web application. The results provided herein are for the Perspectives pattern only, but the total collected data included all four DSRP patterns.
2.8. The P-STMI Study Methods
Data were collected from the Systems Thinking and Metacognition Indicator (STMI). The indicator was developed by Cabrera and Cabrera [118]. The sample of subjects (N = 1059) was a “self-selecting sample of professionals between the ages of 18–65 who participated in beta version of STMI post-validation. Data were collected from a self-service web application that administers the STMI. Limited demographic data were collected. The data, which is on both competence and confidence measures, cuts across all four patterns of DSRP and “mix and match of DSRP patterns” [119]. The results provided in this publication are for only the Perspectives pattern. See [118] for more information on the data and findings.
2.9. The P-Fishtank Study Methods
Using a sample (N = 1750 baseline; N = 350 Post) that was generalizable to the US population, data were collected on all four DSRP patterns.For this manuscript, just the results on the Perspective pattern are reported. See [122] for a report of the wider data. This study had 2 questions separated by a treatment in a standard pre-post design. This order is presented in the analysis.
3. Results
3.1. The Only See Blue Study Results
Subjects were presented a hypothetical perspectival prime, “If you only see blue, how many objects are there?” (See Figure 3). This study determined if introducing a cognitive perspective would alter a simple object recognition and counting task. Our hypothesis was that, as a result of the perspectival prime, subjects would alter (by 3) the number of objects they actually see (7) and and therefore answer 4 (). In effect, taking a cognitive perspective of someone who was color blind to the color orange. Thus, the null hypothesis was that subjects would see the number of objects that actually existed (7) ().
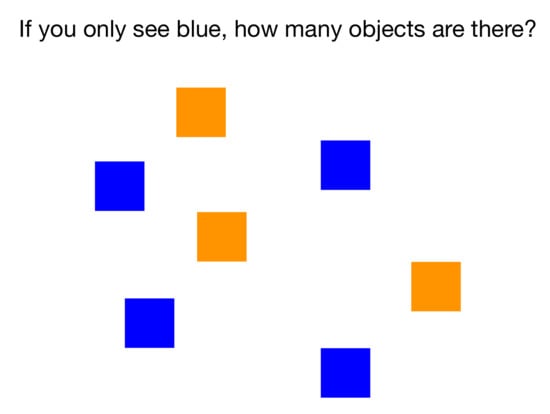
Figure 3.
Only See Blue Study Task.
Figure 4 shows that the majority of the subjects observed four objects (89.7%), 6.1% reported seven objects, and 2.2% reported observing three objects.
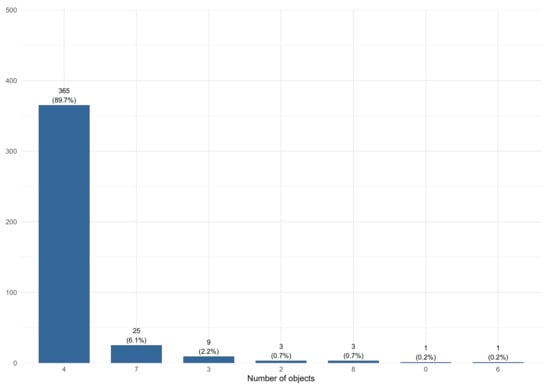
Figure 4.
Only See Blue Study Results.
Results in Table 4 for the goodness of fit show that the observed probability of choosing a number other than four was highly significantly different3 from the expected probability of zero under the null hypothesis ( = 357.06, p < 0.001 ***). Thus, the null hypothesis () was rejected and the alternative hypothesis () that a perspectival prime, would highly significantly determine subjects’ responses—and therefore answer 4—is supported4. Sample size calculations were performed using G-Power, v 3.1.9.7, Heinrich-Heine-Universität Düsseldorf, Germany and R v 3.6.3. A sample size of 196 respondents was needed to detect a small effect size (Cohens’ w = 0.3) with 80% power at 5% level of significance. The effect size was estimated using Cramer’s Phi. Crude odds ratio were also calculated as a measure of association. Cramer’s Phi can be used as a measure of effect size for one dimensional data where the observed data are compared to expected values.
Table 4.
Chi-square test for goodness of fit results.
3.2. The Where’s the Plant? Study Results
The Where is the Plant? study assessed the effects of certain aspects (alignment and anchoring) of perspective taking on answer choice. Alignment refers to whether the perspective of the “employee” was aligned with the perspective of the subject. Anchored refers to whether the task distinguished the plant in relation to the “employee” in the image or left it ambiguous. Table 5 shows the four tasks presented to subjects and their variables. All four combinations of these two variables were presented to all subjects. The order of the questions (and images), one at a time, was as follows: Not-anchored and Not-aligned; Not-anchored and Aligned; Not-aligned and Anchored; and, Anchored and Aligned.
Table 5.
Four Combinations of Two Variables.
The Null Hypothesis was , or that there would be no effect of alignment or anchoring on answer choice. The Alternative Hypothesis was , such that we would see an effect of alignment or anchoring on answer choice. The results in Figure 5 and subsequent statistical tests show that we can reject the null hypotheses and conclude that the null hypothesis is not true which shows the effect of alignment and anchoring on answer choice.

Figure 5.
Proportion of correct answers in each of the four scenarios.
The task was completed by 407 subjects. Results showed that the proportion of subjects who chose ’to the right’ was highest when the image was aligned whether it was anchored (93.1%) or not (94.3%) and lowest when the image was not aligned/not anchored (34.9%). Two-thirds of the subjects chose ’to the right’ when the image was not-aligned but anchored (65.4%).
Results confirm (Table 6) that the probability of choosing right was significantly different from the probability of choosing left in all four scenarios (p < 0.001 *** for all comparisons). Sample size calculations were performed using G-Power and R v 3.6.3. Cramer’s phi was used as a measure of effect size for Chi-square G test with the following cut-off values: (1) small 0.3, (2) medium 0.5, (3) and large 0.8. Cohen’s g was used as a measure of effect size for pairwise comparisons with the following cut-off values: 0.00–0.05 Negligible, 0.10–0.15 Small, 0.20–0.25 Medium, and 0.25 or more Large. For Chi-square G test, a sample size of 196 respondents was needed to detect a small effect size (Cramer’s Phi = 0.3) with 80% power at 5% level of significance. For McNemar’s test, a sample size of 220 was needed to detect an effect size of 3 (OR = 3) assuming 20% disconcordant pairs, alpha of 0.005 to take into account multiple pairwise comparisons (N = 10) with 80% power.
Table 6.
Chi-square G test results.
Results also showed (Table 7) that the probability of choosing right was not associated with the anchoring of the person in the image when the person in the image was aligned with the subject (p = 0.47). All remaining pairwise comparisons were statistically significant (p < 0.001 ***). The anchoring was associated with the probability of choosing right or left when the person in the image was not aligned with the subject (p < 0.001 ***). This can be explained by the probability of choosing ’to the right’ which was much higher when the image was Not-Aligned/Anchored (65.4%) which is much higher than when the image was Not-Aligned/Not-Anchored (34.9%). This indicates an interaction between anchoring and alignment.
Table 7.
McNemar test results for pairwise comparisons.
Table 8 shows that the alignment was associated with the odds of choosing right (OR = 0.14, p < 0.001 ***) which indicates that the odds of choosing right were 86% lower when the person was not aligned compared to when the person was aligned. The anchoring was not significantly associated with the odds of choosing right (OR = 1.24, p > 0.05). However, the interaction between both terms was statistically significant (OR = 0.22, p < 0.001 ***). This indicates that the odds of choosing right is lower by 78% when the person is not aligned and not anchored compared to when the person is aligned and not anchored. The probability of choosing right is illustrated in Figure 6.
Table 8.
Generalized linear mixed modelling analysis.
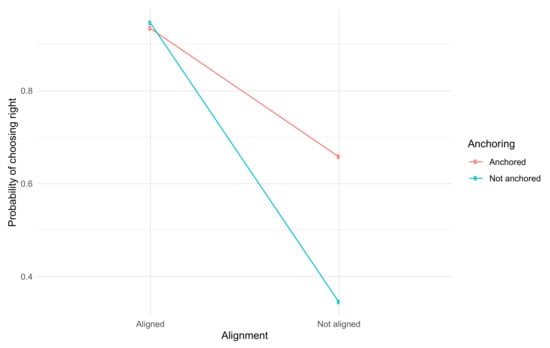
Figure 6.
Effect of Alignment and Anchoring on Choice.
3.3. The What’s a Bat? Study Results
The What’s a Bat? Study assessed the effect of a perspectival scenario on how subjects perceived and named a common object (a baseball bat). Subjects were asked to complete three tasks presented one at a time, in the order shown in Table 9.
Table 9.
Three Bat Study Tasks.
Results showed (Figure 7) that almost all respondents perceived the image as a bat (96.3%) in the baseline scenario. The responses varied for the remaining two situations that involved a specific scenario. In case of violent attack, slightly more than half of the respondents perceived the bat as a bat (53.8%) while less than half (44.5%) perceived it as a weapon (44.5%). In the third scenario, 61.2% of the respondents perceived the image as firewood and one-third (35.4%) perceived it as a bat (See Table 10).
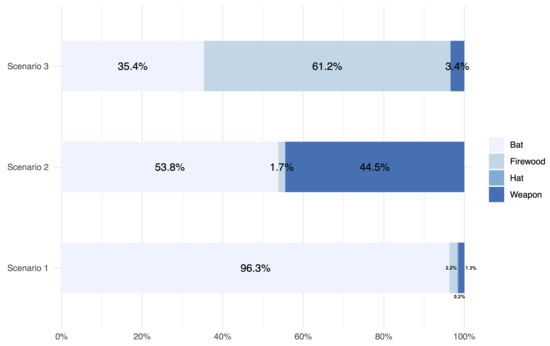
Figure 7.
Distribution of responses based on the situation.
Table 10.
Distribution of Responses Across Scenarios.
Our hypothesis was that, as a result of the perspective born of the scenario, subjects would alter how they distinguished the object (image). Therefore, our null hypothesis, , is shown in Equation (1) and our alternative hypothesis, , is shown in Equation (2).
The alternative hypothesis was:
Results of the Chi-square test (Table 11) showed that the observed probabilities were significantly different from the expected probabilities under the null hypothesis in all three scenarios (p < 0.001 *** for all comparisons). Sample size calculations were performed using G-Power and R v 3.6.3. Cramer’s phi was used as a measure of effect size for Chi-square G test with the following cut-off values: (1) small 0.3, (2) medium 0.5, (3) and large 0.8. A sample size of 196 respondents was needed to detect a small effect size (Cramer’s Phi = 0.3) with 80% power at 5% level of significance. The odds ratio was used as a measure of association between the observed and the expected values under the null hypothesis.
Table 11.
Chi-square G test results.
Results of the multinomial logistic regression analysis showed (Table 12) that the odds of choosing firewood (compared to the odds of choosing the bat) were significantly higher in scenario 3 (lost) than scenario 1 (OR = 84.73, p < 0.001 ***). The odds of choosing a hat was significantly lower in Scenario 2 and 3 than Scenario 1. The odds of choosing a weapon were 54 and 6.35 times higher in Scenarios 2 (OR = 54, p < 0.001 ***) and 3 (OR = 6.35, p < 0.001 ***) than Scenario 1, respectively.
Table 12.
Multinomial logistic regression analysis.
3.4. The Ball-Dot-Hole Study Results
The Ball-Dot-Hole study was a two-step task where the second task was dependent on the subject’s answer to the first. The first task is to describe what is seen when shown an image and answer if it is a ball, dot or hole. Then, depending on their answer they were asked a follow up: Why not [answer not chosen 1] or [answer not chosen 2]?
Our null hypothesis was that perspective would not affect subjects’ choice; that shown a circle and given three choices to describe what they see (Ball, Dot, or Hole) they would all make the same choice because a circle is a natural kind that all people would see the same way. Thus, our null hypothesis, as shown in Equation (3) is for the the first task (Q1), where and ∨ means OR. A second dependent question asks them the reason they did not choose the other two options. Thus, our null hypothesis for the second task (Q2) was . If perspective was not a factor, everyone would see the object the same way and have the same unitary reason for doing so.
Our alternative hypothesis for Q1 was , ∧ means AND. For Q2 as shown in Equation (4). This is because we expect that perspective will effect answer choice, so in Q1 answers will vary and in Q2 reasons will vary.
Figure 8 shows that the majority of the respondents (60.7%) chose “ball” while 34.9% and 4.4% chose hole, and circle, respectively.
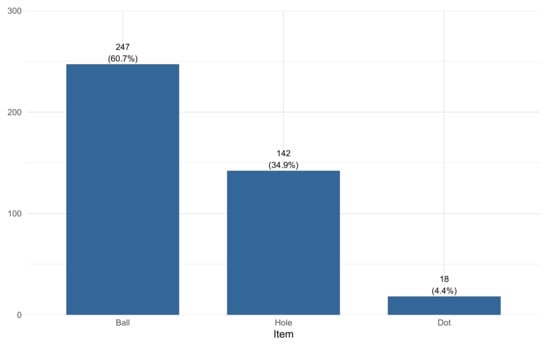
Figure 8.
Distribution of responses to Ball-Dot-Hole Task.
Results (Table 13) show that the probability of observing either the ball, dot, or hole was lower than 100% for all three choices (p < 0.001 *** for the three comparisons). Moreover, the observed probability for three items was significantly different (p < 0.001 ***) from the expected equal distribution (33% for each item). Null H1, H2, and H3, for example, tested whether ball, dot, or hole was equal to 100%, respectively. H4, tested whether the proportions were equal for all three options. Alt H1, H2, and H3, tested whether any of them was <100%. Whereas Alt. H4 tested whether the proportions were not equal. Thus, the p-value will be <0.05 if the observed probability for any of these three options is not equal to 33%. Sample size calculations were performed using G-Power and R v 3.6.3. Cramer’s phi was used as a measure of effect size for Chi-square G test with the following cut-off values: (1) small 0.3, (2) medium 0.5, (3) and large 0.8. A sample size of 196 respondents was needed to detect a small effect size (Cramer’s Phi = 0.3) with 80% power at 5% level of significance.
Table 13.
Chi-square G test results for Ball-Dot-Hole Tasks.
When asked a follow up question—“Why didn’t you choose [the other options]?”—results (Figure 9) showed that 72.7% of subjects whose reason was coded as `boundary’ chose hole than ball or dot. Whereas, subjects whose reason was coded as `size’ and `superficial’ chose ball.
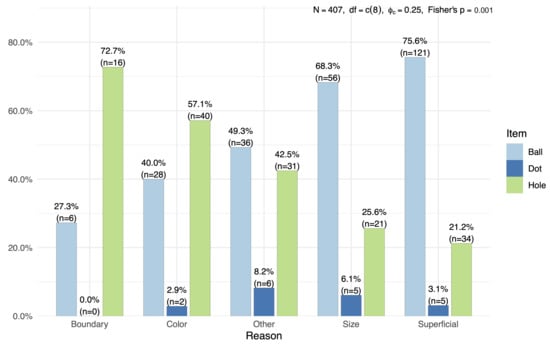
Figure 9.
Frequency of Ball-Dot-Hole Choice for Stated Reason.
Results (Figure 10) show that the most common reason for choosing ball was the coded group `superficial’ while the most common reasons for choosing dot and hole were `other’ and `color’.
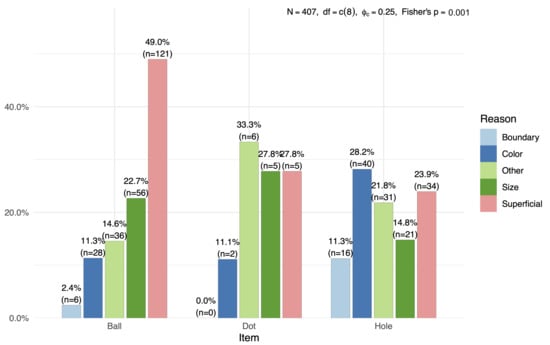
Figure 10.
Frequency of Stated Reason for Ball-Dot-Hole Choice.
3.5. The Where’s Waldo Study Results
The Where’s Waldo study aimed to determine if perspective taking was a factor in a common cognitive process: searching for and identifying a known item amongst other items. The alternative hypothesis was that perspective taking is an essential element of this search process. This is similar to the Where’s Waldo game. At first you do not even know what Waldo is, but once you have a concept of what Waldo looks like  you can search a complex landscape to find him. During search, you hold an image of Waldo in your mind that acts as a perspectival filter that distinguishes and filters out anything that is not-Waldo. Interestingly, this image-ined perspectival filter requires a composite image-ined image of Waldo and his various parts (his striped hat, goofy face, scarf, etc.). Thus, the alternative hypothesis was . This is because we expect that perspective will affect subjects’ ability to search, find, and identify (by clicking and labeling) an item in a backdrop of items.
you can search a complex landscape to find him. During search, you hold an image of Waldo in your mind that acts as a perspectival filter that distinguishes and filters out anything that is not-Waldo. Interestingly, this image-ined perspectival filter requires a composite image-ined image of Waldo and his various parts (his striped hat, goofy face, scarf, etc.). Thus, the alternative hypothesis was . This is because we expect that perspective will affect subjects’ ability to search, find, and identify (by clicking and labeling) an item in a backdrop of items.If this form of conceptual-perspectival-filtering did not exist, then asking subjects to search and find items they did not otherwise see would not work. Therefore, the null hypothesis was that perspective filtering would have no effect on search (). If they did not see the item the first time, they would not see it the second time. In numerous previous tests during a baseline study (N = 1510) subjects were asked to describe what they see and shown a fishtank. In thousands of responses, not one () subject identified the [somewhat prominent] red-and-green-plant in the left lower area of the aquarium, the filter (existing in multiple places), eyeballs, fish livers, or negated items (not-sand, not-rocks, etc.). Thus, the alternative hypothesis was that subjects would countervail this trend and see the items they had not previously seen (thus ).
Subjects were shown an image of a fishtank and asked to “Click on the and label it,” where the blank was a host of perspectival prompts: ’the red and green plant,’ ’filter,’ ’eyeball,’ ’liver,’ ’not-sand, etc.’ Summary results are shown in Table 14.
Table 14.
Descriptive Statistics and Fishtank Heatmaps for the Where’s Waldo Study Tasks.
Table 14 and Figure 11 show that the majority of subjects completed the 5 tasks correctly. Notably, only 57.2% of the respondents correctly completed the negative-task to identify NOT fish, gravel, rock, coral, vase, or plant.
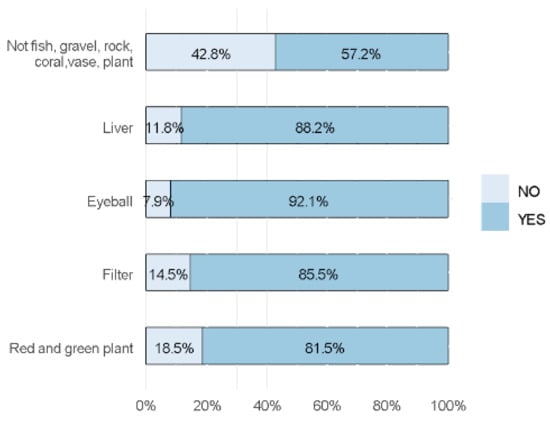
Figure 11.
Fishtank Heatmaps for the Where’s Waldo Study Tasks.
3.6. The Financial Fish Study Results
Two tasks were used to better understand animate and conceptual perspectives. Put simply, an animate perspective is a perspective taken for a “thing with eyes” (e.g., a frog, animal, person, giraffe, etc.). A conceptual perspective is a perspective taken from the point of view of a concept (e.g., as in the 14 systems engineering perspectives: economic, technological, historical, social, health and safety, political, emotional, moral/ethical, security, ecological, cultural, legal, organizational). DSRP Theory predicts any thing (which is every thing) is, and can be, a point of view. The results are shown in Table 15 for .
Table 15.
Animate and Conceptual Perspectives WordCloud Results.
Data in Figure 12 show that 206 (52.5%) subjects did not take a discernible5, animate, fish-like perspective. A total of 115 (29.3%) took a fish-like perspective on one and 46 (11.7%) on two objects from an animate perspective. A total of 186 respondents chose at least one object from an animate fish-like perspective. Subjects identified a total of 309 words from a discernible, animate, fish-like perspective.
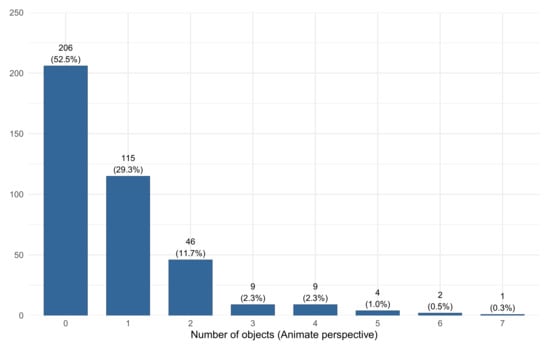
Figure 12.
Number of correct objects chosen from an animate perspective (N = 392).
Figure 13 shows the number of objects (words) coded as identifying a discernible, animate, fish-like perspective. Analysis was restricted to only coded-correct words () from an animate (fish-like) perspective.
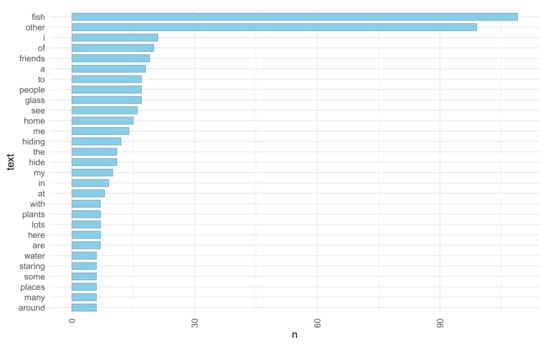
Figure 13.
Objects identified from an animate perspective ().
Figure 14 shows that a total of 133 (38.7%) subjects did not take a discernible, conceptual, financial perspective, and 211 did.
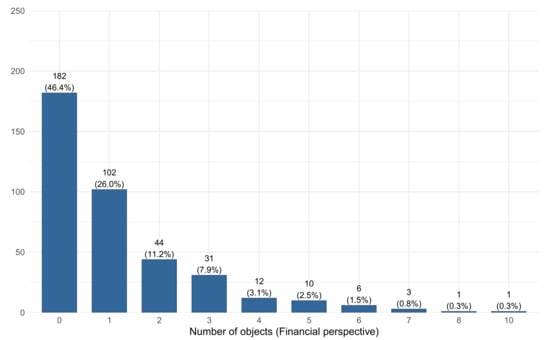
Figure 14.
Number of correct words from a financial perspective (N = 344).
Figure 15 shows a total of 457 words were identified by 322 subjects from the financial perspective, which is higher than the 309 words identified when the animate perspective was used, although the number of respondents was lower in the latter case (N = 344).
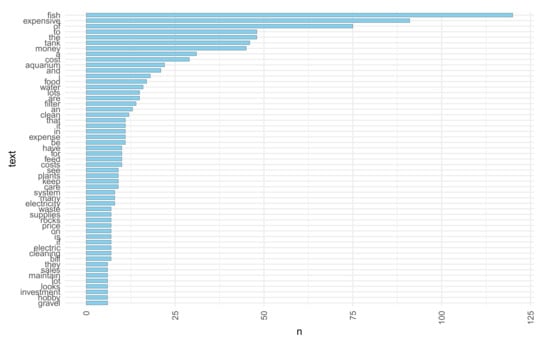
Figure 15.
Objects identified from an animate perspective ().
A comparative analysis was performed on the median number of coded-correct words identified in both situations (animate (fish) and conceptual (financial). The analysis was restricted only to subjects (N = 340) who chose at least one word in both situations. Analysis using Wilcoxon signed-rank test shows (Figure 16) that the median number of words was higher when the conceptual perspective was used (M = 1, IQR [1–2]) than when an animate perspective was used (M = 1, IQR [0–2]) and the difference was statistically significant (p < 0.001 **).
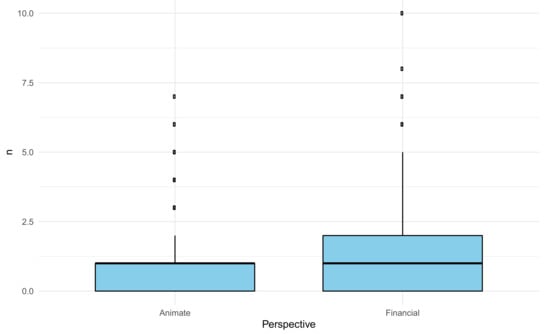
Figure 16.
Distribution of the number of perspectival words.
Generalized linear mixed modeling (mixed ordinal logistic regression) shows in Table 16 that the odds of choosing a conceptual perspective are 2.29 times higher than the odds of choosing animate perspective (OR = 2.29, p < 0.001 **). Although this was not part of the original hypotheses, it is counter to anecdotal experience and therefore unexpected.
Table 16.
Mixed ordinal logistic regression analysis results.
Results also showed (Table 17) that the proportion of subjects who identified at least one correct answer was significantly higher when the conceptual perspective was used ( = 13.67, p < 0.001 **). Sample size calculations were performed using G-Power. A sample size of 220 was needed to detect an effect size of 3 (OR = 3) assuming 20% disconcordant pairs, alpha of 0.005 to take into account multiple pairwise comparisons (N = 10) with 80% power. Effect size was calculated using Cohen’s g.
Table 17.
Comparison of correct answers between animate and conceptual perspectives.
3.7. The P-Mapping Study Results
A study (N = 34,398) determined what people do (and do not do) when they map a system using aggregate data of software users in Plectica6, a systems mapping software. Aggregate data were analyzed based on individual maps for structure only. If a structure was used, it was counted. In other words, each action represented by a click or movement in the map was accounted for across all maps. These data were then analyzed to determine the proportion for each type of action across maps. Cabrera [119] demonstrated that, “48% did nothing, which is consistent with case study research where people faced with an open-ended problem or question (mapping prompt) and/or a blank page or screen (mapping area) had no response and took no action (i.e., they ’froze’)”. 52% of people in the study made 2,066,654 identity distinctions. 48% of people broke down their distinctions into 769,120 parts. 46% of people made 565,999 relationships between things. 25% of people distinguished 87,318 relationships by adding an identity (naming) the relational line. 16% of people took at least one explicit perspective (39,398 perspectives taken). 4% of people distinguished 16,668 perspectives. 2% of people included 3,265 relationships in the view of their perspective as shown in Table 18.
Table 18.
Actions Users Take and Do Not Take When Systems Mapping (N = 34,398).
These data provide insight into both what people do not do and what they do when mapping using systems thinking. Table 19 differentiates between what people do (or did) and what they did not do (or could or should do). The table is a good baseline for what systems thinkers should do more of and what they should continue to do.
Table 19.
What People Do and Do Not Do in Systems Mapping (N = 34,398) [119].
Specifically, less than half of people will make Relationships (46% of people related identities 565,999 times). Only 25% of people distinguished their relationships and only 87,318 times; or zoom into them and add parts () or relate the parts of the whole (). People will look for the direct cause (R), but rarely think in webs of causality (S of Rs). Where Relationships are concerned, as a metacognitive skill, two jigs—“Part Parties” [124] and “RDSs” [125]—can be used to dramatically increase cognitive complexity and efficacy in systems thinking.
3.8. The P-STMI Study Results
Using data collected from the Systems Thinking and Metacognition Indicator (STMI) [118] Study, subjects (N = 1059) showed evidence of the Dunning-Kruger Effect [126], where, in the point-view Perspectives (P) skill, confidence was higher than competence, as demonstrated in Figure 17. In identity-other Distinctions, part-whole Systems, action-reaction Relationships, and point-view Perspectives (the four universals of DSRP theory), the Dunning-Kruger Effect was present. For this publication we highlight the results for only point-view Perspectives. Subjects’ aggregate point-view Perspectives Confidence score was 83.5 while their competency/skill score was 57—a difference of 26.5. The point-view Perspectives universal was where the Dunning-Kruger effect was highest.
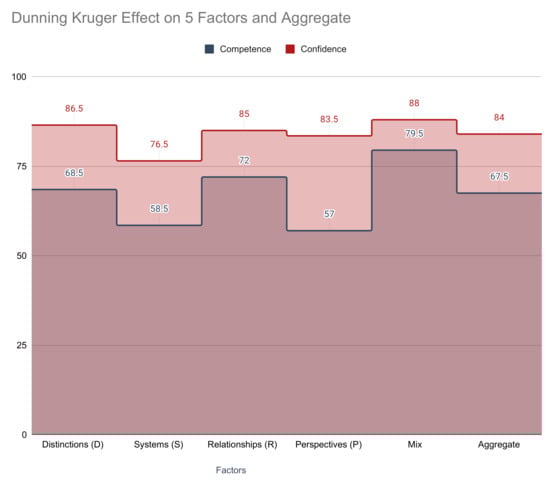
Figure 17.
Dunning-Kruger Effect in point-view Perspectives [119].
3.9. The P-Fishtank Study Results
In the P-Fishtank study [122], there were two conditions: PreP (Pre-Perspectives-prime) and PostP (Post-Perspectives-prime). The results from the study are shown quantitatively, qualitatively and visually in a wordcloud: the differences between the word clouds generated for PreP and PostP are shown in Table 20.
Table 20.
Word Cloud of Response Before and After Perspective Prompt.
The significance of the Perspectives prime is shown in the word clouds. The PostP word cloud has more detail and more descriptive words than the unprimed PreP cloud. In the word cloud images, the larger a word is, the more frequently it is used. Words such as “perspectives” and “see” demonstrate that the subjects were operating from a perspectival mental model. These words were not present in the PreP data. There are more unique words overall in the PostP condition. The quantitative data reflects these same patterns: the responses in the PostP data have more words overall and they are more perspectival. Table 21 shows the quantitative data analysis.
Table 21.
PreP and PostP Aggregate Response Data [122].
A less than one-minute treatment of the P-rule led respondents (with statistical significance) to increased the cognitive complexity of what they saw in a scene and how they described it. Figure 18 shows two [of several] of the dimensions where subjects increased the cognitive complexity of responses with highly statistically significant results. Lewis and Frank [127] showed that the length of words reflects their conceptual complexity. For a more detailed explanation of this study, see [122].
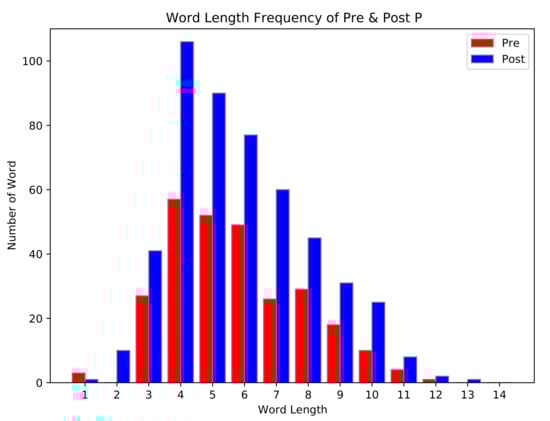
Figure 18.
Increased Cognitive Complexity of Response After <1 min Treatment of P-Rule [122].
4. Discussion of Findings
Across 6 studies, all with high statistical validity, the Only See Blue, Where’s the Plant?, What’s a Bat?, Ball-Dot-Hole, Where’s Waldo?, and Financial Fish studies all support the existence of Perspective universally. These studies support that the point and view are separate variables and can be manipulated with transformative effect. They collectively show the mutual dependencies between P and D, S, R. They show that any object, concept, or thing can be a perspective point or part of a perspectives view based on the observes/observing relationship. These studies, along with the P-Mapping, P-STMI, and P-Fishtank show that P-rule, as a metacognitive skill, has high efficacy with low investment.
4.1. Only See Blue Study Findings
This research shows with highly statistically significant results (p < 0.001 ***) that a simple perspectival prime can dramatically effect the results of cognition and how reality is perceived. The perspectival prime itself is comprised of two elements, a point (“if you only see blue”) and a view (a request to recognize and count the number of objects that exist). Seven objects exist, but a majority of subjects only identify four. Interestingly, this could be perceived to defy the observable fact that there are 7 objects. Yet, subjects needed no training whatsoever in order to easily “take a perspective” that dramatically alters their worldview, indicating that perspective taking is an innate cognitive function. Note also that in order to formulate this “perspective” at least two elements are required: point and view. However, also that there must be an observer and observed relationship between point and view. The subject needed to assume the role of an observer who could only see blue. They themselves could see orange, but the perspective made it as if they effectively could not. Under this new perspectival regime, the task was relatively easy: 4 objects. The view is the objects. The point is the prompt. The prompt is a conceptual observer who only sees blue and therefore does not see orange. Distinctions need to be made. The Perspective itself is a part-whole System (point and review related) which includes the necessity of a Relationship. Note also that the prime effected individuals at their own psychological level of cognition. However, it also affected the social cognition (the statistical sum of individual cognitions). Thus, we can speak of individual’s perspectives but also about the group’s collective perspective.
An alternative explanation is that because the instructions for the task (“If you only see blue, how many objects are there?”) are ambiguous, subjects are attempting to interpret the researcher’s instructions and answering accordingly. In this alternative explanation, subjects could interpret “are there” as “how many are observed by people who only see blue” or alternatively as “how many actually exist independent of observers”. This explanation does not really hold, but curiously, even if it did, the results would be the same. The reason it does not hold is that the overwhelming majority of subjects (89.7%) chose four. Thus, for the overwhelming majority of subjects the question was not ambiguous. Nevertheless, let us assume that the results are the effect of question ambiguity. Regardless, the numbers will be the same and the interpretation will remain the same because the whole point is that subjects will take different perspectives when answering the question—this is the only conclusion that explains both the 89.7% (who chose four) and the 6.1% (who chose seven) and even the 2.2% (who chose nine), etc.
Now consider an alternative to this alternative: what if all instructions are ambiguous because perspective is at play universally? That is, what if the interpreting effects we see in all instructions are a function of the perspectival nature of construct formation and therefore construct validity? Another way of saying this is that there are no unambiguous instructions. There is universally a perspective and therefore there is always room for interpretation. This is precisely why the question (instructions) were designed to be purposefully ambiguous. To isolate that perspective exists and is universally at play. The same alternative analysis can be applied to the purposeful ambiguities of the instructions in the Where’s the Plant? study.
4.2. The Where’s the Plant? Study Findings
The results of the Where’s the Plant Study provide us with a number of interesting findings. First, that there is always (universally) a “root perspective”. In this case the root perspective is the perspective of the subject. The root perspective can be in alignment with an alternative perspective (blue images) or not (green images). The direction (left or right) of the plant is entirely relative because left and right are entirely relative. Indeed, the plant could be left and right relative to the edge of the desk, or relative to any other point or object in the scene. Thus, in the four task conditions, there is no “correct or incorrect” answer. Therefore, we are measuring the degree of difference between answers as a proxy for the difficulty or ambiguity of the task. It is clear (with high statistical significance) that the least ambiguous or easiest tasks are when there is alignment between perspectives. Alternatively, the most difficult or most ambiguous tasks are when there is not alignment between the root and alternative perspectives. Said simply, it is easy to agree with people when they agree with us. Or said another way, perspectives different from our own are harder to see, even when we are prompted to see them (as in the anchored cases). Or, we could also conclude that there is more ambiguity when perspective is out of alignment.
Thus, the birth of popular sayings such as: ‘sharing the same perspective’; ‘being on the same page’; ‘thinking in the same way’; ‘seeing things with the same eyes’; ‘having the same outlook or position’; ‘thinking in the same way’; ‘multiple people having the same understanding’; ‘sharing the same information or knowledge’; ‘everyone is in agreement’; ‘thinking in the same way’. All of which are meant to communicate the aligning of perspectives with one another to increase communication, effectiveness, teamwork, etc.
Note how many of these commonly used statements are `metaphors we live by’, as Lakoff explains [128]. They are all deeply rooted in the metaphor of sharing the same physical position and therefore the same positional perspective (as was tested in the study), using terms like: in, being, same, place, position, way, seeing, outlook, eyes, same, share. Thus, there is ambiguity when perspectives are out of alignment, which this study clearly shows.
Of course these results also show that when you’re in a root perspective, there is a certain lock-in to being in it; and also associated difficulty (or escape velocity needed) to get out of it and see a different perspective. The findings show that it is easy to take an alternative perspective when it is in alignment with your own. However, they show us that the reverse is also the case, it is hard to take another perspective when it is not in alignment with your own. More effort, attention, motivation, desire, metacognition will be required.
Of course, the Where’s the Plant Study also makes it clear that perspective is universal and therefore is easy to educe. Whats more, it is clear that there is a point and a view variable in any given scenario or situation; indeed that there actually are several of each and a multitude more possible. We could have asked where the plant is from the perspective of the arm of the chair, edge of the desk, another work colleague, a group of work colleagues, the air molecules in the room, or any point anywhere in the universe. All of which would yield different mental models to determine and all of which would involve taking multiple perspectives simultaneously. Likewise, we see that the perspectives themselves need not be ‘human’ or ‘have eyes.’ They could be conceptual or physical, etc. We see that perspective is a mind-bending, and shape-shifting act, that allows the perspective-taker to travel long distances to impossible places and arrive at commonly shared and reasonable answers. We also therefore see the individual cognition and social cognition at play: that although we differ in the perspectives we take, there is a pattern to our taking them both structurally and informationally.
Although we do not think it would change the essential results of the study, one future adjustment that should be made to this study is that the order of presentation should be counterbalanced. Although subjects were not allowed to adjust previous answers, all subjects did receive the questions in the same order. Thus, although counterbalancing should be done in future studies, we propose that the universality and level of sensitivity to perspective (extremely high and universal) is far grater than the universality and sensitivity to order of operations (relatively low and not universal). Ironically, the very concern (and subsequent critique) of biasing based on order of operations (that requires counterbalancing) only reinforces the universality of perspective. This is because the valid concern is that in an ordered set including item A and item B, if A is first, it will influence or perspectivally prime B and vice versa. Thus, critics can either have their cake or eat their cake, but they cannot have and eat their cake. Either perspective is universally shown in the study’s results, or their concern for the study’s design is an indication of their concern for the universality of perspective. The same concerns, critique and explanation applies to the What is a Bat? and Ball-Dot-Hole studies.
4.3. The What’s a Bat? Study Findings
What is a Bat? Well, it depends on the situation, and the situation alters one’s perspective. The baseline Scenario 1 (See Table 9) shows that 96.3% of people see the object as a bat. However, given the perspective-changing scenario of a violent attack, 44.5% changed how they perceived the object and saw it as a weapon. Interestingly, because a bat itself could be a weapon that’s far less than the 61.2% of people who saw the object as firewood in Scenario 3 where they were lost and cold in the woods.
The highly statistically significant results of this study tells us a few things. First, perspectives exist, even when identifying (Distinguishing) an object as simple as a baseball bat. Second, our perspective can be dynamically altered by the situation. A bat is not a bat is not a bat. Third, the point-view elements of Perspective are dynamical and changing either the point, view, or both, can change the Perspective. In this study, the situation changed the point, and the view also changed as a result. Fourth, this study shows (confirmed by other studies) that these various possible views of an object can become an attributional and relational part-whole structure where a concept or object can ’possess’ multiple parts (i.e., object = {bat, weapon, wood, firewood, stick, etc.}). This part-whole structure (a function of the relational attributes born of perspective) creates a massively interconnected and fluid “set of sets” that can then be used to be creative, innovative or inventive (e.g., use a bat as a weapon or as firewood or as a the pole for a tarpaulin). Finally, we again see the individual cognition and social cognition at play as we see both cognitive variety and universality in the findings.
4.4. The Ball-Dot-Hole Study Findings
The results of this study show that: (1) perspective plays a role in choice; (2) when taking a perspective there is a point and a view; (3) the views are quite diverse (4.42%, 34.89%, 60.69%); (4) subjects’ choice was influenced by a number of different distinctions and relationships they made (having to do with coded answer-groupings: other, superficial, size, color, boundary). These findings show not only that the act of choice requires an act of Perspective taking, but also that Perspective taking, in turn, requires Distinction making (D), Relating (R), and part-whole grouping (Systems, or S).
The lowest number of subjects (4.4%) chose `dot’. This is most likely because a dot is something people consider to be `small’ and `filled in’ rather than `large’ and `open’ ◯. In other words, for most subjects, `open’ and/or `not-filled in’ and `large’ were parts of the conceptual whole that makes up hole or ball, but not dot. In the coding of groupings, we see this in the data in subjects’ reasoned explanations such as:
“[it’s] too big for a dot and it wasn’t filled. A hole is in something. This is mostly like a circle or ball.”
Or,
“A dot would be smaller and solid and black. A hole would be more elongated and filled in to represent a hole on the ground or something of that nature.”
This indicates not only that distinctions (identities) are part-whole structures but also that, similar to the Where’s Waldo study, in which a perspective is used as a filtering tool, this perspective itself is a part-whole System (S) made up of parts. In an important sense, this study is the mirrored reversal of the Where’s Waldo study, cognitively speaking. In the Where’s Waldo task, a perspectival filter was provided. The subject then distinguished the filter and deconstructed the concept into parts (green, red, plant, etc.). This concept was then used as perspective filter to search; for example, identifying something red but then realizing it is not also green and a plant, eventually led to identifying the red-green-plant. Whereas, in the Ball-Dot-Hole study, the view (not the point) was provided (◯); the subject then deconstructed this view into parts (e.g, not filled in, open, big, not small, round, circular, not-slanted, not in something). These parts were then related (matched) to the parts of the available answers. The best match was chosen. This demonstrates the universality and mutual dependencies of D, S, R, and P. Table 22 provides a hypothetical example of the stepped DSRP logic.
Table 22.
Cognitive Steps From Question to Answer Going Through DSRP.
These cognitive steps occur rapidly in the mind, often well beneath our conscious awareness, and not quite as linearly as is presented here in the example. However, what this example illustrates is that the simple act of answering a question requires distinguishing, part-whole deconstruction, and relating the parts of these whole structures, all of which differs according to one’s perspective.
4.5. The Where’s Waldo Study Findings
No one (N = 1510), when asked to describe the fishtank, before OR after priming, described the red or green plant. Yet, when used as a perspective in search, 81.48% (M = 0.81, SD = 0.39, CI = 99%) identified it. This indicates that, aided with a perspective filter, search and identification of non-obvious items in a background of items is easier.
For the 85.50% (M = 0.86, SD = 0.35, CI = 99%) of people who correctly clicked on parts of the filter, the aggregate correctly identified all of the visible parts (See Figure 19 where the pink outlines (added) show the actual location of the visible parts of the filter in the image). These aggregated heatmaps indicate that the same cognitive processes used at the individual level of cognition are also present in social cognition.

Figure 19.
Individual and Social Cognition Identifies All Visible Parts of Filter.
The accuracy and completeness of these aggregated heatmaps for the `Click the filter’ task (Figure 19), also demonstrates that there is wisdom in the crowd as seen again in the `Click on not-X’ task (Figure 20). 57.24% (M = 0.57, SD = 0.50, CI = 98%) clicked correctly on a spot that was ‘NOT a fish, gravel, rock, coral, vase or plant’, thus demonstrating that concepts form individually and in the aggregate (i.e., social cognition) with relative accuracy utilizing DSRP (See Figure 20). This study, in multiple parts, elucidates the complexity involved in searching a scene for an identity (distinction). This disarmingly simple activity requires a perspective. This research shows that both the point and the view can be used to identify distinctions (either the identity or the other) which are themselves interrelated parts that make up systems. Thus, this research shows the fundamental dynamics and inter-dependencies between Distinctions (D), Systems (S), Relationships (R), and Perspectives (P).
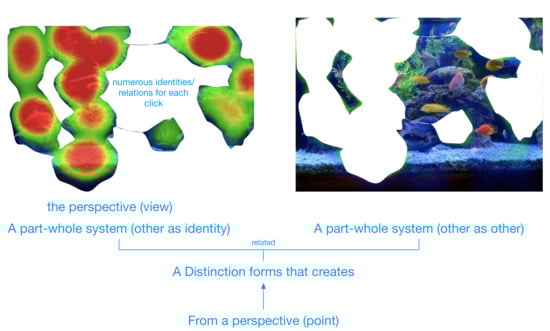
Figure 20.
Individual and Social Cognition.
Figure 20 also demonstrates the role perspectives play (dependencies) in creating even complex Distinctions that involve systemic identities and others (that is, complexes of part-whole and relational structure).
92.13% (M = 0.92, SD = 0.27, CI = 99%) of people correctly clicked on eyeball when perspectivally prompted. Eyeballs are visible in the image. However, 82.20% (M = 0.88, SD = 0.32, CI = 99%) of people correctly clicked on in the area a liver would be when perspectivally prompted. Livers are NOT visible in the image. This means people had to imagine this part to find it (See Figure 21).
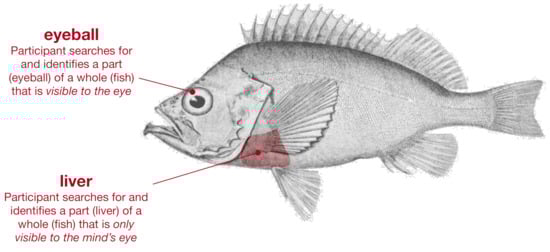
Figure 21.
Image-ining Fish Livers.
A number of conclusions can be made as a result of this study:
- Perspectival filters are highly effective in searching and finding tasks;
- Both point and view are part-whole systems made up of related parts;
- Both point and view are Distinctions (an identity);
- Point-view Perspectives are effective in making structural predictions; even when structural prediction are used to “image-ine” things that exist but that are not obvious; and
- Point-view Perspectives are co-dependently related to part-whole Systems, identity-other Distinctions, and action-reaction Relationships.
4.6. The Financial Fish Study Findings
When coded for whether or not participants (N = 392) took a fish’s perspective, 185/392 or 46.68% of participants took an obvious fish perspective. All other responses were ambiguous. For example, if the participant responded, “fish, gravel, vase” that was determined to be ambiguous and thus coded a ‘0’ for each response. However, if the participant responded, “home, fish, gravel, vase” that was determined to be from a fish’s perspective and received a code of ‘1’ for each response. Of the 1328 total responses, 53.61% or 712/1368 were obviously from a fish’s perspective. To be clear, the remaining 46.39% were not necessarily not from a fish’s perspective, they were simply ambiguous and unable to be coded as such.
Coded for whether or not participants (N = 342) took a financial perspective, 206/342 or 60.23% of participants took an obvious financial perspective. All other responses were ambiguous. For example, if the participant responded, “fish, gravel, vase” that was coded as ‘0’ to be ambiguous for each response. However, if the participant responded, “costs of fish, costs of gravel, costs of vase” that was determined to be from a financial perspective and coded as ‘1’ for each response. Of the 762 total responses, 59.97% or 457/762 were obviously from a financial perspective. To be clear, the remaining 40.03% were not necessarily not from a financial perspective, they were simply ambiguous and thus not coded as such.
This research illustrates with high statistical significance how a single distinction (the identities: fish or financial) provides a perspective (point) that completely alters the DSRP configuration of the view. It shows that perspective (point-view) is a powerful (in terms of its effect) cognitive skill and tool. This research shows this at both the individual and collective cognitive levels.
In addition, generalized linear mixed modeling (mixed ordinal logistic regression) showed that subjects were 2.29 times more likely to take a conceptual (financial) perspective than an animate (fish) perspective. This unexpected finding counters nearly two decades of anecdotal experience that says that people generally have more difficulty with conceptual perspectives than animate ones (e.g., `perspectives with eyes’ like frog, fish, dog, etc.). It means that more research is needed in this regard. One possible explanation is that familiarity plays a role and therefore that financial was, while conceptual, also familiar. In other words, the many terms ending in the suffix -al (such as the 12 of the 14 systems engineering perspectives: financial, technological, historical, social, health and safety, political, emotional, moral/ethical, security, ecological, cultural, legal, organizational) are familiar to us as points-of-view in our collective perspective taking. the suffix -al performs two functions:
- it transforms nouns into adjectives, “with the meanings relating to, of the kind of, or having the form or character of, such as autumn + -al → autumnal (= relating to the season autumn) or nature + -al → natural (= having the character of nature)”.
- it transforms verbs into nouns, “with the meanings, the act of such as deny + -al → denial (= the act of denying); or refuse + -al → refusal (= the act of refusing)” [129].
In the case of the first, transforming nouns into adjectives, it may be that this subtle grammatical trick is a linguistic form of “perspective-izing” in that it takes an inanimate and conceptual thing and makes it a adjectival form that is relating to, of the kind of, or having the form or character of such that we can see from its point of view. In other words, the suffix -al (and the cognitive trickery that belies these linguistics) transforms something conceptual into something animate. This alone however, is likely not enough, as it is the familiarity that matters as well. These are familiar terms (a financial perspective) different from say: a sausage-al perspective; a calculator-al perspective; or a rug-al perspective. Here we transform these conceptual nouns (without eyes) into adjectives but we lack the familiarity of the transformation. Nevertheless, the fact that subjects had greater ease with financial than fish perspective is unexpected and interesting and requires further research.
This future question aside, the Financial Fish Study shows—with high statistical significance—that point-view Perspective (P) is a transformational cognitive variable. It has illustrates empirically how, “when you change the way you look at things, the things you look at change”. This means that altering the point variable alters the identities and others and distinctions one makes, alters the part-whole groupings one constructs, and alters the action-reaction relationships one draws. It is no wonder then, that in our next studies, we see the transformative effect of Perspective taking as a metacognitive (known or aware) skill.
4.7. The P-Mapping Study Findings
The existence of point-view Perspectives is shown in the previous studies. The effectiveness of point-view Perspectives is shown in the Fishtank, STMI, and P Mapping studies. Point-view Perspectives are able to be utilized as a metacognitive skill with highly statistically significant effect and can be measured in terms of competence and confidence.
Table 18 shows that when faced with a blank canvas and the task of thinking through an issue, thought, problem, or system, nearly half of subjects (48%!) `freeze up’! This finding matches with anecdotal experience. People become overwhelmed by options when given free reign or asked open ended questions. The first thing that the other 52% of people did, was to create an identity—indicative of a Distinction. See Table 18 for more information on what subjects did and did not do. There is much that can be learned from the statistics about metacognition. Table 19 explicates what we can learn from the data while summarizing it. It gives the reader a best practices list of things to continue to do and things we can try to do more of. Doing more and becoming aware of the things on this list is, part and parcel of, systems thinking.
4.8. The P-STMI Study Findings
We see the theoretical universal of point-view Perspectives can also be utilized as a metacognitive skill that can be measured in both competence/skill and confidence in both the Fishtank Study and the R STMI Study7. We should keep in mind the Dunning–Kruger effect that appears in our sample. It demonstrates that we should be careful not to overestimate our competency in the point-view Perspectives skill.
Combined with the P-Mapping Study results, these data show us not only that point-view Perspectives (P) is the highest in terms of the Dunning-Kruger effect (more confidence than competence) but also that P-rule is something we do significantly less of than we need to. This is especially true given the results of the perspectival primes studies. P-rule is not only incredibly important, it is also overestimated, and under utilized.
4.9. The P-Fishtank Study Findings
The P Fishtank Study shows with high statistical significance that a less than 1 min intervention on the fundamental ideas of point-view Perspectives has a positive effect on cognitive complexity. People see quantitatively deeper and qualitatively more. Given the short exposure to treatment (on average, a 28.11 s read), these findings indicate a statistically significant increase in the degree to which people made more detailed perspectives. With a more substantive treatment (such as an online course) the effects may be transformative.
4.10. Limitations
There are several [potential] threats to validity to these studies. Most of these threats could be mitigated with the addition of control groups. As with all research of this type, some aspects could be improved by correlating results with other validated measures (if they exist) to ensure criterion validity. In addition, samples (where specified) were limited to adults in the US. therefore, results and conclusions could be stronger if the sample included minors and/or people from other countries to verify effects across age, language, and culture. Finally, instrument design that relied predominantly on other attributes (if they exist) (e.g., attributes other than visual imagery and language) could reduce threats to validity.
5. Summary of Findings on Existence, Universality, Efficacy, and Parallelism
With high statistical significance, these nine studies (along with the other studies mentioned in the literature review) provide an “ecology” of findings about point-view Perspectives (P-rule). Each study adds a brick to the wall of our understanding of point-view Perspectives and answers important questions about: (1) how and why point-view Perspectives form; (2) the internal and external dynamics of point-view Perspectives; (3) the role point-view Perspectives play in individual and social cognition; (4) the role point-view Perspectives play in metacognition; and (5) the effects of metacognitive awareness of point-view Perspectives on cognitive complexity.
In these nine studies, we see that the point and view elements of the Perspectives pattern are co-implying, interchangeable, and inextricably linked.

In Equation (5), we see that if any content information A which is a point (), , exists (∃), then it implies (⇒) that a view (v) or B, must also exist, (i.e., if a point exists, a view must exist). The same is true in the reverse where implies (⇒) (i.e., if a view exists, a point must exist). Thus, point and view, as structural patterns of cognition are co-implying.
Thus, in Equation (6), we see that the point-view elements of Perspective are universal to all forms of perspective taking and it s derivatives (i.e., empathy, compassion, theory of mind, awareness, metacognition, etc.). Additionally, these universal elements are interchangeable such that any point can also function as view and vice versa:

The combination of the ecology of research explained thus far as well as the number of empirical studies in the literature across disciplines that directly (See Figure 1) establishes point-view Perspectives as a phenomenon in both mind and nature. This means that, whether you are aware of it or not, Perspective is at play. However, we also want to understand the effects of knowing about, being aware of, or being metacognitive where Perspective is concerned.
Here we turn to the efficacy of point-view Perspectives or P-rule. Will awareness of P-rule increase cognitive performance or complexity? The research in P-STMI, P-Mapping, and particularly P-Fishtank—with high statistical significance—shows convincingly that it is effective, even with ’low dose’ interventions lasting less than one minute.
In other research studies based on the same research program and yielding highly statistically significant results, the identity and other variables of Distinctions (D) [119], the part and whole variables of Systems (S) [121], the action and reaction variables of Relationships (R) [120], and the point and view variables of Perspectives (P) (detailed herein), were all shown not only to be mutually dependent but also necessary and sufficient in their universality. Like the studies presented herein for point-view Perspectives (P), a collection of studies was undertaken to test the efficacy and existence of, respectively, the D, S and R rules. These studies show that Perspectives (P) are a factor in the formation of identity-other Distinctions (D), part-whole Systems (S), and action-reaction Relationships (R).
All with high statistical significance, the Only See Blue and Where’s the Plant?, What’s a Bat?, Where’s Waldo?, Financial Fish studies, along with an transdiscplinary review of the literature, illustrate the universal role that point-view Perspectives (P) play in our lives (in both mind and nature). The P-STMI, P-Mapping, and P-Fishtank studies illustrate the effectiveness that metacognitive awareness of P-rule can have. From the results of these four studies of point-view Perspectives structure detailed above, we can conclude several things. In summary, with high statistical significance, Perspectives (P) are:
- Universal to the organization of Information:
- (a)
- in the mind (i.e., thinking, metacognition, encoding, knowledge formation, science, including both individual and social cognition, etc and
- (b)
- in nature (i.e., physical/material, observable systems, matter, scientific findings across the disciplines, etc.).
- (c)
- the basis for massively parallel and transforming co-priming effects in networks in both mind and nature (e.g., changing a perspective (point or view) changes the identity-other Distinctions, action-reaction Relationships, and part-whole Systems).
- Made up of elements (point, view) that are:
- (a)
- co-implying (i.e., if one exists, the other exists; called the co-implication rule);
- (b)
- related by a special8 relationship: observes/observed; and
- (c)
- act simultaneously as, and are therefore interchangeable with, the elements of Distinctions (identity, other), Systems (part, whole) and Relationships (action, reaction). This is called the simultaneity rule.
- Mutually-dependent on identity-other Distinctions (D), part-whole Systems (S), point-view Perspectives (P) (such that D, S, R, and P are both necessary and sufficient).
- Taken metacognitively:
- (a)
- constitute the basis for making structural predictions about information (based on co-implication and simultaneity rules) of observable phenomena and are therefore a source of creativity, discovery, innovation, invention, and knowledge discovery; and
- (b)
- effective in navigating cognitive complexity to align with material systems complexity.
Keeping the findings in mind, let us return to the table of research questions (Table 3). In conclusion, these data suggest the empirical and observable existence, efficacy, parallelism (between cognitive and ontological complexity), and universality of point-view Perspectives (P), and with high statistical significance, point to the conclusions and summaries in Table 23.
Table 23.
Summary Table of Conclusions.
Author Contributions
D.C., L.C. and E.C. contributed equally in methodology, software, validation, formal analysis, investigation, resources, data curation, writing—original draft preparation, writing—review and editing, visualization, supervision, project administration, funding acquisition. Development of DSRP Theory, D.C. All authors have read and agreed to the published version of the manuscript.
Funding
This research received no external funding.
Institutional Review Board Statement
Ethical review and approval were waived for this study, due to no collection of personal or identifying data.
Informed Consent Statement
Informed consent was obtained from all subjects involved in the study.
Data Availability Statement
The data presented in this study are available on request from the corresponding author. The data are not publicly available due to privacy, human subjects, and ethical considerations.
Conflicts of Interest
The authors declare no conflict of interest.
Abbreviations
The following abbreviations are used in this manuscript:
| DSRP | DSRP Theory (Distinctions, Systems, Relationships, Perspectives) |
| D | identity-other Distinctions |
| S | part-whole Systems |
| R | action-reaction Relationships |
| P | point-view Perspectives |
| STMI | Systems Thinking and Metacognition Inventory |
| IQR | Interquartile range |
| GLMM | Generalized linear mixed modelling |
| RDS | Relate-Distinguish-Systematize Jig |
Notes
| 1 | Cabrera [122] writes, It should be notes that “the ST/DSRP Loop is the mirror opposite of confirmation bias. Confirmation bias reverses this loop, by fitting reality to one’s mental models, whereas DSRP-Systems Thinking fits mental models to real-world observables and feedback. Parallelism is therefore the degree to which one’s cognitive paradigm, style, or mindset, aligns with nature’s. One purpose of this research program, is to determine the degree to which DSRP Theory accomplishes this parallelism”. |
| 2 | STMI is the acronym for the Systems Thinking and Metacognition Inventory. |
| 3 | Analysis was performed using Chi-square test for goodness of fit. : Chi-square statistic. |
| 4 | Results showed that no statistically significant association was observed (p > 0.05 for all comparisons) between any of the sociodemographic factors and answer choice, other than place of residence (Urban, Suburban, Rural; P = 0.04). Analysis was performed using Chi-square test of independence. Respondents who reported seven were more likely to be from urban areas (56%) than respondents who reported four (32.1%). None of the remaining sociodemographic characteristics were significantly associated with the reported result. |
| 5 | as coded-correct. |
| 6 | Full disclosure, Plectica Systems Mapping Software was invented by Dr. Derek Cabrera and used for years as a pilot software for research purposes (it was originally called MetaMap). Cabrera later co-founded Plectica and developed the software further as a consumer application. Plectica was then sold to Frameable and Cabrera is no longer actively involved in the company. |
| 7 | Both the Fishtank [122] and the STMI Study focused on more than just the existence of point-view Perspectives. See [118]. |
| 8 | “Special” here refers to the specific relationship. In contrast to general or universal relationships. |
References
- Churchman, C.W. The Systems Approach; Dell: New York, NY, USA, 1968. [Google Scholar]
- Churchman, C.W. The Systems Approach and Its Enemies; Basic Books: New York, NY, USA, 1979. [Google Scholar]
- Davis, M.H.; Conklin, L.; Smith, A.; Luce, C. Effect of perspective taking on the cognitive representation of persons: A merging of self and other. J. Pers. Soc. Psychol. 1996, 70, 713–726. [Google Scholar] [CrossRef] [PubMed]
- Duncker, K. Uber induzierte bewegung (Condensed translation published as Induced Motion). In A Sourcebook of Gestalt Psychology; Trubner and Company: London, UK, 1938; Volume 12, pp. 161–172. [Google Scholar]
- Marvin, R.S.; Greenberg, M.T.; Mossler, D.G. The Early Development of Conceptual Perspective Taking: Distinguishing among Multiple Perspectives. Child Dev. 1976, 47, 511–514. [Google Scholar] [CrossRef]
- Parker, S.K.; Axtell, C.M. Seeing another viewpoint: Antecedents and outcomes of employee perspective taking. Acad. Manag. J. 2001, 44, 1085–1100. [Google Scholar]
- Piaget, J.; Miles, D.; Miles, M. Understanding Causality; The Norton Library: New York, NY, USA, 1974. [Google Scholar]
- Premack, D.; Woodruff, G. Does the chimpanzee have a theory of mind? Behav. Brain Sci. 1978, 4, 515–526. [Google Scholar] [CrossRef]
- Schober, M.F. Spatial perspective-taking in conversation. Cognition 1993, 47, 1–24. [Google Scholar] [CrossRef]
- Whitehead, A.N. Adventures of Ideas; Free Press: New York, NY, USA, 1967. [Google Scholar]
- Batson, C.D.; Early, S.; Salvarani, G. Perspective Taking: Imagining how another would feel versus imagining how you would feel. Personal. Soc. Psychol. Bull. 1997, 23, 751–758. [Google Scholar] [CrossRef]
- Neale, M.A.; Bazerman, M.H. The Role of Perspective-Taking Ability in Negotiating under Different Forms of Arbitration. ILR Rev. 1983, 36, 378–388. [Google Scholar] [CrossRef]
- Galinsky, A.D.; Moskowitz, G.B. Perspective-taking: Decreasing stereotype expression, stereotype accessibility, and in-group favoritism. J. Pers. Soc. Psychol. 2000, 78, 708–724. [Google Scholar] [CrossRef]
- Davis, M.H.; Soderlund, T.; Cole, J.; Gadol, E.; Kute, M.; Myers, M.; Weihing, J. Cognitions associated with attempts to empathize: How do we imagine the perspective of another? Pers. Soc. Psychol. Bull. 2004, 30, 1625–1635. [Google Scholar] [CrossRef]
- Perdue, C.W.; Dovidio, J.F.; Gurtman, M.B.; Tyler, R.B. Us and them: Social categorization and the process of intergroup bias. J. Pers. Soc. Psychol. 1990, 59, 475–486. [Google Scholar] [CrossRef]
- Galinsky, A.D.; Ku, G. The effects of perspective-taking on prejudice: The moderating role of self-evaluation. Pers. Soc. Psychol. Bull. 2004, 30, 594–604. [Google Scholar] [CrossRef] [PubMed]
- Onder, O.M.; Oner-Ozkan, B. Visual perspective in causal attribution, empathy and attitude change. Psychol. Rep. 2003, 93, 1035–1046. [Google Scholar] [CrossRef]
- Robins, R.W.; John, O.P. Effects of visual perspective and narcissism on self-perception. Psychol. Sci. 1997, 8, 37–42. [Google Scholar] [CrossRef]
- Vallar, G.; Lobel, E.; Galati, G.; Berthoz, A.; Pizzamiglio, L.; Le Bihan, D. A fronto-parietal system for computing the egocentric spatial frame of reference in humans. Exp. Brain Res. 1999, 124, 281–286. [Google Scholar] [CrossRef] [PubMed]
- Schmit, M.J.; Ryan, A.M.; Stierwalt, S.L.; Powell, A.B. Frame-Of-Reference Effects On Personality Scale Scores And Criterion-Related Validity. J. Appl. Psychol. 1995, 80, 607–620. [Google Scholar] [CrossRef]
- Mainwaring, L. Environmental values and the frame of reference. Ecol. Econ. 2001, 38, 391–402. [Google Scholar] [CrossRef]
- Fry, S.N.; Wehner, R. Honey bees store landmarks in an egocentric frame of reference. J. Comp. Physiol.-Neuroethol. Sens. Neural Behav. Physiol. 2002, 187, 1009–1016. [Google Scholar] [CrossRef]
- Oswald, P.A. Does the interpersonal reactivity index perspective-taking scale predict who will volunteer time to counsel adults entering college? Percept. Mot. Skills 2003, 97, 1184–1186. [Google Scholar] [CrossRef]
- Wang, Y.W.; Davidson, M.M.; Yakushko, O.F.; Savoy, H.B.; Tan, J.A.; Bleier, J.K. The scale of ethnocultural empathy: Development, validation, and reliability. J. Couns. Psychol. 2003, 50, 221. [Google Scholar] [CrossRef]
- Chen, D.Z.; Daescu, O. Maintaining visibility of a polygon with a moving point of view. Inf. Process. Lett. 1998, 65, 269–275. [Google Scholar] [CrossRef]
- Fleming, D.B. Recognizing Point of View: A Critical Reading Skill in the Social Studies. Soc. Educ. 1980, 44, 153–156. [Google Scholar]
- Smith-Welch, M.; Resnick, M. Playing with Perspectives: Using Digital Video with Teenagers to Explore Percepts, Concepts, and the Other’s Point of View. Ph.D. Thesis, Massachusetts Institute of Technology, Cambridge, MA, USA, 2004. [Google Scholar]
- Mikula, G.; Athenstaedt, U.; Heschgl, S.; Heimgartner, A. Does it only depend on the point of view? Perspective-related differences in justice evaluations of negative incidents in personal relationships. Eur. J. Soc. Psychol. 1998, 28, 931–962. [Google Scholar] [CrossRef]
- Selman, R.L. Level Of Social-Perspective Taking And Development Of Empathy In Children-Speculations From A Social-Cognitive Viewpoint. J. Moral Educ. 1975, 5, 35–43. [Google Scholar] [CrossRef]
- Bhanji, J.P.; Beer, J.S. Taking a different perspective: Mindset influences neural regions that represent value and choice. Soc. Cogn. Affect. Neurosci. 2012, 7, 782–793. [Google Scholar] [CrossRef] [PubMed]
- Wolgast, A.; Oyserman, D. Seeing what other people see: Accessible cultural mindset affects perspective-taking. Cult. Brain 2020, 8, 117–136. [Google Scholar] [CrossRef]
- Mounoud, P. Perspective taking and belief attribution: From Piaget’s theory to children’s theory of mind. Swiss J. Psychol. 1996, 55, 93–103. [Google Scholar]
- DeRidder, D.; Depla, M.; Severens, P.; Malsch, M. Beliefs on coping with illness: A consumer’s perspective. Soc. Sci. Med. 1997, 44, 553–559. [Google Scholar] [CrossRef]
- Berndsen, M.; McGarty, C. Perspective taking and opinions about forms of reparation for victims of historical harm. Pers. Soc. Psychol. Bull. 2012, 38, 1316–1328. [Google Scholar] [CrossRef]
- Bartolomeo, P.; Chokron, S. Egocentric frame of reference: Its role in spatial bias after right hemisphere lesions. Neuropsychologia 1999, 37, 881–894. [Google Scholar] [CrossRef]
- Fincham, F.D.; Bradbury, T.N. Perceived Responsibility for Marital Events: Egocentric or Partner-Centric Bias? J. Marriage Fam. 1989, 51, 27–35. [Google Scholar] [CrossRef]
- Nussbaum, M. Compassion: The basic social emotion. Soc. Philos. Policy 1996, 13, 27–58. [Google Scholar] [CrossRef]
- Pence, G.E. Can Compassion Be Taught? J. Med. Ethics 1983, 9, 189–191. [Google Scholar] [CrossRef] [PubMed]
- Lerner, M.J.; Simmons, C.H. Observers Reaction To Innocent Victim—Compassion Or Rejection. J. Pers. Soc. Psychol. 1966, 4, 203–210. [Google Scholar] [CrossRef] [PubMed]
- Paul, Y. Compassion for the animals, no concern for the children. Vaccine 2004, 23, 280. [Google Scholar] [CrossRef]
- Ben-Ami Bartal, I.; Decety, J.; Mason, P. Helping a cagemate in need: Empathy and pro-social behavior in rats. Science 2011, 334, 1427–1430. [Google Scholar] [CrossRef]
- Ross, E.W. Historical empathy and perspective taking in the social studies. Choice 2002, 39, 1854. [Google Scholar]
- Moffatt, C.W.; Hanleymaxwell, C.; Donnellan, A.M. Discrimination Of emotion, affective perspective-taking and empathy in individuals with Mental-Retardation. Educ. Train. Ment. Retard. Dev. Disabil. 1995, 30, 76–85. [Google Scholar]
- Cabrera, D.; Cabrera, L.; Powers, E. A Unifying Theory of Systems Thinking with Psychosocial Applications. Syst. Res. 2015, 32, 534–545. [Google Scholar] [CrossRef]
- Brookfield, S.D. Assessing critical thinking. New Dir. Adult Contin. Educ. 1997, 1997, 17–29. [Google Scholar] [CrossRef]
- Gorenflo, D.W.; Crano, W.D. The multiple perspectives inventory: A measure of perspective-taking. Swiss J. Psychol. 1998, 57, 163–177. [Google Scholar]
- Marsh, D.T.; Serafica, F.C.; Barenboim, C. Effect of Perspective-Taking Training on Interpersonal Problem Solving. Child Dev. 1980, 51, 140–145. [Google Scholar] [CrossRef]
- Cabrera, D. Systems Thinking; Cornell University: Ithaca, NY, USA, 2006. [Google Scholar]
- Cabrera, D.; Cabrera, L. Systems Thinking Made Simple: New Hope for Solving Wicked Problems in a Complex World; Odyssean Press: Ithaca, NY, USA, 2015. [Google Scholar]
- Cabrera, D. Remedial Genius: Think and Learn Like a Genius with the Five Principles of Knowledge; Project N Press: Loveland, CO, USA, 2000. [Google Scholar]
- Cabrera, D.; Cabrera, L.; Lobdell, C. Systems Thinking. J. Eval. Program Plan. 2008, 31, 299–310. [Google Scholar] [CrossRef] [PubMed]
- Cabrera, D. Patterns of Knowledge: Knowledge as a Complex Adaptive System (CAS); Regis University: Denver, CO, USA, 2002. [Google Scholar]
- Cabrera, D.; Cabrera, L.; Cabrera, E. A Literature Review of the Universal Patterns and Atomic Elements of Complex Cognition. In Routledge Handbook of Systems Thinking; Cabrera, D., Cabrera, L., Midgley, G., Eds.; Routledge: London, UK, 2022. [Google Scholar]
- Cabrera, D.; Cabrera, L. DSRP Theory: A Primer. Systems 2022, 10, 26. [Google Scholar] [CrossRef]
- Endler, J.A. Bowerbirds, art and aesthetics: Are bowerbirds artists and do they have an aesthetic sense? Commun. Integr. Biol. 2012, 5, 281–283. [Google Scholar] [CrossRef]
- Bugnyar, T.; Reber, S.A.; Buckner, C. Ravens attribute visual access to unseen competitors. Nat. Commun. 2016, 7, 10506. [Google Scholar] [CrossRef]
- Chamovitz, D. What a Plant Knows: A Field Guide to the Senses; Scientific American/Farrar, Straus and Giroux: New York, NY, USA, 2012. [Google Scholar]
- Montesinos-Navarro, A.; Storer, I.; Perez-Barrales, R. Benefits for nurse and facilitated plants emerge when interactions are considered along the entire life-span. Perspect. Plant Ecol. Evol. Syst. 2019, 41, 125483. [Google Scholar] [CrossRef]
- Baron-Cohen, S.; Leslie, A.M.; Frith, U. Does the autistic child have a “theory of mind”? Cognition 1985, 21, 37–46. [Google Scholar] [CrossRef]
- Dyson, F. Disturbing the Universe; Basic Books: New York, NY, USA, 1979. [Google Scholar]
- Zwick, A.; Álvarez, G.A.; Kurizki, G. Maximizing Information on the Environment by Dynamically Controlled Qubit Probes. Phys. Rev. Appl. 2016, 5, 014007. [Google Scholar] [CrossRef]
- Álvarez, G.A. Personal Correspondence, Email To Cabrera: “RE: Question about your article on Qubit Probes”. 2021. Available online: https://tinyurl.com/4876tv64 (accessed on 1 December 2021).
- Ruby, P.; Decety, J. How would you feel versus how do you think she would feel? A neuroimaging study of perspective-taking with social emotions. J. Cogn. Neurosci. 2004, 16, 988–999. [Google Scholar] [CrossRef]
- Russell, J.; Alexis, D.; Clayton, N. Episodic future thinking in 3- to 5-year-old children: The ability to think of what will be needed from a different point of view. Cognition 2010, 114, 56–71. [Google Scholar] [CrossRef]
- Rakoczy, H.; Wandt, R.; Thomas, S.; Nowak, J.; Kunzmann, U. Theory of mind and wisdom: The development of different forms of perspective-taking in late adulthood. Br. J. Psychol. 2018, 109, 6–24. [Google Scholar] [CrossRef] [PubMed]
- Mafessoni, F.; Lachmann, M. The complexity of understanding others as the evolutionary origin of empathy and emotional contagion. Sci. Rep. 2019, 9, 5794. [Google Scholar] [CrossRef] [PubMed]
- Tversky, A.; Kahneman, D. The Framing of Decisions and the Psychology of Choice. In Behavioral Decision Making; Springer: Boston, MA, USA, 1981. [Google Scholar]
- Knowles, M.L. Social rejection increases perspective taking. J. Exp. Soc. Psychol. 2014, 55, 126–132. [Google Scholar] [CrossRef]
- Cavallo, A.; Ansuini, C.; Capozzi, F.; Tversky, B.; Becchio, C. When Far Becomes Near. Psychol. Sci. 2017, 28, 69–79. [Google Scholar] [CrossRef]
- Takaku, S.; Weiner, B.; Ohbuchi, K.I. A cross-cultural examination of the effects of apology and perspective taking on forgiveness. J. Lang. Soc. Psychol. 2001, 20, 144–166. [Google Scholar] [CrossRef]
- Epley, N.; Keysar, B.; Van Boven, L.; Gilovich, T. Perspective taking as egocentric anchoring and adjustment. J. Pers. Soc. Psychol. 2004, 87, 327–339. [Google Scholar] [CrossRef]
- Harwood, M.D.; Farrar, M.J. Conflicting emotions: The connection between affective perspective taking and theory of mind. Br. J. Dev. Psychol. 2006, 24, 401–418. [Google Scholar] [CrossRef]
- Tversky, B.; Hard, B.M. Embodied and disembodied cognition: Spatial perspective-taking. Cognition 2009, 110, 124–129. [Google Scholar] [CrossRef]
- Wang, C.S.; Tai, K.; Ku, G.; Galinsky, A.D.; Urgesi, C. Perspective-Taking Increases Willingness to Engage in Intergroup Contact. PLoS ONE 2014, 9, e85681. [Google Scholar] [CrossRef]
- Ben-Ami Bartal, I.; Decety, J.; Mason, P. Empathy and pro-social behavior in rats. Science 2011, 334, 1427–1430. [Google Scholar] [CrossRef]
- Satoh, S.; Bshary, R.; Shibasaki, M.; Inaba, S.; Sogawa, S.; Hotta, T.; Awata, S.; Kohda, M. Prosocial and antisocial choices in a monogamous cichlid with biparental care. Nat. Commun. 2021, 12, 1775. [Google Scholar] [CrossRef] [PubMed]
- Gagliano, M.; Renton, M.; Depczynski, M.; Mancuso, S. Experience teaches plants to learn faster and forget slower in environments where it matters. Oecologia 2014, 175, 63–72. [Google Scholar] [CrossRef] [PubMed]
- Gagliano, M. Inside the Vegetal Mind: On the Cognitive Abilities of Plants. In Memory and Learning in Plants; Baluska, F., Gagliano, M., Witzany, G., Eds.; Springer International Publishing: Cham, Switzerland, 2018; pp. 215–220. [Google Scholar]
- Bateson, G. Form Substance and Difference. In Essential Readings in Biosemiotics; Random House: New York, NY, USA, 1970. [Google Scholar]
- Von Bertalanffy, L. The history and status of general systems theory. Acad. Manag. J. 1972, 15, 407–426. [Google Scholar]
- Rittel, H.W.J.; Webber, M.M. Dilemmas in a general theory of planning. Policy Sci. 1973, 4, 155–169. [Google Scholar] [CrossRef]
- Marchal, J.H. On the Concept of a System. Philos. Sci. 1975, 42, 448–468. [Google Scholar] [CrossRef]
- Goguen, J.A.; Varela, F.J. Systems And Distinctions: Duality And Complementarity. Int. J. Gen. Syst. 1979, 5, 31–43. [Google Scholar] [CrossRef]
- Ivan, M.; Kondo, K.; Yang, H.; Kim, W.; Valiando, J.; Ohh, M.; Salic, A.; Asara, J.M.; Lane, W.S.; Kaelin, W.G., Jr. HIFa Targeted for VHL-Mediated Destruction by Proline Hydroxylation: Implications for O Sensing. Science 2001, 292, 464–468. [Google Scholar] [CrossRef]
- Chen, P.; Fan, D.; Zhang, Y.; Selloni, A.; Carter, E.A.; Arnold, C.B.; Dankworth, D.C.; Rucker, S.P.; Chelikowsky, J.R.; Yao, N. Breaking a dative bond with mechanical forces. Nat. Commun. 2021, 12, 5635. [Google Scholar] [CrossRef]
- Wadhams, G.H.; Armitage, J.P. Making sense of it all: Bacterial chemotaxis. Nat. Rev. Mol. Cell Biol. 2004, 5, 1024–1037. [Google Scholar] [CrossRef]
- Janetopoulos, C.; Firtel, R.A. Directional sensing during chemotaxis. FEBS Lett. 2008, 582, 2075–2085. [Google Scholar] [CrossRef]
- Ikeya, N.; Woodward, J.R. Cellular autofluorescence is magnetic field sensitive. Proc. Natl. Acad. Sci. USA 2021, 118, e2018043118. [Google Scholar] [CrossRef] [PubMed]
- Förster, D.; Helmbrecht, T.O.; Mearns, D.S.; Jordan, L.; Mokayes, N.; Baier, H. Retinotectal circuitry of larval zebrafish is adapted to detection and pursuit of prey. eLife 2020, 9, e58596. [Google Scholar] [CrossRef] [PubMed]
- De Corte, B.J.; Navarro, V.M.; Wasserman, E.A. Non-cortical magnitude coding of space and time by pigeons. Curr. Biol. 2017, 27, R1264–R1265. [Google Scholar] [CrossRef] [PubMed]
- Schnell, A.K.; Loconsole, M.; Garcia-Pelegrin, E.; Wilkins, C.; Clayton, N.S. Jays are sensitive to cognitive illusions. R. Soc. Open Sci. 2021, 8, 202358. [Google Scholar] [CrossRef]
- Giannoni-Guzmán, M.A.; Rivera, E.; Aleman-Rios, J.; Melendez Moreno, A.M.; Ramos, M.P.; Pérez-Claudio, E.; Loubriel, D.; Moore, D.; Giray, T.; Agosto-Rivera, J.L. The Role of Colony Temperature in the Entrainment of Circadian Rhythms of Honey Bee Foragers. Ann. Entomol. Soc. Am. 2021, 114, 596–605. [Google Scholar] [CrossRef]
- Mareschal, D.; Quinn, P.C. Categorization in infancy. Trends Cogn. Sci. 2001, 5, 443–450. [Google Scholar] [CrossRef]
- Ashby, F.G.; Ell, S.W.; Waldron, E.M. Procedural learning in perceptual categorization. Mem. Cogn. 2003, 31, 1114–1125. [Google Scholar] [CrossRef]
- Sloutsky, V.M. The role of similarity in the development of categorization. Trends Cogn. Sci. 2003, 7, 246–251. [Google Scholar] [CrossRef]
- Lewis, M.; Balamurugan, A.; Zheng, B.; Lupyan, G. Characterizing Variability in Shared Meaning through Millions of Sketches. In Proceedings of the Annual Meeting of the Cognitive Science Society; University of California Press: Berkeley, CA, USA, 2021. [Google Scholar]
- Lewandowsky, S.; Roberts, L.; Yang, L.X. Knowledge partitioning in categorization: Boundary conditions. Mem. Cogn. 2006, 34, 1676–1688. [Google Scholar] [CrossRef] [PubMed][Green Version]
- Sperry, R.W. Cerebral Organization and Behavior: The split brain behaves in many respects like two separate brains, providing new research possibilities. Science 1961, 133, 1749–1757. [Google Scholar] [CrossRef]
- Lupyan, G. The conceptual grouping effect: Categories matter (and named categories matter more). Cognition 2008, 108, 566–577. [Google Scholar] [CrossRef] [PubMed]
- Van Dijk, J.; Kerkhofs, R.; van Rooij, I.; Haselager, P. Special Section: Can There Be Such a Thing as Embodied Embedded Cognitive Neuroscience? Theory Psychol. 2008, 18, 297–316. [Google Scholar] [CrossRef]
- Mahon, B.Z.; Caramazza, A. Concepts and categories: A cognitive neuropsychological perspective. Annu. Rev. Psychol. 2009, 60, 27–51. [Google Scholar] [CrossRef]
- Cira, N.J.; Benusiglio, A.; Prakash, M. Vapour-mediated sensing and motility in two-component droplets. Nature 2015, 519, 446–450. [Google Scholar] [CrossRef] [PubMed]
- Tweedy, L.; Thomason, P.A.; Paschke, P.I.; Martin, K.; Machesky, L.M.; Zagnoni, M.; Insall, R.H. Seeing around corners: Cells solve mazes and respond at a distance using attractant breakdown. Science 2020, 369, eaay9792. [Google Scholar] [CrossRef] [PubMed]
- Blackiston, D.; Lederer, E.; Kriegman, S.; Garnier, S.; Bongard, J.; Levin, M. A cellular platform for the development of synthetic living machines. Sci. Robot. 2021, 6, eabf1571. [Google Scholar] [CrossRef]
- Tarrant, M.; Calitri, R.; Weston, D. Social identification structures the effects of perspective taking. Psychol. Sci. 2012, 23, 973–978. [Google Scholar] [CrossRef]
- Takaoka, A.; Maeda, T.; Hori, Y.; Fujita, K. Do dogs follow behavioral cues from an unreliable human? Anim. Cogn. 2015, 18, 475–483. [Google Scholar] [CrossRef]
- Havy, M.; Waxman, S.R. Naming influences 9-month-olds’ identification of discrete categories along a perceptual continuum. Cognition 2016, 156, 41–51. [Google Scholar] [CrossRef]
- Mischel, W.; Ebbesen, E.B. Attention in delay of gratification. J. Pers. Soc. Psychol. 1970, 16, 329–337. [Google Scholar] [CrossRef]
- Schnell, A.K.; Boeckle, M.; Rivera, M.; Clayton, N.S.; Hanlon, R.T. Cuttlefish exert self-control in a delay of gratification task. Proc. Biol. Sci. 2021, 288, 20203161. [Google Scholar] [CrossRef] [PubMed]
- Boisseau, R.P.; Vogel, D.; Dussutour, A. Habituation in non-neural organisms: Evidence from slime moulds. Proc. Biol. Sci. 2016, 283, 20160446. [Google Scholar] [CrossRef] [PubMed]
- Cabrera, D.; Cabrera, L. Complexity and Systems Thinking Models in Education: Applications for Leaders. In Learning, Design, and Technology: An International Compendium of Theory, Research, Practice, and Policy; Spector, M.J., Lockee, B.B., Childress, M.D., Eds.; Springer International Publishing: Cham, Switzerland, 2019; pp. 1–29. [Google Scholar]
- Cabrera, D.; Cabrera, L. What Is Systems Thinking. In Learning, Design, and Technology: An International Compendium of Theory, Research, Practice, and Policy; Spector, M.J., Lockee, B.B., Childress, M.D., Eds.; Springer International Publishing: Cham, Switzerland, 2019; pp. 1–28. [Google Scholar]
- Cabrera, L.; Cabrera, D. The Simple Rules of Complex Networks: Heuristics for Structural Predictions. In The Routledge Handbook for Systems Thinking; Cabrera, L., Cabrera, D., Midgley, G., Eds.; Routledge Press: London, UK, 2021. [Google Scholar]
- Cabrera, D.; Cabrera, L. Distinctions, Systems, Relationships, and Perspectives (DSRP): A Theory of Thinking and of Things. J. Eval. Program Plan. 2008, 31, 311–317. [Google Scholar] [CrossRef] [PubMed]
- Cabrera, D.; Cabrera, L.; Midgley, G. The Four Waves of Systems Thinking. In The Routledge Handbook for Systems Thinking; Cabrera, D., Cabrera, L., Midgley, G., Eds.; Routledge Press: London, UK, 2021. [Google Scholar]
- Cabrera, D.; Cabrera, L.; Cabrera, E.; Hernandez, O.; Sukhbaatar, U.; Fuqua Kand Benitez Collante, A.E.; Lemaiyan, E.; Warugongo, N.; Sekyere, A.; Silas, D.; et al. The Origin of Ideas: Empirical Studies in Cognitive Complexity; Odyssean Press: Ithaca, NY, USA, 2021. [Google Scholar]
- Cabrera, D.; Cabrera, L.; Midgley, G. (Eds.) Routledge Handbook of Systems Thinking; Routledge: London, UK, 2021. [Google Scholar]
- Cabrera, L.; Sokolow, J.; Cabrera, D. Developing and Validating a Measurement of Systems Thinking: The Systems Thinking and Metacognitive Inventory (STMI). In The Routledge Handbook for Systems Thinking; Cabrera, L., Cabrera, D., Midgley, G., Eds.; Routledge Press: London, UK, 2022. [Google Scholar]
- Cabrera, D.; Cabrera, L.; Cabrera, E. Distinctions Organize Information in Mind and Nature: Empirical Findings of Identity-Other Distinctions (D) in Cognitive and Material Complexity. Systems 2022, 10, 41. [Google Scholar] [CrossRef]
- Cabrera, D.; Cabrera, L.; Cabrera, E. Relationships Organize Information in Mind and Nature: Empirical Findings of Action-Reaction Relationships (R) in Cognitive and Material Complexity. Systems 2022, in press. [Google Scholar]
- Cabrera, D.; Cabrera, L.; Cabrera, E. Systems Organize Information in Mind and Nature: Empirical Findings of Part-Whole Systems (S) in Cognitive and Material Complexity. Systems 2022, 10, 44. [Google Scholar] [CrossRef]
- Cabrera, D.; Cabrera, L.; Cabrera, E. The `Fish Tank’ Experiments: Metacognitive awareness of DSRP significantly increases cognitive complexity. Systems 2022, 10, 29. [Google Scholar] [CrossRef]
- Cabrera, D.; Cabrera, L. Plectica: Visual Mapping Software; Plectica: New York, NY, USA, 2016. [Google Scholar]
- Cabrera, E. Jig: Part Parties. 2020. Available online: https://blog.cabreraresearch.org/jig-part (accessed on 12 November 2021).
- Cabrera, D. Synapses, Hinges, Embassies, and Supply Chains: The Power Of RDS Structural Predictions. Syst. Think. Dly. 2020, 20, 4. [Google Scholar]
- Kruger, J.; Dunning, D. Unskilled and unaware of it: How difficulties in recognizing one’s own incompetence lead to inflated self-assessments. J. Pers. Soc. Psychol. 1999, 77, 1121–1134. [Google Scholar] [CrossRef]
- Lewis, M.L.; Frank, M.C. The length of words reflects their conceptual complexity. Cognition 2016, 153, 182–195. [Google Scholar] [CrossRef]
- Lakoff, G. Metaphors We Live By; University of Chicago Press: Chicago, IL, USA, 1980. [Google Scholar]
- -al—WordReference.com Dictionary of English. Available online: https://www.wordreference.com/definition/-al (accessed on 12 November 2021).


Publisher’s Note: MDPI stays neutral with regard to jurisdictional claims in published maps and institutional affiliations. |
© 2022 by the authors. Licensee MDPI, Basel, Switzerland. This article is an open access article distributed under the terms and conditions of the Creative Commons Attribution (CC BY) license (https://creativecommons.org/licenses/by/4.0/).