Abstract
The transdisciplinary importance of distinctions is well-established as foundational to such diverse phenomena as recognition, identification, individual and social identity, marginalization, externalities, boundaries, concept formation, etc., and synonymous general ideas, such as thingness, concepts, nodes, objects, etc. Cabrera provides a formal description of and predictions for identity–other distinctions (D) or “D-rule” as one of four universals for the organization of information that is foundational to systems and systems thinking, as well as the consilience of knowledge. This paper presents seven empirical studies in which (unless otherwise noted) software was used to create an experiment for subjects to complete a task and/or answer a question. The samples varied for each study (ranging from N = 407 to N = 34,398) and were generalizable to a normal distribution of the US population. These studies support—with high statistical significance—the predictions made by DSRP theory regarding identity–other distinctions including its: universality as an observable phenomenon in both mind (cognitive complexity) and nature (ontological complexity) (i.e., parallelism); internal structures and dynamics; mutual dependencies on other universals (i.e., relationships, systems, and perspectives); role in structural predictions; and efficacy as a metacognitive skill. In conclusion, these data suggest the observable and empirical existence, universality, efficacy, and parallelism (between cognitive and ontological complexity) of identity–other distinctions (D).
1. Introduction
Making distinctions between and among ideas or objects is an activity that crosses all disciplines. The concept of distinctions goes by many names including related terms and synonyms, such as: distinguish, differentiate, name, label, is, is not, identity, recognize, identify, exist, existential, other, boundary, select, equals, does not equal, similar, different, same, opposite, us/them, thing, unit, not-thing, something, nothing, element, and the prefix a- (as in a-gnostic or a-political). Any time we do any of the things we are making a distinction. That is, we are bringing something into existence conceptually or recognizing something exists materially and we always do so by relating identity and other. In this sense a distinction is not a “thing” its a boundary between what something is (identity) and what it is not (other).
1.1. Empirical Findings of Distinctions across the Disciplines
The ecology of four studies documented in this paper exist in the context of the much wider literature of empirical studies and literature reviews on distinctions. An abundance of literature and empirical findings exists—across the disciplinary spectrum (i.e., the physical, natural, social, and applied sciences)—for distinctions (D). Distinction making and boundary judgments are well established, both in the cognitive sciences and the field of systems thinking [1,2,3,4,5,6,7,8,9,10,11,12,13,14,15,16,17,18,19,20,21,22,23,24,25,26,27,28,29,30,31,32,33,34,35]. The literature on distinctions making (in the cognitive sciences as well as the physical and natural sciences) supports the idea that they are universally existent [2,3,4,5,7,8,9].
In a review of the literature, empirical studies illustrate both the universality of identity–other distinctions across the disciplines [1,2,3,4,5,6,7,8,9,11,12,13,14,15,16,17,18,19,20,22,23,24,25,26,27,28,29,30,31,32,33,34,35,36,37,38,39] and that distinctions are integrated with other universals (systems, relationships, perspectives) [21,40,41,42,43,44,45,46,47,48,49,50,51,52,53,54,55,56,57,58,59,60,61,62,63,64,65,66,67,68,69,70,71,72]. Figure 1 shows the disciplinary distribution of this research.
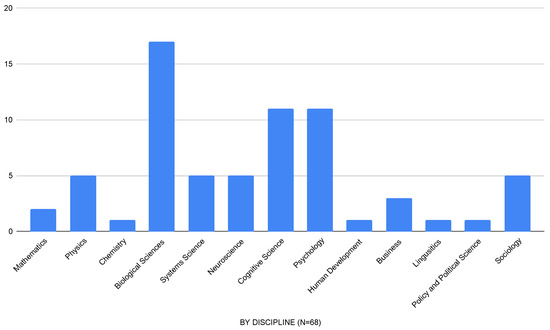
Figure 1.
Identity–Other distinctions (D) Research Across the Disciplines.
Cabrera’s 2021 review of research builds upon previous literature reviews [73,74], constitutes a proverbial “tip of the iceberg”, and is part of an accumulating body of evidence in support of the predictions made by DSRP theory generally, and identity–other distinctions in particular. The findings, utility, and application of identity–other distinctions (D) are pervasive and ubiquitous. A few highlights from this literature review include:
- Kolata (1984) [4] shows that infants can distinguish their mother’s voices as soon as they are born, indicating that fetuses make distinctions in utero;
- Aubin and Jouventin’s (1998) [9] research the cocktail party effect in King Penguin colonies, showing that chicks only distinguish and react to their parent’s calls and vice versa;
- Quinn et al.’s 1997 study [6] shows that, from an early age, the human brain distinguishes between different patterns and shapes, even if the two shapes overlap;
- Gautheir and Tarr’s 1997 study [8], using computer-generated ‘Greebles’, demonstrated that the more exposure one has to fine-tuned and novel distinctions, the better they will be at recognizing them;
- Pradel et al.’s 2007 study [16] shows that nematodes distinguish their environments to avoid dangerous pathogens; and
- Langer et al.’s 1985 research [30] shows that the identity–other distinctions one makes can lead to long-term marginalization of the “other” and also that awareness of the identity–other structure of distinctions can dampen our marginalizing tendencies.
1.2. Theoretical Work on Distinctions
The simplest relatively accurate statement of the DSRP theory is shown in Figure 2:
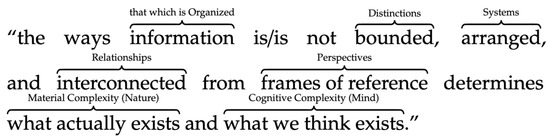
Figure 2.
Simplest Accurate Statement of DSRP Theory [75].
The DSRP theory details quite a bit more than this simplification relays [73,74,76,77,78,79]. In addition, the DSRP theory has more empirical evidence supporting it than any existing systems theory (including frameworks, which are not theories) [73,75,80,81,82,83,84,85,86,87,88]. For more on the DSRP theory, the reader should see the citations mentioned, as this paper focuses solely on the ’D’ in DSRP: distinctions.
As one of four DSRP rules, identity–other distinctions or the D-rule is applicable across the disciplines, from the physical and natural sciences to the social sciences. Their transdisciplinary importance cannot be overstated. For example, distinction-making (D) is defined as the act of differentiating among ideas or things; making a concept, construct, or thing explicit by delineating the “identity” that implicitly establishes an “other” (that are themselves concept(s), construct(s), or thing(s). Distinction-making is evident in the womb and is seen as early as three months of age. Experiments with adults also show the variety of ways that distinctions are made across a lifespan. A review of peer-reviewed journals across disciplines indicates:
- The existence of distinctions (i.e., D as a noun);
- The act of distinction making (i.e., D as a verb); and
- That the relationship (i.e. is/is not) between identity and other is elemental in both (1) and (2) above.
Boundaries Are a Subset of Distinctions
Less clear however, is the underlying structure and dynamics of distinctions or the breadth of its application. In systems thinking literature, for example, boundary judgments (a phenomenon that is a subset of distinction making) were originally described as indicating “what information is considered relevant and what is considered superfluous, and are the result of value judgments” [34,89]. The ‘flavor’ of the concept of boundary judgment is important because it clarifies how it differs from identity–other distinctions. The boundary judgment is for ‘the system’ to determine what lays inside and outside of it, as seen on the left side of Figure 3. Cabrera [21,73,74,90,91,92,93,94,95] expanded the domain (see right side Figure 3) of these boundary judgments by demonstrating that they were not reserved merely for the single boundary of ‘the system,’ but were structural features occurring on fractal dimensions on every element inside (and outside) the system. Thereby predicting that:
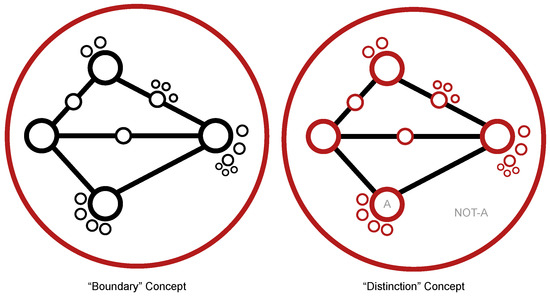
Figure 3.
Boundaries concept vs. identity–other distinctions concept.
- All boundary judgments are subsets of identity–other distinctions;
- All externalities identified by boundary judgements are subsets of other; and
- All distinctions have an identity–other structure.
This critical insight—part of DSRP theory—exposed the universality and fractal-nature of identity–other distinction-making at the theoretical level. This ecology of studies empirically quantifies this theoretical construct.
Figure 3 illustrates the differences (shown in red) between boundaries as they were historically understood and identity–other distinctions as they are understood today. The image of the ‘Boundaries Concept’ on the left in Figure 3 illustrates that there is only one boundary (in red) for the system as a whole.
The image on the right in Figure 3 illustrates (in red) that every node in the network is a distinct boundary. It shows that the identity of A is defined not only by what A is but also by what A is not. Thus, the relationship between A and is defined by is/is-not and A co-implies as seen in Figure 4.
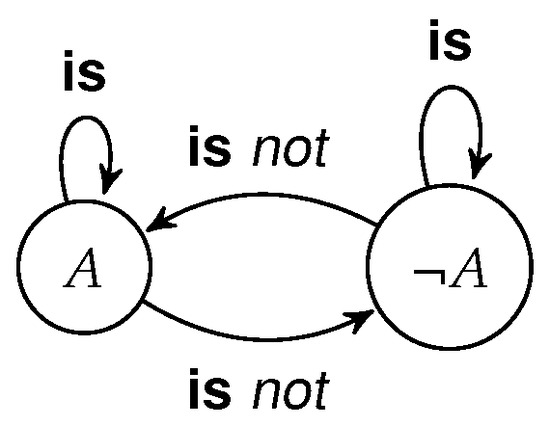
Figure 4.
An identity (i) other (o) distinction (D).
This difference matters, because DSRP theory predicts that an identity–other network of is (existential identity) and is not (existential negation) relationships creates a cognitive ‘dark matter.’ In addition, it means that in any simple or complex system, network, or ecology (of things or ideas) of n nodes, the number of variables increases by by implication. That is, for every node (identity variable), there is an other variable, such that, for example:
This is shown in Figure 5 where the identities CAT, DOG, RABBIT, and GERBIL are distinguished from their others (¬CAT, ¬DOG, ¬RABBIT, and ¬GERBIL) and where it is shown that the others are part–whole sets.
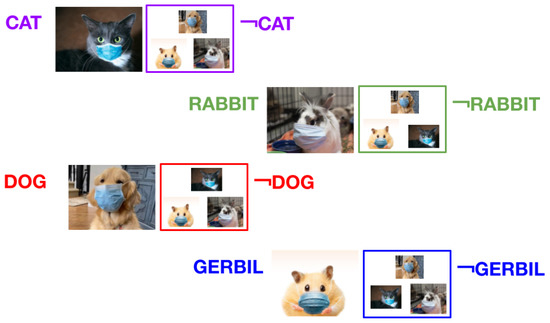
Figure 5.
Four identities and their four other sets.
As shown in Figure 6, the relationship between identity and other is easily illustrated by the Ebbinghaus illusion or “Titchener circles”. It is an optical illusion in which the perceived size of a circle changes relative to the size and proximity of the other circles surrounding it. This means that the identity of the center circle is not only dependent on the characteristics of the central circle itself, but is intimately entwined with the other circles that surround it.

Figure 6.
The two orange dots are the same size, but their ‘context’ makes them look like they are different sizes.
Similar to the circles, text and context have a similar relationship, as the meaning of a word or phrase is dependent on its context (or surrounding text). In other words, text gets its meaning internally from how it is defined (in a dictionary, for example) but also externally from its context (literally together with text). Yet, this context is not an amorphous cloud of meaning generating either. The context itself is just more text. This can be seen in the imaginary text passages below in Table 1. In this example, blue is the text being defined (i.e., the identity) and yellow is the contextualizing text (i.e., the other). Note that the text in Passage B is merely part of the context in Passage A and vice versa (shown in green). In the second row of Table 1, you see a specific example using a homonym “rose”, which can have different meanings depending on its context.

Table 1.
Example of identity and other in textual context.
Indeed, by analyzing the relationship between text and context (in a literary sense), it gives us a better understanding of what we mean when using the term context beyond the literary domain. It is often said that, “it depends on the context”. However, what we see here is simply that context is not some mysterious cloud that surrounds a thing. Context is the other things: other text, other people, other organisms, other things in the environment, etc.
Whether the identity is visual, linguistic, even self-identity, or otherwise, a thing gets its identity not merely from itself or its existential qualities, but also from its relationship to others. “We are reminded of the Zulu greeting, “Sawubona”, which means “I see you” and the response “Ngikhona”, which means “I am here”. As always, when translating from one language to another, crucial subtleties are lost. Inherent in the Zulu greeting and grateful response is the sense that until you saw me, I did not exist. By recognizing me, you brought me into existence” [96]. A Zulu folk saying clarifies this, “Umuntu ngumuntu ngabantu”, meaning “A person is a person because of other people”. This reinforces the notion that identity and other mutually define one another. Additionally, the i/o structure of distinctions exists across all of our sensory inputs in which we receive information: visually, aurally, linguistically, orally, and olfactorily. While we know that distinctions are made across all of our senses, the extent to which we are aware of the distinctions we make is equally relevant to explore. In other words, it is simply not enough to make distinctions in numerous ways, it also matters whether or not we are aware that we are making them.
The theoretical construct of identity–other distinctions (D) is not merely accounting for all the identities and others that take place in mind and nature. Instead, it pushes our theoretical boundary from the bivalent to the multivalent; from the static to the dynamical. In doing so, it treads not merely on synthetic and analytical realms, but seeps into the ethical. Recognizing that an other exists whenever an identity forms—a theoretical prediction of the DSRP theory—is part and parcel of ethical behavior and the prosocial perspective taking that undergirds compassion and empathy for others.
Indeed, identity–other distinctions (D) theoretically challenges over 2500 years of ‘excluded middle’ bivalent logic and rationality, making the case that nature and mind are multivalent. In fact, it is from the very notion of the identity A that the entirety of DSRP theory originates. Because without all of DSRP, A cannot exist. Thus, because some thing—any thing—exists, then DSRP exists.
1.3. Research Questions
Cabrera [73] expanded on distinctions theoretically by proposing in DSRP theory that: (1) distinctions are universal to mind and nature; (2) all distinctions (D) constitute an existential/existential-negation relationship between identity (i) and reaction (o) variables (what Cabrera calls elements); and (3) that distinctions are not reserved merely bounding the system but every identity within it and external to it. That is: any node in any network; or any element in an ecology; or any person, place, thing, or idea; in order to exist maintains a boundary between itself and what it is not both in nature (material systems) and in the human mind. DSRP theory predicts that increased awareness (metacognition of D-rule) increases cognitive fluidity, complexity and robustness. Table 2 shows the structure of the identity–other distinctions rule. Table 3 shows the dependencies of the D-rule on the S, R, and P Rules respectively. Table 4 [83] shows the research matrix upon which our hypotheses, null hypotheses, and research design and findings are based.
Table 2.
Identity–other distinctions rule or D-rule.
Table 3.
DSRP is necessary and sufficient adapted from [75].
Table 4.
Research questions for D-rule on four dimensions from [75].
Thus, the set of D-rule studies described herein is part of a wider research program to empirically test the three major research questions shown in the matrix: basic research to establish the existence of DSRP in mind/nature and applied research to establish the efficacy of DSRP in understanding mind/nature.1 The following research questions are addressed in our work on all four universal patterns:
- Existential (basic research): focused on the questions: “Does DSRP exist? Does DSRP exist as universal, material, observable phenomena?”
- Efficacy (applied research): focused on the questions: “Is DSRP effective? Does metacognition of DSRP increase effectiveness in navigating cognitive complexity in order to understand system (ontological) complexity?” This gets at the critically important issue of ‘parallelism’—defined as the probability that our cognitive organizational rules align with nature’s organizational rules—which is central to the idea of the systems thinking/DSRP loop [75]2 (Figure 7).
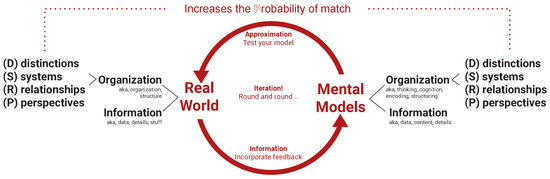 Figure 7. The ST/DSRP loop [75].
The seven studies presented herein are part of an “ecology of empirical studies” that include multiple meta-analytical literature reviews [73,87] and 26 new empirical studies. The reader is directed to the other three collections focused on: action–reaction relationship (R) studies [85], part–whole systems (S) studies [86], and point-view perspective (P) studies [84]. The reader may want focus on this ecology of the seven studies (herein) by reading them as an integrated ecology of studies. Alternatively, the reader may want to digest each study one at a time by reading, for example, the Methods (Section 2.1), Results (Section 3.1), and Findings (Section 4.1) for a single study. Thus, the empirical studies in this paper address more specific questions about the D-rule:
- Does the D-rule exist in mind and nature (in the same way evolution or heliocentrism exist)?
- Does awareness (metacognition) of the D-rule increase effectiveness in systems thinking or cognitive complexity, fluidity, etc.?
Although the designs of these research studies have focused on these questions separately, there is some overlap among these studies in their results. As a general guideline, however, it is safe to conclude that the orange polyhedra, Rorschach, dog–tree–burger, and what is a shape? studies have focused on existential questions, while the D-mapping study, D-STMI study3, and D-fishtank study focused on efficacy. These studies aim to empirically quantify the theoretical predictions made by the DSRP theory, and the various implications, by showing that they are observable and significant.
The structure of the paper that follows goes through the methods, results, and discussion of seven empirical studies, such that each numbered subsection corresponds. Thus, for the first study, the methods are labelled 2.1, the results 3.1, and the discussion 4.1. In this way, the reader can take each study separately, or read the major sections in order.
2. Materials and Methods
Unless otherwise stated, the following is true for all studies. Subjects were given a task and asked to respond. Software was used to create an experiment for subjects to complete the task and/or answer the question. Prior to deployment, several pilot tests were conducted to ensure construct validity and to correct language-based confusion. Sample sizes were chosen for generalizability (e.g., given confidence level (CL = 95%), confidence interval (CI = 5), and a US population estimated at 350,000,000, the generalizable sample size was 384. Thus, we chose sample sizes larger than this number). The sample (N varies for each study; range of N = 407 to 34,398) was generalizable to the US population. Samples were chosen based on a normal distribution of tracts of the US population. Unless otherwise noted, samples were identified using the following demographics: US population; 50/50 gender split; between the ages of 22 and 65 years old; and splits that were representative of the census numbers for education (e.g., completion of high school, community college, college, masters, PhD); and provided by Alchemer. Data were then collected and analyzed; note that incomplete data and/or nonsense data were removed.
Detail of methods pertinent to each study are provided below for each study.
2.1. The Orange Polyhedra Study Methods
Statistical analysis was performed using R v 3.6.3. Counts and percentages were used to summarize the responses. McNemar’s test was used for pairwise comparisons to assess whether the distribution of responses was significantly different between questions. Generalized linear mixed modeling was used to assess whether observed trend in probability is significantly associated with the level of distinction-making. Hypothesis testing was performed at 5% level of significance.
2.2. The Rorschach Study Methods
Statistical analysis was performed using R v 3.6.3. Hypothesis testing was performed at 95% level of significance. Counts and percentages were used to summarize the study variables. For hypotheses 1 and 2, analysis was performed using the chi-square G test (assuming a probability of 100% for each choice). For hypotheses 3 and 4, analysis was performed using chi-square test of independence.
2.3. The Dog–Tree–Burger Study Methods
Statistical analysis was performed using R v 3.6.3. Counts and percentages were used to summarize study variables. McNemar’s test was used for pairwise comparisons to test hypothesis 2. The chi-square G test was used to test research hypotheses 1 and 3.
2.4. The What Is a Shape? Study Methods
Statistical analysis was performed using R v 3.6.3. Counts and percentages were used to summarize study variables. For hypotheses 1 and 3, analyses were performed using chi-square G, assuming a null proportion of >99% for the object. For hypothesis 2, the analysis was performed using McNemar’s test.
2.5. The D-Mapping Study Methods
This study utilized data from the Plectica systems mapping software developed by Cabrera [97]. The sample (N = 34,398) consisted of a self-selecting sample of software users. Data were collected from a self-service web application that administers the Plectica software. Limited demographic data were collected. The data included all four patterns of DSRP, but the results provided herein are for the perspective pattern only. See [98] for a report of the wider data.
2.6. The D-STMI Study Methods
This study utilized data from the systems thinking and metacognition indicator (STMI) developed by Cabrera and Cabrera [82]. The sample (N = 1059) was a self-selecting sample of professionals between the ages of 18–65 who participated in the beta version of STMI post-validation. Data were collected from a self-service web application that administered the STMI. Limited demographic data were collected. The data cut across all four patterns of DSRP and “mixed and matched DSRP patterns” on both competence and confidence measures. The results provided herein are for the perspective pattern only. See [82] for a report of the wider data.
2.7. The D-Fishtank Study Methods
The sample (N = 1750 baseline; N = 350 Post) was generalizable to the US population (see above in general methods). The data cut across all four patterns of DSRP. The results provided herein are for the perspective pattern only. See [99] for a report of the wider data.
3. Results
3.1. The Orange Polyhedra Study
In the first set of tasks, subjects were asked to perform four tasks using the same image of an orange polyhedra  on a white background. There were two task sets, A—object and B—whitespace, and two conditions, 1—identity and 2—other. A1 asked subjects to click on the ‘object’ and name it. A2 asked subjects to click on the ‘not-object’ and name it. B1 asked subjects to click on the ‘whitespace’ and name it. B2 asked subjects to click on the ‘not-whitespace’ and name it. Table 5 shows the underlying theoretical structure of the clicking and naming tasks.
on a white background. There were two task sets, A—object and B—whitespace, and two conditions, 1—identity and 2—other. A1 asked subjects to click on the ‘object’ and name it. A2 asked subjects to click on the ‘not-object’ and name it. B1 asked subjects to click on the ‘whitespace’ and name it. B2 asked subjects to click on the ‘not-whitespace’ and name it. Table 5 shows the underlying theoretical structure of the clicking and naming tasks.
Table 5.
Structure of clicking and naming tasks.
Table 6 shows the hypotheses for this study where: probability (p); identity (i); other (o); tangibility (T); naming (N); negation ().
Table 6.
Hypotheses for the orange polyhedra study.
Task A1, OBJECT: Subjects (N = 374) were shown an orange polyhedra and were asked, “Click on the OBJECT and name what you clicked on”. 100% or 374 of 374 clicked on the orange polyhedra (M = 1.00, SD = 0.00, N = 374, CI = 99%). Subjects named the orange polyhedra as follows:
- 82% of the subjects (307/374) named the polyhedra as either a ‘cube’, ‘box’, or ‘square’;
- 8.28% of the subjects (31/374) named the polyhedra as another polyhedra other than a cube. For example, a ‘quadrilateral’, ‘diamond’, or ‘trapezoid’;
- 6.68% of the subjects (25/374) named the polyhedra as the part they clicked on. For example, ‘face’, ‘edge’, or ‘corner’;
- 2.94% of the subjects (11/374) provided ‘other’ names that could not be interpreted, such as ‘Jim’ (perhaps literally giving the object a name) or ‘roof’ and ‘heat lamp’ (perhaps naming the object as something it looked similar to).
We can conclude from this that 100% of subjects visually identified the object and (visually) correctly distinguished (clicked) the object from its background and that 97.06% of subjects (linguistically) correctly distinguished (named) the object as a ‘polyhedra’ or parts of ‘polyhedra’.
Task A2, Not-OBJECT: subjects (N = 374) were then shown the same orange polyhedra again and asked, “Click on the Not-OBJECT and name what you clicked on”:
- 52.13% or 195 of 374 correctly clicked somewhere other than the orange object (a.k.a., the Not-object) as instructed;
- 52.60% of the subjects (197/374) named the ‘not-object’ (i.e., the background) as instructed.
- -
- Of those: 49.74% (98/197) named it ‘background’, ‘space’, ‘screen’, or other like-terms; 25.38% (50/197) named it ‘not-object’; and
- -
- 21.82% (43/197) named it ‘nothing’, ‘none’, or ‘blank’, and 3.04% (6/197) gave ‘other’ names that could not be interpreted, such as ‘desk’ or ‘unknown’.
- A total of 47.86% or 179 of 374 subjects incorrectly clicked on the object instead of the background space in the image and named it as follows:
- 43.85% of the subjects (164/374) named the ‘object’ (i.e., the orange polyhedra);
- -
- Of those: 85.36% (140/164) named the object ‘cube’, ‘square’, ‘box’, or like-terms; and
- -
- 14.63% (24/164) gave ‘other’ names that could not be interpreted, such as ‘hex’ or ‘corona’.
Table 7 shows that 52.13% correctly clicked on the background of the object (or Not-object) as instructed. Of the 52.13% subjects who clicked in the correct area (not-object), 96.95% named it something that indicates that they understood the concept of ‘not-object’or the other condition as a negated object. A total of 47.86% incorrectly clicked on the object. It is unclear if those subjects that clicked on the object simply misunderstood the task, or failed to understand the instructions or the term ‘not-object’.
Table 7.
Click and name not-object task (percent correct).
Task B1, WHITESPACE: in a third task, subjects (N = 374) were then shown the same orange polyhedra and asked, “Click on the WHITESPACE and name what you clicked on”.
- A total of 83.42% (312/374) clicked on the whitespace as instructed and named it as follows:
- -
- 82.46% (254/308) named it ‘whitespace’, ‘background’, ‘space’, or other like-terms;
- -
- 10.38% (32/308) named it ‘nothing’, or ‘blank’; and
- -
- 7.14% (22/308) gave ‘other’ names that could not be interpreted such as ‘Susan’ or ‘ghost’.
- A total of 16.57% or 62 of 374 subjects incorrectly clicked on the object and named it as follows:.
- -
- 17.64% of the subjects (66/374) named the ‘object’ (i.e., the orange polyhedra).
- *
- Of those: 57.57% (38/66) named the object ‘cube’, ‘square’, ‘box’, or like-terms; 25.75% (17/66) gave ‘other’ names that could not be interpreted, such as ‘excellent’ or ‘objection’;
- *
- 2.94% of all subjects (11/374) did not provide names for their clicks.
Table 8 shows that when the instruction changed from a relatively unfamiliar term, ‘not-object’ to the more familiar term ‘whitespace’, correct clicks increased from 52.13% to 83.42%, and even though the task followed the previous task, 0% named the whitespace as ‘not-object’.These results buttress the likelihood that some portion of subjects misread the prompt (as not-object is easier to read as object than whitespace) as the number of incorrect (on object) clicks fell from 47.86% to 16.57%. In addition, this illustrates that significantly more subjects are clear about the identity of an object than they are about the other of an object. In other words, when subjects are asked to click and/or name a positive object (whether the object is a polyhedra or blank whitespace), they are more successful than when they are asked to identify and name the negative object (not-object or not-whitespace). This is an area for future research.
Table 8.
Click and name whitespace task (percent correct).
Task B2, Not-WHITESPACE: In a fourth task, subjects (N = 374) were then shown the same orange polyhedra and asked to, “Click on the not-WHITESPACE and name what you clicked on” (Results in Table 9).
Table 9.
Click and name non-whitespace task (percent correct).
- A total of 89.57% or 335 of 374 clicked on the not-whitespace (a.k.a., the object);
- 87.96% of the subjects (329/374) named the ‘non-whitespace’ (i.e., the orange polyhedra as instructed) as follows:
- -
- 77.50% (255/329) named it ‘square’, ‘cube’, ‘box’, or other like-terms;
- -
- 11.55% (38/329) named it ‘non-whitespace’; and
- -
- 10.94% (36/329) gave ‘other’ names that could not be interpreted, such as ‘bubba’ or ‘pole’.
- A total of 10.43% or 39 of 374 subjects incorrectly clicked on the ´whitespace´;
- 8.55% of the subjects (32/374) named the ‘whitespace’ (i.e., the background).
- -
- Of those who named it: 46.87% (15/32) named the object ‘background’, ‘space’, or like-terms;
- -
- 31.25% (10/32) named the object ‘nothing’, or ‘blank’; and
- -
- 21.87% (7/32) gave ‘other’ names that could not be interpreted such as ‘grinch’ or ‘ski’.
- A total of 3.47% (13/374) did not provide a name for their click.
- -
- This suggests that those who incorrectly clicked did so in error as they completed the task by naming what they clicked on correctly.
Table 10 and Figure 8 illustrate the declining ability to make accurate distinctions based on tangibility, naming, and negation. Subjects were more likely to click and name correctly the more tangible the choice was. Conversely, the more intangible, negated, or unnamed the choice was, the higher likelihood of incorrect distinction making. The combination of negated, unnamed, and intangible characteristics produced (significantly) worse results.
Table 10.
Clicks and naming differences.
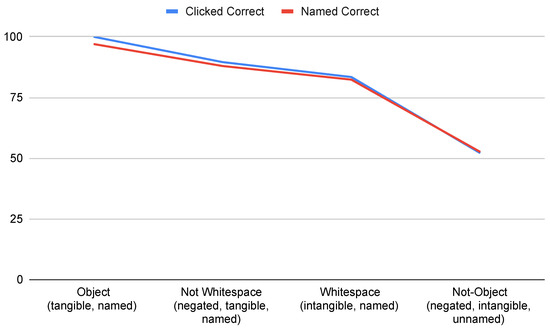
Figure 8.
Distinctions difficulty tangible, named, negated.
Generalized linear mixed modeling was used to assess whether observed trend in probability is significantly associated with the level of distinction-making in Figure 9. The linear trend observed was not statistically significant (p = 0.169). Table 11 provides the descriptive statistics for the study.
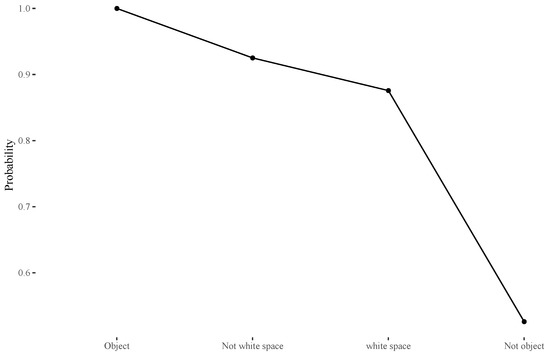
Figure 9.
Probability of choosing the correct answer based on distinction-making.
Table 11.
Descriptive statistics for the study sample.
The results showed that 100% of respondents correctly chose the object compared to only 52.1% who chose the non-object. The percentages (%) of respondents who correctly identified white and non-whitespaces were 83.4% and 89.3%, respectively. Statistical analysis was performed using McNemar. p values were adjusted for false discovery rate.
Results (Table 12) showed that the percentages of correct answers were significantly higher when the subjects were asked to define objects compared to all other cases (p < 0.001 *** for all but one pairwise comparison). The percentages were also higher when respondents were asked to choose whitespace or non-whitespace than not-objects. The percentages of correct answers were significantly higher when respondents were asked to choose non-whitespace than whitespace (p < 0.001).
Table 12.
Results for pairwise comparisons.
3.2. The Inkblot Study
Subjects (N = 374) were shown a traditional Rorschach inkblot  shown in Figure 10 and then asked, “Describe what you see”.
shown in Figure 10 and then asked, “Describe what you see”.
Figure 10.
Rorschach inkblot: Describe what you see....
The inkblot study had four null and alternative hypotheses. The first null hypothesis () was that, upon being shown the same thing, all subjects would distinguish it conceptually the same way, whereas the alternative hypothesis was () that subjects would distinguish it conceptually differently. The second null hypothesis () was that subjects would distinguish it in name, in the same way, whereas the alternative hypothesis () was that subjects would distinguish it in name differently. The third null hypothesis () was that there was equal probability of conceptually distinguishing all of the things that were conceptually distinguished, whereas () was that the probability was not equal. The fourth null hypothesis () was that there was an equal probability of distinguishing by name all of the things that were named, whereas () was that the probability was not equal.
Table 13.
Hypotheses for the Rorschach study.
Although responses varied in what subjects saw—their unique responses (see Table 14 for the top eight)—fell into the four coded groups (see Figure 11): person, animal, thing, and other.
Table 14.
Rorschach unique responses coded data.
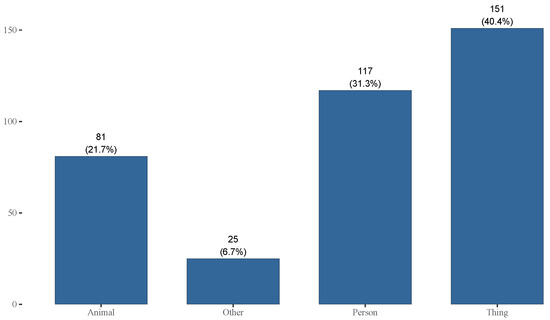
Figure 11.
Observed concepts in the study.
Other unique responses included: ‘3d x-ray image slice view’, ‘A crazy deer footprint in the mud’, ‘An angry chicken running at me’, ‘Road kill’, and ‘The white image looks like a ghost’. Figure 11 shows the categorized coded response types by count and percentage of the total (N = 374). A total of 34.49% of subjects saw two of something and 93% saw it as a person (31.28%), thing (40.37%), or animal (21.65%).
Results showed that 40.4% of the respondents chose “things” followed by “person”, and “animal”. Only 6.7% chose “other.” The probability (Table 15) of observing any of these objects with a probability ≠ 100% was less than 0.1% (p < 0.001 *** using the chi-square G test) supporting .
Table 15.
Pairwise comparisons.
A statistical analysis was performed using McNemar’s test. Results showed that the probability of choosing “thing” was significantly higher than all other concepts (p < 0.001 ***) indicating a higher probability of choosing “thing”. The probability of choosing “person” was significantly higher (p < 0.001 ***) than the probability of choosing “animal” and “other”. Finally, the probability of choosing “animal” was higher (p < 0.001 ***) than the probability of choosing “other”. These results support H3 and show that the probability of choosing concepts was not equal.
The probability of choosing any of the names (Figure 12) was not equal to 100% (p < 0.001 *** for all comparisons). Thus, the null hypothesis could be rejected () in favour of the alternative hypothesis ().
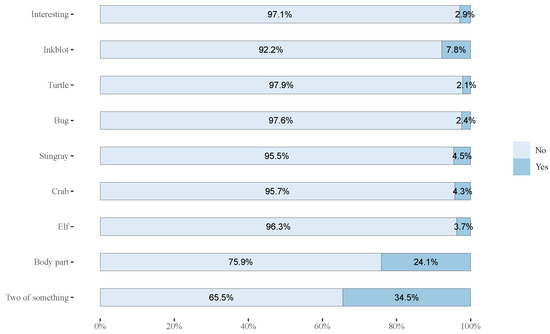
Figure 12.
Frequency of the names identified by respondents (N = 374).
Post hoc pairwise comparisons (Table 16) showed that the probability of choosing “two of something” was significantly higher than any of the remaining coded choices (p < 0.05 for all pairwise comparisons). Similarly, the probability of choosing “body part” was significantly higher than the probability of choosing any of the remaining answers. Thus, the null hypothesis for H4 can be rejected. Analysis was performed using McNemar’s test. p-values were adjusted for false discovery rate. Numbers represent the p-values for the corresponding McNemar’s test.
Table 16.
Post hoc pairwise comparisons.
3.3. The Dog–Tree–Burger Study
Subjects (N = 374) were shown three familiar images (a dog, a tree, and a hamburger, as seen in Table 17), and given six word-based answer choices for each. They were then asked to “Check all the boxes that define each of the items.” The hypotheses for this study are shown in Table 18 where: is the probability of choosing the positive identity (i.e., DOG, TREE, BURGER) and is the probability of choosing the negated other (i.e., NOT-DOG, NOT-TREE, NOT-BURGER); is the probability of choosing other 1; is the probability of choosing the other 2; is the probability of choosing the other 3; and, is the probability of choosing the identity and both others.
Table 17.
Number and percentage of correct answers.
Table 18.
Hypotheses for dog–tree–burger.
Table 17 shows that subjects had little trouble identifying both the positive identity (e.g., dog is a dog) and the negated other (e.g., dog is also not a tree) conditions of a particular common object.
A total of 28 respondents were excluded as they checked all of the boxes. Thus, the final sample included 346 respondents. Descriptive statistics for this study are shown in Table 19.
Table 19.
Descriptive statistics for the dog–tree–burger study.
Data were summarized using counts and percentages. Results represent the percentages that chose correctly.
Results showed (Figure 13 and Table 20) that the percentages of correct answers were not equal to 100% in all three cases. Thus, the null hypothesis can be rejected in favour of the alternative hypothesis.
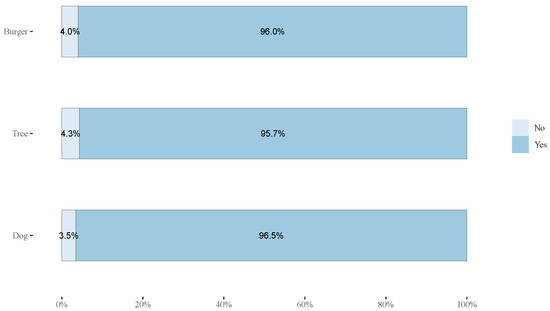
Figure 13.
Responses for the included images.
Table 20.
Chi-square G test results.
Pairwise comparisons were performed using McNemar’ test (Table 21).
Table 21.
Results for pairwise comparisons.
Result showed (Figure 14) that the proportion of respondents who correctly chose the object was 75%. The proportion was significantly different from an expected value of 50% (p < 0.001 ***). However, it was significantly lower than an expected value of 100% (p < 0.001 ***).
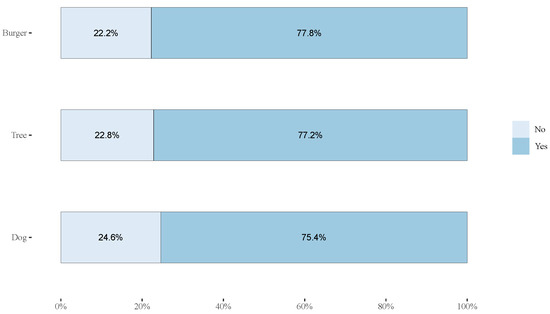
Figure 14.
Proportion of respondents who correctly chose the “objected” and negated the remaining two objects.
3.4. The Shape/Not-Shape Study
In another set of tasks testing distinction making, subjects (N = 374) were asked to identify and name three familiar shapes as a baseline for subsequent tasks. The hypotheses for this study are shown in Table 22 where: p is probability; c is conceptual distinction; t is the terms used to make distinction; i is the identity (i.e., triangle, square, circle); o is the negated other (i.e., NOT-Triangle, NOT-Square, NOT-Circle); is the probability of choosing other 1; is the probability of choosing the other 2; is the probability of choosing the other 3; and, is the probability that the other includes both others.
Table 22.
Hypotheses for shape/not-shape study.
In the baseline, subjects overwhelmingly recognized these familiar shapes and named them accordingly (as square, triangle, and circle shown in Table 23). The responses for baseline objects were coded as yes or no based on the names provided.
Table 23.
As a baseline, the majority similarly identify and name basic shapes (N = 374).
This set of three tasks establishes a baseline that an overwhelming majority of subjects can identify and appropriately name a square, triangle, and circle. When answers were coded for similarities and grouped, the results showed that, at the same time that subjects recognized the square, triangle, and circle as a baseline, they also included multiple similar attributes, such that several identity statements could be true. For example: [shape] is circle, [shape] is black, [shape] is black, [shape] is round. These data are shown in Table 23.
Results showed (Figure 15) that the percentage of respondents who correctly identified the object was >90% in all three situations (p < 0.001 ***) supporting H1.
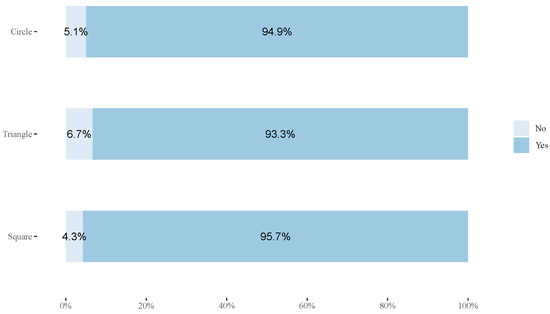
Figure 15.
Responses to baseline objects.
The analysis was performed using chi-square G, assuming a null proportion of >99% for the object. The results (Table 24), although >90%, were significantly different from the expected probability of 100%.
Table 24.
H1 test results for the shape/not-shape study.
Table 25 shows counts and percentages for unique names and coded groups for square, triangle, and circle. Note that in support of the alternative hypothesis, subjects showed both similarities and differences in their naming and concepts of the shapes. Overwhelmingly, subjects “concepted” the shapes similarly (and “correctly”) while also differing on the finer-grain choices they made to describe each shape.
Table 25.
Counts and percentages for various unique names and coded groups.
Subjects (N = 374) were then asked to complete three tasks: (1) to “click on not-square”, (1) to “click on not-triangle”, and (1) to “click on not-circle”. This specifically tests the ability of individuals to see the two elements of distinction making (identity and other). Subjects overwhelmingly clicked on the expected “not object” areas, as shown in the three heat map images in Table 26.
Table 26.
Heatmaps for distinguishing shapes.
Analysis was performed using chi-square G (Table 27). The percentage of respondents who correctly responded to the positively and negatively worded questions for each object was significantly different from zero (p < 0.001 *** for all three objects). Thus, the null hypothesis can be rejected in favour of the alternative hypothesis.
Table 27.
H2 test results for shape/not-shape study.
3.5. The D-Mapping Study Results
A study (N = 34,398) of aggregate data of software users in the Plectica systems mapping software4 determined what people did (and did not do) when they mapped a system. A total of 48% did nothing, which is consistent with case study research where people faced with an open-ended problem or question (mapping prompt) and/or a blank page or screen (mapping area) had no response and took no action (i.e., they ’froze’). Table 28 shows additional results.
Table 28.
Actions users took—and did not take—when systems mapping (N = 34,398).
These data provide insight into what people do when mapping using systems thinking, and what they do not do (or could do, but do not). Table 29 differentiates between what people do (or did) and what they do not do (or could or should do). It provides a good baseline for what systems thinkers should continue to do and what they should do more of.
Table 29.
What people do and do not do in systems mapping (N = 34,398).
Specifically, where identity–other distinctions are involved, (48% of people distinguished nothing whereas 52% of people distinguished 2,066,654 identities. At the same time, people rarely consider the other () or validate the identities () they make.
3.6. The D-STMI Study Results
In a study utilizing the systems thinking and metacognition indicator (STMI) [82] (N = 1059), subjects exhibited the well-known Dunning–Kruger Effect [100], where confidence was higher than competence in distinction making, as shown in Figure 16. This was the case across all four universals of the DSRP theory (part–whole systems, action–reaction relationships, and point-view perspectives) but herein we focus on the distinction making results. The subjects’ aggregate distinction making competency/skill score was 68.5 whereas the confidence score was 86.5—a difference of 18.
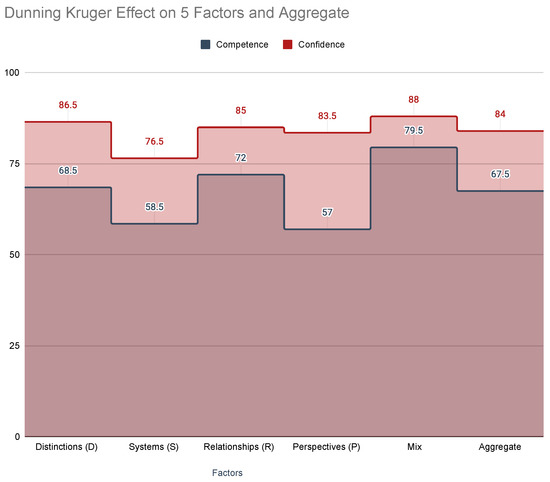
Figure 16.
Dunning–Kruger effect in distinction making.
3.7. The D-Fishtank Study Results
In the fishtank study, subjects (N = 1750) were asked to describe what they saw in a fishtank scene (the static image in Figure 17).

Figure 17.
Describe what you see... [83].
Responses established the baseline data. Then subjects (N = 350) were exposed to a less than one-minute treatment that consisted of reading the bullet text shown in Table 30, which is excerpted from [83].
Table 30.
Less than 1 min of treatment excerpt from [83].
Subjects were then shown the same fishtank image and asked again to “Describe what they see”. The quantitative data for the distinctions (D) fishtank study is fully explicated in Cabrera [83], so we will only summarize herein. Results showed that the “PostD responses have significantly more words overall and those words are more complex” [83]. Table 31 shows the differences. Importantly, according to research by Lewis and Frank (2016) [101], word length is a valid indicator of the complexity of ideas. The pre- and post-data show increases in the number of characters, words, and length to indicate corollary increases in cognitive complexity of responses between the pre- and post-conditions.
Table 31.
PreD and postD aggregate response data excerpted from [83].
Cabrera et al. [83] explain that: Results in Table 32 and Table 33 show that the distribution of number of concepts (i.e., the number of individual entries the subject made, “raw data”) was not significantly different before and after treatment (p = 0.062 using the Wilcoxon signed-rank test). Data (N = 383) were summarized using median (IQR). Statistical analysis was performed using Wilcoxon signed-rank test. However, the median number of words used after treatment (Mdn = 6, IQR 3–10) was significantly higher than the median number of words used before treatment (Mdn = 4, IQR 3–7, p < 0.001 ***). Similarly, the median number of characters used after treatment (M = 29, IQR 14–53) was significantly higher than the median number of characters used before treatment (Mdn = 12, IQR 13–36, p < 0.001 ***).
Table 32.
Distribution of words and characters (vertical lines represent median) for distinctions (D) excerpted from [83].
Table 33.
Comparison of raw counts, words, and characters before and after D-treatment excerpted from [83].
4. Discussion of Findings
These seven studies provide an “ecology” of findings about identity–other distinctions. Each study furthers our understanding of identity–other distinctions (a.k.a., boundaries) and answers important questions about: (1) how and why they form; (2) their internal and external dynamics; (3) the roles they play in individual and social cognition; (4) the roles they play in metacognition; and (5) the effects of metacognitive awareness of distinctions on cognitive complexity.
4.1. The Orange Polyhedra Study
The orange polyhedra study helps to better understand how people make distinctions, which include the positive identification of something (the ‘identity’) and the negation of some other thing(s) (the ‘other’). The results of this study indicate that any identity—no matter how discrete (orange polyhedra) or indiscrete (empty whitespace) it is—is also perceived as an other or not-identity. It is also clear that even the most basic things (identities, such as a whitespace or cube) will go by different linguistic labels (words). Therefore, it appears that words alone are not an adequate representation of the concepts or things themselves. Any two people may use the same words to describe different things or use different words to describe the same thing. We see in Table 10 and Figure 8 that:
- People have an easier time identifying and naming objects than not-objects
- When the identity is an object, they do better;
- When the identity is a not-object, they do worse;
- When the other is an object, they do better; and
- When the other is a not-object, they do worse.
4.2. The Rorschach/Inkblot Study
The Rorschach/inkblot study suggests that the perceived identity of an object varies widely and that the recognition and naming of that perceived identity at the level of individual-cognition can take on four conditions at the aggregate level of social-cognition:
- Same/same (i.e., the same identity can be called by the same name);
- Same/different (i.e., the same identity can be called by different names);
- Different/same (i.e., different identities can be called by the same name); or
- Different/different (i.e., different identities can be called different names).
The results suggest that when shown an ambiguous object people will see (visually and in their minds) many different identities. These data indicate that something non-discrete and abstract, such as an inkblot, can yield dramatically different concepts, identification, and naming among individuals. In other words, people distinguish the same things both differently and similarly. The fact that 34.49% of subjects saw two of something and that nearly 93% saw it as a person (31.28%), thing (40.37%), or animal (21.65%), means that while people see things differently, they also see things the same. This is the paradox of distinction making: as individuals, we often distinguish things differently, but in the aggregate, those varied distinctions create a “statistical cloud” within which there is aggregate agreement.
4.3. The Dog–Tree–Burger Study
The dog–tree–burger study reveals that people distinguish and name objects both by their positive-identity and their negative-other. It also shows that the ‘other’ can be (and often is) a ‘system of others’.5 This means that not-dog is comprised of parts (i.e., not-tree, not-burger, ad infinitum). It may be that these negated sets (or part–whole systems of things) form a cognitive “dark matter” that binds the contents of one’s cognitive universe together, and not without important effects. For example, if TRUCK is not-CAR and FORD F-150 is a TRUCK, then without learning it or being told, one could conclude that a FORD F-150 is not-a-CAR. Although further research is needed, this may also be instrumental in “going up a level” where certain identities are part-of or not-part-of (systems), related-to or not-related-to (relationships), or seen-by or not-seen-by other identities (perspectives) and, therefore, stringing together a logical or sense-making cognitive universe (dominated by “not matter”) that allows us to conclude things, such as ‘while an apple is not an orange, both are fruits’.
These data explicate that subjects not only identify (in this case common) objects by what they are (identity) but also by what they are not (other). Thus, ‘not-a-tree’ and ‘not-a-burger’ are other terms for ‘dog’, and vice versa. This establishes the co-identities of any given item: dog and not-tree. However, it also means that, for example, tree and burger are both not-dog, thus establishing a part–whole set of things that are not-dog, which explicates the idea that the ‘other’ is often a ‘system of others’.
The data in Table 17 also show that identity and other are interchangeable: that a DOG or TREE or BURGER can alternatively be thought of, respectively, as Not-DOG, Not-TREE, and Not-BURGER.
4.4. The Shape/Not-Shape Study
The shape/not-shape study: the results of this study, such as the Inkblot study, show that identity–other distinctions are both diverse at the individual-cognition level and also aggregate remarkably similarly at the level of social-cognition. For example, Table 23 shows that people basically have a shared mental model of the basic shapes: triangle, square, and circle. This study also reinforces the conclusions that: (1) people conceptually and visually distinguish identity and other; (2) the ‘other’ is more often than not a ‘system of others’; and (3) explicates that distinction making is occurring individually (psychologically/cognitively) and in groups (sociologically/statistically), which has significant implications on shared meaning and knowledge creation.
However, there are two other important conclusions that can be taken from these results. First, people are able to conceptually and visually distinguish between identity and other without difficulty, indicating the universality of identity–other distinctions. Second, both identities and others (e.g., not-identities, or not-square, not-triangle, and not-circle), are part–whole sets (others rather than a single other). However, in this case, we see that these part–whole sets of ‘otherness’ (see Table 34) are mediated and formed socially and statistically rather than by an individual (although it is almost certainly occurring within the individual as well). Thus, several existential or is statements could make up the identity ([shape] is circle, [shape] is black, [shape] is black, [shape] is round; shown in Figure 18) and several existential or is statements could make up the other ([item] is not-gerbil, [item] is not-rabbit, [item] is not-tree as shown in Figure 5 and Table 10 and Table 17, etc.)
Table 34.
Creation of part–whole other in individual and social cognition.
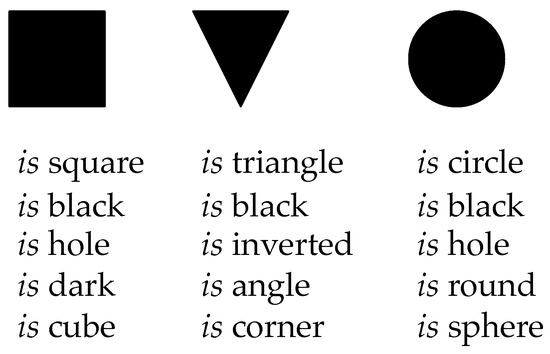
Figure 18.
Creation of part–whole identity in individual and social cognition.
This seemingly simple idea may lie at the core of shared meaning making, normative meaning, and knowledge generally. From the data in Table 26, we can see in Table 34 that the other is a statistical cloud—a part–whole structure.
Figure 18 illustrates (from the data in Table 25) that identity is also a part–whole structure at both the levels of individual and social cognition.
It is also curious, given the orange polyhedra study, how many people clicked on other objects (non-whitespace) when asked to click on something other than object x. This establishes a strong preference for “somethingness” over “nothingness”, object-orientation over conceptual fluidity.
4.5. Dependency Research Studies
In other research studies, the part–whole variables of systems (S) [86], the action and reaction variables of relationships (R) [85], and the point and view variables of perspectives (P) [84], were all shown to be identity and other distinctions (D). For example, as part of research on part–whole systems (S), Cabrera found [86] that both the parts and the wholes were identity–other distinctions.
4.6. The D-Mapping Study
The prior studies get at the existence of identity–other distinctions. The Fishtank, STMI, and D-mapping data shows that identity–other distinctions not only exist but can be utilized as a metacognitive skill with highly statistically significant effects and can be measured in terms of competence and confidence.
Table 28 shows that nearly half of subjects (48%!) ‘freeze up’ when faced with a blank canvas and the task of thinking through an issue, thought, problem, or system. This means they ‘freeze up’ in the act of making the very first identities (which also means they never get to others). This aligns with case-based and anecdotal experience that, when faced with the ‘blankness’ of open-ended questions or free reign, many people will simply be overwhelmed by options. For the 52% of people who did something in this study, the very initial act was to create an identity—indicative of a distinction. Table 28 goes on to detail the various things the sample of 34,398 people did and did not do. In terms of metacognition, much can be learned from these statistics. Table 29 summarizes these data and also what we can learn by providing a list of things we can continue to do and things we can attempt to do more of. This list is a best practices for systems thinking and metacognition. Becoming aware of (metacognition) and, therefore, doing more of the items on this list is, part and parcel of, systems thinking.
4.7. The D-STMI Study
Specifically, in both the fishtank study and the STMI study6 we see that the theoretical universal of identity–other distinctions can also be utilized as metacognitive skills that can be measured in both competence/skill and confidence. The Dunning–Kruger effect is evident in our sample and illustrates that we should be careful not to overestimate our competency in the distinction making skill.
4.8. The D-Fishtank Study
The fishtank study shows that, with high statistical significance, a short (less than 1 min) intervention based on the basic concepts of identity–other distinctions can have a positive effect on the complexity of cognition. People not only see quantitatively more, but qualitatively deeper as well. Given the limited exposure to treatment (on average, a 28.11 s read of bullets of text), these findings indicate a statistically significant increase in the degree to which people made more detailed distinctions and more distinctions. With a more substantive treatment (such as a short course) one can imagine the effects may be transformative.
4.9. Summary of Findings on Existence, Universality, Efficacy, and Parallelism
The findings in this ecology of studies, focusing on identity–other distinctions, are detailed above. It is important to note that all of these findings confirm specific predictions made by the DSRP theory. In these seven studies, we see that the identity and other elements of the distinctions pattern are inextricably linked, co-implying, and interchangeable. This idea is explained in Cabrera et al. [75] where “Equation (2) shows that, if an identity (i) called A exists (∃), it is co-implied (⟺) that an other (o), exists and vice versa (red indicates universal DSRP elements and the blue represents the information variables). This means that if A exists (and A represents anything), then an identity–other distinction () must also exist”.
Thus, in Equation (3), we see that the identity–other elements of distinctions are universal to all forms of objects/things, concepts/ideas, or boundaries, etc. Moreover, these universal elements are interchangeable, such that any identity can also function as an other and vice versa:
In other research studies, the action and reaction variables of relationships (R) [85], the part and whole variables of systems (S) [86], and the point and view variables of perspectives (P) [84], were all shown to be identity–other distinctions (D), for example, the elements of S, R, and P are identity–other boundary distinctions. Similar to the studies presented herein for identity–other distinctions (D), an ecology of studies was undertaken to test the existence and efficacy of, respectively, S, R, and P rules. These studies show that, with high statistical validity, the identity–other distinction is a factor in the formation of a part–whole system, action–reaction relationships, and point-view perspectives. From the results of these seven studies, we can conclude that identity–other distinctions (D) are:
- Universal to the organization of information:
- (a)
- in the mind (i.e., thinking, metacognition, encoding, knowledge formation, science, including both individual and social cognition, etc.; and
- (b)
- in nature (i.e., physical/material, observable systems, matter, scientific findings across the disciplines, etc.).
- Made up of elements (identity, other) that are:
- (a)
- Co-implying (i.e., if one exists, the other exists; called the co-implication rule);
- (b)
- Related by a special7 Relationship: existential/existential-negation (i.e., is/is-not); and
- (c)
- Act simultaneously as, and are, therefore, interchangeable with, the elements of relationships (action, reaction), systems (part, whole) and perspectives (point, view). This is called the simultaneity rule.
- Mutually-dependent on action–reaction relationships (R)), part–whole systems (S), point-view perspectives (P), such that D, S, R, and P are necessary and sufficient; and
- Taken metacognitively:
- (a)
- Constitute the basis for making structural predictions about information (based on co-implication and simultaneity rules) of observable phenomena and are, therefore, a source of creativity, discovery, innovation, invention, and knowledge discovery; and
- (b)
- Effective in navigating cognitive complexity to align with ontological systems complexity.
5. Conclusions
With these findings in mind, we can return to our table of research questions (Table 4) to summarize what was found. In conclusion, these data suggest the observable and empirical existence, universality, efficacy, and parallelism (between cognitive and ontological complexity) of identity–other distinctions (D), and with high statistical significance point to the conclusions in Table 35.
Table 35.
Summary Table of Conclusions.
Author Contributions
The authors contributed equally to the methodology, software, validation, formal analysis, investigation, resources, data curation, writing—original draft preparation, writing—review and editing, visualization, supervision, project administration, funding acquisition. Development of DSRP theory, D.C., L.C. and E.C. All authors have read and agreed to the published version of the manuscript.
Funding
This research received no external funding.
Institutional Review Board Statement
Ethical review and approval were waived for this study, due to no collection of personal or identifying data.
Informed Consent Statement
Informed consent was obtained from all subjects involved in the study.
Data Availability Statement
The data presented in this study are available upon request from the corresponding author. The data are not publicly available due to privacy, human subjects, and ethical considerations.
Conflicts of Interest
The authors declare no conflict of interest.
Abbreviations
The following abbreviations are used in this manuscript:
| DSRP | DSRP theory (distinctions, systems, relationships, perspectives) |
| D | identity–other distinctions |
| S | part–whole systems |
| R | action–reaction relationships |
| P | point-view perspectives |
| STMI | systems thinking and metacognition inventory |
| IQR | interquartile range |
| GLMM | generalized linear mixed modeling |
| RDS | relate–distinguish–systematize jig |
Notes
| 1 | Some readers may find it confusing that we combine what might be called a positivist or objective and a constructivist or phenomenological or subjective epistemic views. We see no particular difficulty as the philosophical debate as to their incompatibility appears to be little more than a false dichotomy. It seems quite obvious to us that, given both everyday behavior and empirical evidence, not one of us humans or animals go about their day as if nothing is real. Likewise, even the most cantankerous positivist would concede that our mental models are real and influence real world behavior, even when the models themselves are not valid. Alas, we consider this to be the domain of philosophers (which we are not) and focus on following where the empirical science and data lead us, regardless of whether or not it violates one of our epistemic beliefs. We see absolutely no problem mixing positivism and phenomenology, for example. Nor do we see an issue mixing reductionism and holism or nature and nurture or behaviorism and cognitivism. These are false dichotomies that likely should be placed in the dustbin of history. |
| 2 | From [83], “It should be noted that the ST/DSRP loop is the mirror opposite of confirmation bias. Confirmation bias reverses this loop, by fitting reality to one’s mental models, whereas DSRP-systems thinking fits mental models to real-world observables and feedback. Parallelism is therefore the degree to which one’s cognitive paradigm, style, or mindset, aligns with nature’s. One purpose of this research program, is to determine the degree to which DSRP theory accomplishes this parallelism”. |
| 3 | STMI is the acronym for the systems thinking and metacognition inventory |
| 4 | full disclosure, Plectica systems mapping software was invented by Dr. Derek Cabrera and used for years as a pilot software for research purposes (it was originally called MetaMap). Cabrera later co-founded Plectica and developed the software further as a consumer application. Plectica was then sold to Frameable and Cabrera is no longer actively involved in the company. |
| 5 | The why not a dot? study indicates a similar part–whole structure for identities, meaning that both identities and others are part–whole structures [84]. |
| 6 | the STMI study focused on more than just the effects of distinctions; see [82]. |
| 7 | “special” here refers to the specific relationship. In contrast to general or universal relationships. |
References
- Spencer-Brown, G. Laws of Form; Allen & Unwin: London, UK, 1969. [Google Scholar]
- Krauss, L. Why Is There Something Instead of Nothing? [Video]. Available online: https://www.scientificamerican.com/article/why-is-there-something-instead-of-nothing-video/ (accessed on 7 December 2021).
- Euler, L. Solutio Problematis ad Geometriam Situs Pertinentis; Commentarii Academiae Scientiarum Petropolitanae: St. Petersburg, Russia, 1741; Volume 53, pp. 128–140. [Google Scholar]
- Kolata, G. Studying Learning In The Womb. Science 1984, 225, 302–303. [Google Scholar] [CrossRef] [PubMed][Green Version]
- Partanen, E.; Kujala, T.; Näätänen, R.; Liitola, A.; Sambeth, A.; Huotilainen, M. Learning-induced neural plasticity of speech processing before birth. Proc. Natl. Acad. Sci. USA 2013, 110, 15145–15150. [Google Scholar] [CrossRef] [PubMed]
- Quinn, P.C.; Brown, C.R.; Streppa, M.L. Perceptual Organization of Complex Visual Configurations by Young Infants. Infant Behav. Dev. 1997, 20, 35–46. [Google Scholar] [CrossRef]
- Newman, R.S.; Jusczyk, P.W. The Cocktail Party Effect in Infants. Percept. Psychophys. 1996, 58, 1145–1156. [Google Scholar] [CrossRef]
- Gauthier, I.; Tarr, M.J. Becoming a “Greeble” expert: Exploring mechanisms for face recognition. Vis. Res. 1997, 37, 1673–1682. [Google Scholar] [CrossRef]
- Aubin, T.; Jouventin, P. Cocktail-party effect in king penguin colonies. Proc. R. Soc. Lond. Ser. B-Biol. Sci. 1998, 265, 1665–1673. [Google Scholar] [CrossRef]
- Fry, S.N.; Wehner, R. Honey bees store landmarks in an egocentric frame of reference. J. Comp. Physiol. A-Neuroethol. Sens. Neural Behav. Physiol. 2002, 187, 1009–1016. [Google Scholar] [CrossRef]
- Badre, D. Cognitive control, hierarchy, and the rostro-caudal organization of the frontal lobes. Trends Cogn. Sci. 2008, 12, 193–200. [Google Scholar] [CrossRef]
- Bukach, C.M.; Gauthier, I.; Tarr, M.J.; Kadlec, H.; Barth, S.; Ryan, E.; Turpin, J.; Bub, D.N. Does acquisition of Greeble expertise in prosopagnosia rule out a domain-general deficit? Neuropsychologia 2012, 50, 289–304. [Google Scholar] [CrossRef]
- Drews, G. Contributions of Theodor Wilhelm Engelmann on phototaxis, chemotaxis, and photosynthesis. Photosynth. Res. 2005, 83, 25–34. [Google Scholar] [CrossRef]
- Sengupta, A.; Kruppa, T.; Löwen, H. Chemotactic predator-prey dynamics. Phys. Rev. E 2010, 83, 031914. [Google Scholar] [CrossRef] [PubMed]
- Berleman, J.E.; Kirby, J.R. Deciphering the hunting strategy of a bacterial wolfpack. FEMS Microbiol. Rev. 2009, 33, 942–957. [Google Scholar] [CrossRef]
- Pradel, E.; Zhang, Y.; Pujol, N.; Matsuyama, T.; Bargmann, C.I.; Ewbank, J.J. Detection and avoidance of a natural product from the pathogenic bacterium Serratia marcescens by Caenorhabditis elegans. Proc. Natl. Acad. Sci. USA. 2007, 104, 2295–2300. [Google Scholar] [CrossRef] [PubMed]
- Rajalingham, R.; DiCarlo, J.J. Reversible Inactivation of Different Millimeter-Scale Regions of Primate IT Results in Different Patterns of Core object Recognition Deficits. Neuron 2019, 102, 493–505.e5. [Google Scholar] [CrossRef] [PubMed]
- Clark, T. National boundaries, border zones, and marketing strategy: A conceptual framework and theoretical model of secondary boundary effects. J. Marketing 1994, 58, 67–80. [Google Scholar] [CrossRef]
- Coye, D. The Sneakers/Tennis Shoes Boundary. Am. Speech. 1986, 61, 366–369. [Google Scholar] [CrossRef]
- Powers, E.; Cabrera, L.; Cabrera, D. No Word is an Island: Distinguishing “Nerd” and “Geek”. In Cognitive Case Study Series; Cornell University: Ithaca, NY, USA, 2016. [Google Scholar]
- Cabrera, D.; Cabrera, L. Systems Thinking Made Simple: New Hope for Solving Wicked Problems in a Complex World; Odyssean Press: Ithaca, NY, USA, 2015. [Google Scholar]
- Peterson, M.A.; Skow-Grant, E. Memory and Learning in Figure–Ground Perception. Psychology Learn. Motivation. 2003, 42, 1–35. [Google Scholar]
- Abdullah, M.H.; Klypin, A.; Wilson, G. Cosmological Constraints on Ω m and σ 8 from Cluster Abundances Using the GalWCat19 Optical-spectroscopic SDSS Catalog. APJ 2020, 901, 90. [Google Scholar] [CrossRef]
- De Luca Picione, R.; Valsiner, J. Psychological Functions of Semiotic Borders in Sense-Making: Liminality of Narrative Processes. Eur. J. Psychol. Assess. 2017, 13, 532–547. [Google Scholar] [CrossRef]
- Glanville, R. The Self and the Other: The Purpose of Distinction. In Trappl, R. “Cybernetics and Systems’ 90” the Proceedings of the European Meeting on Cybernetics and Systems Research; World Scientific: Singapore, 1999. [Google Scholar]
- Durand, R.; Calori, R. Sameness, Otherness? Enriching Organizational Change Theories With Philosophical Considerations On The Same And The Other. AMRO 2006, 31, 93–114. [Google Scholar] [CrossRef]
- Gillette, J.M. Boundary Lines of Social Phenomena. Am. J. Sociol. 1925, 30, 585–593. [Google Scholar] [CrossRef]
- Tajfel, H.; Wilkes, A.L. Classification and quantitative judgement. Br. J. Psychol. 1963, 54, 101–114. [Google Scholar] [CrossRef] [PubMed]
- Davies, C. Sexual Taboos and Social Boundaries. Am. J. Sociol. 1982, 87, 1032–1063. [Google Scholar] [CrossRef]
- Langer, E.J.; Bashner, R.S.; Chanowitz, B. Decreasing prejudice by increasing discrimination. J. Pers. Soc. Psychol. 1985, 49, 113–120. [Google Scholar] [CrossRef] [PubMed]
- Perdue, C.W.; Dovidio, J.F.; Gurtman, M.B.; Tyler, R.B. Us and them: Social categorization and the process of intergroup bias. J. Pers. Soc. Psychol. 1990, 59, 475–486. [Google Scholar] [CrossRef]
- Leudar, I.; Marsland, V. On membership categorization: ’us’, ’them’ and ’doing violence’ in political discourse. Discourse Soc. 2004, 15, 243–266. [Google Scholar] [CrossRef]
- Young, J. On Insiders (Emic) and Outsiders (Etic): Views of Self, and Othering. Syst. Pract. Action Res. 2005, 18, 151–162. [Google Scholar] [CrossRef]
- Midgley, G.; Pinzón, L.A. Systemic mediation: Moral reasoning and boundaries of concern: Systemic mediation. Syst. Res. Behav. Sci. 2013, 30, 607–632. [Google Scholar] [CrossRef]
- Bentley, S.V.; Greenaway, K.H.; Haslam, S.A. Cognition in context: Social inclusion attenuates the psychological boundary between self and other. J. Exp. Soc. Psychol. 2017, 73, 42–49. [Google Scholar] [CrossRef]
- King, S.L.; Connor, R.C.; Krützen, M.; Allen, S.J. Cooperation-based concept formation in male bottlenose dolphins. Nat. Commun. 2021, 12, 2373. [Google Scholar] [CrossRef]
- Stafstrom, J.A.; Menda, G.; Nitzany, E.I.; Hebets, E.A.; Hoy, R.R. Ogre-Faced, Net-Casting Spiders Use Auditory Cues to Detect Airborne Prey. Curr. Biol. 2020, 30, 5033–5039.e3. [Google Scholar] [CrossRef]
- Rubin, N. Figure and ground in the brain. Nat. Neurosci. 2001, 4, 857–858. [Google Scholar] [CrossRef] [PubMed]
- Baylis, G.C.; Driver, J. Shape-coding in IT cells generalizes over contrast and mirror reversal, but not figure-ground reversal. Nat. Neurosci. 2001, 4, 937–942. [Google Scholar] [CrossRef] [PubMed]
- Bateson, G. Form Substance and Difference. Essent. Read. Biosemiotics 1970, 72, 90–104. [Google Scholar]
- Darwin, C. On the Origin of Species: By Means of Natural Selection, or The Preservation of Favoured Races in the Struggle for Life; John Murray: London, UK, 1859. [Google Scholar]
- Von Bertalanffy, L. The history and status of general systems theory. Acad. Manag. J. 1972, 15, 407–426. [Google Scholar]
- Rittel, H.W.J.; Webber, M.M. Dilemmas in a general theory of planning. Policy Sci. 1973, 4, 155–169. [Google Scholar] [CrossRef]
- Marchal, J.H. On the Concept of a System. Philos. Sci. 1975, 42, 448–468. [Google Scholar] [CrossRef]
- Goguen, J.A.; Varela, F.J. Systems And Distinctions: Duality And Complementarity. Int. J. Gen. Syst. 1979, 5, 31–43. [Google Scholar] [CrossRef]
- Ivan, M.; Kondo, K.; Yang, H.; Kim, W.; Valiando, J.; Ohh, M.; Salic, A.; Asara, J.M.; Lane, W.S.; Kaelin, W.G., Jr. HIFa Targeted for VHL-Mediated Destruction by Proline Hydroxylation: Implications for O Sensing. Science 2001, 292, 464–468. [Google Scholar] [CrossRef]
- Chen, P.; Fan, D.; Zhang, Y.; Selloni, A.; Carter, E.A.; Arnold, C.B.; Dankworth, D.C.; Rucker, S.P.; Chelikowsky, J.R.; Yao, N. Breaking a dative bond with mechanical forces. Nat. Commun. 2021, 12, 5635. [Google Scholar] [CrossRef]
- Wadhams, G.H.; Armitage, J.P. Making sense of it all: Bacterial chemotaxis. Nat. Rev. Mol. Cell Biol. 2004, 5, 1024–1037. [Google Scholar] [CrossRef] [PubMed]
- Janetopoulos, C.; Firtel, R.A. Directional sensing during chemotaxis. FEBS Lett. 2008, 582, 2075–2085. [Google Scholar] [CrossRef] [PubMed]
- Ikeya, N.; Woodward, J.R. Cellular autofluorescence is magnetic field sensitive. Proc. Natl. Acad. Sci. USA 2021, 118, e2018043118. [Google Scholar] [CrossRef] [PubMed]
- Förster, D.; Helmbrecht, T.O.; Mearns, D.S.; Jordan, L.; Mokayes, N.; Baier, H. Retinotectal circuitry of larval zebrafish is adapted to detection and pursuit of prey. Elife 2020, 9, e58596. [Google Scholar] [CrossRef]
- De Corte, B.J.; Navarro, V.M.; Wasserman, E.A. Non-cortical magnitude coding of space and time by pigeons. Curr. Biol. 2017, 27, R1264–R1265. [Google Scholar] [CrossRef]
- Schnell, A.K.; Loconsole, M.; Garcia-Pelegrin, E.; Wilkins, C.; Clayton, N.S. Jays are sensitive to cognitive illusions. R. Soc. Open Sci. 2021, 8, 202358. [Google Scholar] [CrossRef]
- Giannoni-Guzmán, M.A.; Rivera, E.; Aleman-Rios, J.; Melendez Moreno, A.M.; Ramos, M.P.; Pérez-Claudio, E.; Loubriel, D.; Moore, D.; Giray, T.; Agosto-Rivera, J.L. The Role of Colony Temperature in the Entrainment of Circadian Rhythms of Honey Bee Foragers. Ann. Entomol. Soc. Am. 2021, 114, 596–605. [Google Scholar] [CrossRef]
- Mareschal, D.; Quinn, P.C. Categorization in infancy. Trends Cogn. Sci. 2001, 5, 443–450. [Google Scholar] [CrossRef]
- Ashby, F.G.; Ell, S.W.; Waldron, E.M. Procedural learning in perceptual categorization. Mem. Cognit. 2003, 31, 1114–1125. [Google Scholar] [CrossRef]
- Sloutsky, V.M. The role of similarity in the development of categorization. Trends Cogn. Sci. 2003, 7, 246–251. [Google Scholar] [CrossRef]
- Lewis, M.; Balamurugan, A.; Zheng, B.; Lupyan, G. Characterizing Variability in Shared Meaning through Millions of Sketches. In Proceedings of the Annual Meeting of the Cognitive Science Society, Vienna, Austria, 26–29 July 2021; University of California: San Diego, CA, USA, 2021; Volume 43. [Google Scholar]
- Lewandowsky, S.; Roberts, L.; Yang, L.X. Knowledge partitioning in categorization: Boundary conditions. Mem. Cognit. 2006, 34, 1676–1688. [Google Scholar] [CrossRef] [PubMed][Green Version]
- Sperry, R.W. Cerebral Organization and Behavior: The split brain behaves in many respects like two separate brains, providing new research possibilities. Science 1961, 133, 1749–1757. [Google Scholar] [CrossRef] [PubMed]
- Lupyan, G. The conceptual grouping effect: Categories matter (and named categories matter more). Cognition 2008, 108, 566–577. [Google Scholar] [CrossRef] [PubMed]
- Van Dijk, J.; Kerkhofs, R.; van Rooij, I.; Haselager, P. Special Section: Can There Be Such a Thing as Embodied Embedded Cognitive Neuroscience? Theory Psychol. 2008, 18, 297–316. [Google Scholar] [CrossRef]
- Mahon, B.Z.; Caramazza, A. Concepts and categories: A cognitive neuropsychological perspective. Annu. Rev. Psychol. 2009, 60, 27–51. [Google Scholar] [CrossRef] [PubMed]
- Cira, N.J.; Benusiglio, A.; Prakash, M. Vapour-mediated sensing and motility in two-component droplets. Nature 2015, 519, 446–450. [Google Scholar] [CrossRef]
- Tweedy, L.; Thomason, P.A.; Paschke, P.I.; Martin, K.; Machesky, L.M.; Zagnoni, M.; Insall, R.H. Seeing around corners: Cells solve mazes and respond at a distance using attractant breakdown. Science 2020, 369, eaay9792. [Google Scholar] [CrossRef]
- Blackiston, D.; Lederer, E.; Kriegman, S.; Garnier, S.; Bongard, J.; Levin, M. A cellular platform for the development of synthetic living machines. Sci Robot 2021, 6, eabf1571. [Google Scholar] [CrossRef]
- Tarrant, M.; Calitri, R.; Weston, D. Social identification structures the effects of perspective taking. Psychol. Sci. 2012, 23, 973–978. [Google Scholar] [CrossRef]
- Takaoka, A.; Maeda, T.; Hori, Y.; Fujita, K. Do dogs follow behavioral cues from an unreliable human? Anim. Cogn. 2015, 18, 475–483. [Google Scholar] [CrossRef]
- Havy, M.; Waxman, S.R. Naming influences 9-month-olds’ identification of discrete categories along a perceptual continuum. Cognition 2016, 156, 41–51. [Google Scholar] [CrossRef] [PubMed]
- Mischel, W.; Ebbesen, E.B. Attention in delay of gratification. J. Pers. Soc. Psychol. 1970, 16, 329–337. [Google Scholar] [CrossRef]
- Schnell, A.K.; Boeckle, M.; Rivera, M.; Clayton, N.S.; Hanlon, R.T. Cuttlefish exert self-control in a delay of gratification task. Proc. Biol. Sci. 2021, 288, 20203161. [Google Scholar] [CrossRef] [PubMed]
- Boisseau, R.P.; Vogel, D.; Dussutour, A. Habituation in non-neural organisms: Evidence from slime moulds. Proc. Biol. Sci. 2016, 283, 20160446. [Google Scholar] [CrossRef] [PubMed]
- Cabrera, D. Systems Thinking; Cornell University: Ithaca, NY, USA, 2006. [Google Scholar]
- Cabrera, D.; Cabrera, L.; Lobdell, C. Systems Thinking. J. Eval. Program Plan. 2008, 31, 299–310. [Google Scholar] [CrossRef]
- Cabrera, D.; Cabrera, L. DSRP Theory: A Primer. Systems 2022, 10, 26. [Google Scholar] [CrossRef]
- Cabrera, D.; Cabrera, L. Complexity and Systems Thinking Models in Education: Applications for Leaders. In Learning, Design, and Technology: An International Compendium of Theory, Research, Practice, and Policy; Spector, M.J., Lockee, B.B., Childress, M.D., Eds.; Springer International Publishing: Cham, Switzerland, 2019; pp. 1–29. [Google Scholar]
- Cabrera, D.; Cabrera, L. What Is Systems Thinking? In Learning, Design, and Technology: An International Compendium of Theory, Research, Practice, and Policy; Spector, M.J., Lockee, B.B., Childress, M.D., Eds.; Springer International Publishing: Cham, Switzerland, 2019; pp. 1–28. [Google Scholar]
- Cabrera, L.; Cabrera, D. The Simple Rules of Complex Networks: Heuristics for Structural Predictions. In The Routledge Handbook for Systems Thinking; Cabrera, L., Cabrera, D., Midgley, G., Eds.; Routledge Press: London, UK, 2022. [Google Scholar]
- Cabrera, D.; Cabrera, L. Distinctions, Systems, Relationships, and Perspectives (DSRP): A Theory of Thinking and of Things. J. Eval. Program Plan. 2008, 31, 311–317. [Google Scholar] [CrossRef]
- Cabrera, D.; Cabrera, L.; Midgley, G. The Four Waves of Systems Thinking. In The Routledge Handbook for Systems Thinking; Cabrera, D., Cabrera, L., Midgley, G., Eds.; Routledge Press: London, UK, 2022. [Google Scholar]
- Cabrera, D.; Cabrera, L.; Cabrera, E. A Literature Review of the Universal Patterns and Atomic Elements of Complex Cognition. In The Handbook of Systems Thinking; Cabrera, D., Cabrera, L., Midgley, G., Eds.; Routledge: London, UK, 2022. [Google Scholar]
- Cabrera, L.; Sokolow, J.; Cabrera, D. Developing and Validating a Measurement of Systems Thinking: The Systems Thinking and Metacognitive Inventory (STMI). In The Routledge Handbook for Systems Thinking; Cabrera, L., Cabrera, D., Midgley, G., Eds.; Routledge Press: London, UK, 2022. [Google Scholar]
- Cabrera, D.; Cabrera, L.; Cabrera, E. The ’Fish Tank’ Experiments: Metacognitive awareness of DSRP significantly increases cognitive complexity. Systems 2022, 10, 29. [Google Scholar] [CrossRef]
- Cabrera, D.; Cabrera, L.; Cabrera, E. Perspectives Organize Information in Mind and Nature: Empirical Findings of Point-View Perspective (P) in Cognitive and Material Complexity. Systems, 2022; submitted. [Google Scholar]
- Cabrera, D.; Cabrera, L.; Cabrera, E. Relationships Organize Information in Mind and Nature: Empirical Findings of Action-Reaction Relationships (R) in Cognitive and Material Complexity. Systems, 2022; submitted. [Google Scholar]
- Cabrera, D.; Cabrera, L.; Cabrera, E. Systems Organize Information in Mind and Nature: Empirical Findings of Part-Whole Systems (S) in Cognitive and Material Complexity. Systems, 2022; submitted. [Google Scholar]
- Cabrera, D.; Cabrera, L.; Cabrera, E.; Hernandez, O.; Sukhbaatar, U.; Fuqua, K.B.; Collante, A.E.; Lemaiyan, E.; Warugongo, N.; Sekyere, A.; et al. The Origin of Ideas: Empirical Studies in Cognitive Complexity; Odyssean Press: Ithaca, NY, USA, 2021. [Google Scholar]
- Cabrera, D.; Cabrera, L.; Midgley, G. Routledge Handbook of Systems Thinking; Routledge: London, UK, 2021. [Google Scholar]
- Midgley, G.; Munlo, I.; Brown, M. The theory and practice of boundary critique: Developing housing services for older people. J. Oper. Res. Soc. 1998, 49, 467–478. [Google Scholar] [CrossRef]
- Cabrera, D.; Cabrera, L. Thinking at Every Desk: Four Simple Skills to Transform Your Classroom, 2nd ed.; Education Series; Norton Books: New York, NY, USA, 2011. [Google Scholar]
- Cabrera, D. Patterns of Knowledge: Knowledge as a Complex Adaptive System (CAS); Regis University: Denver, CO, USA, 2002. [Google Scholar]
- Cabrera, D. Remedial Genius: Think and Learn Like a Genius with the Five Principles of Knowledge; Project N Press: Loveland, CO, USA, 2000. [Google Scholar]
- Cabrera, D.; Cabrera, L. Thinking at Every Desk: Four Simple Skills to Transform Your Classroom, 1st ed.; Odyssean Press: Ithaca, NY, USA, 2008. [Google Scholar]
- Cabrera, D. Patterns of Knowledge: Knowledge as a Complex, Evolutionary System, an Educational Imperative; Solomon Press: New York, NY, USA, 2002. [Google Scholar]
- Cabrera, D. What is Systems Thinking? Cornell University: Ithaca, NY, USA, 2005. [Google Scholar]
- Available online: https://bridget-edwards.com/namaste-and-sawubona-a-zulu-greeting/ (accessed on 17 March 2022).
- Cabrera, D.; Cabrera, L. Plectica; Software for Visual Systems Mapping; Plectica: New York, NY, USA, 2016. [Google Scholar]
- Cabrera, E.; Cabrera, D.; Cabrera, L. The Efficacy of Systems Mapping. J. Syst. Think. 2021, 11, 21. [Google Scholar]
- Cabrera, E.; Cabrera, D.; Cabrera, L. The ‘Fish Tank’ Experiments: Metacognitive awareness significantly increases cognitive complexity. J. Syst. Think. 2021, 10, 21. [Google Scholar]
- Kruger, J.; Dunning, D. Unskilled and unaware of it: How difficulties in recognizing one’s own incompetence lead to inflated self-assessments. J. Pers. Soc. Psychol. 1999, 77, 1121–1134. [Google Scholar] [CrossRef] [PubMed]
- Lewis, M.L.; Frank, M.C. The length of words reflects their conceptual complexity. Cognition 2016, 153, 182–195. [Google Scholar] [CrossRef] [PubMed]


Publisher’s Note: MDPI stays neutral with regard to jurisdictional claims in published maps and institutional affiliations. |
© 2022 by the authors. Licensee MDPI, Basel, Switzerland. This article is an open access article distributed under the terms and conditions of the Creative Commons Attribution (CC BY) license (https://creativecommons.org/licenses/by/4.0/).