Abstract
Our current study deals with the dye adsorption and electrical property of a partially carbonized composite fiber containing transition metal oxides including, iron oxide, nickel oxide, and titanium oxide. The fiber was made by electrospinning, carbonization, and hydrothermal treatment. During the electrospinning, titanium oxide particles were dispersed in polyacrylonitrile (PAN) polymer-dimethylformamide (DMF) solution. Nickel chloride and iron nitrate were added into the solution to generate nickel oxide and iron oxide in the subsequent heat treatment processes. The polymer fiber was oxidized first at an elevated temperature of 250 °C to stabilize the structure of PAN. Then, we performed higher temperature heat treatment at 500 °C in a furnace with hydrogen gas protection to partially carbonize the polymer fiber. After that, the oxide-containing fiber was coated with activated carbon in a diluted sugar solution via hydrothermal carbonization at 200 °C for 8 h. The pressure reached 1.45 MPa in the reaction chamber. The obtained product was tested in view of the dye, Rhodamine B, adsorption using a Vis-UV spectrometer. Electrical property characterization was performed using an electrochemical work station. It was found that the hydrothermally treated oxide-containing fiber demonstrated obvious dye adsorption behavior. The visible light absorption intensity of the Rhodamine B dye decreased with the increase in the soaking time of the fiber in the dye solution. The impedance of the fiber was increased due to the hydrothermal carbonization treatment. We also found that charge build-up was faster at the surface of the specimen without the hydrothermally treated carbon layer. Electricity generation under visible light excitation is more intensive at the hydrothermally treated fiber than at the one without the hydrothermal treatment. This result is consistent with that obtained from the dye adsorption/decomposition test because the charge generation is more efficient at the surface of the hydrothermally treated fiber, which allows the dye to be decomposed faster by the treated fibers with activated carbon.
1. Introduction
Ocean water pollution is considered a big concern because many toxic spills could enter into the ocean and kill the organisms and their habitats. Organic dyes represent a whole family of ocean pollutants. Plastics are counted as pollutants as well. To help clean the ocean water, researchers have made extensive studies on the use of nanofibers. Nanofibers are flexible and with lightweight. They have found many applications, such as water filtration, bone growth, and cartilage regeneration. A particularly interested application of nanofibers is for absorbing particular inks and dyes.
Deposition of carbonized substances on nanofibers may provide some useful properties such as controlled porosity and high active area. Nanostructured carbon materials can be generated by hydrothermal carbonization. The process is inexpensive, time efficient, and environmentally friendly. The obtained materials can be used for different applications such as separation, energy conversion, and catalysis. Recently, the hydrothermal carbonization approach has been studied for fuel and biofuel generations [1,2,3,4]. Various plants or trees including orange peel [5], pine [6], and bamboo [7] as source materials may be hydrothermally carbonized to generate hydrochar or nanocarbon. There are also reports on waste management using the hydrothermal carbonization approach to dispose urban sludge [8,9], spent wine [10], food waste [11,12,13,14], and agricultural residues [15,16,17,18]. The kinetics of hydrothermal carbonization has been investigated to determine the reaction rate [19,20,21]. The structure of hydrochar is described in [22]. The conditions for carbon fiber formation were discussed in [23]. In addition to the ordinary hydrothermal carbonization [24], the process may be combined with other methods, for example with microwave assisted processing [25].
The dye adsorption capacity of TiO2@C flexible fiber prepared by electrospinning has been recently reported [26]. An array of titanium oxide nanostructures on flexible carbon fiber was generated by the hydrothermal reaction of titanium compounds at 150 °C. The dye adsorption capacity of the processed TiO2@C fiber was shown by degrading the methylene blue (MB) dye. The titanium dioxide nanoparticle array may be growth at the surface of the carbon fiber. It may also be incorporated into the fiber by reaction spinning titanium-containing substances such as titanium chloride [26] and titanium isopropoxide [27]. Mousavi et al. [28] demonstrated dye adsorption by highly porous nanofiber aerogels. The three-dimensional (3D) nanofiber aerogels were made from dispersing short nanofibers in a 1,4-dioxane solvent followed by unidirectional freezing and sublimation of the solvent [29]. The ultralight aerogels with tunable pore structures [30] and 3D nanofiber/nets [31] were faster than the flat nanofiber membranes in dye removal because of they possess the required hierarchical porous structures, allowing them to be suitable for making deep-bed filters.
To create fibers that are adequate for adsorption, they must be composed of active adsorbent components. The motivation of this work is to prepare a dye adsorption flexible fiber mat containing transition metal oxide nanoparticles and an activated carbon surface layer. Characterization of dye adsorption behavior and measuring the electrical property of the fiber have been performed as well. Specifically, iron oxide, activated carbon, and titanium oxide were chosen as the functional components for dye adsorption and decomposition. Titanium oxide is well known as a low-cost and easy to synthesize metal oxide. It is highly active in both the ultraviolet and visible light spectra upon doping with various metallic or nonmetallic elements. Iron oxide is active in the visible light spectrum as well. Herein, nickel chloride was added to adjust the conductivity of the PAN polymer solution for better electrospinning capability. After heat treatment, the nickel salt was converted into oxide within the carbon fiber.
2. Materials, Instrumentation, and Experimental Methods
The polymer used for electrospinning, polyacrylonitrile (PAN) with a molecular weight of 130,000, was purchased from Scientific Polymer Inc., Ontario, NY, USA. The solvent, dimethylformamide (DMF) with analytical purity, was brought from Alfa Aesar, Ward Hill, MA, USA. Titanium oxide nanoparticles with 500 nm nominal size were supplied by Sigma Aldrich, St. Louis, MO, USA. The red color dye, Rhodamine B, iron nitrate, and nickel chloride were obtained from Alfa Aesar, Ward Hill, MA, USA. The 10-mL polypropylene syringe and nickel-coated brass disperse needles with 20-gauge size used for the electrospinning were purchased from McMaster-Carr, Santa Fe Spring, CA, USA. The precision pump with Fusion 200 mode was purchased from Chemyx, Inc., Stafford, TX, USA. A direct current power supply with the highest output voltage of 30 kV was made by Spellman High Voltage Electronics Corporation, Hauppauge, NY, USA.
The fiber product was obtained by electrospinning of polyacrylonitrile (PAN) and titanium dioxide (TiO2) particles. The titanium oxide particle had a nominal diameter of 500 nm. Polyacrylonitrile (PAN; 0.5 g) was added into 5 mL of dimethylformamide (DMF) at ~50 °C. Then, 0.1 g of titanium dioxide (TiO2) was dispersed into the solution; 0.1 g nickel chloride and 0.1 g of iron nitrate were also added into the polymer solution. Electrospinning of polymer/oxide or polymer/inorganic salts was carried out to create different nanofibers. The electrospinning variables were as follows: voltage, 15 kV; tip-to-collector distance, 10 cm; needle gauge for electrospinning, 18; and solution flow rate, 0.01 mL/min. The ambient temperature for electrospinning was 22 °C and the relative humidity was 56%. The airflow was controlled by a ventilation fan and the nanfiber was collected on a cylindrical metal drum with the rotating speed of 60 rpm. A GSL-1100X tube furnace brought from MTI Corp, Richmond, CA, USA, was used for the fiber’s heat treatment.
The nanofibers were heat treated in a tube furnace at 250 °C for 120 min to allow for PAN oxidation. The nanofibers were then placed in another furnace and heated up to 500 °C, and purged with hydrogen gas for the purpose of partial carbonization and oxidation prevention. This occurred for another 120 min. Then, heat treatment was applied and the nanofibers were taken out and allowed to cool. Next, 2 g of sugar were mixed with 20 mL of deionized water and placed into an unstirred high pressure reactor. Some of the heat-treated nanofibers were wrapped by a piece of aluminum foil and then placed in the unstirred high-pressure reactor for the purpose of hydrothermal carbonization. The hydrothermal reactor mode CIT-XHTC400V25 was purchased from Col-Int Tech, Irmo, South Carolina, USA. The reactor was set to 200 °C for 8 h. The pressure in the reaction chamber was maintained at 1.45 MPa. Finally, the reactor was cooled down to room temperature, and the specimen was taken out to dry.
The fiber was attached to a conductive tape and put into a JEOL JSM-6010PLUS/LA scanning electron microscope (SEM) made by JEOL USA, Inc., Peabody, MA, USA. There is an X-ray diffraction attachment to the SEM for energy dispersive spectrum (EDS) analysis. Both area mapping and spot analysis were performed in the EDS experiments. Before SEM examination, some of the fiber specimens (for the EDS spot analysis) were coated with a gold thin film using a compact DC magnetron sputtering coater with VTC-16-D mode, supplied by MTI Corp, Richmond, CA, USA. Due to the gold coating’s high conductivity, the quality of the SEM images’ resolution improved.
The dye adsorption test was performed using a visible and UV light spectrometer (mode: PS-2600) purchased from Pasco Scientific, Roseville, California, USA. The red color dye, Rhodamine B, was dissolved into water to form a 0.1 mM solution for the absorption test. Readings for the color-ink absorption test continued to be taken for several days. The pink dye (2 mL) was placed into a cuvette and placed into a spectrometer to take a baseline absorbance reading. In another cuvette, 2 mL of pink dye along with 0.2 g of the heat-treated fiber specimen were placed in the same spectrometer to acquire the absorbance reading. Reading data were plotted to show the effectiveness of dye adsorption for the fiber specimen. Comparative analysis of the dye’s adsorption property of the hydrothermally treated and untreated specimens was performed.
The electrical property was characterized using a CHI6005E electrochemical work station made by a CH Instrument Inc., Austin, TX, USA. Several techniques were used to measure the electrical property of the nanofiber with and without hydrothermal heat treatment. The AC impedance test was done at a 1 Hz to 100 kHz frequency range. The initial potential imposed was 0 V. A sinusoid AC signal with an amplitude of 0.005 V was applied. For the cyclic voltammetry test, the scan range was 0–1.0 V with a scan rate of 10 mV/s. The potential range for the chronocoulometry test was also 0–1.0 V with 0.25 s pulse time. Photovoltaic behavior of the nanofiber was characterized by measuring the open circuit voltage or potential of the nanofiber when it was exposed to visible light illumination. The voltage vs time data were obtained using the same instrument CHI6005E. The data were plotted to reveal the photosensitivity of the nanofiber.
3. Results and Discussion
3.1. Morphology of the Processed Fiber
In the secondary electron imaging mode, typical images were obtained. One of the images can be seen from Figure 1a. The SEM image shows 2–4 µm fiber size. Occasionally, bonded fibers in the form of bifurcated micro-ribbons can be observed with 6–8 µm width. The titanium oxide, iron oxide, and nickel oxide nanoparticles were found embedded into the fibers in the form of white spots. To verify the existence of these transition metal oxides, element analysis using the energy dispersive X-ray diffraction spectrometry (EDS) was performed. Figure 1b shows the qualitative results of the analysis from area mapping. The atomic percentage of each major element can be found in the first row of Table 1. It can be seen from Figure 1b and Table 1 that C, O, Fe, Ni, and Ti are the main components. Some impurity elements including Na, Cl, and Ca were also detected at very small concentrations.
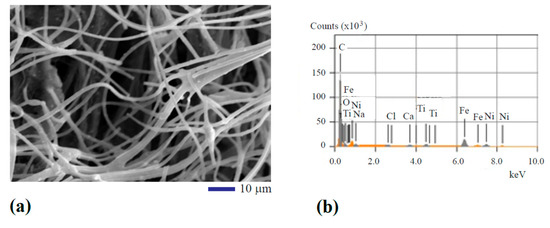
Figure 1.
Scanning electron microscope (SEM) analysis of the structure and composition of the oxide particle-loaded carbon fibers: (a) SEM image and (b) qualitative results of chemical composition analysis.

Table 1.
Atomic percentage of each element from area mapping.
3.2. Effect of Hydrothermal Carbonization
The hydrothermal carbonization-coated fiber showed slightly different morphology. As shown by a low magnification SEM image in Figure 2a, the fibers can be seen in a pretty rough state. At higher magnification (Figure 2b), the deposited activated carbon is shown to cover the surface of the fibers. The results of EDS area mapping analysis, as listed in the second row of Table 1, also reveal that the carbon concentration in the activated carbon-coated fiber was higher than that of the uncoated fibers. During the hydrothermal treatment, the sugar was dehydrated and changed into a new state, the so-called hydrochar around 180 °C. Upon increasing treatment time, the hydrochar was converted into activated carbon. That is why the dominant component is carbon as illustrated by the second row in Table 1. In addition to C, O, Fe, Ni, and Ti are other major components. Some impurity elements including Na, Cl, and Ca were found in the specimen without hydrothermal carbonization treatment.
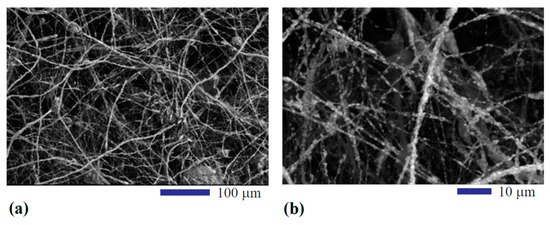
Figure 2.
Morphology of the hydrothermal carbonization-coated fiber: (a) at lower magnification to show a global view and (b) at higher magnification to show activated carbon deposited on the fiber.
Spot analysis of the fiber was performed to show the metal transition oxide particle’s composition. Figure 3a depicts the image showing the locations of spot analysis. Figure 3b–d represents the spectra from the spot analysis. The three spots are highlighted by 001, 002, and 003 as shown in Figure 3a. Spot 001 is featured by an oxide particle within the surface layer. The spot location marked by 002, represents a particle at the surface of the fiber. Location 003 is a junction of different fiber filaments. The spectra taken from the three places showed a similar composition profile. Carbon is the major element. The signals from titanium oxide and nickel oxide are clearly shown. Au signal is from the sputtered coating. As mentioned before in the Experimental Methods Section, the gold thin film was applied at the surface of the fiber specimen to improve the quality of SEM images by increasing the resolution. It is also found that the signal from iron oxide is totally gone. This is because iron oxide serves as the catalyst for activated carbon growth during the hydrothermal carbonization treatment. The activated carbon grows from the iron oxide surface and accumulates on it. Eventually, a continuous carbon layer covers the iron oxide nanoparticles and completely masks the EDS signal from the iron oxide.
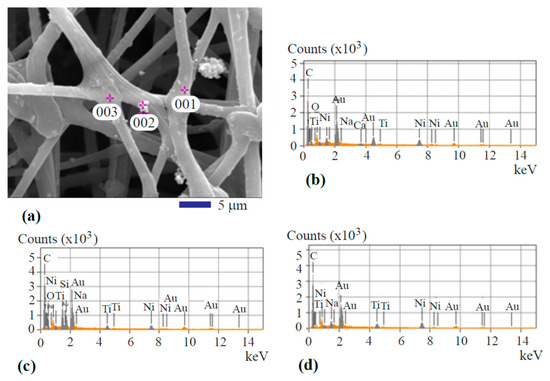
Figure 3.
Spot analysis of the hydrothermal carbonization-coated fiber: (a) SEM image showing the analysis locations; (b) spot 001 spectrum; (c) spot 002 spectrum; and (d) spot 003 spectrum.
3.3. Dye Adsorption Behavior
The experimental work regarding the hydrothermal carbonization of sugar showed that activated carbon can be obtained at 200 °C under 1.45 MPa. The activated carbon-coated fiber showed active dye adsorption behavior as shown in Figure 4. The data taken on day 1, represent light absorption of the Rhodamine B aqueous solution at 0.1 mM. For comparison, the highest absorbance value from this run was designated as 100%. The rest of the data were normalized by this value to allow comparative analysis of the tests performed on different days when the test conditions were identical. The results shown in Figure 4 demonstrate that Rhodamine B absorbs photon energy in the green to blue spectrum range. After obtaining the base-line data, the activated carbon-coated transition metal oxide/carbon fiber was added to the 0.1 mM Rhodamine B solution. On day 4, the fiber was taken out re-collect the light absorption data. The normalized light absorption results are plotted in Figure 4. The data show that the absorption band was narrowed down to the green light range. A similar observation was made on day 16, and the results (normalized absorbance data) are plotted in Figure 4. The absorbance was dropped further due to the increasing reaction time. Comparative analysis of the normalized absorbance results (Figure 4) shows that the Rhodamine B dye was first adsorbed by the activated carbon-coated fiber and then decomposed gradually by the transition oxides (titanium oxide, iron oxide, and nickel oxide) in the fiber under light illumination.
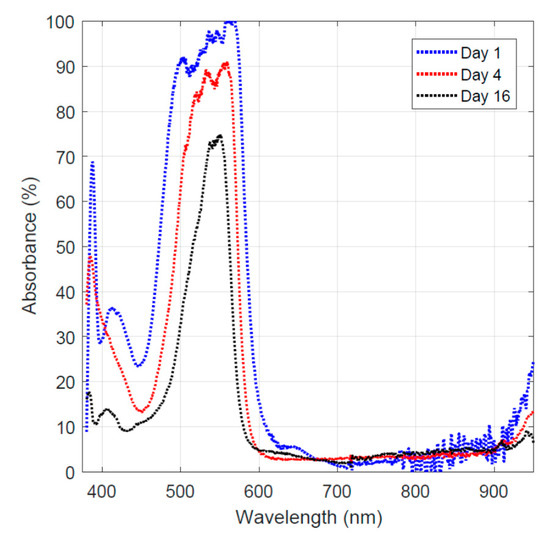
Figure 4.
Light absorption of the remaining dye on different days.
In order to examine the effect of hydrothermal carbonization treatment on the carbon fiber’s dye adsorption behavior, the Rhodamine B adsorption data taken on day 16 for both the activated carbon-coated fiber and the one without hydrothermal carbonization treatment are plotted in Figure 5. It must be noted that the two curves were obtained via normalized absorbance by taking the highest value as 100% for the convenience of comparison.
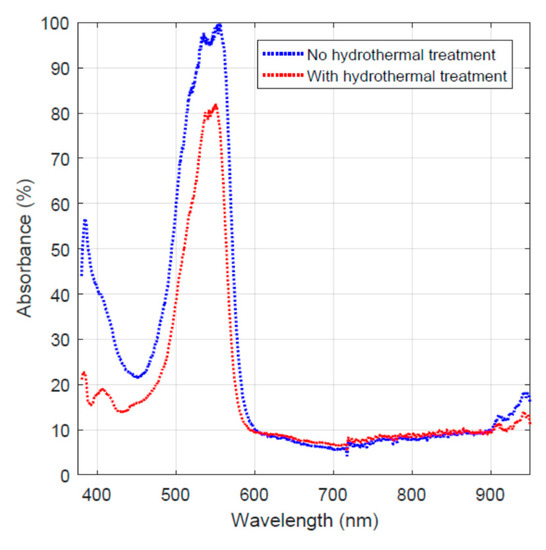
Figure 5.
Light absorption of the remaining dye on day 16 for the two fiber specimens.
The two curves shown in Figure 5 reveal the difference in light absorbance for the two samples. The red curve shows a lower absorbance value due to the lower concentration of the remaining dye in the solution. This indicates that the hydrothermal carbonization-treated specimen has higher dye adsorption and/or decomposition capability.
3.4. Electrical Property
The electrical property of the fiber specimens with and without the hydrothermal carbonization treatment was investigated. The results are presented here in several aspects including impedance, the charging–discharging characteristics, and electricity generation under visible light illumination. First, the AC impedance results are given in Figure 6. Figure 6a shows the plot of impedance for the fiber without the hydrothermal carbonization treatment, while Figure 6b shows the impedance plot of the fiber sample with the hydrothermal carbonization treatment. Comparing the results in the two plots showed that both the real and imaginary parts of the impedance upon hydrothermal carbonization treatment were higher. This can be explained by the hydrochar nature of the newly formed carbon layer Since the newly formed carbon from sugar decomposition is amorphous, its electrical impedance is higher than that of the carbon fiber formed at a higher temperature, 500 °C.
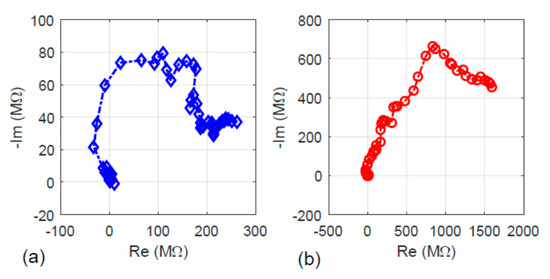
Figure 6.
The real part (Re) versus the imaginary part (Im) of the specimens’ impedance: (a) without hydrothermal carbonization treatment and (b) with hydrothermal carbonization treatment.
It is meaningful to examine the imaginary part (Im) of the impedance versus the frequency (f) for the two specimens to uncover the frequency response behavior. The Im–f relations for the two specimens are shown in Figure 7. Since the imaginary part of the impedance may be expressed as:
where C represents the capacitance of the specimen under AC bias voltage.
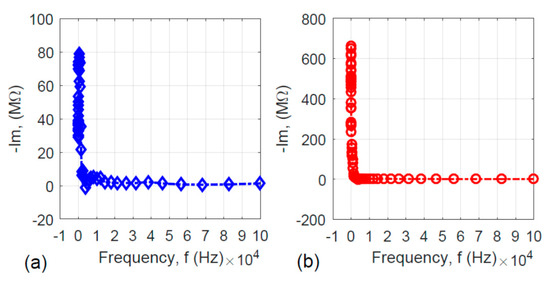
Figure 7.
Frequency responses of the imaginary part (Im) of the specimens’ impedance: (a) without hydrothermal carbonization treatment and (b) with hydrothermal carbonization treatment.
Figure 7a,b shows the L-shaped curves. When the frequency is very low, the absolute value of the impedance’s imaginary part is high. With the increase in frequency, the imaginary part of the impedance approaches zero, which means that both specimens are capacitor-like. This is reasonable because both the activated carbon-coated and uncoated nanofiber specimens have very high surface area.
To validate the capacitance-like behavior, an impulse of 1.0 V peak and 0.25 s width was applied to the specimens. The charge–time data were plotted and shown in Figure 8. During the charging stage (time t < 0.25 s), the fiber sample without hydrothermal carbonization treatment stored more charge. In the discharging stage, with time t > 0.25 s, the hydrothermal carbon-coated specimen releases the charge slightly slower. This behavior could be due to the higher impedance of the activated carbon-coated specimen, because a higher impedance could result in the slower dissipation of charge.
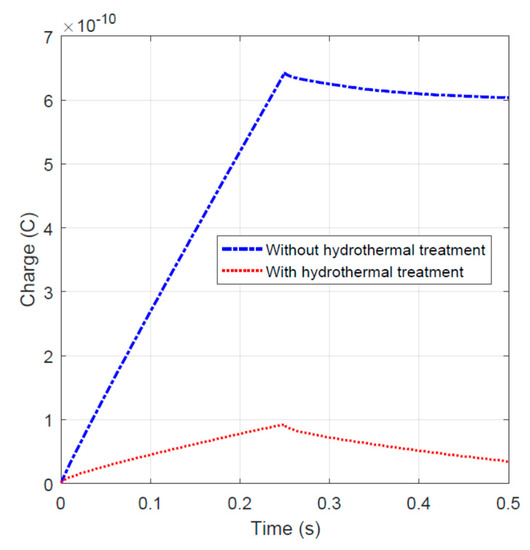
Figure 8.
Charge–time relationship for specimens with and without hydrothermal carbonization treatment.
To compare the fiber specimens’ DC resistance with and without hydrothermal carbonization coating, the linear sweep voltammetry tests were performed on the two fiber materials. The data were used to plot the DC current (I) versus the scanning potential (V) curves as shown in Figure 9. For the specimens without hydrothermal carbonization treatment, a linear behavior which can be described by the Ohm’s law was observed (see the blue data sets as shown in Figure 9). However, the specimen with hydrothermal carbonization treatment illustrated a threshold behavior as usually observed in semiconducting materials.
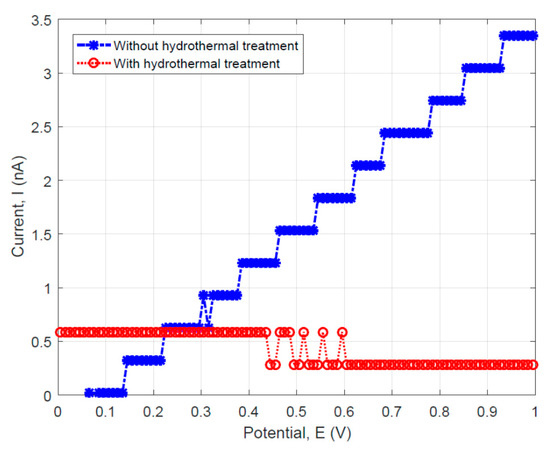
Figure 9.
Linear sweep voltammetry results showing the I–V relationship for the specimens with and without hydrothermal carbonization treatment.
For the fiber without hydrothermal carbon coating, it is possible to calculate the resistance using Ohm’s law. Since the datasets for this specimen can be approximately fit by a straight line, the resistance can be obtained by the reciprocal of the blue-colored curve’s slope (~287.15 MΩ). This value is more than two times higher than that measured using the AC impedance method, which gives the maximum real part of impedance Re = 80 MΩ as determined from the results shown in Figure 6a.
Regarding the electrical property of the fiber, the photovoltaic property of the fiber specimens with and without hydrothermal carbon coating is presented. As shown in Figure 10a, the fiber without an activated carbon layer is sensitive to the visible light. Under light illumination (“ON” cycle as marked in Figure 10), 20 mV was generated. The hydrothermally-coated fiber illustrated stronger photovoltaic properties because the peak associated with the “ON” cycle reached 50 mV. Similarly, in the “OFF” cycle, the hydrothermally-coated specimen showed slower charge dissipation behavior. This is consistent with the results shown in Figure 8, the charge–time trend.
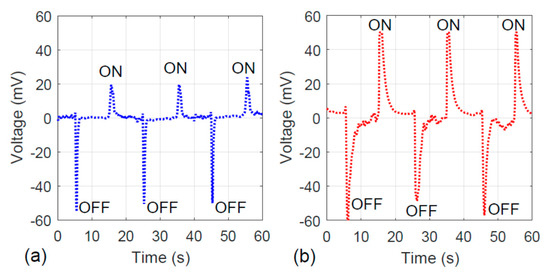
Figure 10.
Photovoltaic responses of the specimens: (a) without hydrothermal carbonization treatment and (b) with hydrothermal carbonization treatment.
The fibers’ photovoltaic property can be correlated to the dye adsorption behavior. A stronger electron generation tendency associated with the visible light illumination indicates that more charge can be built up at the fiber’s surface. Once the negatively charged electrons and the positively charged holes are separated, the holes go to the dye solution, allowing the Rhodamine B to decompose faster. Therefore, the results shown by Figure 4, Figure 5, Figure 6, Figure 7, Figure 8, Figure 9 and Figure 10 are consistent.
4. Conclusions
Hydrothermal treatment causes activated carbon deposition on the fiber’s surface. The deposited material shows a relatively rough microstructure. The treatment conditions include 200 °C, 1.45 MPa, and 8 h. The treated fiber, containing transition oxides and activated carbon deposits, can effectively absorb the red-color dye, the Rhodamine B. The hydrothermally-treated activated carbon fiber can slow down the charge recombination kinetics of transition metal oxides. This makes the activated carbon-coated materials more suitable than uncoated fibers for use in solar energy conversion. The activated carbon- or hydrochar-coated fibers also demonstrate the capability of absorbing organic dyes in other colors. The fiber’s impedance measurement shows that the hydrothermal carbonization treatment increases the fiber’s AC impedance. It is also found that charge build-up and dissipation is faster at the surface of the fiber without hydrothermal carbonization treatment. However, charge dissipation is slower in the fiber with hydrothermal carbon coating. Electricity generation under visible light excitation is more obvious in the hydrothermally-treated fiber compared to the untreated counterpart. This result is consistent with that obtained from the dye adsorption/decomposition test because the charge generation is more efficient on the surface of the hydrothermally-treated fiber, allowing faster decomposition of the dye by the fibers treated with the activated carbon layer.
Author Contributions
Conceptualization, Y.X.G.; data curation, S.K., S.P., and J.B.G.; formal analysis, Y.X.G., S.K., S.P., G.J., and J.B.G.; funding acquisition, Y.X.G.; investigation, S.K., S.P., J.B.G., G.J., and Y.X.G.; methodology, Y.X.G.; project administration, Y.X.G.; resources, Y.X.G.; supervision, Y.X.G.; writing—original draft, S.K., S.P., and Y.X.G.; writing—review and editing, J.B.G.
Funding
This work was supported by the National Science Foundation (NSF) Grant Number CMMI-1333044 and the California State Polytechnic University Pomona 2018-2019 RSCA Program. S.K. and S.P. acknowledge the summer support from the Cypress College STEM2 Program, co-managed by Yanet Garcia and Winny Dong, Directors for the Student Undergraduate Research Experience Program. SEM images were made possible through the NSF MRI Grant Number DMR-1429674.
Acknowledgments
Anan Hamdan is appreciated for his assistance in the SEM experiments.
Conflicts of Interest
There is no conflict of interest regarding the publication of this paper.
References
- Park, K.Y.; Lee, K.; Kim, D. Characterized hydrochar of algal biomass for producing solid fuel through hydrothermal carbonization. Bioresour. Technol. 2018, 258, 119–124. [Google Scholar] [CrossRef] [PubMed]
- Zhang, S.; Su, Y.; Xu, D.; Zhu, S.; Liu, X. Assessment of hydrothermal carbonization and coupling washing with torrefaction of bamboo sawdust for biofuels production. Bioresour. Technol. 2018, 258, 111–118. [Google Scholar] [CrossRef] [PubMed]
- Lee, J.; Lee, K.; Sohn, D.; Kim, Y.M.; Park, K.Y. Hydrothermal carbonization of lipid extracted algae for hydrochar production and feasibility of using hydrochar as a solid fuel. Energy 2018, 153, 913–920. [Google Scholar] [CrossRef]
- Cai, J.; Li, B.; Chen, C.; Wang, J.; Zhang, K. Hydrothermal carbonization of tobacco stalk for fuel application. Bioresour. Technol. 2016, 220, 305–311. [Google Scholar] [CrossRef] [PubMed]
- Xiao, K.; Liu, H.; Li, Y.; Yi, L.; Yao, H. Correlations between hydrochar properties and chemical constitution of orange peel waste during hydrothermal carbonization. Bioresour. Technol. 2018, 265, 432–436. [Google Scholar] [CrossRef] [PubMed]
- Wu, Q.; Yu, S.; Hao, N.; Wells, T.; Ragauskas, A.J. Characterization of products from hydrothermal carbonization of pine. Bioresour. Technol. 2107, 244, 78–83. [Google Scholar] [CrossRef] [PubMed]
- Yao, Z.; Ma, X. Characteristics of co-hydrothermal carbonization on polyvinyl chloride wastes with bamboo. Bioresour. Technol. 2018, 247, 302–309. [Google Scholar] [CrossRef] [PubMed]
- Xu, X.; Jiang, E. Treatment of urban sludge by hydrothermal carbonization. Bioresour. Technol. 2017, 238, 182–187. [Google Scholar] [CrossRef]
- Fakkaew, K.; Koottatep, T.; Polprasert, C. Faecal sludge treatment and utilization by hydrothermal carbonization. J. Environ. Manag. 2018, 216, 421–426. [Google Scholar] [CrossRef]
- Catalkopru, A.K.; Kantarli, I.C.; Yanik, J. Effects of spent liquor recirculation in hydrothermal carbonization. Bioresour. Technol. 2017, 226, 89–93. [Google Scholar] [CrossRef]
- Tradler, S.B.; Mayr, S.; Himmelsbach, M.; Priewasser, R.; Stadler, A.T. Hydrothermal carbonization as an all-inclusive process for food-waste conversion. Bioresour. Technol. Rep. 2018, 2, 77–83. [Google Scholar] [CrossRef]
- Zhou, Y.; Engler, N.; Nelles, M. Symbiotic relationship between hydrothermal carbonization technology and anaerobic digestion for food waste in China. Bioresour. Technol. 2018, 260, 404–412. [Google Scholar] [CrossRef]
- Idowu, I.; Li, L.; Flora, J.R.V.; Pellechia, P.J.; Berge, N.D. Hydrothermal carbonization of food waste for nutrient recovery and reuse. Waste Manag. 2017, 69, 480–491. [Google Scholar] [CrossRef]
- Saqib, U.N.; Baroutian, S.; Sarmah, A.K. Physicochemical, structural and combustion characterization of food waste hydrochar obtained by hydrothermal carbonization. Bioresour. Technol. 2018, 266, 357–363. [Google Scholar] [CrossRef]
- Chen, X.; Ma, X.; Peng, X.; Lin, Y.; Zheng, C. Effects of aqueous phase recirculation in hydrothermal carbonization of sweet potato waste. Bioresour. Technol. 2018, 267, 167–174. [Google Scholar] [CrossRef]
- Cruz, O.F.; Silvestre-Albero, J.; Casco, M.E.; Hotza, D.; Rambo, C.R. Activated nanocarbons produced by microwave-assisted hydrothermal carbonization of Amazonian fruit waste for methane storage. Mater. Chem. Phys. 2018, 216, 42–46. [Google Scholar] [CrossRef]
- Yeoh, K.H.; Shafie, S.A.; Al-attab, K.A.; Zainal, Z.A. Upgrading agricultural wastes using three different carbonization methods: Thermal, hydrothermal and vapothermal. Bioresour. Technol. 2018, 265, 365–371. [Google Scholar] [CrossRef]
- Seyedsadr, S.; Al Afif, R.; Pfeifer, C. Hydrothermal carbonization of agricultural residues: A case study of the farm residues-based biogas plants. Carbon Resour. Convers. 2018, 1, 81–85. [Google Scholar] [CrossRef]
- Gallifuoco, A.; Giacomo, G.D. Novel kinetic studies on biomass hydrothermal carbonization. Bioresour. Technol. 2018, 266, 189–193. [Google Scholar] [CrossRef]
- Wilk, M.; Magdziarz, A. Hydrothermal carbonization, torrefaction and slow pyrolysis of miscanthus giganteus. Energy 2017, 140, 1292–1304. [Google Scholar] [CrossRef]
- Jung, D.; Kruse, A. Evaluation of Arrhenius-type overall kinetic equations for hydrothermal carbonization. J. Anal. Appl. Pyrolysis 2017, 127, 286–291. [Google Scholar] [CrossRef]
- Liu, F.; Yu, R.; Ji, X.; Guo, M. Hydrothermal carbonization of holocellulose into hydrochar: Structural, chemical characteristics, and combustion behavior. Bioresour. Technol. 2018, 263, 508–516. [Google Scholar] [CrossRef]
- Wettayavong, S.; Sangnoi, S.; Kaewtrakulchai, N.; Eiad-Ua, A. Characterization of carbon fibers from Thai horse manure via hydrothermal carbonization. Mater. Today Proc. 2018, 5, 10940–10945. [Google Scholar] [CrossRef]
- Wang, T.; Zhai, Y.; Zhu, Y.; Li, C.; Zeng, G. A review of the hydrothermal carbonization of biomass waste for hydrochar formation: Process conditions, fundamentals, and physicochemical properties. Renew. Sustain. Energy Rev. 2018, 90, 223–247. [Google Scholar] [CrossRef]
- Zhang, J.; An, Y.; Borrion, A.; He, W.; Li, G. Process characteristics for microwave assisted hydrothermal carbonization of cellulose. Bioresour. Technol. 2018, 259, 91–98. [Google Scholar] [CrossRef]
- Xiao, F.; Guo, X.; Li, J.; Sun, H.; Zhang, H.; Wang, W. Electrospinning preparation and dye adsorption capacity of TiO2@Carbon flexible fiber. Ceram. Int. 2019, 45, 1156–1160. [Google Scholar] [CrossRef]
- Yuan, L.; Wei, X.; Martinez, J.P.; Yu, C.; Panahi, N.; Gan, J.B.; Zhang, Y.P.; Gan, Y.X. Reaction spinning titanium dioxide particle-coated carbon fiber for photoelectric energy conversion. Fibers 2019, 7, 49. [Google Scholar] [CrossRef]
- Mousavi, S.; Deuber, F.; Petrozzi, S.; Federer, L.; Aliabadi, M.; Shahraki, F.; Adlhart, C. Efficient dye adsorption by highly porous nanofiber aerogels. Colloids Surf. A 2018, 547, 117–125. [Google Scholar] [CrossRef]
- Deuber, F.; Mousavi, S.; Hofer, M.; Adlhart, C. Tailoring pore structures of ultralight electrospun sponges by solid templating. ChemistrySelect 2016, 1, 5595–5598. [Google Scholar] [CrossRef]
- Deuber, F.; Adlhart, C. From short electrospun nanofibers to ultralight aerogels with tunable pore structure. Chimia 2017, 71, 236–240. [Google Scholar] [CrossRef]
- Wang, X.; Ding, B.; Su, G.; Wang, M.; Yu, J. Electro-spinning/netting: A strategy for the fabrication of three-dimensional polymer nano-fiber/nets. Prog. Mater. Sci. 2013, 58, 1173–1243. [Google Scholar] [CrossRef]


© 2019 by the authors. Licensee MDPI, Basel, Switzerland. This article is an open access article distributed under the terms and conditions of the Creative Commons Attribution (CC BY) license (http://creativecommons.org/licenses/by/4.0/).