Highlights
What are the main findings?
- Uniform digital imaging of the entire fabric specimen surface, in accordance with the assessment conditions for the standard visual assessment method, was achieved using innovative apparatus.
- The total percentage of the fabric specimen surface area covered with pills is the pilling parameter that reduces the influence of variability in individual pill surface area and effectively reflects the visual impact of pilling.
What is the implication of the main finding?
- The images captured by the innovative apparatus closely match human visual perception and the visual assessment of pilling.
- Grading classes based on the total percentage of the fabric specimen surface area covered with pills has enabled objective assessment and grading of previously untested fabric samples without a reference dataset.
Abstract
During use, the surface of textile fabrics is prone to wear, which can cause changes such as pilling. Pilling (entanglement of fibers) is primarily assessed using the standard visual method EN ISO 12945-4:2020, but it can also be quantitatively measured by instrumental methods with image analysis software. Due to non-uniform digital imaging conditions, such as variations in magnification and analyzed surface area, the assessed area is often inconsistent. As a result, the total percentage of the fabric specimen surface area covered with pills is often omitted. To ensure uniform digital imaging, an innovative apparatus was designed and constructed in this research and applied to woven fabrics made from 100% cotton, wool, viscose, polyamide 6.6, polyester, and acrylic fiber. Pilling in the fabric specimens was induced by rubbing with the Martindale pilling tester (EN ISO 12945-2:2020) using two different abradant materials, through predefined pilling rubs ranging from 125 to 30,000. Pilling assessment was conducted using both the visual method and the improved instrumental method, following established grading classes based on the total percentage of the fabric specimen surface area covered with pills. The research results highlight the importance of uniform digital imaging and digital grading, as these demonstrate the high comparability of pilling grades assigned by the standard visual method while providing better distinction between consecutive grades.
1. Introduction
The surface appearance of textile fabrics changes over time due to wear from everyday use [1], with surface changes such as pilling easily noticed by users [2,3,4]. Pilling in textile fabrics refers to the entanglement of protruding fibers into clusters (pills) that are slightly raised above the fabric surface and dense enough to block light and cast a shadow [5]. Pilling formation in textile fabrics is closely related to the fabric’s wear resistance, which is influenced by factors such as fiber type, yarn and fabric structure, and finishing treatments [6]. Among these, fiber characteristics—particularly tensile properties, length, and fineness—are the primary factors affecting wear resistance. Fibers with high elongation, good elastic recovery, and high work of rupture have excellent ability to withstand repeated distortion, resulting in a high degree of wear resistance [7]. However, these properties, especially higher tensile strength and good elasticity, often cause broken fibers to remain anchored in the fabric structure instead of being completely removed, which consequently increases the propensity for pilling.
At the same time, the mode of fiber failure involves the splitting and peeling of fiber surfaces when subjected to wear. This type of failure clearly results from contact forces. In practical applications, these forces include a normal load acting perpendicular to the surface and a frictional force acting tangentially, opposing relative motion. The direct effect of these forces is the development of transverse compressive stress and axial shear stress within the fiber near the surface. The macroscopic consequences of this failure mode in fibers can take various forms, such as wearing away material from the contact surface until tensile failure occurs over a reduced cross-section in a specific manner [8].
Natural cellulose fibers, such as cotton, tend to exhibit moderate pilling in fabrics because their shorter length and lower strength make both pill formation and removal easy [7,9,10]. Staple viscose is a man-made cellulose fiber whose wear resistance and fiber fibrillation strongly depend on cellulose purity (α-cellulose content), degree of polymerization, and degree of crystallinity [11], indicating that the molecular structure and supramolecular arrangement are responsible for its lower mechanical properties [12]. Viscose fibers typically have lower wear resistance than cotton and are prone to fibrillation, which leads to intensive pilling in fabrics and rapid fiber detachment [7]. Natural wool fibers exhibit low pilling due to their surface structure, which consists of scales, and their characteristic crimp, making them resistant to entanglement [13]. Synthetic fibers, such as polyamide and polyester, are highly susceptible to pilling. Their high tensile strength and wear resistance promote stable pill anchorage, causing pills to accumulate over time [14,15]. Acrylic fibers, particularly those with higher modulus, show a lower propensity for pilling than polyamide and polyester fibers. Although they tend to detach more readily from the fabric structure, their lower wear resistance does not support pill anchorage [7,16,17].
The tendency of textile fabrics to pill is typically assessed using the standardized visual method EN ISO 12945-4:2020 [5]. The fabric specimen surface is first subjected to wear under simulated laboratory conditions using one of the standard methods: EN ISO 12945-1:2020 (pilling box tester), EN ISO 12945-2:2020 (Martindale abrasion and pilling tester), or EN ISO 12945-3:2020 (random tumble pilling tester) [18,19,20]. Observers should perform the visual assessment from a defined distance of 30 to 50 cm, evaluating the surface of the fabric specimen at a 90° angle under artificial daylight D65, which illuminates the specimen surface at an angle between 5° and 15° [5]. The assessment process is primarily carried out by observers, who compare the surfaces of specimens with a reference specimen and, if applicable, with photographic rating standards [21,22,23,24]. The result of the assessment is a numerical grade from 5 (no change) to 1 (severe pilling), indicating the intensity of the observed changes [3]. According to Gocławski J. et al., the main shortcomings of the standardized visual method are the subjectivity and experience of the observer, as well as the inconsistency of standard photographs [25]. Therefore, the assessment process in research is often conducted using instrumental methods that are permitted but not strictly defined by the standardized test method [5]. The instrumental method generally involves a digital imaging process, in which a digital image of the fabric specimen’s surface is acquired, a software analysis process that determines quantitative values characteristic of the observed surface change, and a grading process based on these quantitative values [26].
The digital imaging process is carried out by various imaging devices, such as cameras [27,28], scanners [25,29,30], and microscopes [31]. The operating principles of these devices determine the size of the observed area and the position of the specimen during imaging, which usually differ from those of the standard visual method [5] in terms of distance, angle, and light source. Additionally, devices such as scanners and microscopes require the specimen to be placed in a closed housing, isolated from ambient light, because, unlike conventional cameras, they use a laser or electron beam for imaging [27,32]. Apparatus with closed housings has also been used in several studies where regular cameras were used. This demonstrates the applicability of such setups, as they are often equipped with a specimen holder (static or movable), a light source, and a camera holder (static or movable) [25,28,33,34]. In the study by Luo, J. et al. [28], pilling was analyzed on 30 × 30 mm specimens using an apparatus with a closed housing equipped with a high-resolution digital camera (Nikon D7200, Nikon Corporation, Tokyo, Japan), a macro lens (NIKKOR AF-S, Nikon Corporation, Tokyo, Japan), and eight LED light sources. This setup could capture images with a resolution of up to 6000 × 4000 pixels (24.2 megapixels). However, the images used for analysis had a much lower resolution of only 512 × 512 pixels. In the study by Sekulska-Nalewajko, J. et al. [25], the pilling layer above fabric surfaces was analyzed using the Spark OCT-1300 system by Wasatch Photonics Inc., Morrisville, North Carolina, United States in a closed housing configuration, which emits an infrared laser beam centered at 1300 nm and can acquire volumetric images covering up to 0.5 × 0.5 × 0.4 cm with voxel dimensions of 5.1 × 4.8 × 5.4 µm in a 512 × 512 × 640 raster. However, the value of volumetric images and their information about pilling is limited because only a very small area of the specimen surface is analyzed. Therefore, it is clear that using different imaging devices prevents comparison of results obtained from the two methods due to variations in magnification and analyzed surface area [29,30,31].
The software analysis process, in which digital images are analyzed, is performed by computer programs that differ in their operating methods. The most commonly used methods in research are the statistical method [28,29,31], the shallow neural network method [35], and the deep convolutional network method [36,37,38]. In the statistical analysis method, the first step is to analyze an image of the fabric specimen’s surface. For textile fabrics, surface images show both induced surface pills and the characteristic features of the fabrics, which depend on fiber content [3,9,31], structure (such as weave type, orientation, uniformity, or periodic repetition [10,16,21]), color [36], and surface finishes [6,39]. To ensure proper operation of the statistical method and reduce the influence of these characteristic features, various transformations are applied, including Fourier and wavelet transforms [32,35,39]. After these transformations, the remaining information in the assessed image is analyzed and associated with features of induced surface pilling, which are then segmented and processed using morphological methods. The type and complexity of the transformations depend on the surface appearance of the fabric and its characteristic features. Therefore, the type of transformation, its settings, and further image preparation in a new system without previous data are unique to the fabric being analyzed and must be recalibrated for each type of fabric specimen [28,29,33,36,39]. The assessment of fabric surface pilling features is then based on statistical analysis of the obtained numerical values. These features include the number of pills, their size (area), density, and the total area they cover, but not the total percentage of the fabric specimen surface area covered with pills [28,29]. In the shallow neural network method, the initial processing steps are similar to those in the statistical method. However, after image segmentation, the characteristic features used for grading are not defined by the observer but are automatically extracted by the algorithm itself, based on its architecture and training, and then processed. Generally, neural networks consist of an input layer, where features obtained from the segmented image are provided; an output layer, which contains the results; and hidden layers, where learning occurs through mathematical operations performed in each neuron [40]. The number of layers and the number of neurons per layer are determined by the type and complexity of the problem. The accuracy of the shallow neural network method is lower than that of the deep convolutional neural network method [28,41]. This is due to the simple architecture of the shallow neural network, the limited number of learning layers, and the extraction of surface change features on textile fabrics in the input layer by the program instead of by human selection. The deep convolutional neural network method automatically learns pilling features through a series of mathematical operations known as convolutions, enabling significantly more accurate pilling assessment and assignment of the appropriate grade [26,34,35]. Due to the greater number of layers in the learning network and the accompanying algorithms, the capability to recognize induced surface changes increases substantially [30,37]. It is important to note that each of these methods initially requires data input to create a database. Based on the database, the method later develops the ability to recognize resulting surface changes. The program’s recognition capability depends on the size and diversity of its database; however, the actual accuracy of the method depends on many additional factors present during the program’s learning process [24,42].
Based on the literature review, the need to improve the instrumental pilling assessment method and to develop a more uniform digital imaging process was identified, as digital images of the fabric specimen surfaces are the primary source of information. Therefore, in this research, an innovative approach was introduced. To ensure uniform digital imaging that complies with the standard visual assessment method [5], an innovative apparatus was designed, constructed, and applied to single-component, plain weave woven fabrics made from 100% cotton, wool, viscose, polyamide 6.6, polyester, and acrylic fiber. Pilling in the fabric specimens was induced by rubbing with the Martindale pilling tester (EN ISO 12945-2:2020 [19]) using two different abradant materials, through predefined pilling rubs ranging from 125 to 30,000. Pilling assessment was conducted using both the visual method and the improved instrumental method, following established grading classes based on the total percentage of the fabric specimen surface area covered with pills.
2. Materials and Methods
2.1. Materials
This research was conducted on six standard single–component woven fabrics in plain weave, made of 100% cotton (prod. code 1520, batch LB46/2), wool (prod. code 1920, batch W28/8), staple viscose (prod. code 1820, batch VR28/45), polyamide (PA 6.6, prod. code 1620, batch N42/29), polyester (PET, prod. code 1720, batch P37/42), and acrylic (prod. code 1120, batch A17/7) fibers, purchased from the authorized manufacturer of standard materials for textile testing, SDC Enterprises Limited, Holmfirth, UK (Table 1).

Table 1.
Surface appearance of the standard single–component woven fabrics in plain weave (magnification 65×).
The fabrics, also known as adjacent fabrics, are typically used to assess the color fastness of textile fabrics to various influences and have been produced according to the specifications defined in the ISO 105–F1, F2, F3, F4, and F5 standard series [43,44,45,46,47], as confirmed by the attached certificate from the manufacturer. They must not contain chemically damaged fibers, residues of finishing agents, dyes, or fluorescent brightening agents, which reduces the number of factors that could affect the induction of pilling and thus improves the repeatability and reliability of the results. The structural properties of the fabrics—mass per unit area (EN 12127:1997 [48]), thickness (EN ISO 5084:1996 [49]), and number of warp and weft yarns per cm (ISO 7211–2:2024 [50])—were determined under standard atmospheric conditions (EN ISO 139:2005/A1:2011 [51]; 20 ± 2 °C temperature and 65 ± 4% relative humidity), and the results are shown in Table 2.
Table 2.
Structural properties of standard single–component woven fabrics in plain weave.
Table 2 shows that the structures of the six fabrics are not identical, although all are made from ring-spun yarns and woven in plain weave. Analysis of the fabrics’ yarn construction—including the direction of twist in the yarns (ISO 2:1973 [52]), linear density (ISO 7211-5:2020 [53]), and amount of twist in single spun yarns (ISO 17202:2002 [54]) as well as in two-ply yarns (EN ISO 2061:2015 [55])—revealed differences in the warp and weft yarn structures, as presented in Table 3. The cotton and viscose fabrics are constructed from single-spun warp and weft yarns; the wool and acrylic fabrics are constructed from two-ply warp and weft yarns; and the polyamide 6.6 and polyester fabrics are constructed from two-ply warp yarns and single-ply weft yarns. The influence of different yarn properties resulted in differences in fabric structural properties (Table 2) and minor but visible differences in the fabrics’ surface texture and appearance, as shown in the digital microscope images of the fabric specimen surfaces in Table 1.
Table 3.
Designation of yarns according to ISO 1139:2025 [56].
2.2. Induction of Surface Pilling in Tested Fabrics
To induce pilling on the surface of the fabric specimen, the standard method EN ISO 12945-2:2020 [19] was used, performed with the Martindale pilling tester, catalog number 2561E, Mesdan S.p.A., Raffa, Italy (Figure 1), under standard atmospheric conditions according to EN ISO 139:2005/A1:2011 [51]. Pilling was induced by controlled rubbing (Lissajous curve) of a circular fabric specimen with a diameter of 140 ± 5 mm, mounted on a movable test specimen holder over a 90 mm diameter felt underlay (product code 2010, batch WF42, SDC Enterprises Limited, Holmfirth, UK) as specified in EN ISO 12947-1:1998+AC:2006 [57]), against the abradant material. The abradant material (diameter 140 ± 5 mm) was placed on the Martindale tester pilling table and also underlaid with the same felt (diameter 140 ± 5 mm). In this research, two different abradant materials were used. The first was the same as the fabric being tested (A1), and the second was standard wool abradant fabric (A2; product code 1520, batch LB46/2, SDC Enterprises Limited, Holmfirth, UK [57]). Fabric specimens were rubbed under a constant weight of 415 g for predefined numbers of pilling rubs (125, 500, 1000, 2000, 5000, and 7000) according to the method [19], along with six additional numbers of pilling rubs (10,000, 14,000, 18,000, 22,000, 26,000, and 30,000) to provide a better overview of the pilling formation rate and intensity for the tested fabrics. For each predefined number of pilling rubs, one specimen was prepared, resulting in twelve specimens from each fabric to be rubbed with the same fabric as the test sample and twelve specimens to be rubbed with the standard wool fabric.
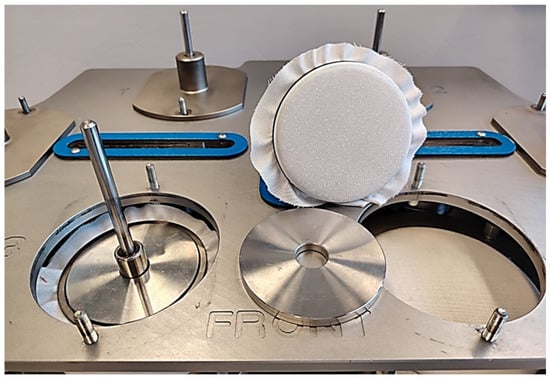
Figure 1.
Induction of surface pilling on viscose fabric specimens by rubbing against standard wool abradant fabric using the Martindale pilling tester 2561 E, Mesdan S.p.A., Raffa, Italy.
2.3. Assessment of Surface Pilling Induced in Tested Fabrics
2.3.1. Visual Assessment Method
The assessment of induced surface pilling by the visual method was performed according to EN ISO 12945-4:2020 [5]. In this method, during assessment, the rubbed specimen is placed in a custom-designed viewing unit (Figure 2a; position 1) located in a darkened room, next to the unrubbed specimen of the same fabric sample (Figure 2a; position 2). The surface of the rubbed specimen is then visually assessed by three observers, who compare it with the surface of the unrubbed specimen from a defined distance under artificial daylight D65 illumination (Figure 2b), assigning a numerical grade from 5 to 1. The numerical grades indicate the intensity of surface pilling, as follows: 5—no change, 4—partially formed pills, 3—moderate pilling (pills of varying size and density partially covering the specimen surface), 2—distinct pilling (pills of varying size and density covering a large part of the specimen surface), and 1—severe pilling (pills of varying size and density covering the entire specimen surface). Half grades, expressed as decimals (e.g., “x.0” or “x.5”), are permitted by the standard method [5] and were assigned when the grades from the three observers fell between two consecutive grades. Therefore, in this research, specimens graded by the visual method could receive one of nine grades: 1.0, 1.5, 2.0, 2.5, 3.0, 3.5, 4.0, 4.5, or 5.0. The final grade for each fabric specimen was calculated as the average of the three grades given by the observers, with inter-observer variability reported as a statistical indicator.
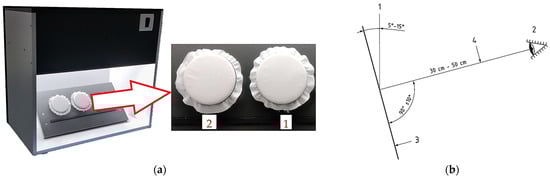
Figure 2.
Standard visual pilling assessment: (a) Custom-designed viewing unit—specimen placement: 1—position for rubbed fabric specimen placement, 2—position for unrubbed fabric specimen placement; (b) Standard assessment conditions: 1—illumination angle, 2—observer, 3—fabric specimen surface, 4—distance from the observer to specimen surface [5].
2.3.2. Instrumental Assessment Method
To improve the instrumental assessment method to match the conditions of visual assessment, this research used specimen surface imaging with a specially designed and constructed innovative apparatus featuring closed housings (Figure 3a). The apparatus provided uniform digital imaging of the entire fabric specimen surface area under the same lighting, distance, and viewing angle conditions as defined in the standard visual assessment method [5], distinguishing this apparatus design from those previously reported [28,32,36].
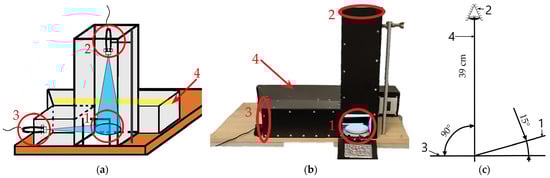
Figure 3.
Instrumental method—imaging process: (a) Designed and (b) Constructed innovative apparatus: 1—position for fabric specimen placement, 2—first camera position and its field of view, 3—second camera position and its field of view, 4—position of the illumination source (light tube) in the apparatus; (c) Instrumental method assessment conditions: 1—illumination angle, 2—observer (first camera position), 3—fabric specimen surface, 4—distance from observer (first camera position) to specimen surface.
The innovative apparatus is equipped with a light source that provides artificial daylight (D65, Figure 3a,b; position 4), a Dino-Lite digital microscope camera (catalog number AM-413ZT, AnMo Electronics Corporation, New Taipei City, Taiwan) for imaging fabric specimen surfaces, two positions for camera placement (Figure 3a,b; positions 2 and 3), and one position for specimen placement (Figure 3a,b; position 1). The first camera placement (Figure 3a,b; position 2) is designed to assess pilling occurrence across the entire fabric specimen surface area (603 cm2) at a 90° viewing angle to the specimen surface, a distance of 39 cm, and a 15° illumination angle to the specimen surface (Figure 3c). This camera placement enables the acquisition of digital images of the fabric specimen surface with an appearance very similar to that seen during standard visual assessment. It captures the pilling parameters under the same conditions perceived by observers, making the grading process of the instrumental method consistent with the standard visual method [5].
The second camera placement (Figure 3a,b; position 3) differs only in the viewing angle of the specimen surface and was not used for imaging surface pilling. Digital images of the specimen surfaces were obtained using a Dino-Lite AM-413ZT digital camera (without additional magnification), connected to a computer running DinoCapture 2.0 software, which was used to capture and save grayscale images at a resolution of 1280 × 1024 pixels. The relationship between pixel values and physical millimeters was established through a scaling procedure using the Dino-Lite calibration sample.
Captured digital images were analyzed using the image analysis software Fiji version 2.17.0 [58], which determined the quantitative numerical parameters of pilling. The analysis isolated and quantified pilling in the images. This process involved two key steps: Fast Fourier Transform and threshold adjustment.
First, the grayscale image of the rubbed specimen (Figure 4a) was processed with a 2D Fast Fourier Transform, converting the image from pixel space to a frequency map (Figure 4b). Low-frequency components corresponding to uneven illumination were suppressed by masking (setting to zero) the central circular region of the frequency map with a radius of 50 pixels, while high-frequency components corresponding to the periodic weave pattern of the fabric were removed by masking all frequencies outside a radius of 240 pixels. Both masks were applied consistently to all fabrics and specimen images, using circular selections centered at the origin of the frequency map. The filtered frequency map was then reconstructed into pixel space using the inverse Fast Fourier Transform.
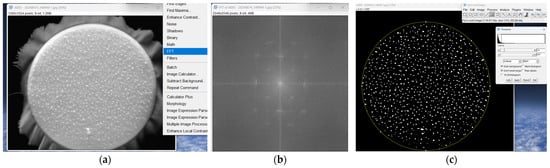
Figure 4.
Instrumental assessment method—image analysis process: (a) Image of polyamide 6.6 fabric specimen rubbed against wool abradant fabric for 26,000 rubs; (b) Fast Fourier Transform—power spectrum; (c) Threshold adjustment of inverse Fast Fourier Transform image.
The reconstructed grayscale image (Figure 4c) was binarized using a threshold tool. A constant intensity threshold of 25 (on the 0–255 scale) was applied to all fabric specimen images. The threshold value of 25 was defined after a sensitivity analysis conducted for each of the six fabric samples, as noticeable variations in fabric surface texture caused by fabric yarn properties (Table 1, Table 2 and Table 3) were observed. The analysis was performed through visual inspection of 18 images of unrubbed specimens (three from each fabric sample) and all 72 images of rubbed specimens (twelve from each of the six fabric samples). It should be noted that the image analysis method in this research was performed on light-colored samples and does not use any previous dataset. Therefore, the Fast Fourier Transform and threshold parameters must be recalibrated for each type of fabric tested, including those with different structures, colors (such as variegated fabrics), and surface finishes [28,29,33,36,39]. The image was then converted to an 8-bit binary image with the “Dark background” option enabled. Pixels with intensity values above the threshold were set to 255 (white, representing pilling regions), while pixels below the threshold were set to 0 (black, representing the fabric background).
As a result, the occurrence of pilling was numerically characterized by the following parameters calculated for the analyzed image area, which corresponds to the rubbed surface of the fabric specimen: the number of individual pills (Ip), the average surface area of individual pills (), the pilling surface density (Sdp, pills cm−2), and the total percentage of the fabric specimen surface area covered with pills (Pta, %) [58]. The analyzed image area for each fabric specimen was 603.0 cm2 (6029.9 mm2). Additionally, the standard deviation of the surface area of individual pills was calculated as another statistical indicator used to discuss the research results.
In this research, the instrumental method for pilling assessment is based on nine grading classes, derived from the highest (5.0) and lowest (1.0) boundary grades assigned to the fabric specimens during visual assessment, along with a quantitative numerical parameter representing the total percentage of the surface area covered with pills. Pta values corresponding to the fabric specimens that received the highest and lowest visual grades were used to establish the boundary limits for these grading classes. The remaining Pta values for the intermediate grading classes (1.5, 2.0, 2.5, 3.0, 3.5, 4.0, and 4.5) were determined by linear interpolation within these boundaries (Equation (1)).
where:
- x—Pta value of the intermediate grade;
- x1—Pta value of the fabric specimen assigned with the lowest grade during the visual assessment method;
- x2—Pta value of the fabric specimen assigned with the highest grade during the visual assessment method;
- yx—intermediate grade;
- y1—lowest grade assigned by the visual assessment method;
- y2—highest grade assigned by the visual assessment method.
2.3.3. Comparability of the Assessment Methods Used
The Pearson correlation coefficient (Pc) and coefficient of determination (Pc2), with a 95% confidence interval, were used to determine how pilling grades assigned by the visual method correlate with grades assigned by the instrumental method.
The Pearson correlation coefficient is a statistical measure that indicates the strength and direction of the linear association between two variables. Its values range from 0 to ± 1, where 0 represents no correlation and ± 1 indicates a very strong correlation. A positive value suggests that the grades given by both assessment methods increase or decrease together, while a negative value suggests that as the grade assigned by one method increases, the grade from the other decreases. The values are categorized as follows: negligible correlation (0.00–0.10), weak correlation (0.10–0.39), moderate correlation (0.40–0.69), strong correlation (0.70–0.89), and very strong correlation (0.90–1.00).
The coefficient of determination is a statistical measure that indicates the proportion of variance in one variable explained by its linear relationship with another variable. Its values range from 0 to 1 and are categorized as low (<0.25), moderate (0.26–0.50), high (0.51–0.75), and very high (0.76–1.00) [59,60,61].
In this research, the Pearson correlation coefficient and the coefficient of determination were calculated using 13 data points (n = 13), each corresponding to a predefined number of pilling rubs (ranging from 125 to 30,000), with p-values below 0.05 considered statistically significant. Additionally, correlation diagrams were constructed to visually assess the relationship and dispersion of the data between the grades assigned by the two methods.
3. Results and Discussion
The results include the pilling grades determined by the visual assessment method, grayscale digital images of the selected fabric specimens’ surfaces captured by an innovative apparatus, quantitative numerical values of pilling parameters obtained with image analysis software, the nine grade classes created for each tested fabric, and the pilling grades assigned by the instrumental assessment method. The comparability of the pilling grades assigned by the two assessment methods was analyzed and discussed based on the determined values of the Pearson correlation coefficient, the coefficient of determination, and the created correlation diagrams.
3.1. Pilling Grades Assigned by Visual Assessment Method
Pilling grades assigned by the visual assessment method for each fabric specimen, rubbed against either the same fabric (A1) or the standard wool abradant fabric (A2) for a predefined number of pilling rubs, along with inter-observer variability values where applicable, are shown in Table 4. Table 5 provides grayscale digital images of the selected fabric specimens’ surface appearance with the corresponding pilling grades assigned by the visual assessment method.
Table 4.
Pilling grades assigned by the visual assessment method for each fabric specimen after a predefined number of pilling rubs, including inter-observer variability values where detected.
Table 5.
Grayscale digital images of the fabric specimen’s surface appearance, captured by innovative apparatus, after 125 and 30,000 pilling rubs, rubbed against the same fabric (A1) and standard wool abradant fabric (A2), with the corresponding pilling grades assigned by the visual assessment method.
The pilling grades assigned by the visual assessment method indicate that the pilling tendency of each fabric is closely related to its wear resistance, which is primarily influenced by the fiber content [6,7] and the type of abradant material used in the pilling induction process [21]. The inter-observer variability of the assigned pilling grades shows a high level of agreement among the three experts, with only minor differences reported. The observed variability did not exceed ±0.5 grade and was mainly found between grades 5.0 and 4.0, and between 2.0 and 1.0. Additional grade variabilities between 4.0 and 3.0 and between 3.0 and 2.0 were reported only for polyester and acrylic fabric specimens rubbed against the same fabric (A1).
The pilling intensity in cotton fabric showed a clear difference in pilling occurrence between specimens rubbed against the two selected abrading materials. When rubbed against the same cotton fabric (A1), the pilling intensity was higher at lower numbers of pilling rubs (after 125 to 7000). It increased rapidly after just 125 pilling rubs (grade 3.0), as shown in Table 4 and Table 5 with the corresponding greyscale image. In contrast, for fabric specimens rubbed with standard wool abradant fabric (A2), the most intense pilling occurred at a medium number of pilling rubs (from 5000 to 18,000). For both fabric specimens rubbed with A1 and A2 abradants, pilling was almost completely eliminated after 30,000 pilling rubs (Table 5), resulting in the highest assigned grades (5.0 and 4.5). This is due to rapid pill fatigue and detachment after prolonged wear [9,10], which can be attributed to cotton’s slight tendency to fibrillate and its lower fiber tensile properties [62].
For viscose fabric specimens, pilling developed after fewer pilling rubs (125 and 500) but with much greater intensity than in cotton fabric specimens, and gradual pilling detachment occurred at higher numbers of pilling rubs (from 10,000 to 30,000). The pilling of viscose fabric specimens rubbed against the same viscose fabric (A1) received a grade of 1.0 after only 125 pilling rubs, as shown in Table 4 and Table 5 with the corresponding greyscale image, while those rubbed against standard wool fabric (A2) reached a grade of 2.0 after 500 pilling rubs (Table 4). This accelerated and intensified pilling is due to the low wear resistance of viscose fibers and their greater tendency toward fibrillation compared with cotton [7,12,63]. The pilling intensity of viscose fabric decreased after a higher number of pilling rubs (from 18,000 to 22,000), as the increased number of pills began to detach from the surface, resulting in pilling grades of 4.5 and 5.0 at the end of the test.
In contrast, wool fabric specimens exhibited pilling only after the initial, lower number of pilling rubs (from 125 to 2000, Table 4 and Table 5), with a continuous increase. The observed pilling intensity on wool fabric was higher when rubbed against the same fabric (A1), reaching a minimum grade of 1.0 after 1000 rubs, compared to rubbing against standard wool abradant fabric (A2), where the minimum grade was 3.0 after the same number of rubs. After 5000 pilling rubs, nearly all formed pills detached from the fabric surface, and no new pills formed, indicating the high resistance of wool fibers to re-entanglement and pill formation after prolonged simulated wear [13].
Induced pilling on polyamide 6.6 fabric was the most severe among all tested fabrics. This resulted from its intense pill formation after fewer pilling rubs and the retention of induced pills even after a higher number of repeated pilling rubs. Intense pilling was already evident after only 125 rubs (Table 4 and Table 5 with the corresponding greyscale image) for specimens rubbed against the same polyamide fabric (A1), reaching a grade of 1.5, and for those rubbed against standard wool abradant fabric (A2), which were assigned a grade of 1.0. Unlike fabrics made from cotton, wool, and viscose, pilling intensity in polyamide 6.6 specimens remained almost unchanged under prolonged wear simulation, indicating a high propensity for surface pilling, mostly due to the fibers’ higher tensile strength and wear resistance [14].
Polyester fabric showed progressive pill formation on the fabric specimen’s surface, similar to polyamide 6.6 fabric [15], but with a steadier and more gradual increase in pill intensity, at lower numbers of pilling rubs (from 125 to 2000). Notably, polyester fabric exhibited a more pronounced occurrence of pilling when rubbed against standard wool abradant fabric (A2, grade 1.0 after 2000 pilling rubs) than when rubbed against the same polyester fabric (A1, grade 1.0 after 7000 pilling rubs), which remained unchanged until the end of the test (Table 4). This confirms that fabrics made from fibers with higher tensile strength and good elasticity, such as polyamide 6.6 and polyester, cause detached fibers to remain anchored on the fabric surface for a longer time [7,14,15], as simulated here by the greater number of pilling rubs.
Acrylic fabric showed the lowest pilling occurrence among the tested fabrics, as indicated by its consistently high pilling grades, which ranged from 5.0 to 3.0. However, more intense pilling occurred when the fabric specimen was rubbed against the same acrylic fabric (A1). This suggests that the relatively lower wear resistance of acrylic fibers, compared to PA 6.6 and PET, caused the specimens rubbed with the standard wool abradant fabric (A2) to have a higher rate of pilling detachment than pilling formation (Table 4) [16].
3.2. Results Obtained Using the Instrumental Assessment Method
3.2.1. Quantitative Numerical Values of Pilling Parameters
To determine the relationship between pilling intensity and its visual impact, the following quantitative values of pilling parameters were obtained by image analysis using the instrumental method: the number of individual pills (Ip), the average surface area of individual pills () with corresponding standard deviation values, the pilling surface density (Sdp), and the total percentage of the fabric specimen surface area covered with pills (Pta). These results are presented in Table 6, Table 7, Table 8 and Table 9.
Table 6.
The number of individual pills (Ip) obtained by image analysis using the instrumental method for fabric specimens after a predefined number of pilling rubs.
Table 7.
Average surface area of individual pills () obtained by the image analysis process of the instrumental method for fabric specimens after a predefined number of pilling rubs, with corresponding standard deviation values.
Table 8.
Pilling surface density (Sdp) for fabric specimens after a predefined number of pilling rubs.
Table 9.
The total percentage of the fabric specimen surface area covered with pills (Pta) for fabric specimens after a predefined number of pilling rubs.
The number of individual pills (Ip, Table 6) and the average surface area of individual pills (, Table 7), along with their corresponding standard deviations, provide valuable quantitative insights into the pilling tendency of fabrics made from different fibers and their ability to retain pills.
Table 6 and Table 7 show that although all tested woven fabrics are made from ring-spun yarns composed of staple fibers, only the unrubbed fabric specimens (0 pilling rubs) without detected pills are polyester fabric. This indicates the high wear resistance and smooth surface of polyester fabrics, with insufficient protruding fibers to form pills.
From the number of individual pills shown in Table 6, it is clear that fabrics made from cotton, wool, and viscose fibers tend to form more new pills at a lower number of pilling rubs (up to 7000). However, after a higher number of pilling rubs, the pills detach more rapidly from the fabric specimen surface, resulting in a decrease in the number of individual pills. The maximum number of pills was detected for specimens rubbed with the same fabric (A1): 524 for cotton and 540 for viscose fabrics at 7000 pilling rubs, while for wool fabric it was 80 pills at 1000 rubs. When these fabric specimens were rubbed against the standard wool abradant fabric (A2), they formed about half as many pills as specimens rubbed against the same fabric (A1) for the same number of pilling rubs, while the average surface area of individual pills and its standard deviation were nearly the same in both cases. The standard deviations of the average surface area of individual pills are approximately 0.11 mm2 for cotton, 0.16 mm2 for wool, and 0.17 mm2 for viscose fabric, indicating relatively large variation in pill surface area compared to their average values: approximately 0.15 mm2 for cotton, 0.29 mm2 for wool, and 0.23 mm2 for viscose.
Polyamide 6.6 and polyester fabrics show a high tendency to pilling, as indicated by the rapid increase in the number of pills generated over twelve predetermined numbers of pilling rubs (from 125 to 30,000 pilling rubs). The maximum number of pills detected for both fabrics occurred after 30,000 pilling rubs. Polyester fabric specimens exhibited approximately 200 more pills (A1, 953; A2, 1084) than polyamide 6.6 fabric specimens (A1, 793; A2, 685). This difference can be attributed to the smaller average surface area of individual pills on polyester fabric (≈ 0.20 mm2), which is about one-third smaller than that on polyamide 6.6 fabric (≈ 0.30 mm2). The average surface area of individual pills also correlated with the pilling grades assigned by the visual assessment method (Table 4) for specimens rubbed against the same fabric (A1) and the standard wool abradant fabric (A2). This is especially evident from the grades assigned to the polyester fabric at lower numbers of pilling rubs (from 125 to 7000 pilling rubs), which are higher for specimens rubbed against the same fabric (A1) than for those rubbed with the standard wool abrasive fabric (A2). The standard deviations of the average surface area of individual pills for both polyamide 6.6 (approximately 0.16 mm2) and polyester fabrics (approximately 0.13 mm2) specimens rubbed against A1 and A2 fabrics are similar. However, significant differences in visual pilling grades (Table 4) were observed between polyester fabric specimens rubbed with A1 and A2 at lower numbers of pilling rubs (from 125 to 2000), indicating that the number of larger pills strongly influences observers’ visual perception of pilling intensity [25,36,64,65]. These data do not explicitly demonstrate this relationship and require further analysis for a clear and reliable conclusion.
The number and average surface area of individual pills on acrylic fabric confirm the findings from the visual assessment method (Table 4): pilling was more pronounced on specimens rubbed against the same acrylic fabric (A1). This is supported by the higher number of individual pills on specimens rubbed against the same fabric (A1; a maximum of 560 pills at 7000 pilling rubs) compared to those rubbed against the standard wool abradant fabrics (A2; a maximum of 337 pills at 125 pilling rubs), and by the small average surface area of individual pills, which was approximately 0.11 mm2 for both specimens rubbed against A1 and A2 fabrics (Table 6 and Table 7). The standard deviations of the average surface area of individual pills for acrylic fabric specimens rubbed against A1 and A2 fabrics are also the same (approximately 0.11 mm2). This indicates that the pilling formation process on acrylic fabric was similar regardless of the abradant fabric used, and that the processes differed only in the pill detachment rate.
The pilling surface density (Sdp, pills cm−2) shown in Table 8 represents the average number of individual pills per square centimeter of the treated fabric surface, which measures 603.0 cm2 (6029.9 mm2). This value is directly related to the number of individual pills (Table 6) and does not include information about the individual pills’ average surface area or their deviations, both of which strongly influence the observer’s perception of pilling intensity [25,36]. Therefore, it alone does not provide sufficient information for objective grading.
The total percentage of the fabric specimen surface area covered with pills (Pta) represents the proportion of the fabric specimen’s surface covered by pilling, expressed as a percentage. This parameter accounts for both the number of individual pills and the surface area of each pill, providing a comprehensive measure that reduces the influence of variability in individual pill surface area and effectively reflects the visual impact of pilling [25,28,64]. Considering that relying only on the relationship between the number of individual pills and the average surface area of individual pills would result in significant error, as observers perceive the intensity of pilling through the shadows formed under standard illumination conditions [5]. Larger pills or a high number of smaller pills can create more pronounced shadows, making the appearance of pilling more noticeable [36,65]. Therefore, this numerical value is considered the most appropriate for forming the nine grading classes, which serve as the basis for the pilling grading in the instrumental assessment method. The total percentage of surface area covered by pilling, as shown in Table 9, indicates that the fabric specimens are not evenly covered with pills, even among those assigned the same grade. For example, specimens first assigned the lowest grade of 1.0 include cotton fabric rubbed with the same fabric (A1), which has 1.409%, and with the standard wool abradant fabric (A2), which has 0.648%. Wool fabric rubbed with A1 fabric has 0.433%. Viscose rubbed with A1 fabric has 1.662%, and with A2 fabric has 1.624%. Polyamide 6.6 rubbed with A1 fabric has 1.518%, and with A2 fabric has 0.877%. Polyester rubbed with A1 fabric has 2.137%, and with A2 fabric has 1.458%. The main reason for this is the fabric’s fiber content [6,7] and its wear resistance [22], which influence the fabric’s tendency to form pills, as well as their intensity (number and size). Therefore, fabric rubbed with A1 fabric generally exhibits higher Pta values, as it forms a greater number of individual pills compared to specimens rubbed with A2 fabric. This confirms that wool fibers from the standard wool abradant fabric (A2) have high resistance to entanglement and pill formation [13,22], and cause more severe pilling detachment. The only exception is seen in viscose fabric, which exhibits nearly the same values between specimens rubbed with A1 and A2 abradant fabrics, but after a significantly different number of pilling rubs (125 for A1; 5000 for A2).
3.2.2. Pilling Grades Assigned by Instrumental Assessment Method and Correlation Coefficient
The nine grading classes, created by linear interpolation (Equation (1)) of the total percentage of fabric specimen surface area covered with pills (Pta) values, are shown in Table 10. The grades assigned according to the defined grading classes are presented in Table 11, and their correlation with the grades assigned by the visual assessment method is shown in Figure 5, Figure 6 and Figure 7.
Table 10.
Nine grading classes created by linear interpolation of the total percentage of fabric specimen surface area covered with pills (Pta).
Table 11.
Pilling grades assigned by the instrumental assessment method for fabric specimens after a predefined number of pilling rubs.
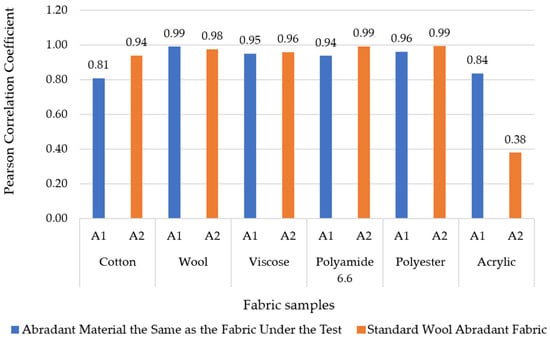
Figure 5.
The values of the Pearson correlation coefficient between the pilling grades assigned by the visual assessment method and the instrumental assessment method for the fabric specimens rubbed with the same fabric (A1) and the standard wool abradant fabric (A2).
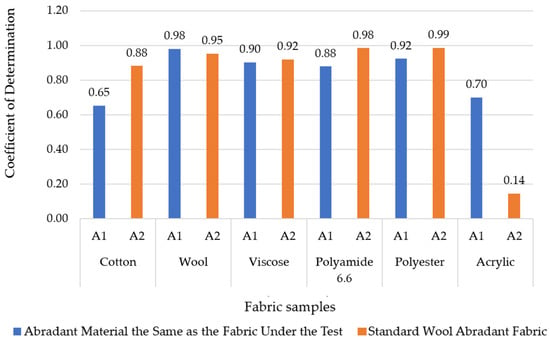
Figure 6.
The values of the coefficient of determination between the pilling grades assigned by the visual assessment method and the instrumental assessment method for the fabric specimens rubbed with the same fabric (A1) and the standard wool abradant fabric (A2).
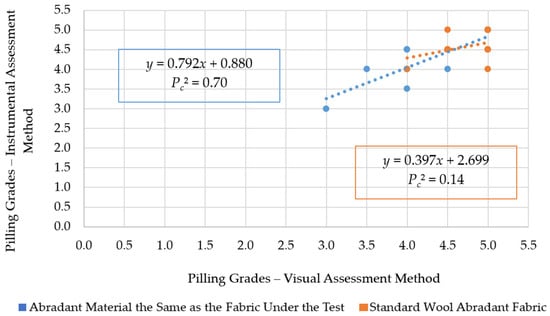
Figure 7.
Correlation diagram of the pilling grades assigned by the visual assessment method and the instrumental assessment method for acrylic fabric specimens rubbed with the same fabric (A1) and the standard wool abradant fabric (A2), with corresponding trendlines (dotted lines).
Table 10 shows that the grading classes are formed as intervals of equal length. However, the interval lengths vary among the six tested fabrics and between specimens of the same fabric rubbed with the two abradant materials. For cotton fabric, the interval length is 0.174 for specimens rubbed with the same fabric (A1) and 0.079 for those rubbed with standard wool abradant fabric (A2). For wool fabric, the interval is 0.053 for specimens rubbed with A1 and 0.060 for those rubbed with A2. For viscose, the values are 0.204 for specimens rubbed with A1 and 0.200 for those rubbed with A2. Polyamide 6.6 has an interval of 0.187 for specimens rubbed with A1 and 0.107 for those rubbed with A2, while polyester shows 0.256 for specimens rubbed with A1 and 0.182 for those rubbed with A2. The acrylic fabric has the highest interval, 0.274 for specimens rubbed with A1 and 0.102 for those rubbed with A2. The boundary grading class intervals, 5.0 and 1.0, are intentionally defined as open-ended intervals to include values beyond their nominal boundaries. This prevents classification errors during the automated pilling grading process, as it was observed that the Pta-measured parameter values can fall outside the defined intervals.
The pilling grades assigned using the formed grading classes, which depend on the visual perceptibility of the observers [25,29], are complementary but differ slightly from those assigned by observers using the visual assessment method (see Table 4). For all fabrics, the variation in pilling grades obtained by the instrumental method did not exceed ±0.5. Such minor discrepancies occurred for intermediate grades (such as 1.5, 2.5, 3.5, 4.5) because these grades are assigned when the grades from the three observers fall between two consecutive grades and are easily confused by observers. To better understand how pilling grades assigned by the visual assessment method correlate with those from the instrumental method, Pearson correlation coefficients (Figure 5) and coefficients of determination (Figure 6), each with 95% confidence intervals, were calculated. These statistics were based on 13 data points (n = 13), each corresponding to a predefined number of pilling rubs (from 125 to 30,000), with p-values below 0.05 considered statistically significant.
The Pearson correlation coefficient values (Figure 5) indicate a strong (0.70–0.89) to very strong (0.90–1.00) correlation between the pilling grades assigned by the two assessment methods for cotton, wool, viscose, polyamide 6.6, and polyester fabric specimens rubbed against the same fabric (A1) and the standard wool abradant fabric (A2), as well as for acrylic fabric specimens rubbed with the A1 abradant. This is further supported by the high (0.51–0.75) to very high (0.76–1.00) coefficients of determination (Figure 6).
Only a weak Pearson correlation coefficient (Pc = 0.38) and coefficient of determination (Pc2 = 0.14) are observed between the pilling grades assigned to acrylic fabric specimens rubbed against A2 standard wool abradant fabric. The main reason for this weak correlation is evident from the correlation diagram in Figure 7. Examining the relationship and dispersion of the 13 data points (pilling grades assigned by the two methods) shows that acrylic fabric specimens rubbed against A2 exhibit a very low pilling tendency, resulting in limited grade dispersion (mostly 5.0 and 4.5). This narrow range of grades naturally leads to the observed low correlation between the two assessment methods. In contrast, even a small increase in grade range (from 5.0 to 3.0), as observed for acrylic fabric specimens rubbed against A1, results in high coefficients of determination.
These findings highlight the advantages of the instrumental assessment method and its applicability for pilling assessment across various fabric types, as it provides greater objectivity, reduced variability between intermediate grades, a reliable and repeatable grading process, and strong alignment with human visual perception and the visual assessment method.
4. Conclusions
The aim of this research was to improve the standard pilling assessment method, EN ISO 12945-4:2020, specifically the instrumental assessment method, which is permitted but not strictly defined by the standard. Improvement was achieved by designing and constructing an innovative apparatus that enabled uniform digital imaging of the entire surface of the fabric specimen, in accordance with the assessment conditions for the visual assessment method described in detail in the standard. The applicability of the apparatus and the comparability of the digital images were confirmed by conducting the pilling induction process using the standard Martindale method (EN ISO 12945-2:2020) with two different abradant materials on six standard single-component plain weave woven fabrics with distinct structural properties, made of 100% cotton, wool, viscose, polyamide 6.6, polyester, and acrylic fibers, for an extended number of pilling rubs (from 125 to 30,000).
The selection of single-component plain-woven fabrics was intended not only to enable rigorous experimental control but also to provide fundamental insight into the pilling behavior of fabrics made from individual fiber types. This approach, combined with a higher number of pilling rubs (ranging from 125 to 30,000), allowed for the selection of an appropriate pilling parameter on which the grading of the instrumental assessment method was based. The results of this pilling induction process showed differences in pilling occurrence not only between the six tested fabrics but also between specimens of the same fabric rubbed with different abradant fabrics (the same fabric, A1; standard wool abradant fabric, A2). This was first detected by the visual assessment method and later confirmed by the quantitative values of pilling parameters (the number of individual pills, the average surface area of an individual pill, the pilling surface density, and the total percentage of the surface area covered with pills), as determined by the image analysis process. The parameter used to create nine grading classes (1.0, 1.5, 2.0, 2.5, 3.0, 3.5, 4.0, 4.5, and 5.0), which formed the basis for the pilling instrumental assessment method for each of the six tested fabrics—both for specimens rubbed with the same fabric (A1) and with the standard wool abradant fabric (A2)—is the total percentage of the fabric specimen surface area covered with pills. This parameter incorporates both the number of individual pills and the surface area of each pill, the two factors that most strongly influence observers’ visual perception of pilling. The applicability of this parameter was confirmed by the very strong Pearson correlation coefficients and very high coefficients of determination between the pilling grades assigned by the visual assessment method and the instrumental assessment method.
The findings of this research show that the designed apparatus enables uniform digital imaging of the entire surface area of fabric specimens under standard visual assessment conditions. Additionally, using grading classes based on the total percentage of the fabric specimen surface area covered with pills has demonstrated potential for practical implementation, as it enabled objective assessment and grading of previously untested fabric samples without a reference dataset. Therefore, a basis is established for further investigation of pilling behavior on fabric samples with varying texture, color, and surface finish, as well as for assessing fabrics exhibiting different types of surface changes, such as fuzzing.
Author Contributions
Conceptualization, J.Ž., A.T. and I.Z.; methodology, J.Ž., A.T. and I.Z.; software, J.Ž. and I.Z.; validation, J.Ž., A.T. and I.Z.; formal analysis, J.Ž.; investigation, J.Ž.; resources, A.T.; data curation, J.Ž.; writing—original draft preparation, J.Ž. and A.T.; writing—review and editing, A.T. and I.Z.; visualization, A.T. and I.Z.; supervision, A.T. and I.Z.; project administration, A.T.; funding acquisition, A.T. All authors have read and agreed to the published version of the manuscript.
Funding
This research was funded by the Croatian Science Foundation under project IP-2016-06-5278, “Comfort and Antimicrobial Properties of Textiles and Footwear,” and by the University of Zagreb under research grant TP 13/25.
Data Availability Statement
Data available in a publicly accessible repository.
Acknowledgments
The authors would like to thank the University of Zagreb Faculty of Textile Technology for supporting the construction of the innovative apparatus.
Conflicts of Interest
The authors declare no conflicts of interest.
Abbreviations
The following abbreviations are used in this manuscript:
| A1 | Abradant material—the same as the fabric under the test |
| A2 | Abradant material—standard wool abradant fabric |
| 2D | Two dimensional |
| Ip | The number of individual pills |
| The average surface area of an individual pill, mm2 | |
| Sdp | The pilling surface density, pills, cm−2 |
| Pta | The total percentage of the fabric specimen surface area covered with pills, % |
| x | Pta value of the intermediate grade |
| x1 | Pta value of the specimen assigned with the lowest grade during the visual assessment method |
| x2 | Pta value of the specimen assigned with the highest grade during the visual assessment method |
| yx | Intermediate grade |
| y1 | The lowest grade assigned by the visual assessment method |
| y2 | The highest grade assigned by the visual assessment method |
| Pc | The Pearson correlation coefficient |
| Pc2 | Coefficients of determination |
| n | Data points |
| p | Significance (p < 0.05) |
References
- Talman, R. Designing for Multiple Expressions: Questioning Permanence as a Sign of Quality in Textiles. J. Text. Des. Res. Pract. 2018, 6, 201–221. [Google Scholar] [CrossRef]
- Wu, J.; Liu, Q.; Xiao, Z.; Zhang, F.; Geng, L. Objective rating method for fabric pilling based on LSNet network. J. Text. Inst. 2024, 115, 535–543. [Google Scholar] [CrossRef]
- El–Aziz, M.Y.A.; Mohamed, A.A.; Mustafa, E. Effect of abrasion level on surface handling and thermal conductivity of blended suit fabrics. J. Text. Inst. 2024, 116, 1161–1168. [Google Scholar] [CrossRef]
- Wortmann, M.; Frese, N.; Hes, L.; Gölzhäuser, A.; Moritzer, E.; Ehrmann, A. Improved abrasion resistance of textile fabrics due to polymer coatings. J. Ind. Text. 2019, 49, 572–583. [Google Scholar] [CrossRef]
- EN ISO 12945–4:2020; Textiles—Determination of Fabric Propensity to Surface Pilling, Fuzzing or Matting—Part 4: Assessment of Pilling, Fuzzing or Matting by Visual Analysis. ISO: Geneva, Switzerland, 2020.
- Kumpikaitė, E.; Tautkutė-Stankuvienė, I.; Simanavičius, L.; Petraitienė, S. The influence of finishing on the pilling resistance of linen/silk woven fabrics. Materials 2021, 14, 6787. [Google Scholar] [CrossRef]
- Özdil, N.; Özçelik Kayseri, G.; Süpüren Mengüç, G. Analysis of Abrasion Characteristics in Textiles. In Abrasion Resistance of Materials; Adamiak, M., Ed.; InTech: Rijeka, Croatia, 2012; pp. 119–146. [Google Scholar]
- Morton, W.E.; Hearle, J.W.S. Flex Fatigue and Other Forms of Failure. In Physical Properties of Textile Fibres, 3rd ed.; The Textile Institute: Manchester, UK, 1997; pp. 678–706. [Google Scholar]
- Hossain, M.S.; Islam, M.M.; Dey, S.C.; Hasan, N. An approach to improve the pilling resistance properties of three thread polyester cotton blended fleece fabric. Heliyon 2021, 7, e06921. [Google Scholar] [CrossRef]
- Hoque, M.S.; Hossain, M.J.; Rahman, M.M.; Rashid, M.M. Fiber types and fabric structures influence on weft knitted fabrics. Heliyon 2022, 8, e09605. [Google Scholar] [CrossRef]
- Plakantonaki, S.; Zacharopoulos, N.; Christopoulos, M.; Kiskira, K.; Markou, G. Upcycling industrial peach waste to produce dissolving pulp. Environ. Sci. Pollut. Res. 2025, 32, 4636–4655. [Google Scholar] [CrossRef]
- Tomljenović, A.; Živičnjak, J.; Skenderi, Z. Quality Assessment of Socks Produced from Viscose and Lyocell Fibers. Materials 2024, 17, 1559. [Google Scholar] [CrossRef]
- Wan, A.; Yu, W. Effect of wool fiber modified by ecologically acceptable ozone–assisted treatment on the pilling of knit fabrics. Text. Res. J. 2012, 82, 1603–1613. [Google Scholar] [CrossRef]
- Korzeniewska, E.; Gocławski, J.; Sekulska–Nalewajko, J.; Walczak, M.; Wilbik–Hałgas, B. Changes in Fabric Surface Pilling under Laser Ablation. Sensors 2020, 20, 5832. [Google Scholar] [CrossRef]
- Elias, K.; Rahman, M.; Hossain, H. Studying the Effect of Polyester Fiber Blend Ratio and Pilling Cycle on Blended Knit Fabrics. J. Text. Sci. Technol. 2023, 9, 227–243. [Google Scholar] [CrossRef]
- Rejali, M.; Hasani, H.; Ajeli, S.; Shanbeh, M. Optimization and prediction of the pilling performance of weft knitted fabrics produced from wool/acrylic blended yarns. Indian J. Fibre Text. Res. 2014, 39, 83–88. [Google Scholar]
- Hajilari, M.; Esfandiari, A.H.; Dabiryan, H.; Mosavi Pour Gharbi, S.H. Investigation of effect of fibres modulus on pilling of acrylic fabrics. J. Text. Inst. 2009, 100, 135–140. [Google Scholar] [CrossRef]
- EN ISO 12945–1:2020; Textiles—Determination of Fabric Propensity to Surface Pilling, Fuzzing or Matting—Part 1: Pilling Box Method. ISO: Geneva, Switzerland, 2020.
- EN ISO 12945–2:2020; Textiles—Determination of Fabric Propensity to Surface Pilling, Fuzzing or Matting—Part 2: Modified Martindale Method. ISO: Geneva, Switzerland, 2020.
- EN ISO 12945–3:2020; Textiles—Determination of Fabric Propensity to Surface Pilling, Fuzzing or Matting—Part 3: Random Tumble Pilling Method. ISO: Geneva, Switzerland, 2020.
- Asayesh, A.; Kolahi Mahmoodi, F. The effect of fabric structure on the pilling and abrasion resistance of interlock weft–knitted fabrics. Int. J. Cloth. Sci. Tech. 2024, 36, 287–303. [Google Scholar] [CrossRef]
- Zhu, L.; Ding, X.; Wu, X. A novel method for improving the anti–pilling property of knitted wool fabric with engineered water nanostructures. J. Mater. Res. Technol. 2020, 9, 3649–3658. [Google Scholar] [CrossRef]
- Asanovic, K.A.; Ivanovska, A.M.; Jankoska, M.Z.; Bukhonka, N.; Mihailovic, T.V.; Kostic, M.M. Influence of pilling on the quality of flax single jersey knitted fabrics. J. Eng. Fibers Fabr. 2022, 17, 1–13. [Google Scholar] [CrossRef]
- Shih, C.H.; Lin, C.J.; Lee, C.L. Integrated Image Sensor and Deep Learning Network for Fabric Pilling Classification. Sens. Mater. 2022, 34, 93–104. [Google Scholar] [CrossRef]
- Gocławski, J.; Sekulska–Nalewajko, J.; Korzeniewska, E. Prediction of textile pilling resistance using optical coherence tomography. Sci. Rep. 2022, 12, 18341. [Google Scholar] [CrossRef]
- Wu, J.; Wang, L.; Xiao, Z.; Geng, L.; Zhang, F.; Liu, Y. Wool knitted fabric pilling objective evaluation based on double–branch convolutional neural network. J. Text. Inst. 2021, 112, 1037–1045. [Google Scholar] [CrossRef]
- Li, F.; Li, F. Bag of tricks for fabric defect detection based on Cascade R–CNN. Text. Res. J. 2021, 91, 599–612. [Google Scholar] [CrossRef]
- Luo, J.; Xin, B.; Yuan, X. A novel objective fabric pilling evaluation method based on the photometric stereo algorithm. Text. Res. J. 2023, 93, 2943–2955. [Google Scholar] [CrossRef]
- Mendes, A.O.; Fiadeiro, P.T.; Miguel, R.A.L.; Lucas, J.M.; Silva, M.J.S. Optical 3D–system for fabric pilling assessment: A complementary tool to avoid evaluation errors. J. Text. Inst. 2020, 112, 921–927. [Google Scholar] [CrossRef]
- Sabuncu, M.; Ozdemir, H. Optical coherence tomography image dataset of textile fabrics. Data Brief 2022, 45, 108719. [Google Scholar] [CrossRef] [PubMed]
- Wang, R.; Xiao, Q. Study on pilling performance of polyester–cotton blended woven fabrics. J. Eng. Fibers Fabr. 2020, 15, 1558925020966665. [Google Scholar] [CrossRef]
- Telli, A. The Relationship Between Subjective Pilling Evaluation Results and Detecting Pills and Textural Features in Knitted Fabrics. Fiber. Polym. 2020, 21, 1841–1848. [Google Scholar] [CrossRef]
- Eldessouki, M.; Bukhari, H.A.; Hassan, M.; Qashqari, K. Integrated Computer Vision and Soft Computing System for Classifying the Pilling Resistance of Knitted Fabrics. Fibres Text. East. Eur. 2014, 22, 106–112. [Google Scholar]
- Xiang, J.; Pan, R.; Gao, W. Online Detection of Fabric Defects Based on Improved CenterNet with Deformable Convolution. Sensors 2022, 22, 4718. [Google Scholar] [CrossRef]
- Guan, S.; Liu, D.; Hu, L.; Lei, M.; Shi, H. Evaluation method of fabric pilling grades based on saliency–based deep convolutional network. Text. Res. J. 2023, 93, 2980–2994. [Google Scholar] [CrossRef]
- Liu, L.; Deng, N.; Xin, B.; Wang, Y.; Wang, W.; He, Y.; Lu, S. Objective evaluation of fabric pilling based on multi–view stereo vision. J. Text. Inst. 2021, 112, 1986–1997. [Google Scholar] [CrossRef]
- Fan, M.; Liu, L.; Deng, N.; Xin, B.; Wang, Y.; He, Y. Digital 3D system for classifying fabric pilling based on improved active contours and neural network. Vis. Comput. 2023, 39, 5085–5095. [Google Scholar] [CrossRef]
- Wu, J.; Wang, D.; Xiao, Z.; Yu, K.; Zhang, F.; Geng, L. Knitted fabric and nonwoven fabric pilling objective evaluation based on SONet. J. Text. Inst. 2022, 113, 1418–1427. [Google Scholar] [CrossRef]
- Muthusamy, L.P.; Periyasamy, A.P.; Govindan, N. Prediction of pilling grade of alkali–treated regenerated cellulosic fabric using fuzzy inference system. J. Text. Inst. 2022, 113, 2759–2769. [Google Scholar] [CrossRef]
- Jun, X.; Wang, J.; Zhou, J.; Meng, S.; Pan, R.; Gao, W. Fabric defect detection based on a deep convolutional neural network using a two–stage strategy. Text. Res. J. 2021, 91, 130–142. [Google Scholar] [CrossRef]
- Huang, M.L.; Fu, C.C. Applying image processing to the textile grading of fleece based on pilling assessment. Fibers 2018, 6, 73. [Google Scholar] [CrossRef]
- Yan, Y.; Tan, Y.; Gao, P.; Yu, Q.; Deng, Y. Fabric pilling image segmentation by embedding dual–attention mechanism U–Net network. Text. Res. J. 2024, 94, 2434–2444. [Google Scholar] [CrossRef]
- ISO 105–F02:2009; Textiles—Tests for Colour Fastness—Part F02: Specification for Cotton and Viscose Adjacent Fabrics. ISO: Geneva, Switzerland, 2009.
- ISO 105–F01:2001; Textiles—Tests for Colour Fastness—Part F01: Specification for Wool Adjacent Fabric. ISO: Geneva, Switzerland, 2001.
- ISO 105–F03:2001; Textiles—Tests for Colour Fastness—Part F03: Specification for Polyamide Adjacent Fabric. ISO: Geneva, Switzerland, 2001.
- ISO 105–F04:2001; Textiles—Tests for Colour Fastness—Part F04: Specification for Polyester Adjacent Fabric. ISO: Geneva, Switzerland, 2001.
- ISO 105–F05:2001; Textiles—Tests for Colour Fastness—Part F05: Specification for Acrylic Adjacent Fabric. ISO: Geneva, Switzerland, 2001.
- EN 12127:1997; Textiles—Fabrics—Determination of Mass Per Unit Area Using Small Samples. ISO: Geneva, Switzerland, 1997.
- EN ISO 5084:1996; Textiles—Determination of Thickness of Textiles and Textile Products. ISO: Geneva, Switzerland, 1996.
- EN ISO 7211–2:2024; Textiles—Woven Fabrics—Construction—Methods of Analysis—Part 2: Determination of Number of Threads Per Unit Length. ISO: Geneva, Switzerland, 2024.
- EN ISO 139:2005/A1:2011; Textiles—Standard Atmospheres for Conditioning and Testing. ISO: Geneva, Switzerland, 2005.
- ISO 2:1973; Textiles—Designation of the Direction of Twist in Yarns and Related Products. ISO: Geneva, Switzerland, 1973.
- ISO 7211-5:2021; Textiles—Methods for Analysis of Woven Fabrics Construction—Part 5: Determination of Linear Density of Yarn Removed from Fabric. ISO: Geneva, Switzerland, 2021.
- ISO 17202:2002; Textiles—Determination of Twist in Spun Yarns—Untwist/Retwist Method. ISO: Geneva, Switzerland, 2002.
- EN ISO 2061:2015; Textiles—Determination of Twist in Yarns—Direct Counting Method. ISO: Geneva, Switzerland, 2015.
- EN ISO 1139:2025; Textiles—Designation of Yarns. ISO: Geneva, Switzerland, 2025.
- EN ISO 12947-1:1998+AC:2006; Textiles—Determination of the Abrasion Resistance of Fabrics by the Martindale Method—Part 1: Martindale Abrasion Testing Apparatus. ISO: Geneva, Switzerland, 1998.
- Fiji. Available online: https://imagej.net/software/fiji/#publication (accessed on 8 December 2025).
- Zhang, Z.; Zhang, J.; Ye, X.; Ma, K.; Li, H. Correlation Analysis and Prediction Model of Thermal Protection Performance of Aramid 1414 Fabric. Polymers 2023, 15, 1188. [Google Scholar] [CrossRef]
- Hasan, M.S.M.; Chowdhury, M.K.H.; Smriti, S.A.; Khalil, E.; Akter, M.; Farhana, K. Predicting the Effect of Thread Density on the Physical and Thermal Properties of Plain-Woven Fabric by Using a Soft Computing System. J. Eng. Fibers Fabr. 2024, 19, 15589250241308553. [Google Scholar] [CrossRef]
- Schober, P.; Schwarte, L.A. Correlation Coefficients: Appropriate Use and Interpretation. Anesth. Analg. 2018, 126, 1763–1768. [Google Scholar] [CrossRef]
- Wulfhorst, B.; Külter, H. Fiber tables according to P.-A. Koch. Cotton. Chem. Fibers Int. 1989, 39, 12–34. [Google Scholar]
- Albrecht, W.; Wulfhorst, B.; Külter, H. Fiber tables according to P.-A. Koch. Regenerated cellulose fibers. Chem. Fibers Int. 1991, 40, 26–44. [Google Scholar]
- Ho, Y.; Landy, M.S.; Maloney, L.T. How direction of illumination affects visually perceived surface roughness. J. Vis. 2006, 6, 634–648. [Google Scholar] [CrossRef]
- Tan, X.; Triggs, B. Recognition under difficult lighting conditions. IEEE Trans. Image Process. 2010, 19, 1635–1650. [Google Scholar] [CrossRef]


Disclaimer/Publisher’s Note: The statements, opinions and data contained in all publications are solely those of the individual author(s) and contributor(s) and not of MDPI and/or the editor(s). MDPI and/or the editor(s) disclaim responsibility for any injury to people or property resulting from any ideas, methods, instructions or products referred to in the content. |
© 2026 by the authors. Licensee MDPI, Basel, Switzerland. This article is an open access article distributed under the terms and conditions of the Creative Commons Attribution (CC BY) license.