Abstract
This article presents a comprehensive analysis of the polychrome paintings on the Flower Peking Opera Theatre in Bozhou, Anhui Province, China. A multi-technique approach was employed, including polarized light microscopy (PLM), X-ray fluorescence (XRF), micro-Raman spectroscopy, X-ray diffraction (XRD), Fourier transform infrared spectroscopy (FT-IR), scanning electron microscopy with energy-dispersive spectrometry (SEM-EDS), and Herzberg staining to determine the composition and methodologies involved in the formation of the pigment layer, the white primer, and the ground layer. The analysis identified cinnabar (red), both artificial ultramarine and Prussian blue (blue), a mixture of barite and gypsum (white), a mixture of chromite and Prussian blue (green), and carbon black (black) in the pigment layer. The ground layer was found to consist of clay and plant fibers (cotton and hemp), while the white prime layer was primarily composed of barite and gypsum. This research provides insights for future conservation and restoration efforts.
1. Introduction
During the Ming and Qing dynasties, the commodity economy witnessed high-level development, and merchants were highly mobile [1]. To facilitate the management of the floating population and promote commercial activities, guild halls were constructed in important trading locations. These guild halls provided merchants with services such as accommodation, business negotiation, medical care, and entertainment. Bozhou in Anhui Province, historically a vital water land transportation hub connecting the north and the south, boasted a prosperous commercial environment. In the Qing Dynasty, it attracted numerous merchants, who built as many as 31 commercial guild halls [2]. Among them, the Shanxi-Shaanxi Guild Hall, initially built in 1656 (the 13th year of the Shunzhi reign of the Qing Dynasty) by merchants from Shanxi and Shaanxi provinces, was the most magnificent in scale. The Flower Peking Opera Theatre within the guild hall (first built in 1676 and expanded in 1766) was the core carrier of its architectural art. The theater has undergone five renovations, and the existing polychrome paintings were mainly created in 1892 (the 18th year of the Guangxu reign) [3].
The Flower Peking Opera Theatre (Figure 1) was listed as a national key cultural relic under the third batch of protection due to its woodcarvings, polychrome paintings, and brick carvings. The polychrome paintings on the architecture are vivid in content, mainly inspired by 59 scenes from “Romance of the Three Kingdoms”, “Journey to the West”, and other mythological legends [3]. With rich colors and a convergence of Confucian, Buddhist, and Taoist thoughts [4,5], they possess extremely high historical and artistic value, serving as a paragon of local folk polychrome paintings in the Qing Dynasty. Compared with official style polychrome paintings, local polychrome paintings feature flexible themes, inexpensive materials, and locally characteristic craftsmanship.
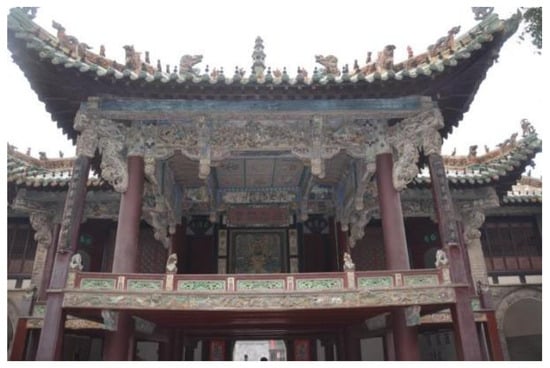
Figure 1.
Flower Peking Opera Theatre: North elevation view of the theater.
Research on the Flower Peking Opera Theatre has mostly focused on its artistic features and the reuse of artistic elements, with few analyses of the materials and methods used in creating the polychrome paintings. Due to environmental factors and the nature of the polychrome paintings themselves, problems such as warping, peeling, powdering, and fading currently exist, severely affecting the preservation of the paintings and calling for urgent protection. Before implementing conservation measures, clarifying the materials and techniques used in creating the polychrome paintings can not only enrich the research content of local polychrome paintings but also provide scientific guidance for subsequent restoration.
In the analysis of ancient color paintings, a variety of techniques have been applied to practice. Optical microscopy [6,7,8,9,10], polarized light microscopy (PLM) scanning electron microscopy (SEM) are used to observe the surface or cross-section [11,12,13]; X-ray fluorescence (XRF) [8,14,15] or scanning electron microscopy with energy dispersive spectroscopy (SEM-EDS) [7,9,14,16] are used to identify the elements of the relevant mineral pigments; Raman spectroscopy [9,10,16,17], X-ray diffraction (XRD) [7,10,11,12,15,18,19], Fourier transform infrared spectroscopy (FT-IR) [8,10,16,20] are used to accurately identify the crystalline structures and micro-structure of the pigments; Herzberg stain and optical microscopy [18,21,22] are used to identify the fiber sources in groundclay layers; Py-GC/MS [12,14,23] and FTIR are used to detect the probable use of the binder.
The objective of this article is to analyze the raw materials and applicable manufacturing methods of the polychrome paintings in the Flower Peking Opera Theatre through multiple analytical techniques, including polarized light microscopy (PLM), XRF, SEM-EDS, XRD, micro-Raman, FT-IR, Herzberg stain and Py-GC/MS. It is anticipated that the findings of this study will highlight some useful elements relevant to its objective, enabling a comprehensive understanding of the original materials of these artworks, as well as their historical, cultural, and artistic values. Moreover, this research aims to provide scientific information to facilitate future conservation and restoration of the paintings.
2. Materials and Methods
2.1. Materials
Upon investigation, it was found that the polychrome paintings in Flower Peking Opera Theatre can be categorized into two types. The first category consists of those applied on the wooden carvings of the external facade (Figure 2a). These paintings are based on the wooden carvings. Initially, the carvings are applied a thin stratum of white primer, after which the painting is finishing directly. The second approach pertains to the paintings executed on the base layer that envelops the timber components of the opera house (Figure 2b). This process commences with the creation of the base layer, followed by the application of a white primer, and culminates in the completion of the painting.
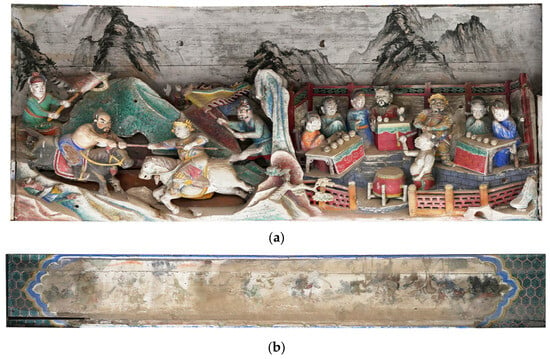
Figure 2.
Polychrome paintings on the theater: (a) Color paintings on the wooden carvings; (b) Color paintings on the wooden components.
The polychrome paintings predominantly depict figure-centered narratives. The principal colors employed within these paintings encompass red, black, blue, green, and white, with white being frequently utilized for delineating outlines. Prior to the sampling process, researchers appraised the preservation state of the murals by means of a portable digital microscope. It was discerned that the polychrome paintings commonly manifest diverse forms of deterioration, including warping, powdering, and the presence of insect holes. The pigment layer is exceedingly thin and is intermingled with a multitude of impurities, rendering it arduous to discern. Consequently, a small quantity of samples was collected from the damaged regions. On site, a portable X-ray fluorescence (XRF) apparatus was utilized to conduct elemental analysis of the experimental areas, thereby ensuring the representativeness of the samples. Trace amounts of flake samples such as red, blue, green, black, and white were procured for analytical testing. It includes pigments, clay and fiber in ground layers and white prime. Sample Location is signed in Figure 3. Sample information is outlined in Table 1.
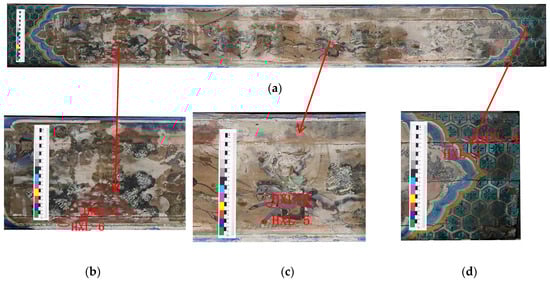
Figure 3.
Sampling points: (a) Eastern side of the western hanging beam; (b) Red (HXL-1) and white (HXL-6) sampling points; (c) Dark blue (HXL-2) and black (HXL-5) sampling points; (d) Light blue (HXL-3) and green (HXL-4) sampling points.

Table 1.
Sampling details information.
2.2. Analysis Methods
2.2.1. Polarized Light Microscopy (PLM)
The micro-morphology of pigment particles and the characteristics of aggregates are observable through the utilization of a polarizing microscope. This enables the restoration of the manufacturing process. PLM (Leica DMLSP, the instrument is located in Xi’an, China) was applied to analyze the crystal structure of pigment samples. The specific test steps are as follows:
- Wipe the slide with acetone;
- Using a stereomicroscope, place a small visible amount of sample with a clean tungsten needle on the slide (approximately 20–80 ng);
- Disperse the sample by adding anhydrous alcohol to the sample’s edge as needed;
- Grind the sample with a clean tungsten needle until anhydrous alcohol completely evaporates;
- Use forceps to move the coverslip onto the sample and place it on a heating table set at 90–100 °C;
- On the heating table, take a drop of dissolved fixative resin (MeltmountTM, nD = 1.662, Cargille, Cedar Grove, NJ, USA) and place it along one side of the coverslip until the resin has completely penetrated the coverslip.
2.2.2. X-Ray Fluorescence Spectrometer (XRF)
For in situ testing, a portable X-ray fluorescence spectrometer manufactured by Thermo Fisher Scientific is utilized. XRF (Thermo Fisher Niton XL3T 950, from the Billerica, MA, USA; the instrument is situated in Xi’an, China) can be utilized to detect the elemental composition of the pigment layer in situ. Conventionally, the ore copper-zinc mode is applied with an excitation time of 45 s. For red substances, aside from the standard testing methods, the electronic metal mode is also employed, also with an excitation time of 45 s.
During the spot testing procedure of the samples, the Bruker M4 Tornado (the Bruker M4 Tornado apparatus at the Emperor Qinshihuang’s Mausoleum Site Museum, Xi’an, China), a sophisticated analytical instrument, is employed. This device is specifically selected for its high precision capabilities in accurately analyzing the samples, which is of great significance for obtaining reliable results in relevant research. The source used was a single rhodium target X-ray tube. The spot size used was 20 μm. The X-ray tube was running at 50 kV electron voltage and the current was set to 600 μA. All analysis was carried out in vacuum.
2.2.3. XRD
XRD analysis enables the identification of the phase composition, crystal structure, and crystallinity of pigment samples. XRD (Bruker D8 Advance X, positioned in Beijing, China) was employed to conduct an analysis of the pigment layer and the ground layer. The detection utilized a copper target, with a working voltage of 60 kV, a power of 3 kW, a current of 40 mA. The scanning step was set at 0.02, the scanning speed was 8°/min, and the scanning range was configured from 10° to 90°. The sample was meticulously ground in an agate mortar to a powder with a particle size not exceeding 200 mesh. Subsequently, the powdered sample was subjected to testing on the flat surface of a monocrystalline silicon wafer. The assignment of diffraction peaks was carried out by making use of the commercial spectral database, ICDD-PDF-2-2012.
2.2.4. Micro-Raman Spectroscopy
Micro-Raman spectroscopy, specifically the Scientific XploRA PLUS model from HORIBA (situated in Beijing, China), was employed to analyze the chemical composition of dark-blue and green pigments. The instrument parameters are as follows: an excitation wavelength of 785 nm and a grating of 1200 gr/mm. During sample testing, the laser power was approximately 1 mW, and each sample was measured three times for a duration of 30 s each.
For the analysis of red, light blue, black, and white pigments, the Invia Micro Raman spectrometer by Renishaw, located at the Emperor Qinshihuang’s Mausoleum Site Museum in Xi’an, was utilized. This instrument uses an argon-ion laser with an excitation wavelength of 514 nm. The objective lens offers a magnification of 100-fold. The information acquisition time is set at 10 s, and the accumulation process is carried out three times. The power of the laser acting on the sample surface is approximately 3 mW.
2.2.5. FT-IR
FT-IR was collected by a Fourier transform infrared spectrometer (iN10 MX, NICOLET, Madison, WI, USA, the instrument is located in Xi’an, China) with the KBr tablet method. The spectra were set at 4000–400 cm−1 with a resolution of 4 cm−1 using 128 scans. The sample was ground, dispersed, and then placed on a BaF2 substrate for measurement.
2.2.6. EDS
SEM (Thermo Scientific Quattros, the instrument is located in Qingdao, Shandong) coupled with an EDS (Bruker, the instrument is located in Qingdao, Shandong) was used to examine the elements of white prime layer. EDS testing is conducted by taking points on the cross-section of the white prime layer to analyze the constituent elements of the lime layer. The instrumental testing conditions were set at a voltage of 20 kV, a working distance ranging from 8 to 12.6 mm, and a testing duration of 70 s. To guarantee the accuracy and comparability of the test outcomes, the elemental composition measurements were calibrated using the standard curve method. The instrument’s detection limit was 0.01%. For each sample, 2–3 measurement points were selected. In cases where the discrepancies between the measurements were negligible, the result from one of these points was chosen for further analysis.
2.2.7. The Herzberg Stain
The Herzberg stain is available for identifying fiber types in the base layer. It is an iodide and iodine solution combined with a zinc chloride solution and is commonly used to distinguish fiber sources [22,24]. Depending on the lignin content, different fibers are dyed in different hues. Rag fibers that do not contain lignin, such as hemp, ramie and cotton, are dyed red wine. The color ranges from red-wine (no lignin) to grey-bluish, grey-yellow-greenish, brown-yellowish, and finally completely yellow for fibers with high lignin content (such as bamboo) [21]. The Herzberg reagent used in this experiment, prepared according to the TAPPI standard, is a mixture of zinc chloride solution (50 g ZnCl2 dissolved in 25 mL distilled water) and iodine solution (0.25 g I2 and 5.25 g KI dissolved in 12.5 mL distilled water). This mixture is then placed in a thin cylinder and left to stand until cleared. Fiber samples collected from the base layer are stained with a blunt needle on a slide using Herzberg reagent. After the stained fiber sample is covered with a lid, it is photographed and identified using the ZEISS Scope A.1 polarizing microscope (Jena, Germany).
2.2.8. Pyrolysis–Gas Chromatography–Mass Spectrometry (Py-GC/MS)
In the Py-GC/MS analysis system, an EGA/PY3030D pyrolyzer (Fukuyama, Hiroshima Prefecture), an Agilent 7890B gas chromatograph, and an Agilent 5977B MSD (Santa Clara, CA, USA) mass spectrometer are integrated. The gas chromatography column employed was an HP-5MS capillary column with dimensions of 30 m × 250 μm × 0.25 μm. A binder sample of approximately 50 μg was introduced into the pyrolysis reactor. Subsequently, 3 μL of 20% tetramethylammonium hydroxide (TMAH) was added for pretreatment. The sample was then left to stand in the autosampler for 1 h prior to pyrolysis at 550 °C. After pyrolysis, the resultant products were identified via GC-MS.
3. Results
The study of the polychrome paintings on the Flower Peking Opera Theatre indicated that the interior paintings are made up of three distinct strata (Figure 4): the ground layer, the white prime, and a pigment layer. Conversely, the exterior paintings consist of only two layers: the pigment layer and the white prime. This layering pattern diverges from that of the official -style colored paintings of the Qing Dynasty on ancient imperial buildings, which lack a white prime [25]. Moreover, certain local color paintings in the Guangxi region used substrates predominantly composed of white lead powder blended with glue [26]. The painting techniques employed in the Huaxi Tower exhibit unique local characteristics. A detailed analysis of the paintings on each layer is provided below.
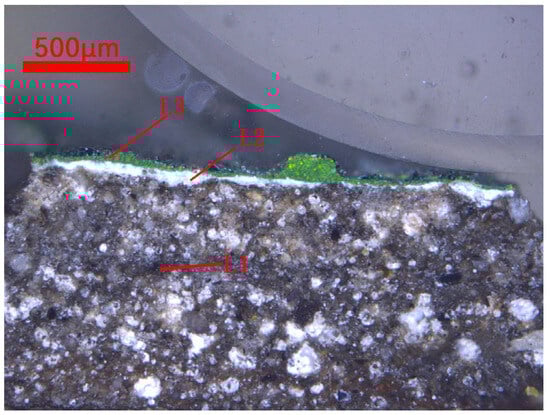
Figure 4.
Cross-section of HXL-3 (L1—ground layer; L2—white prime; L3—pigment layer).
3.1. Pigments
The main colors used are red, blue, green, white, black. The pigments were identified using PLM, XRF, micro-Raman, XRD and FT-IR. Table 2 shows an overview of the pigments identified using micro-Raman and XRF.
Table 2.
Analysis of major pigments.
3.1.1. Red
The HXL-1 sample underwent analysis via polarizing microscopy, X-ray fluorescence (XRF), X-ray diffraction (XRD), and Raman spectroscopy. The findings from these comprehensive tests suggest that the sample is cinnabar.
Under single polarized light, the sample presents as dark-red particles, with sizes ranging between 10 and 20 μm, and smooth edges (Figure 5a). When observed under orthogonal polarized light, the sample shows an orange-yellow coloration and parallel extinction (Figure 5b), with an eccentricity exceeding 1.662.
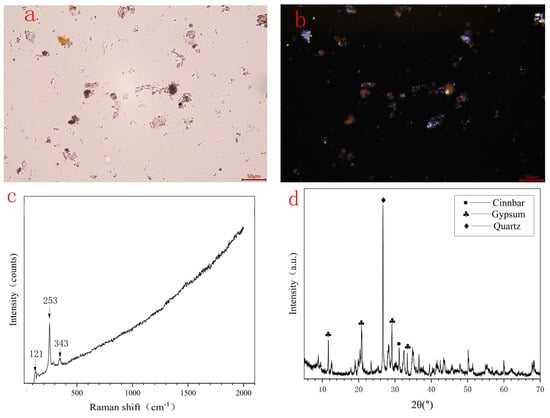
Figure 5.
Sample HXL-1 information: (a) Polarized light microscopy image at ×500 magnification; (b) Orthogonal light microscopy image at ×200 magnification; (c) Micro-Raman spectroscopy of sample; (d) XRD analysis spectra.
X-ray fluorescence analysis identified the principal elements within the sample as Pb (55.22%), Hg (39.19%), and S (2.77%). Raman spectroscopy revealed peaks at 121 cm−1, 253 cm−1, and 343 cm−1. The peak at 253 cm−1 (Figure 5c) corresponds to the characteristic Hg-S bond, while the peak at 343 cm−1 represents the antisymmetric stretching vibration of the Hg-S bond [27,28,29]. These peaks align with the known characteristic peaks of cinnabar. Furthermore, the X-ray diffraction pattern exhibits diffraction peaks at 2θ values of 26.5°, 28.2°, and 31.2°, further validating the presence of cinnabar [30]. XRD analysis (Figure 5d) indicates that the main constituent phases are cinnabar, gypsum, and quartz, with quartz commonly occurring as an associated mineral with cinnabar. Cinnabar primarily consists of HgS and exhibits a bright red to dark red coloration. It is a metastable form of HgS [31].
Cinnabar has been utilized as a pigment in China for more than 7000 years [12,32].
3.1.2. Blue
1. Dark Blue
The HXL-2 sample, presenting a dark blue color, was subjected to analysis via polarizing microscopy, X-ray fluorescence (XRF), Raman spectroscopy, and X-ray diffraction (XRD).
Under single polarized light, the sample manifests as blue green, with particle sizes less than 10 μm. Comprising small particles devoid of a gelatinous outer film, it has a particle size range exceeding 50 μm (Figure 6a). The sample demonstrated a poorly developed crystal morphology and appeared entirely matte under orthogonal polarized light (Figure 6b). It is categorized as either an organic pigment or an artificial synthetic pigment.
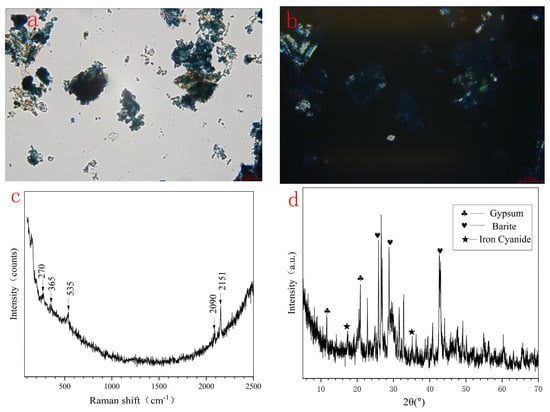
Figure 6.
HXL-2 information: (a) Polarized light microscopy image at ×500 magnification; (b) Orthogonal light microscopy image at ×200 magnification; (c) Micro-Raman spectroscopy of sample; (d) XRD analysis spectra.
The XRF analysis indicates that the primary constituent elements of the sample are Fe (68.08%), Zn (2.65%), and Pb (1.23%). The Raman spectra reveal peaks at 270, 365, 535, 2090, and 2151 cm−1 (Figure 6c). The characteristic peak pair at 2093 cm−1 and 2154 cm−1 corresponds to the Raman vibrational characteristics of cyanide bridging coordination compounds [24], a crucial identifier of Prussian blue. Meanwhile, the peak at 531 cm−1 represents the bending mode of the Fe-CN bond [33]. These peaks align with the characteristic peaks of Prussian blue, represented by the formula Fe4[Fe(CN)6]3. The XRD pattern displays diffraction peaks at angles of 17.5°, 24.6°, and 35.4° (Figure 6d), associated with Prussian blue.
Prussian blue was first synthesized in 1704 [27] and subsequently exported to Asia during the 18th and 19th centuries. It was utilized in China by at least the first half of the 18th century [31]. Owing to its affordability, Prussian blue largely supplanted mineral pigments and found application in the colored paintings of ancient structures.
2. Light Blue
The HXL-3 sample was subjected to analysis by polarizing microscopy, X-ray fluorescence (XRF), Raman spectroscopy, X-ray diffraction (XRD), and Fourier-transform infrared spectroscopy. Comprehensive analysis suggests that the sample is ultramarine.
Under single polarizing microscope observations, a vivid blue, rock-like crystal with a particle size generally less than 10 μm (Figure 7a) is disclosed. The particles are relatively spherical and of uniform size. Under orthogonal polarized light, the sample shows complete extinction (Figure 7b), and its refractive index is slightly lower.
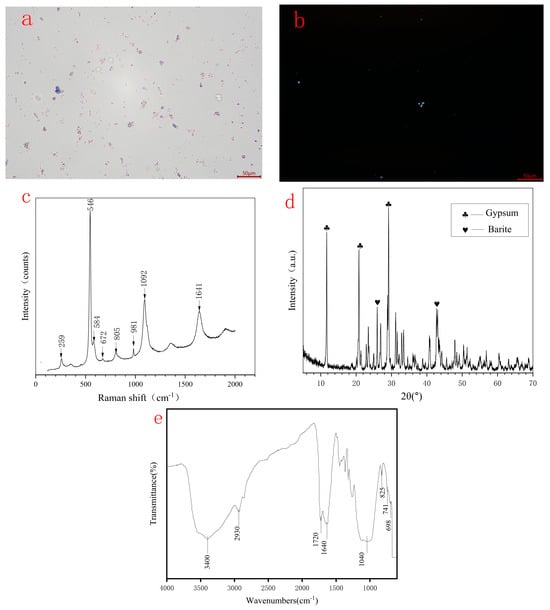
Figure 7.
Sample HXL-3 information: (a) Polarized light microscopy image at ×500 magnification; (b) Orthogonal light microscopy image at ×200 magnification; (c) Micro-Raman spectroscopy of sample; (d) XRD analysis spectra; (e) Fourier transform infrared spectroscopy (FT-IR) analysis spectra.
X-ray fluorescence identified the principal constituent elements as Si (38.52%), Al (14.11%), S (16.83%), and Na (16.06%). Raman analysis detected peak values at 259, 546, 584, 672, 805, 981, 1092, 1145, and 1641 cm−1 (Figure 7c). The 259 cm−1 peak corresponds to the bending vibration mode of S3−, and the 546 cm−1 peak is attributed to the symmetric stretching vibration mode of S3− [12,21,31]. The first overtone (2v1) of this mode, although reduced in intensity, was also detected as a well-defined peak at 1092 cm−1 [34]. The coloration of lazurite is mainly due to the S3− and S2− chromophores. When there is a relatively high content of S3−, it appears blue [35]. Peaks at 259, 546, 1092, and 1641 cm−1 correspond to the characteristic peaks of lazurite at 258, 547, 804, 1093, and 1640 cm−1 [36]. However, the characteristic peaks of calcite at 1086, 713, 283, and 156 cm−1 [37] are absent. Calcite is an associated mineral of lazurite. The absence of peaks matching these spectral bands indicates that the material may be synthetic. FT-IR detected characteristic spectral bands (Figure 7e) at 3400, 2930, 1720, 1640, 1040, 825, 741, and 698 cm−1. These characteristic peaks suggest that the tested substance is a mixture. The 3400 cm−1 (O-H, associated with crystalline water) and 1640 cm−1 (H-O-H bending) peaks jointly indicate the presence of gypsum [12]. Specifically, the 3400 cm−1 peak represents the O-H stretching vibration, and the 1640 cm−1 peak is the characteristic bending vibration peak of crystalline water. The broad peak at 1040 cm−1 may correspond to the antisymmetric absorption peak of SO42− in gypsum. The 1040 cm−1 peak can also be the stretching vibration absorption peak of Si-O in silicate [38], potentially indicating ultramarine [39], or other silicate compounds. The 825 cm−1 peak is close to but deviated from the characteristic carbonate peak at 871 cm−1, and the 741 cm−1 peak is close to but deviated from the characteristic carbonate peak at 712 cm−1 [13], and the characteristic silicate peak at 753 cm−1 [18]. This indicates the possible presence of certain silicate or carbonate substances. However, these findings are insufficient to determine the presence of lazurite in the pigment. No sharp peak was detected at 2340 cm−1, which can be detected in lazurite from Afghanistan, Siberia, and Iran [38]. Through X-ray diffraction (XRD) analysis (Figure 7d), co-existing minerals such as calcite were not detected. Should associated minerals be detected via X-ray diffraction (XRD), it can facilitate the determination of the provenance of lazurite [33]. Nevertheless, this alone is inadequate for differentiating between artificial and natural ultramarine. Considering the characteristics observed under the polarizing microscope and the features of the Raman spectrum, it is inferred that the pigment is synthetic ultramarine.
Jean Baptiste Guimet synthesized artificial ultramarine in 1821 [40]. The introduction of artificial ultramarine to China in the mid to late 19th century suggests that the color paintings in China postdate the late Qing Dynasty or underwent restoration during that period.
3.1.3. Green
The HXL-4 sample was analyzed via polarizing microscopy, X-ray fluorescence (XRF), Raman spectroscopy, and X-ray diffraction (XRD). The findings from the comprehensive tests suggested that the chromogenic components of this sample were chromite (PbCrO4) and Prussian blue.
Under single polarized light, the sample exhibits a bright green color and contains small rock-like crystals with particle sizes ranging from 10 to 50 μm, displaying complete extinction under orthogonal polarized light (Figure 8a,b).
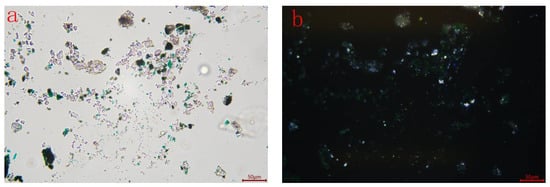
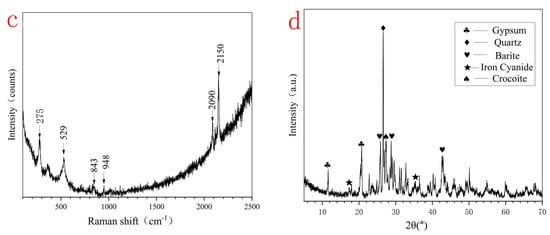
Figure 8.
Sample HXL-4 information: (a) Polarized light microscopy image at ×500 magnification; (b) Orthogonal light microscopy image at ×200 magnification; (c) Micro-Raman spectroscopy of sample; (d) XRD analysis spectra.
XRF analysis reveals the primary constituent elements as follows: Pb (10.69%), Zn (9.71%), Fe (4.74%), Si (2.55%), and Cr (0.14%). Raman spectroscopy detected peaks at 275, 529, 843, 948, 2090 and 2150 cm−1 (Figure 8c). The majority of these peaks corresponded well to the Raman peaks of Prussian blue at 282, 531, 2102, and 2154 cm−1, indicating the presence of Prussian blue in the pigment. A characteristic peak at 843.0 cm−1 was detected, which matched the characteristic peak of chrome yellow at 842 cm−1 [27], suggesting that chrome yellow (PbCrO4) was also present in the pigment. The XRD analysis indicates that the sample comprises Prussian blue, chrome yellow, gypsum, barite, and quartz (Figure 8d). Overall, the chromogenic components of this sample are inferred to be Prussian blue and chrome yellow.
3.1.4. Black
The HXL-5 sample was subjected to analysis via polarizing microscopy, XRF, Raman spectroscopy, and XRD. The results of the comprehensive analysis indicated that the pigment in question was carbon black. Under single-polarized light (Figure 9a), the sample presented as black small particle aggregates, with particle sizes ranging from 10 to 75 μm. It demonstrated complete extinction under orthogonal-polarized light( (Figure 9b). XRF analysis detected the principal constituent elements as Ba (3.91%), S (3.76%), and Ca (0.43%). The Raman spectrum (Figure 9c), exhibited peaks at 1353 cm−1 and 1597 cm−1, which corresponded to the D and G peaks of carbon black [32]. XRD analysis did not detect any phases characteristic of carbon black (Figure 9d).
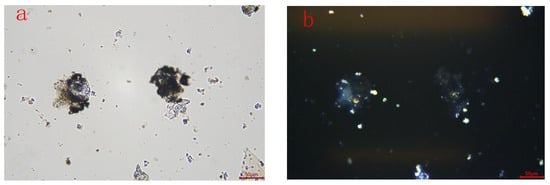
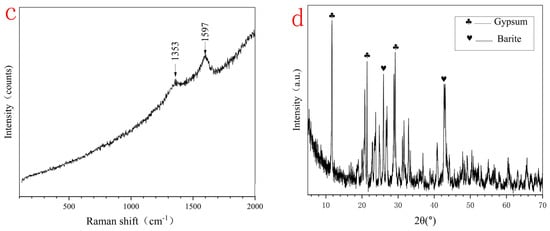
Figure 9.
Sample HXL-5 information: (a) Polarized light microscopy image at ×500 magnification; (b) Orthogonal light microscopy image at ×200 magnification; (c) Micro-Raman spectroscopy of sample; (d) XRD analysis spectra.
During the detection, barite and gypsum were found, and their components were the same as those of the white prime layer detected subsequently. This was because the pigment layer was extremely thin, causing it to mix with the white prime layer during the testing.
3.1.5. White
The HXL-6 sample was analyzed via polarized light microscopy, X-ray fluorescence (XRF), Raman spectroscopy, and X-ray diffraction (XRD). The comprehensive findings indicated that the white pigment within the sample is composed of gypsum and barite.
This sample contains two particle types: white and bright yellow. Under single polarized light, the white particles are seen as small, round, and transparent entities, showing strong extinction and a low refractive index under orthogonal polarized light (Figure 10a). Conversely, under orthogonal polarized light (Figure 10b), the yellow particles present as bright yellow crystals, demonstrating strong extinction and a relatively high refractive index.
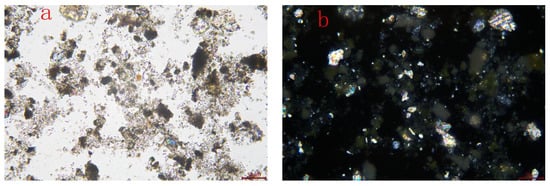
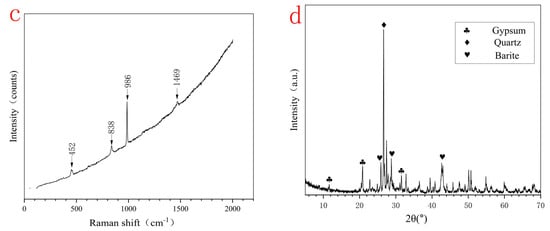
Figure 10.
Sample HXL-6 information: (a) Polarized light microscopy image at ×500 magnification; (b) Orthogonal light microscopy image at ×200 magnification; (c) Micro-Raman spectroscopy of sample; (d) XRD analysis spectra.
XRF analysis identified the principal constituent elements of the sample as S (22.59%), Ca (14.41%), Na (3.78%), and Al (1.38%). Raman spectroscopy detected peaks at 452, 838, 986, and 1469 cm−1 (Figure 10c). In the Raman spectrum, the most intense characteristic peak of barite (BaSO4) is located at 989 cm−1, accompanied by a series of characteristic peaks with relatively lower intensities, such as those at 454, 464, 619, 633, and 648 cm−1 [41], The test results are in good agreement, suggesting the presence of barite. The XRD analysis of the sample showed that the phase composition of the sample encompasses quartz, barite, gypsum, and albite (Figure 10d).
The white prime test results reveal that barite and gypsum are the primary components, suggesting the direct application of prime layer material instead of commonly used white pigments like lead white and kaolinite during painting.
3.2. White Prime
EDS analysis identified that the white prime of the HXL-4 sample consists of Ba (16.08%), S (20.62%), Si (6.31%), and Pb (9.8%). The XRD analysis shows that the main components are Barite (BaSO4) and Gypsum (CaSO4·2H2O) (Figure 11b). This practice contrasts with that of official colored paintings during the Qing Dynasty, which were typically applied directly onto the surface of the base layer without an intervening white prime.
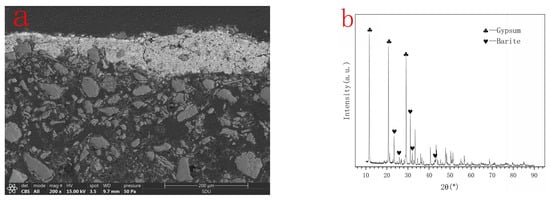
Figure 11.
Sample HXL-6 information: (a) SEM backscattered electron mode images; (b) XRD analysis spectra.
3.3. Ground Layer
During the mid to late Qing Dynasty, the scarcity of large sized timber compelled the utilization of spliced smaller pieces. As a result, the surface treatment of the wood remained relatively rough. To attain a smooth finish for painted wood, a base layer became necessary. In the official-style colored paintings of the Qing Dynasty, the base layer typically comprised brick ash as the aggregate. Pig’s blood, tung oil, and flour were employed as binders, and a layer of plant fibers was applied to the surface [25]. This bonding material not only enhanced the strength of the base layer but also improved its adhesion to the pigment binder, thus preventing peeling. Moreover, plant fibers effectively alleviated cracks arising from shrinkage during the drying and curing processes of the base layer, while simultaneously augmenting its tensile strength.
3.3.1. Binder
PY-GC/MS rapidly identifies binder types by detecting binder degradation products [42,43,44]. In this study, PY-GC/MS was employed to examine the cements within the geosphere, and the findings were presented in Figure 12 and Table 3.
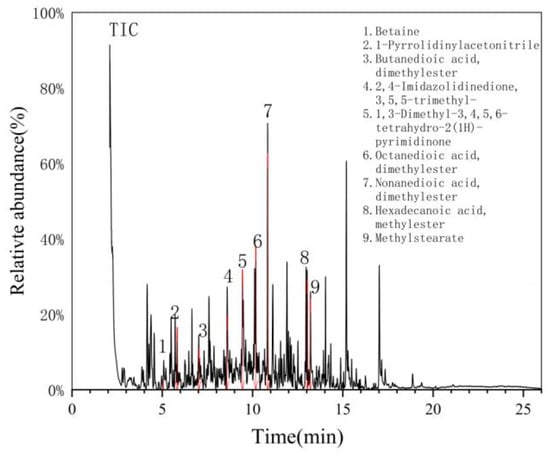
Figure 12.
Binder chromatography of HXL-4 samples.
Table 3.
Results of THM-Py-GC/MS analysis of sample HXL-4.
A large amount of dimethyl dibasic acid (peak 3,6,7) was detected. In particular, azelaic acid is a characteristic fatty acid of the oxidative degradation of drying oil. With a P/S ratio of 1.16, which falls within the range of 1.0–1.2, it serves as a characteristic that differentiates tung oil from other drying oils [45]. Moreover, an A/P ratio of 2.63 indicates a relatively high degree of oxidation of the drying oil in the sample [46]. Additionally, the presence of nitrogen-containing compounds, presumably protein-based organics excluding animal glue, was detected [39]. Alkylbenzene alkanoates (APAs), the pyrolysis product of boiled tung oil, were not detected in the sample, suggesting that boiled tung oil is absent in the sample.
3.3.2. Fibers
The larger wooden components of Flower Peking Opera Theatre, mostly contain fibers in ground layers. Through staining identification, the fibers in the sample HXL-1 (Figure 13a) exhibit the same characteristics as cotton fibers, while the fibers in HXL-4 (Figure 13b) are found to have similar qualities to hemp fibers. The microscopic structure of the fibers after staining and a detailed description of their specific characteristics are provided in Table 4.
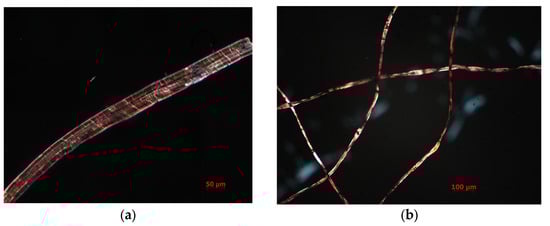
Figure 13.
Morphology of fiber: (a) HXL-1, (b) HXL-4.
Table 4.
Morphological characteristics of fiber samples in clay layer.
On basis of the fibers added to the base layer include cotton and hemp. The addition of these fibers was presumably done consciously in order to enhance the strength of the base layer without compromising its appearance. The use of different fibers may be attributed to variations in the era of the painted mural’s production.
4. Discussion
In the investigation of the decorative paintings adorning the Flower Peking Opera Theatre of Southeast Asian ancient architecture, it has been uncovered that the composition of ancient pigments is intricate, encompassing multiple materials rather than a single substance. Prolonged exposure to natural environmental conditions has led to widespread aging and dust accumulation of these pigments. This complexity poses a significant challenge to the effective identification of their constituent components when relying solely on a single analytical method. Consequently, the utilization of multiple analytical techniques for cross-validation is essential to enhance the reliability of the analytical outcomes. X-ray fluorescence spectroscopy (XRF) is utilized to detect elemental composition, which serves as the cornerstone for determining the components of the pigments. Raman spectroscopy has demonstrated efficacy in analyzing samples of red, dark-blue, green, and black pigments. For white samples, the employment of X-ray diffraction (XRD) as an auxiliary tool yields more conclusive results. However, in the case of light-blue samples, Raman spectroscopy is constrained by equipment limitations. Although it can distinguish between synthetic and natural ultramarine, the differentiating characteristic features are not pronounced. By combining the observation of uniformly sized particles under a polarizing microscope with the detection of elements such as Na, Al, Si, and S through XRF, the sample was comprehensively determined to be synthetic ultramarine. Regarding organic matter analysis, pyrolysis-gas chromatography/mass spectrometry (PY-GC/MS) has exhibited outstanding performance. Moreover, for the identification of plant fibers, the Hertzberg staining method has also produced reasonable results. The combined application of multiple techniques substantially improves the accuracy and reliability of conclusions regarding the components of ancient pigments.
The test results indicate that a white prime layer is commonly present in the polychrome paintings of the Flower Peking Opera Theatre. This technological feature significantly differs from the practices of official Qing Dynasty polychrome paintings and also varies from the common structures of polychrome paintings in other regions, fully demonstrating the distinct regional characteristics. The detection of BaSO4 and gypsum (CaSO4·2H2O) in the white prime layer suggests that the polychrome paintings were restored in the late Qing Dynasty or later, reflecting the changes in later restoration techniques. This provides important physical evidence for exploring the diversity of local polychrome painting technique systems in the Qing Dynasty. In the next step of the research, elemental distribution scans of Ba and Ca can be conducted on the white prime layer to determine the manufacturing process. Meanwhile, tests on the organic binding medium in the ground layer show that it is mainly drying oil, most likely tung oil. As a common drying oil, tung oil is characterized by rapid drying, good gloss, and strong water resistance. It is often used in the production of the ground layer for ancient architectural polychrome paintings, providing a certain degree of protection for the paintings. No significant markers of animal glue were detected, which is consistent with the technological tendencies of some decorative paintings in the late Qing Dynasty.
During the analysis of pigment composition, the determination of ultramarine was achieved through the combined use of Raman spectroscopy and observations under a polarizing microscope. To further clarify the properties of ultramarine, in subsequent research, ultramarine samples can be excited in the ultraviolet region and their Raman spectra can be detected. If the ultramarine is confirmed to be artificial, the production time of the corresponding parts in the currently observed polychrome paintings of the Flower Peking Opera Theatre is no earlier than the late Qing Dynasty. This not only provides a scientific basis for dating architectural polychrome paintings but also reveals the influence of foreign cultures on the use of raw materials in late-stage paintings from the perspective of material history.
Based on our research on the composition and structure of the Flower Peking Opera Theatre decorative paintings, and knowing that the binder in the pigment layer is a drying oil (maybe tung oil) that is sensitive to polar solvents, we should avoid using water or alcohol-based polar solvents for large-scale cleaning in future conservation work. First, we should do some small-scale local tests and prefer physical cleaning methods. For pigment layers that are lifting or becoming powdery, the consolidants we choose need to be well-compatible and adhesive with the aged drying oil (tung oil). We can think about testing and evaluating low-concentration acrylic materials. We need to be careful because the aging of tung oil might affect how it bonds with the consolidant. So, when choosing a consolidant, we have to consider this factor carefully to make sure we can effectively protect and restore the Flower Peking Opera Theatre decorative paintings.
Author Contributions
Conceptualization, W.L. and F.J.; methodology, W.L.; software, T.Z. and L.L.; validation, W.L., T.Z. and F.J.; formal analysis, J.H. and W.D.; investigation, W.L.; resources, L.L.; data curation, W.L.; writing—original draft preparation, W.L.; writing—review and editing, F.J. and T.Z.; supervision, W.L. and F.J.; project administration, L.L.; funding acquisition, W.L. and F.J. All authors have read and agreed to the published version of the manuscript.
Funding
This research received no external funding.
Institutional Review Board Statement
Not applicable.
Informed Consent Statement
Not applicable.
Data Availability Statement
Data available in a publicly accessible repository.
Acknowledgments
The authors would like to thank Biwen Shui, Xiaoxi Li and Xiaojuan Dang for their support of this study. The authors thank the Reviewers and the Editors for all comments and suggestions, which helped them to improve the quality of the article.
Conflicts of Interest
The authors declare no conflicts of interest.
References
- Wu, H. An Analysis of the Regional Distribution and Name Variation Patterns of Shan Shan Guildhalls in the Ming and Qing Dynasties. Master’s Thesis, Northwest University, Xi’an, China, 2003. [Google Scholar]
- Ren, X. Flower Peking Opera Theatre Preface. In Flower Peking Opera Theatre; Anhui People’s Publishing House: Anhui, China, 2013; pp. 2–3. (In Chinese) [Google Scholar]
- Lv, Y. The Characteristics and Contemporary Value of Woodcarving and Painting Art of “Hua Xi Lou” in Bozhou. J. Bengbu Univ. 2016, 5, 169–174. [Google Scholar] [CrossRef]
- Ren, X. Wood carving. In Flower Peking Opera Theatre; Anhui People’s Publishing House: Anhui, China, 2013; pp. 242–244. (In Chinese) [Google Scholar]
- Fan, P. Research on Architectural Decoration Patterns of Bozhou Flower Theater. Master’s Thesis, Northeast Forestry University, Harbin, China, 2020. [Google Scholar] [CrossRef]
- Crupi, V.; Fazio, B.; Fiocco, G.; Galli, G.; La Russa, M.F.; Licchelli, M.; Majolino, D.; Malagodi, M.; Ricca, M.; Ruffolo, S.A.; et al. Multi-Analytical Study of Roman Frescoes from Villa Dei Quintili (Rome, Italy). J. Archaeol. Sci. Rep. 2018, 21, 422–432. [Google Scholar] [CrossRef]
- He, J.; Zhou, W.; Hu, D.; Liu, S.; Otero, J.; Rodriguez-Navarro, C. A Multi-Analytical Approach for the Characterization of Materials, Manufacturing Process and Damage Mechanisms of Wall Paintings in Samye Temple, Tibet. Dye. Pigment. 2022, 207, 110704. [Google Scholar] [CrossRef]
- Vornicu, N.; Bibire, C.; Murariu, E.; Ivanov, D. Analysis of Mural Paintings Using in Situ Non-invasive XRF, FTIR Spectroscopy and Optical Microscopy. X-Ray Spectrom. 2013, 42, 380–387. [Google Scholar] [CrossRef]
- Abdel-Ghani, M. Multidisciplinary Study of a Qajar Lacquered Painting: Technology and Materials Characterization. Vib. Spectrosc. 2022, 119, 103355. [Google Scholar] [CrossRef]
- Liu, L.; He, J.; Ye, M.; Zhu, Z.; Zhong, Q.; Yang, J. Spectral Characterization of Pigment from the No. 1 Cave, Kizil Cave-Temple Complex. J. Spectrosc. 2019, 2019, 8502524. [Google Scholar] [CrossRef]
- Gong, Y.; Qiao, C.; Zhong, B.; Zhong, J.; Gong, D. Analysis and Characterization of Materials Used in Heritage Theatrical Figurines. Herit. Sci. 2020, 8, 13. [Google Scholar] [CrossRef]
- Dong, S.; Xiang, J.; Ji, J.; Wang, Y.; Zhang, G.; Fu, P.; Han, J.; Li, L. Multi-Method Analysis of Painting Materials in Murals of the North Mosque (Linqing, China). Coatings 2023, 13, 1298. [Google Scholar] [CrossRef]
- Kanth, A.P.; Singh, M.R. Spectroscopic and Chromatographic Investigation of the Wall Painted Surfaces of an 18th Century Indian Temple, New Delhi. Vib. Spectrosc. 2019, 104, 102947. [Google Scholar] [CrossRef]
- Herrera, L.K.; Montalbani, S.; Chiavari, G.; Cotte, M.; Solé, V.A.; Bueno, J.; Duran, A.; Justo, A.; Perez-Rodriguez, J.L. Advanced Combined Application of μ-X-Ray Diffraction/μ-X-Ray Fluorescence with Conventional Techniques for the Identification of Pictorial Materials from Baroque Andalusia Paintings. Talanta 2009, 80, 71–83. [Google Scholar] [CrossRef]
- Cotte, M.; Susini, J.; Solé, V.A.; Taniguchi, Y.; Chillida, J.; Checroun, E.; Walter, P. Applications of Synchrotron-Based Micro-Imaging Techniques to the Chemical Analysis of Ancient Paintings. J. Anal. At. Spectrom. 2008, 23, 820. [Google Scholar] [CrossRef]
- Skipper, L.K.; Baron, M.; Sancho, N.; Alkaseem, M. The Technical Examination of Nineteenth-Century Artists’ Pigments from John Opie’s Paintbox. Stud. Conserv. 2025, 70, 37–50. [Google Scholar] [CrossRef]
- Bruder, R.; Detalle, V.; Coupry, C. An Example of the Complementarity of Laser-induced Breakdown Spectroscopy and Raman Microscopy for Wall Painting Pigments Analysis. J. Raman Spectrosc. 2007, 38, 909–915. [Google Scholar] [CrossRef]
- Shen, J.; Li, L.; Zhang, D.; Dong, S.; Xiang, J.; Xu, N. A Multi-Analytical Approach to Investigate the Polychrome Clay Sculpture in Qinglian Temple of Jincheng, China. Materials 2022, 15, 5470. [Google Scholar] [CrossRef]
- Salvadó, N.; Butí, S.; Cotte, M.; Cinque, G.; Pradell, T. Shades of Green in 15th Century Paintings: Combined Microanalysis of the Materials Using Synchrotron Radiation XRD, FTIR and XRF. Appl. Phys. A 2013, 111, 47–57. [Google Scholar] [CrossRef]
- Ajò, D.; Casellato, U.; Fiorin, E.; Vigato, P.A. Ciro Ferri’s Frescoes: A Study of Painting Materials and Technique by SEM-EDS Microscopy, X-Ray Diffraction, Micro FT-IR and Photoluminescence Spectroscopy. J. Cult. Herit. 2004, 5, 333–348. [Google Scholar] [CrossRef]
- Li, T.; Ji, J.; Zhou, Z.; Shi, J. A Multi-Analytical Approach to Investigate Date-Unknown Paintings of Chinese Taoist Priests. Archaeol. Anthr. Sci. 2017, 9, 395–404. [Google Scholar] [CrossRef]
- Collings, T.; Milner, D. The Identification of Oriental Paper-Making Fibres. Pap. Conserv. 1978, 3, 51–79. [Google Scholar] [CrossRef]
- Khandekar, N.; Schilling, M. A Technical Examination of a Seventeenth-Century Polychrome Sculpture of St Gines de La Lara by Luisa Roldan. Stud. Conserv. 2001, 46, 23–34. [Google Scholar] [CrossRef]
- Shi, J.; Li, T. Technical Investigation of 15th and 19th Century Chinese Paper Currencies: Fiber Use and Pigment Identification. J. Raman Spectrosc. 2013, 44, 892–898. [Google Scholar] [CrossRef]
- Zhou, W. Research on the Production Technology and Material Analysis of Ancient Architecture Oil Decoration Color Painting. Master’s Thesis, Northwest University, Xi’an, China, 2009. [Google Scholar]
- Guo, H.; Huang, H.; Xie, R.; Lan, R. Research on the Protection and Restoration of Architectural Paintings in Baizhu Temple, Fuchuan, Guangxi. Cult. Relics Prot. Archaeol. Sci. 2003, 4, 31–36+69. [Google Scholar] [CrossRef]
- Burgio, L.; Clark, R.J.H. Library of FT-Raman Spectra of Pigments, Minerals, Pigment Media and Varnishes, and Supplement to Existing Library of Raman Spectra of Pigments with Visible Excitation. Spectrochim. Acta Part A Mol. Biomol. Spectrosc. 2001, 57, 1491–1521. [Google Scholar] [CrossRef] [PubMed]
- Cosano, D.; Esquivel, D.; Costa, C.M.; Jiménez-Sanchidrián, C.; Ruiz, J.R. Identification of Pigments in the Annunciation Sculptural Group (Cordoba, Spain) by Micro-Raman Spectroscopy. Spectrochim. Acta Part A Mol. Biomol. Spectrosc. 2019, 214, 139–145. [Google Scholar] [CrossRef] [PubMed]
- Pigments Analysis of an Egyptian Cartonnage by Means of XPS and Raman Spectroscopy|Applied Physics A. Available online: https://link.springer.com/article/10.1007/s00339-020-3386-y (accessed on 28 November 2025).
- Li, J.; Zhao, R. A Multi-Method Analysis of a Color Painting on Ancient Architecture from Anyuan Temple in Chengde, China. Coatings 2024, 14, 559. [Google Scholar] [CrossRef]
- Chang, J. Raman Spectroscopy Study of Pigments and Dyes in Ancient Murals. Ph.D. Thesis, Jilin University, Changchun, China, 2010. [Google Scholar]
- Zhou, G.X. Cinnabar in China and Its Development in Function. J. Dunhuang Res. 2010, 120, 51–59. [Google Scholar]
- Li, H.; Huang, J.; Yang, K.; Lu, Z.; Yan, S.; Su, H.; Liu, C.; Wang, X.; Ren, B. Operando Electrochemical X-Ray Diffraction and Raman Spectroscopic Studies Revealing the Alkali-Metal Ion Intercalation Mechanism in Prussian Blue Analogues. J. Phys. Chem. Lett. 2022, 13, 479–485. [Google Scholar] [CrossRef]
- Della Ventura, G.; Capitelli, F.; Sbroscia, M.; Sodo, A. A Raman Study of Chalcogen Species in Sodalite-group Minerals from the Volcanic Rocks of Latium (Italy). J. Raman Spectrosc. 2020, 51, 1513–1521. [Google Scholar] [CrossRef]
- Prieto, A.C.; Martínez, O.; Souto, J.; Avella, M.; Guedes, A. Study of a Tabernacle with a Remarkable Architectural Structure: In Situ Examination Using Raman Spectroscopy. J. Raman Spectrosc. 2013, 44, 1156–1162. [Google Scholar] [CrossRef]
- Jorge-Villar, S.E.; Edwards, H.G.M. Green and Blue Pigments in Roman Wall Paintings: A Challenge for Raman Spectroscopy. J. Raman Spectrosc. 2021, 52, 2190–2203. [Google Scholar] [CrossRef]
- Osticioli, I.; Mendes, N.F.C.; Nevin, A.; Gil, F.P.S.C.; Becucci, M.; Castellucci, E. Analysis of Natural and Artificial Ultramarine Blue Pigments Using Laser Induced Breakdown and Pulsed Raman Spectroscopy, Statistical Analysis and Light Microscopy. Spectrochim. Acta Part A Mol. Biomol. Spectrosc. 2009, 73, 525–531. [Google Scholar] [CrossRef]
- Favaro, M.; Guastoni, A.; Marini, F.; Bianchin, S.; Gambirasi, A. Characterization of Lapis Lazuli and Corresponding Purified Pigments for a Provenance Study of Ultramarine Pigments Used in Works of Art. Anal. Bioanal. Chem. 2012, 402, 2195–2208. [Google Scholar] [CrossRef] [PubMed]
- Bruni, S.; Cariati, F.; Casadio, F.; Toniolo, L. Spectrochemical Characterization by Micro-FTIR Spectroscopy of Blue Pigments in Different Polychrome Works of Art. Vib. Spectrosc. 1999, 20, 15–25. [Google Scholar] [CrossRef]
- Wang, J. A Study of Synthetic Ultramarine Pigments in the Dunhuang Caves. J. Dunhuang Res. 2000, 1, 76–81. [Google Scholar]
- Veneranda, M.; Irazola, M.; Díez, M.; Iturregui, A.; Aramendia, J.; Castro, K.; Madariaga, J.M. Raman Spectroscopic Study of the Degradation of a Middle Age Mural Painting: The Role of Agricultural Activities. J. Raman Spectrosc. 2014, 45, 1110–1118. [Google Scholar] [CrossRef]
- Li, L.; Huang, Y.; Wei, S. Analysis and Research on the Architectural Oil Decorations of the Wenyuan Pavilion at the Palace Museum. Museum 2023, 7, 128–136. [Google Scholar] [CrossRef]
- Jiang, J.; Wei, S.; Chen, B. Analysis and Research on the Cementing Materials Used in the Royal Architectural Paintings of the Qing Dynasty. J. Cult. Relics 2020, 5, 89–96. [Google Scholar]
- He, L.; Nie, M.; Giuseppe, C. Analysis of Oil Adhesives in Ancient Murals by Thermal Cracking Gas Chromatography Mass Spectrometry. J. Xi’an Jiaotong Univ. 2006, 40, 1134–1138. [Google Scholar]
- Zhang, X.; Zhao, D.; She, Y.; Hao, Z.; Yan, Y.; Chen, J. Exploring the complex organic matrix composition of oil painting cultural relics using FT-IR, Py GC/MS, and THM Py GC/MS micro damage analysis techniques. Cult. Relics Prot. Archaeol. Sci. 2024, 36, 54–64. [Google Scholar] [CrossRef]
- Wei, S.; Pintus, V.; Pitthard, V.; Schreiner, M.; Song, G. Analytical Characterization of Lacquer Objects Excavated from a Chu Tomb in China. J. Archaeol. Sci. 2011, 38, 2667–2674. [Google Scholar] [CrossRef]
Disclaimer/Publisher’s Note: The statements, opinions and data contained in all publications are solely those of the individual author(s) and contributor(s) and not of MDPI and/or the editor(s). MDPI and/or the editor(s) disclaim responsibility for any injury to people or property resulting from any ideas, methods, instructions or products referred to in the content. |
© 2026 by the authors. Licensee MDPI, Basel, Switzerland. This article is an open access article distributed under the terms and conditions of the Creative Commons Attribution (CC BY) license.