Abstract
In this article, the authors present the results obtained within a complex experimental program that focuses on determining the tribological characteristics of the friction materials used in transmission belts, which are critical active components in manipulators within the pharmaceutical industry. The elements of transmission belts, having the role of ensuring the movement of cardboard packaging—used when packing the foils with medicine capsules—and stopping them during the insertion of the foils, were studied. This repetitive cycle—travel-braking—leads to the wearing of the friction material on the active surface of the belt. The experiments were carried out in a dry environment (air) by testing different types of friction materials (original belt, 3D printed TPU 60A, and TPU 95A). While the study is limited to these three materials, the results highlight the significant influence of material type and infill percentage on the coefficient of friction (COF) and wear resistance. TPU 60A achieved the highest COF at 100% infill, indicating a superior grip but experienced substantial wear, under the same conditions. Conversely, TPU 95A demonstrated a lower COF, suggesting reduced grip, but exhibited exceptional wear resistance. The aim of the research is to provide a preliminary investigation into the materials’ wear resistance and braking effectiveness. The experiments utilized appropriate samples to replicate real operational conditions, particularly focusing on the nature of contact between the moving belt and the packaging.
1. Introduction
The pharmaceutical industry is reliant on precise and efficient packaging systems to ensure product quality and safety. Manipulators equipped with transmission belts play an essential role in this process, particularly for handling the cardboard packaging used for medicine capsules. The functionality of these belts, which perform repetitive travel-braking cycles, is critical for maintaining operational efficiency. Is important to specify that these cycles subject the active surfaces of the belts to significant wear, especially in dry conditions. Consequently, selecting appropriate friction materials that balance wear resistance and effective braking is essential for ensuring system reliability and longevity.
The tribological behavior of materials in dry conditions has been extensively studied due to its critical role in various industrial applications. Li and Lee [1] investigated the surface durability of 3D printed gears made from different materials, highlighting the importance of material selection in wear-intensive environments. Similarly, Hanon et al. [2] explored the impact of 3D printing structures on the tribological properties of polymers, emphasizing the influence of printing parameters on friction and wear.
In the context of thermoplastic polyurethanes (TPUs), several studies have provided valuable insights. The research [3] aims to optimize FFF Thermoplastic Polyurethane (TPU) parts’ dimensional accuracy by adjusting three key process parameters: Layer Thickness (LT), Infill Density (ID), and Printing Speed (PS). The study of Garg et al. [4] focuses on fabricating a thermoplastic polyurethane for journal-bearing applications using Fused Deposition Modeling (FDM). Cylindrical samples were prepared using central composite design to evaluate the impact of FDM parameters (layer thickness, infill density, and printing speed) on the specific wear rate (SWR), coefficient of friction (COF), and hardness. Layer thickness was found to be the most influential parameter. The lowest COF and SWR, and the highest hardness, were achieved at the highest infill density and lowest printing speed.
Hasdiansah et al. [5] optimizes FDM 3D printing parameters to improve the surface roughness of TPU prints. Using the L27 Taguchi method, key parameters like layer thickness, flow rate, and print speed were analyzed. The results show that layer thickness significantly impacts surface roughness, contributing 65.11%. The study highlights layer thickness as the optimal parameter for improving print quality in industrial TPU applications.
Fenollosa-Artes et al. [6] conducted a preliminary study on the soft 3D printing of TPU, revealing its versatility for applications requiring flexibility and durability.
The incorporation of surface treatments or post-processing techniques, such as annealing, can significantly influence the tribological behavior of materials, as evidenced in the study [7] on 3D printed carbon-reinforced ABS composite cylindrical gears. The results reveal that both COF and wear are affected by printing and annealing temperatures. Moderate printing temperatures and lower annealing temperatures were observed to minimize both friction and wear. Among these factors, annealing temperature had a more pronounced effect on wear. The wear behavior of TPU in contact with abrasive surfaces has also been a subject of research. Sato et al. [8] examined the dry sliding friction and wear characteristics of TPU against abrasive paper, providing insights into its performance under conditions similar to those in packaging systems. Sharma et al. [9] investigated the wear rate of FDM-printed TPU, ASA, and multi-material parts, highlighting the advantages of TPU for applications demanding high wear resistance.
Studies on TPU have shown that environmental factors such as moisture, temperature, and UV exposure significantly affect its friction and wear properties. One study [10] focused on hygrothermal aging, revealing that water absorption caused plasticization, reducing the material’s mechanical cohesion and wear resistance. Friction tests showed a decrease in the friction coefficient, while hardness increased with aging. Another study [11] examined the effects of hygrothermal and UV aging on TPU, noting that water absorption lowered the glass transition temperature and decreased the material’s elastic modulus and wear resistance. UV exposure also caused similar damage, reducing TPU’s durability.
Studies on other polymers have further contributed to the understanding of tribological properties. Dangnan et al. [12] analyzed the friction and wear of additive-manufactured polymers in dry contact, while Zhiani Hervan et al. [13] focused on the hardness and wear characteristics of 3D printed PLA. These studies underscore the significance of optimizing material properties for specific applications.
Hybrid materials or composites present a promising pathway for achieving a superior balance between friction and wear resistance, as demonstrated by several studies. For instance, the work [14] illustrates the benefits of reinforcing neat PEEK with 10 wt% carbon fibers in improving its tribological performance. This hybrid material exhibited reduced abrasive and adhesive wear mechanisms compared to neat PEEK, as the inclusion of carbon fibers shifted the dominant wear mode to fiber–matrix debonding and delamination. Similarly, Ref. [15] highlights how the integration of minimal graphene content (up to 0.1 wt%) into PETG significantly enhances sliding wear properties, reducing the coefficient of friction and wear rates. While the optimal graphene composition for minimizing the specific wear rate was 0.04 wt%, the increased graphene content improved the coefficient of friction, suggesting that a tailored approach to graphene loading could optimize both wear and frictional performance for specific applications.
Further, Ref. [16] reveals how incorporating graphite into PLA filaments at 20% by weight improves wear resistance and lowers the coefficient of friction. The study underscores the importance of selecting the appropriate percentage of filler material to achieve desired tribological outcomes. In addition to polymeric materials, the tribological behavior of belt transmission systems has been investigated in various contexts. Childs [17] and Meng and Yao [18] provided comprehensive overviews of belt and chain drives, including their design and performance factors. Krol et al. [19] explored the modernization of belt transmission systems, emphasizing the impact of environmental and manufacturing conditions on reliability. Kremer et al. [20] examined the influence of these factors on the lifetime and reliability predictions for timing belts, offering valuable perspectives for the optimization of transmission systems.
Interactive design approaches have also been employed to enhance the performance of belt systems. Fuwen et al. [21] presented a creative case of synchronous belt drive design, demonstrating the potential of additive manufacturing for achieving improved performance. Sniehotta [22] highlighted the use of 3D printing for designing belt wheels, showcasing the feasibility of integrating additive manufacturing into mechanical design processes.
To enhance the material selection process, machine learning models and optimization algorithms can be integrated into the existing framework to predict the ideal material–infill combinations [23]. Machine learning techniques, such as regression models or neural networks, could be trained on datasets that include various material properties (e.g., strength, elasticity) and infill parameters (e.g., density, pattern types), enabling the prediction of optimal combinations for specific applications [24,25].
While prior research has provided valuable insights into the tribological properties of polymers and composites, there is a noticeable gap in the application of these findings to packaging manipulator systems. Specifically, the suitability of 3D printed TPU materials as a cost-effective alternative to conventional belt materials remains underexplored. Additionally, no studies have comprehensively evaluated the tribological performance of TPU belts under realistic operational conditions that simulate their use in pharmaceutical packaging.
This study aims to address these gaps by conducting a detailed experimental investigation into the tribological characteristics of different friction materials used in transmission belts. Specifically, the research explores the wear resistance and COF of three materials, the original belt, 3D printed TPU 60A, and TPU 95A, under operational conditions that closely replicate real-life usage. The findings provide valuable insights into the suitability of these materials for use in pharmaceutical manipulators, focusing on material performance in terms of both friction and wear. The major application of this work lies in improving the design and functionality of the transmission belts used in pharmaceutical packaging systems.
In addition, through research conducted on materials different from those provided by the manufacturer, the authors of the article aim at the following two important objectives:
- -
- Finding cheap materials for the studied applications (carton packaging manipulator belts);
- -
- Finding cheap and efficient technologies to produce manipulator belts (in this case, 3D printing technology was tried).
2. Materials and Methods
This article studies the transmission belts used in the case of the equipment used to package medicines in the form of coated tablets in cardboard boxes (Figure 1). The belt has a support area provided with a metal insert, over which a silicone friction layer is applied. Their role is to brake the cardboard boxes in order to insert the foils into them. In the next step, the belt will move the box on the conveyor belt so that the cycle can be repeated.
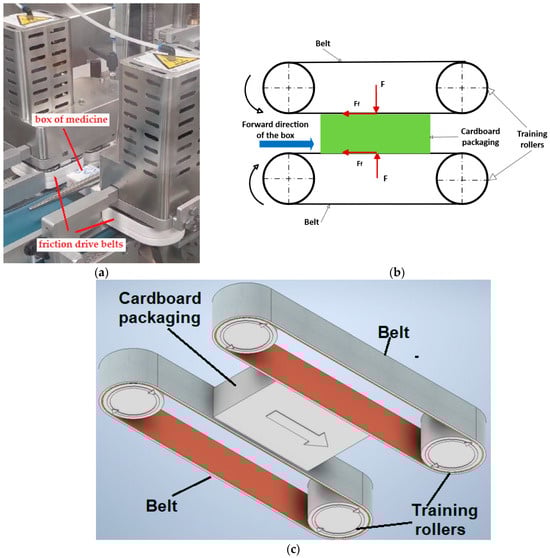
Figure 1.
Application of drive belts in pharmaceutical industry: (a) real photo; (b) 2D schematic view, F—pressing force (for braking), Ff—friction force; (c) 3D schematic view.
The industrial parameters used for the real couple belt–medicine box were the following:
- -
- Peripheral speed of friction belt = 65 m/min = 1.08 m/s;
- -
- The number of cycles = 1,300,000 rotations (it is known that the belt is replaced every 4 months due to advanced wear, during which time 2,600,000 boxes of medicine are produced; it is also considered that for each box driven, the belt rotates half a turn);
- -
- The surface area of a main box face = 120 × 70 mm2;
- -
- Maximum brut mass of a fully box = 20 g.
The last two parameters were necessary to determine the normal direction of the compressive force in relation to the area of the main face during the experimental (tribological) tests.
In terms of use, friction belts use different materials. Common friction materials include rubber, polyurethane, and advanced composites, each suited to specific applications such as automotive systems, food processing, and industrial equipment.
The intention of the authors was to identify the materials compatible with the presented application that is to present characteristics corresponding to the greatest durability of the belts, appreciated by a rate of wear as low as possible.
Since the applications developed by the authors aim to develop a method of manufacturing belts using 3D printing, the selected materials are part of the category of those that can usually be subjected to such a manufacturing process.
2.1. 3D Printed Specimens
For the experimental study, 12 cube samples were printed, from materials TPU 60A and TPU 95A, considering two infill percentage, namely 70% and 100%. The characteristics of materials [26,27] are presented in Table 1 and Table 2.

Table 1.
Characteristics of TPU 95A material.
Table 2.
Characteristics of TPU 60A material.
The working parameters for 3D Printer, Model Artillery Sidewinder X4 Plus (Figure 2) are presented in Table 3.
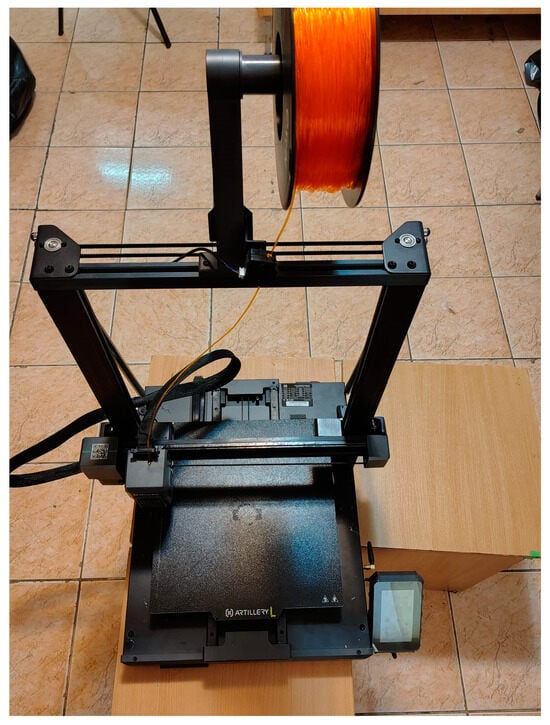
Figure 2.
3D printer used for fabricating friction material samples.
Table 3.
Characteristics of 3D printer.
2.2. Tribological Testing
The coefficients of friction were measured using a pin-on-disc tribometer (CSM Instruments, Freiburg in Breisgau, Germany) (as seen in Figure 3a). The friction pair consisted of a 20 mm diameter disc sample of cardboard material and the 4 mm cub from the transmission belt material. Furthermore, the tribological tests were performed under the following conditions: a normal load of 0.5 N comparable to a pressing force cube of 0.38 N, a friction distance of 200 m, and a linear speed of 0.1 m/s. For the tests, a speed 10 times lower than the real speed was adopted to avoid the rejection effect, due to the frictional force between the pin and the disk.
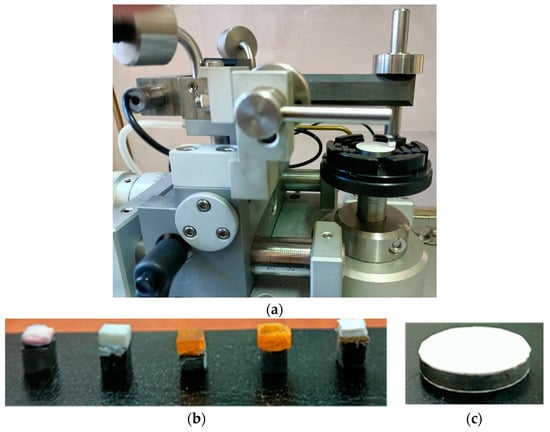
Figure 3.
Tribological testing: (a) experimental device used to determine the sliding coefficient of friction; (b) testing samples pin-type of different materials, from the left they are the following: 60A—70%, 60A—100%, 95A—70%, 95A—100% and real belt; (c) cardboard sample.
In order to respect the similarity ratio between the value of the load applied in the tests and the real value, the following were considered:
- -
- To an area of 120 × 70 mm2 corresponds a mass of 20 g, then to an area of 4 × 4 mm2 corresponds a mass of 16 × 20/120 × 70 = 0.038 g;
- -
- A normal pressing force on the cube = 0.038 × 10 = 0.38 N.
All tests were performed at room temperature (23 °C) in ambient air with 54% relative humidity. The coefficient of friction (μ) was calculated as the ratio of the tangential friction force to the normal force [7,28,29]. For all tested materials, three friction pairs were tested. Continuous measurements were recorded, with an acquisition rate of 9.5 Hz.
The pin-type samples had a cubic shape with a 3.97 mm side, obtained by 3D printing and, in the case of the sample extracted from the unused real belt, by manual cutting. Each pin sample was glued with a strong adhesive to a metal cube of the same side length (Figure 3b).
The paired sample of the pair of materials allocated for the tests is the 25 mm diameter disk cardboard, taken from the real box, by scissor cutting. These samples were glued to a metal disk of the same diameter, 3 mm in thickness (Figure 3c).
The cube and disk, which serve as the metal support, were made by chipping on a milling machine, respective lathe.
2.3. Statistical Analysis
The statistical analysis was conducted using Minitab 19 software, which enabled the evaluation of the effects of the material type and infill percentage on two key performance metrics: the coefficient of friction (COF) and mass loss. A factorial design was employed to assess the main effects and interactions between the two factors: material type (60A and 95A) and infill percentage (70% and 100%).
Main effects plots were generated to visualize the individual impact of each factor on the performance metrics, while interaction plots were used to examine how the two factors influenced each other. These plots helped identify trends and relationships between the material types and infill percentages in relation to COF and mass loss.
Further, analysis of variance (ANOVA) was conducted to determine the statistical significance of the factors and their interactions. The ANOVA results allowed for the identification of factors that significantly affected the COF and mass loss, aiding in the understanding of their contributions to the observed performance.
In order to identify the best combination of material type and infill percentage for both maximizing the coefficient of friction (COF) and minimizing mass loss, a desirability analysis was carried out using Minitab 19. This approach combines the objectives of maximizing one response (COF) while minimizing the other (mass loss) into a single optimization goal.
The desirability function is a mathematical approach that converts each response variable into a desirability scale ranging from 0 to 1, where 1 represents the most desirable outcome and 0 represents the least desirable outcome. In this case, the desirability for COF was maximized, while the desirability for mass loss was minimized.
To perform the analysis, individual desirability functions for both COF and mass loss were computed. The desirability function for COF was set to maximize the value, meaning higher COF values received higher desirability scores. Conversely, the desirability function for mass loss was set to minimize the value, where a lower mass loss resulted in higher desirability scores.
These individual desirability functions were then combined to generate a composite desirability score for each material and infill combination. This composite desirability score, which ranges from 0 to 1, reflects the overall suitability of each material infill combination in terms of both frictional performance and wear resistance.
The optimization process in Minitab 19 used these desirability scores to identify the optimal material type and infill percentage combination. The resulting optimal combination was the one that produced the highest composite desirability score, indicating the most balanced trade-off between achieving maximum COF and minimum mass loss. This approach provided a robust solution for selecting the most effective material and infill parameters for applications such as belt drives in the pharmaceutical industry.
3. Results and Discussion
3.1. Results Regarding Coefficient of Friction
Table 4 and Figure 4 present the values of the coefficient of friction obtained for the contact between the cardboard and pieces from the original belt, respectively, for different 3D printed samples from materials 60AA/95AA with a 70%/100% infill percentage.
Table 4.
Experimental results for coefficient of friction.
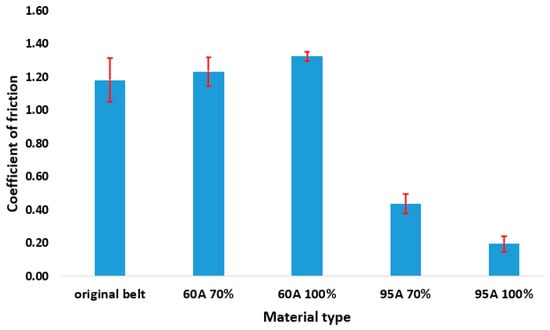
Figure 4.
The values of coefficients of friction.
The original belt exhibits a high coefficient of friction, with a mean value of 1.182. This indicates a strong grip on the cardboard. However, the relatively large standard deviation of 0.131 reveals noticeable variability in its performance across different tests.
For the 60A material at a 70% composition, the average coefficient of friction is slightly higher, at 1.233. This suggests a comparable level of grip to the original belt. Additionally, the standard deviation of 0.087 indicates better consistency in performance. When the 60A composition increases to 100%, the coefficient of friction reaches its peak with an average of 1.325. This makes it the grippiest material in the study, and its very low standard deviation of 0.027 highlights very good consistency.
In contrast, the 95A materials demonstrate significantly lower coefficients of friction. The 70% composition exhibits a mean value of 0.436, reflecting a reduced grip compared to the original belt and the 60A materials. However, its standard deviation of 0.059 points to stable performance across the tests. The 100% composition of 95A shows the lowest coefficient of friction, with an average value of 0.195, making it the least grippy option. Despite this, its standard deviation of 0.048 highlights reliable and consistent behavior.
3.2. Results Regarding Mass Loss
Table 5 and Figure 5 present the mass loss values for the tested samples (original belt and 3D printed samples from materials 60A/95A with 70%/100% infill percentage).
Table 5.
Experimental results for mass loss.
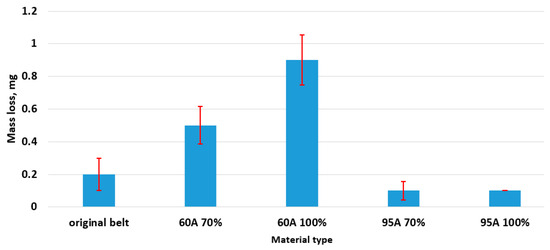
Figure 5.
Mass loss values for tested materials.
The lower wear at lower filling degrees is attributed to the lower rigidity of the deposited material, so that under the action of the pressing force on the cardboard support, the friction material of the belt deforms elastically, thus reducing the contact loads between the elements of the coupling friction. The higher degree of filling in the 3D printing process ensures a higher rigidity of the element made of anti-friction material, which has the effect of a greater pressure on the contact surfaces of the friction coupling.
3.3. Correlation Between Coefficient of Friction and Mass Loss
For a better understanding of the correlation between the coefficient of friction and mass loss of tested specimens, the measured values are presented in the same chart as seen in Figure 6.
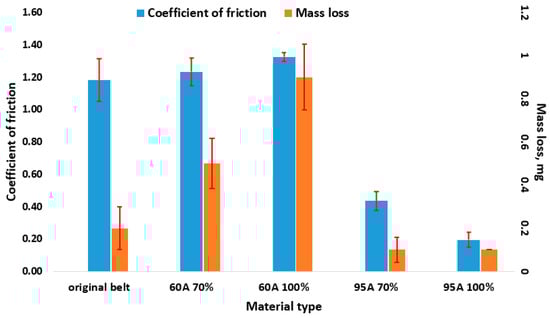
Figure 6.
Coefficient of friction and mass loss of drive belt materials against cardboard.
The original belt exhibits a high level of friction with the cardboard, which suggests a strong grip, accompanied by moderate material wear. Moving to the 60A material with 70% composition, the friction remains comparably high, slightly lower than the original belt, but the material exhibits significant wear, indicating a trade-off between grip and durability. When the composition of 60A increases to 100%, the friction reaches its peak, making it the grippiest option; however, this comes at the cost of the highest material wear, which may limit its longevity in practical applications.
In contrast, the 95A material demonstrates much lower friction levels, reflecting a reduced grip on cardboard. The 70% variant has minimal wear, while the 100% variant shows the least wear of all tested materials. These characteristics indicate excellent durability, although the reduced friction may pose challenges in maintaining the secure transportation of cardboard products.
For the pharmaceutical industry, selecting the appropriate material involves balancing grip and wear. High-friction materials like 60A provide a strong grip but require more frequent replacement due to wear, while the 95A materials, with their durability and minimal wear, might require supplementary measures to prevent slippage.
When compared to elastomeric materials such as silicone rubber, TPU materials show a more balanced performance for applications requiring both friction and wear resistance. According to the study [30], on the tribological behavior of bare silicone rubber, its COF started at approximately 2.1 and increased to 2.3 after 250 cycles, stabilizing around 2.25 after 2000 cycles. By contrast, silicone rubber specimens coated with silicone powders exhibited significantly lower COF values, ranging from 0.60 to 0.74, with minimal variation across cycles. These coated specimens demonstrated a 70% reduction in COF compared to bare silicone rubber.
Regarding composite materials, data from the study [31] reveal that CFRP composites demonstrate good tribological performance under varying loads, sliding speeds, and distances. The COF values range from 0.312 to 0.445, depending on experimental parameters, with lower COF values observed at higher loads (e.g., 110 N). For instance, a load of 110 N and a sliding speed of 300 rpm resulted in a COF of 0.312, while a load of 50 N and a sliding speed of 400 rpm yielded a COF of 0.393. Specific wear rates (SWRs) were minimal, ranging from 0.0000119 mm3/Nm to 0.000039 mm3/Nm, indicating high wear resistance under dry sliding conditions. TPU 95A, with a COF of 0.436, aligns closely with CFRP materials in terms of tribological performance, making it suitable for applications requiring flexibility alongside wear resistance.
In addition to exploring virgin TPU materials, the potential use of recycled TPU filament presents a promising avenue for enhancing the sustainability of this application. Recycled TPU is derived from reprocessed TPU waste, offering an environmentally friendly alternative without significantly compromising its flexibility, wear resistance, and durability. By utilizing recycled TPU, material waste can be minimized, and resource conservation achieved, aligning with the broader goals of sustainable development [32,33,34]. Future studies could evaluate the tribological performance of recycled TPU under the same conditions to establish its viability as a sustainable replacement in pharmaceutical packaging systems.
Cyclic loading and fatigue testing over extended periods significantly influence the performance of materials used in applications requiring repetitive motion, such as the transmission belts in pharmaceutical packaging systems. For instance, repeated travel-braking cycles induce mechanical stress and wear, potentially leading to material degradation, including crack propagation, surface delamination, or plastic deformation. Including extended cyclic loading tests in future studies would provide deeper insights into the long-term reliability and lifespan of these materials, helping optimize their selection and design for specific applications. Such investigations could also identify potential failure modes and guide the development of more robust materials or composite solutions for high-cycle environments.
Additive manufacturing offers extensive customization opportunities for specialized pharmaceutical applications, particularly in the design and production of transmission belts and other components used in packaging systems. For instance, additive manufacturing enables the precise tailoring of material properties, such as flexibility, friction, and wear resistance, by adjusting infill patterns, densities, and material compositions. This level of customization is essential for optimizing the performance of components subjected to repetitive travel-braking cycles in pharmaceutical packaging. Additionally, advanced techniques such as multi-material printing and gradient structures can be utilized to create belts with localized reinforcement, balancing grip and durability. For example, a single belt could be designed with high-friction zones to ensure effective braking and low-wear regions to extend the component’s lifespan. These design features are challenging to achieve using traditional manufacturing methods.
3.4. Microstructural Characterization of Analyzed Samples
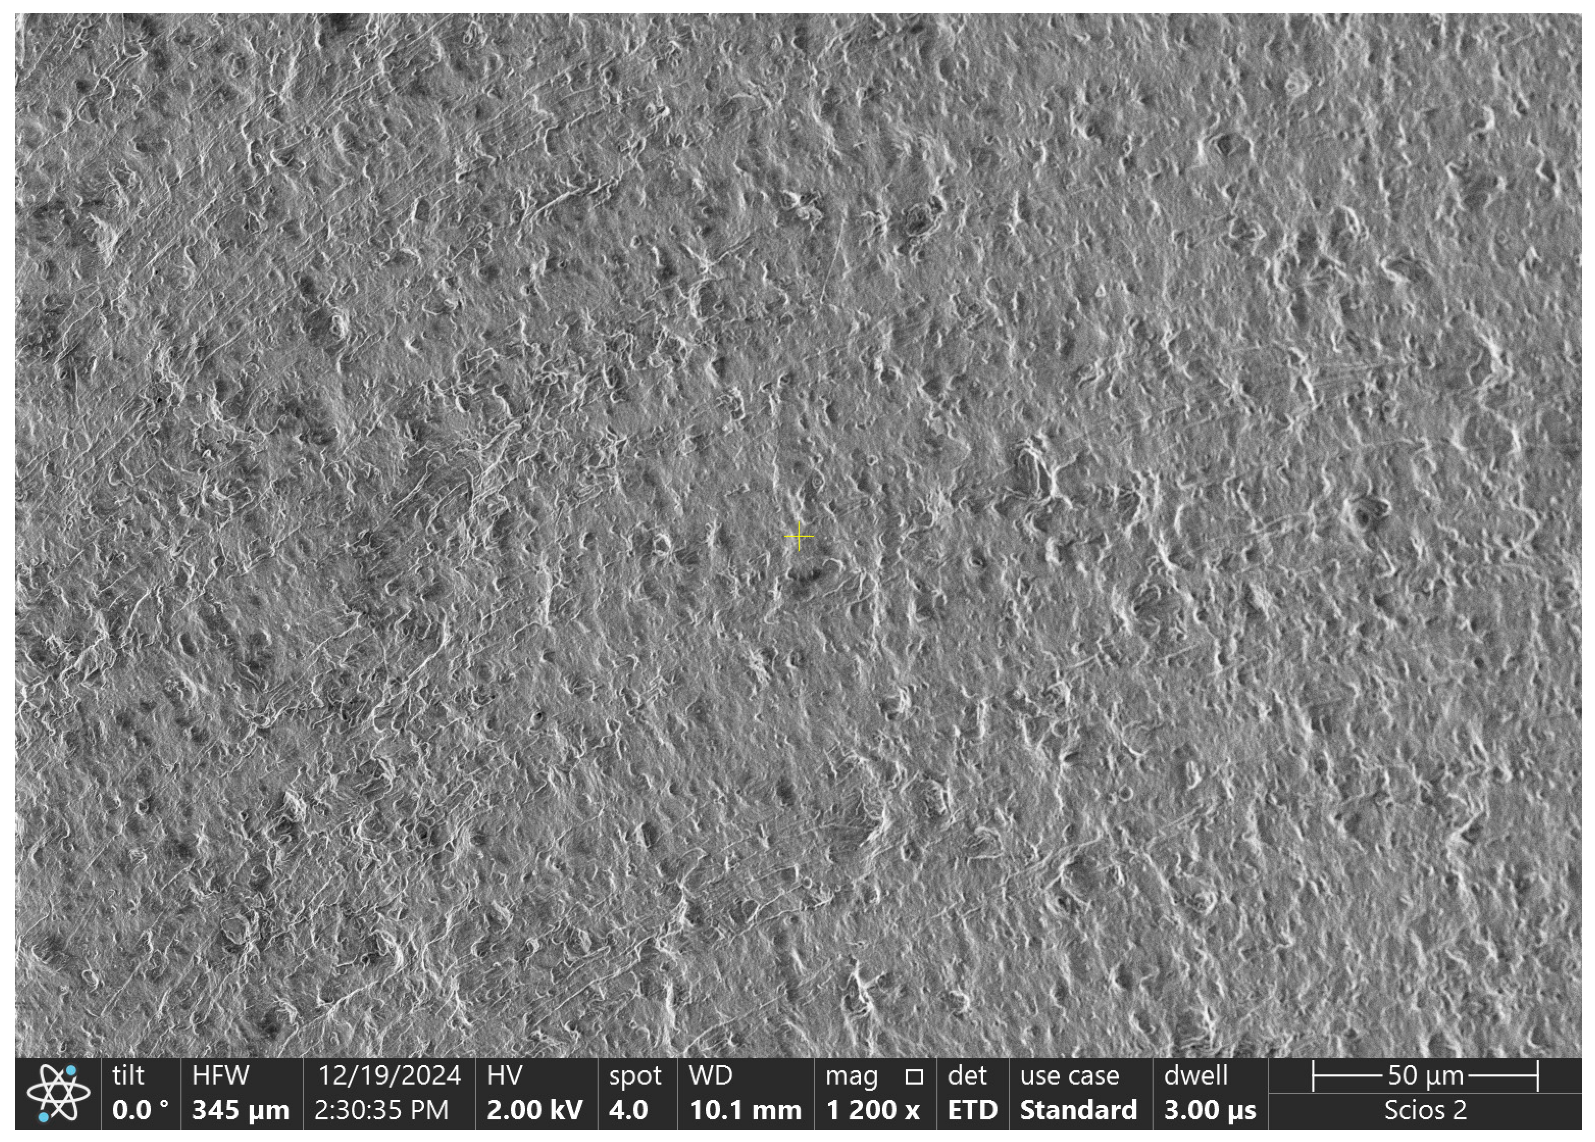
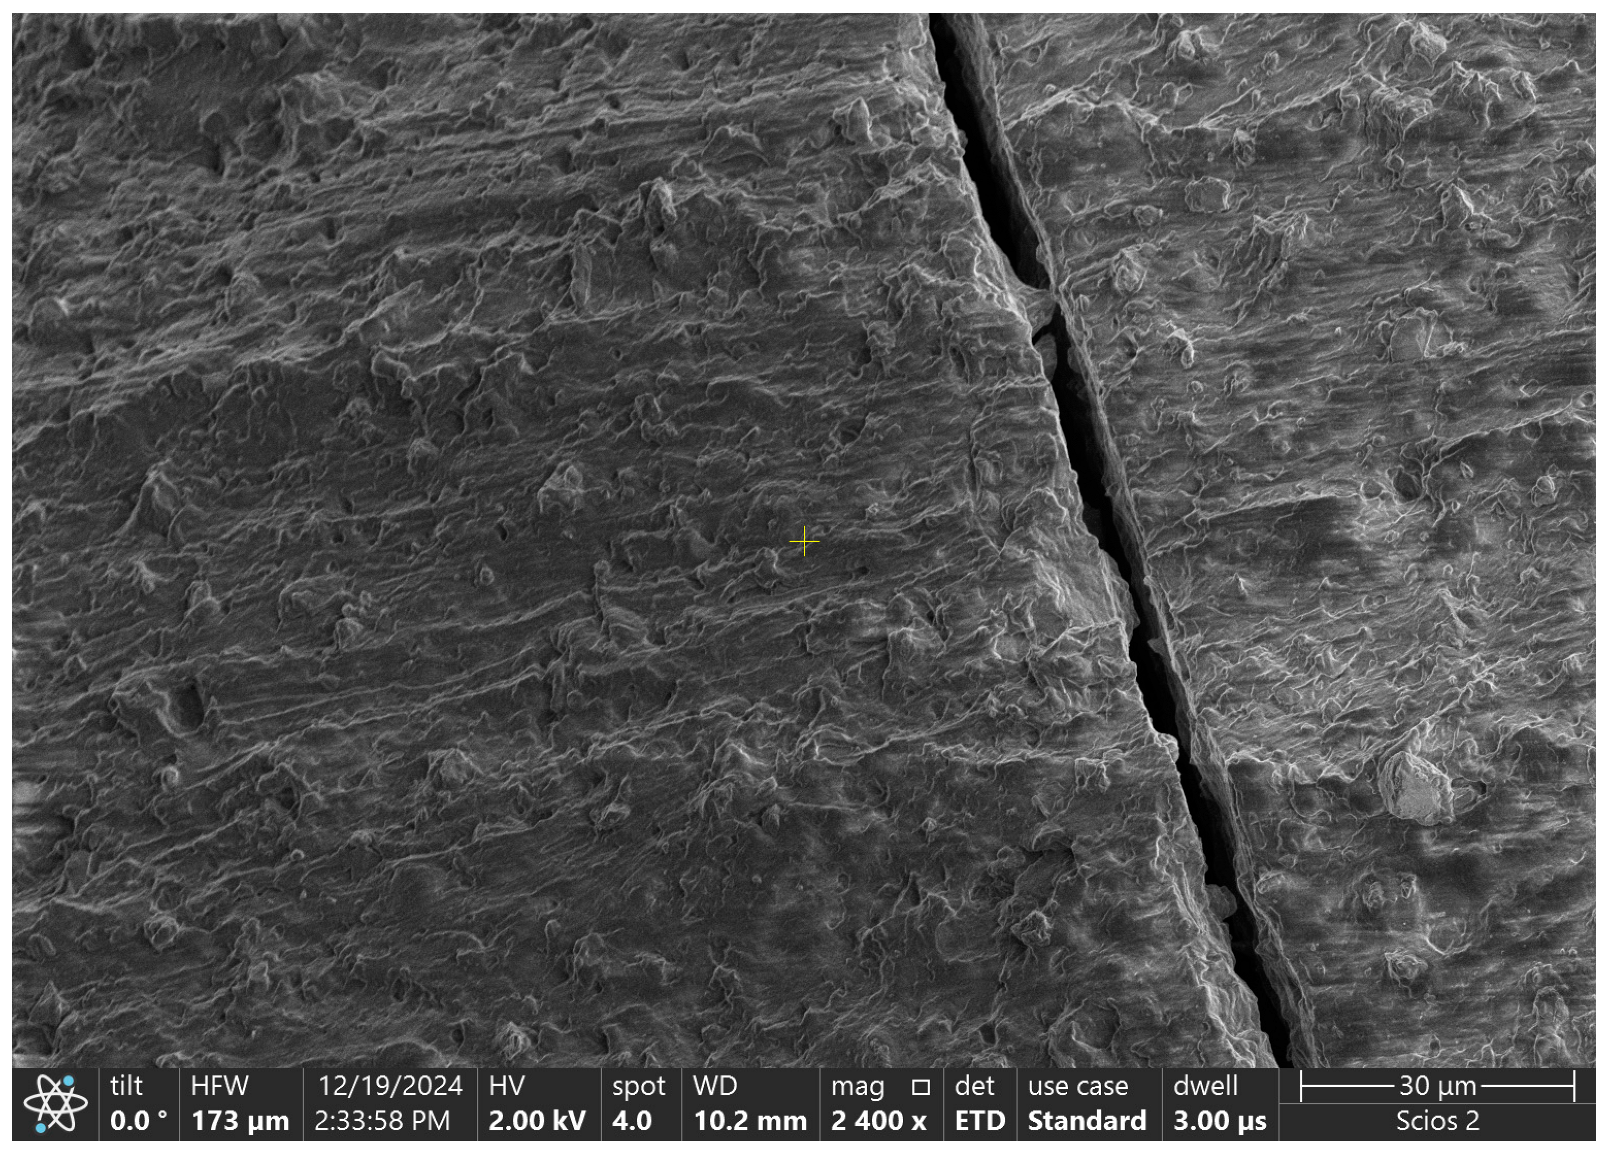
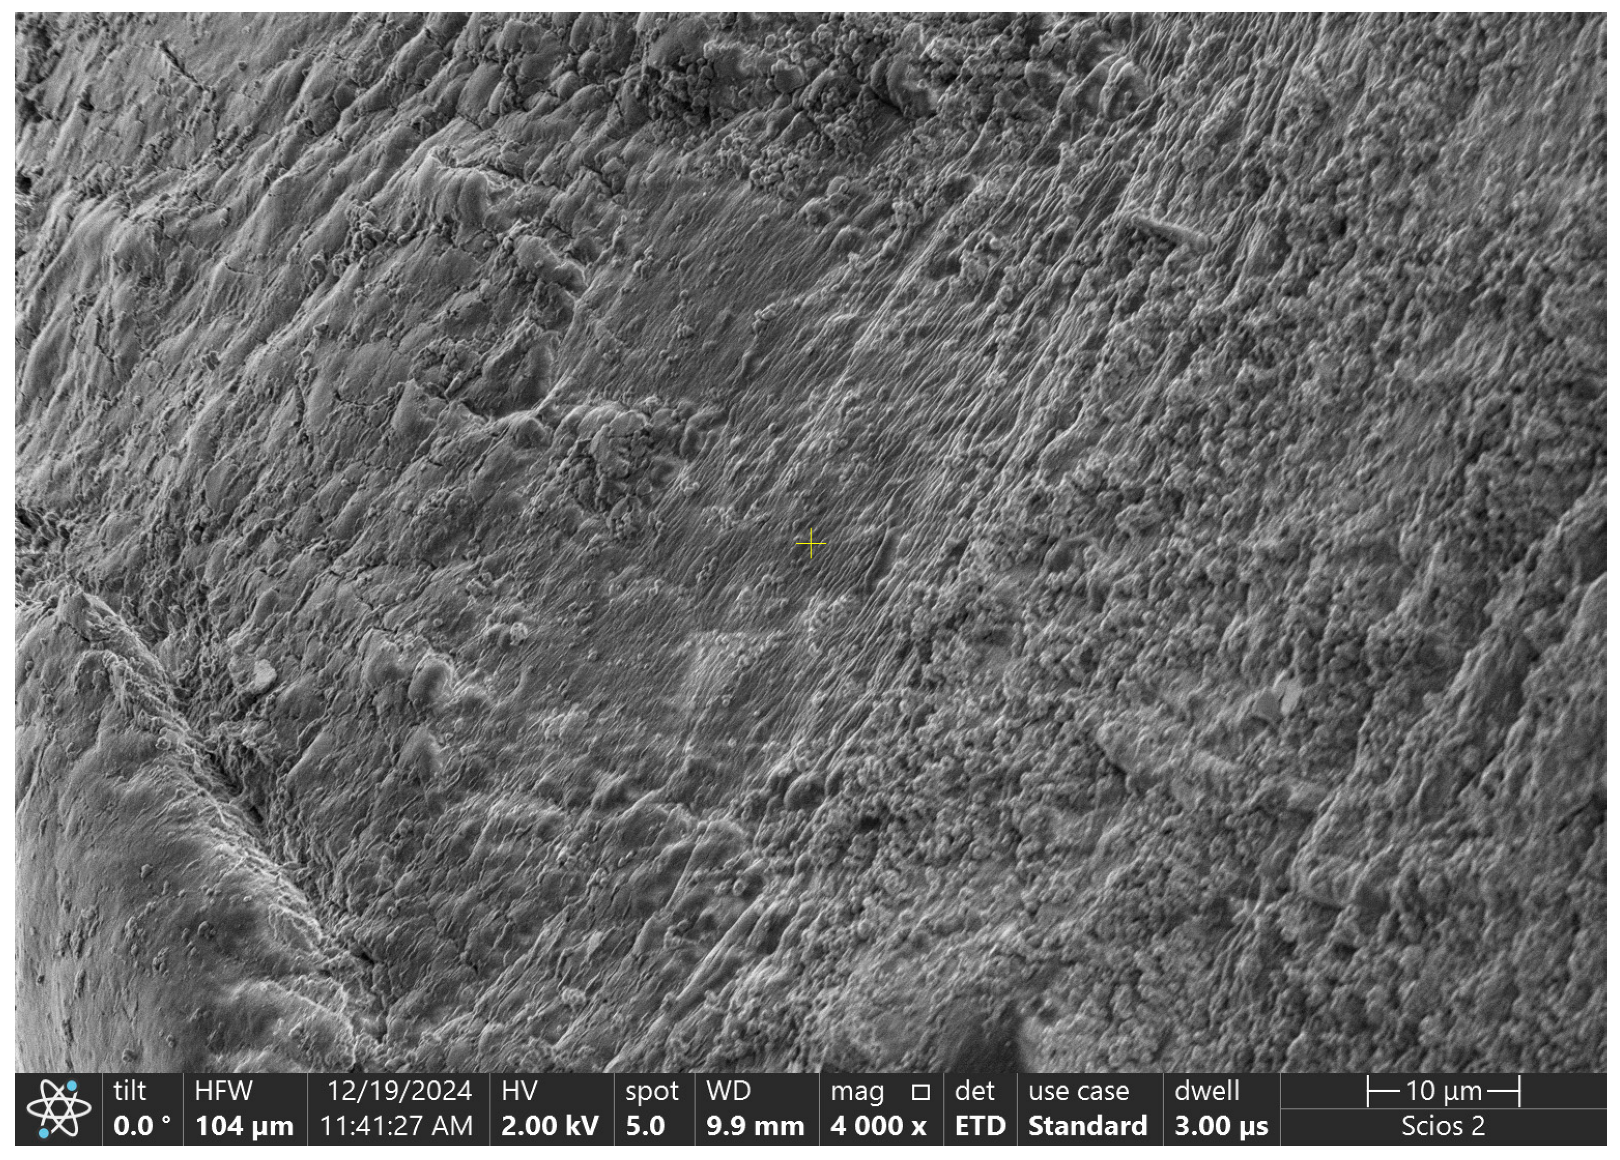
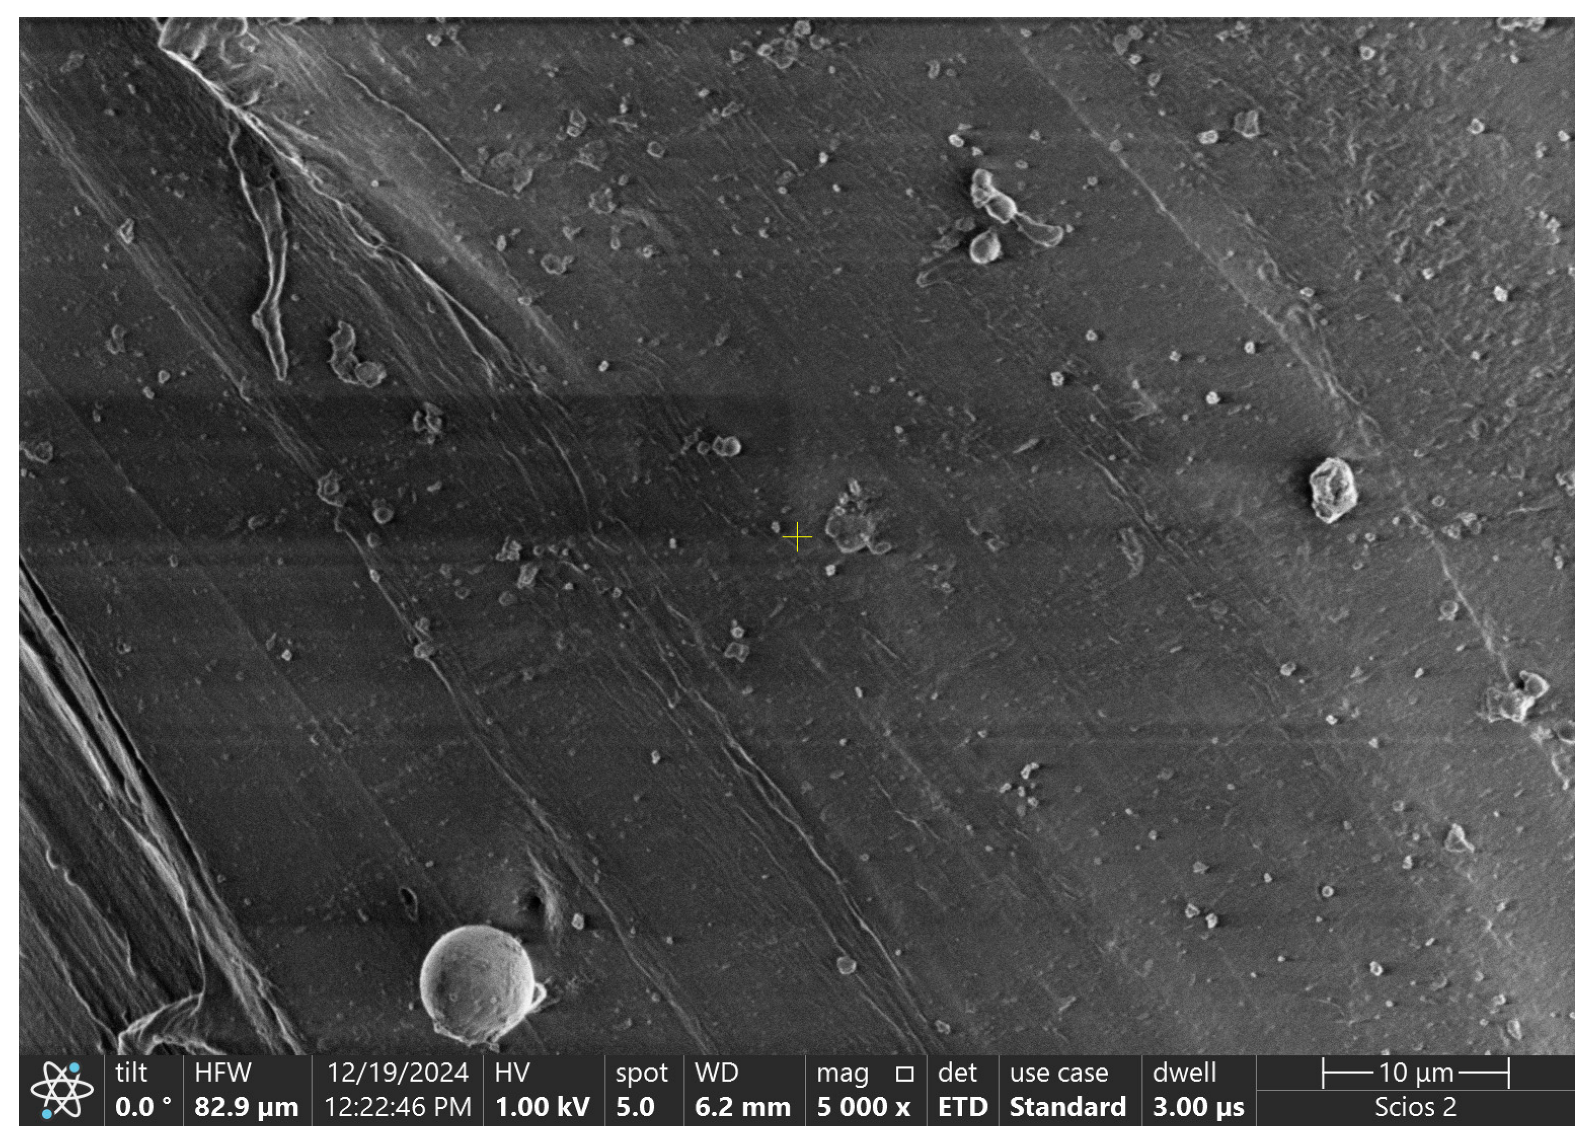
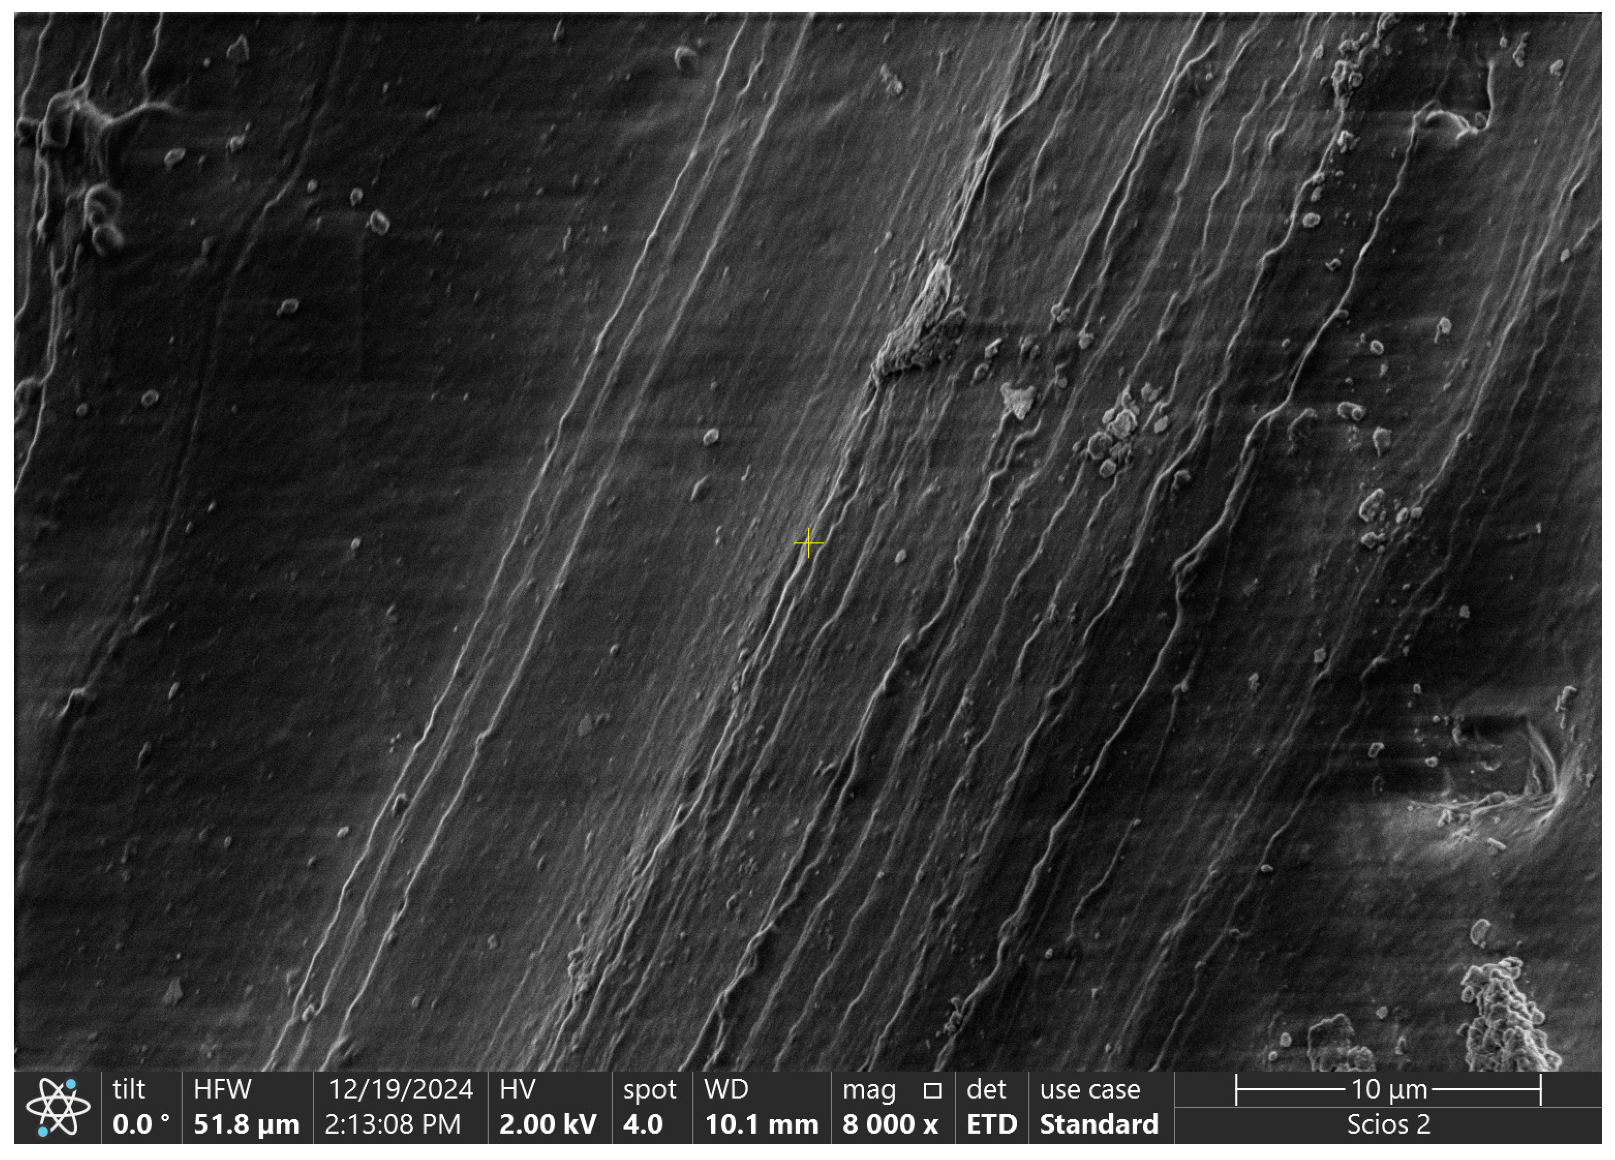
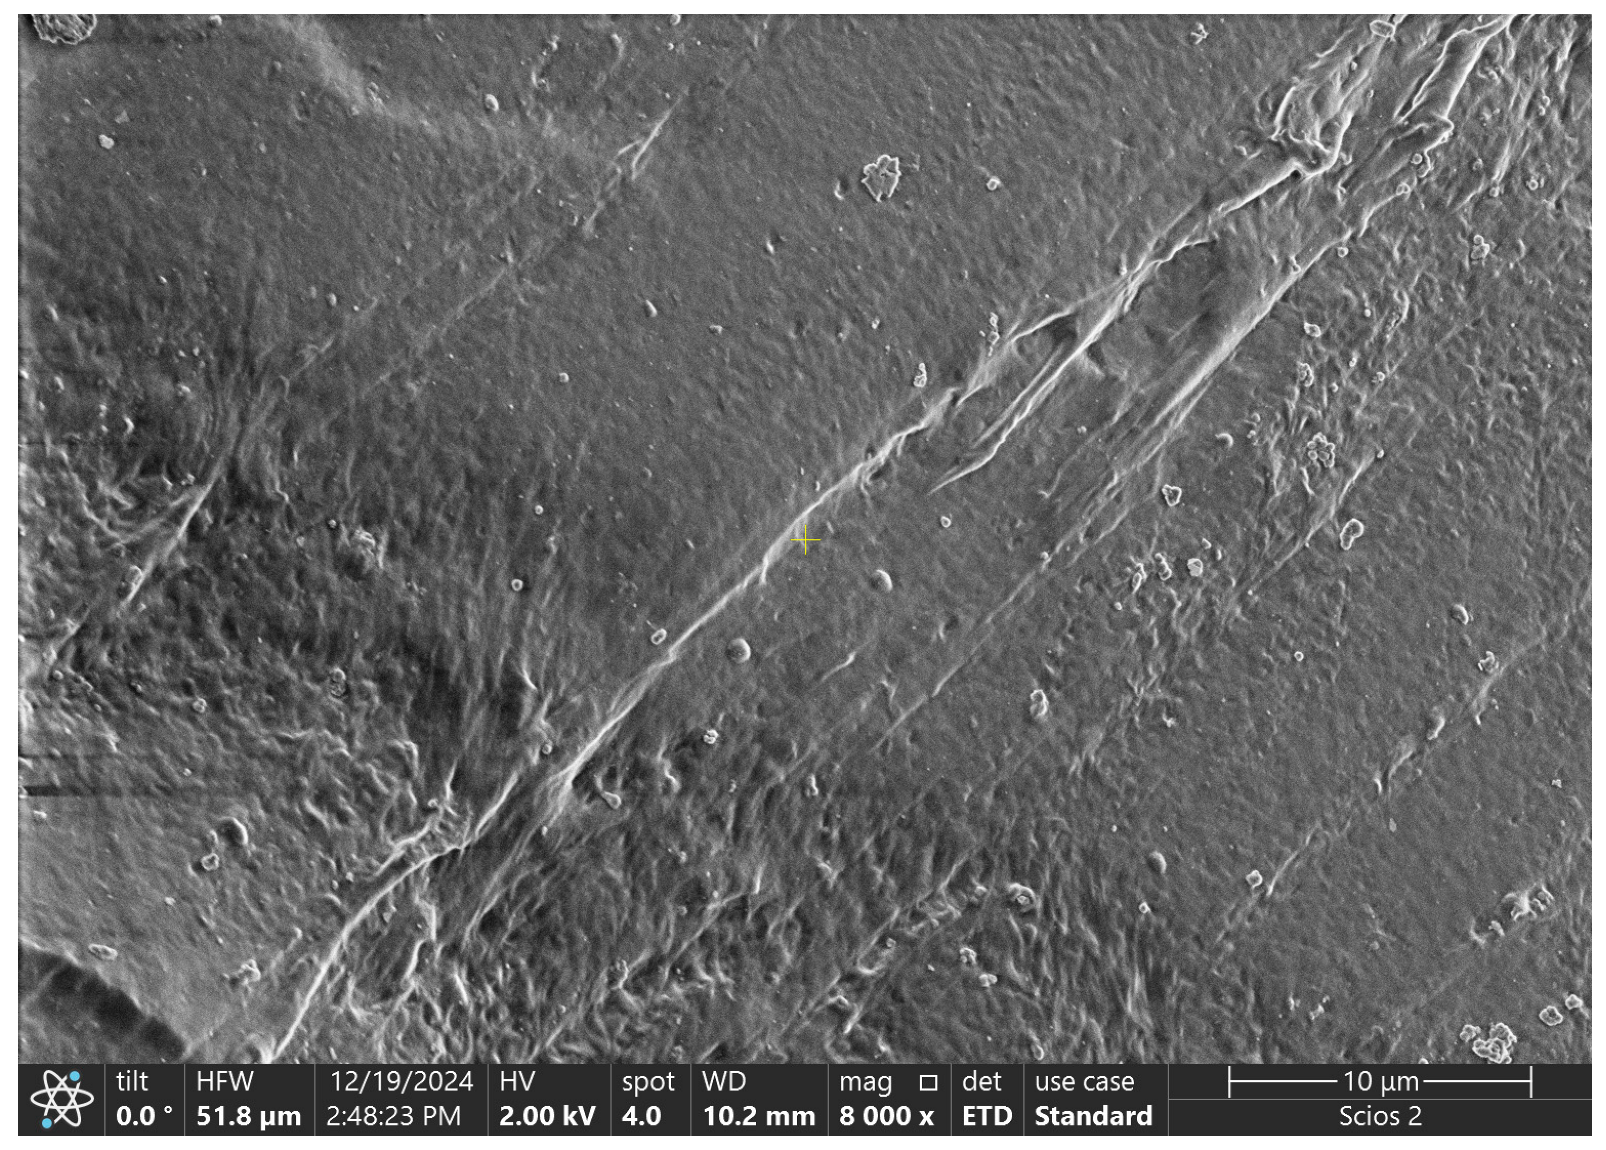
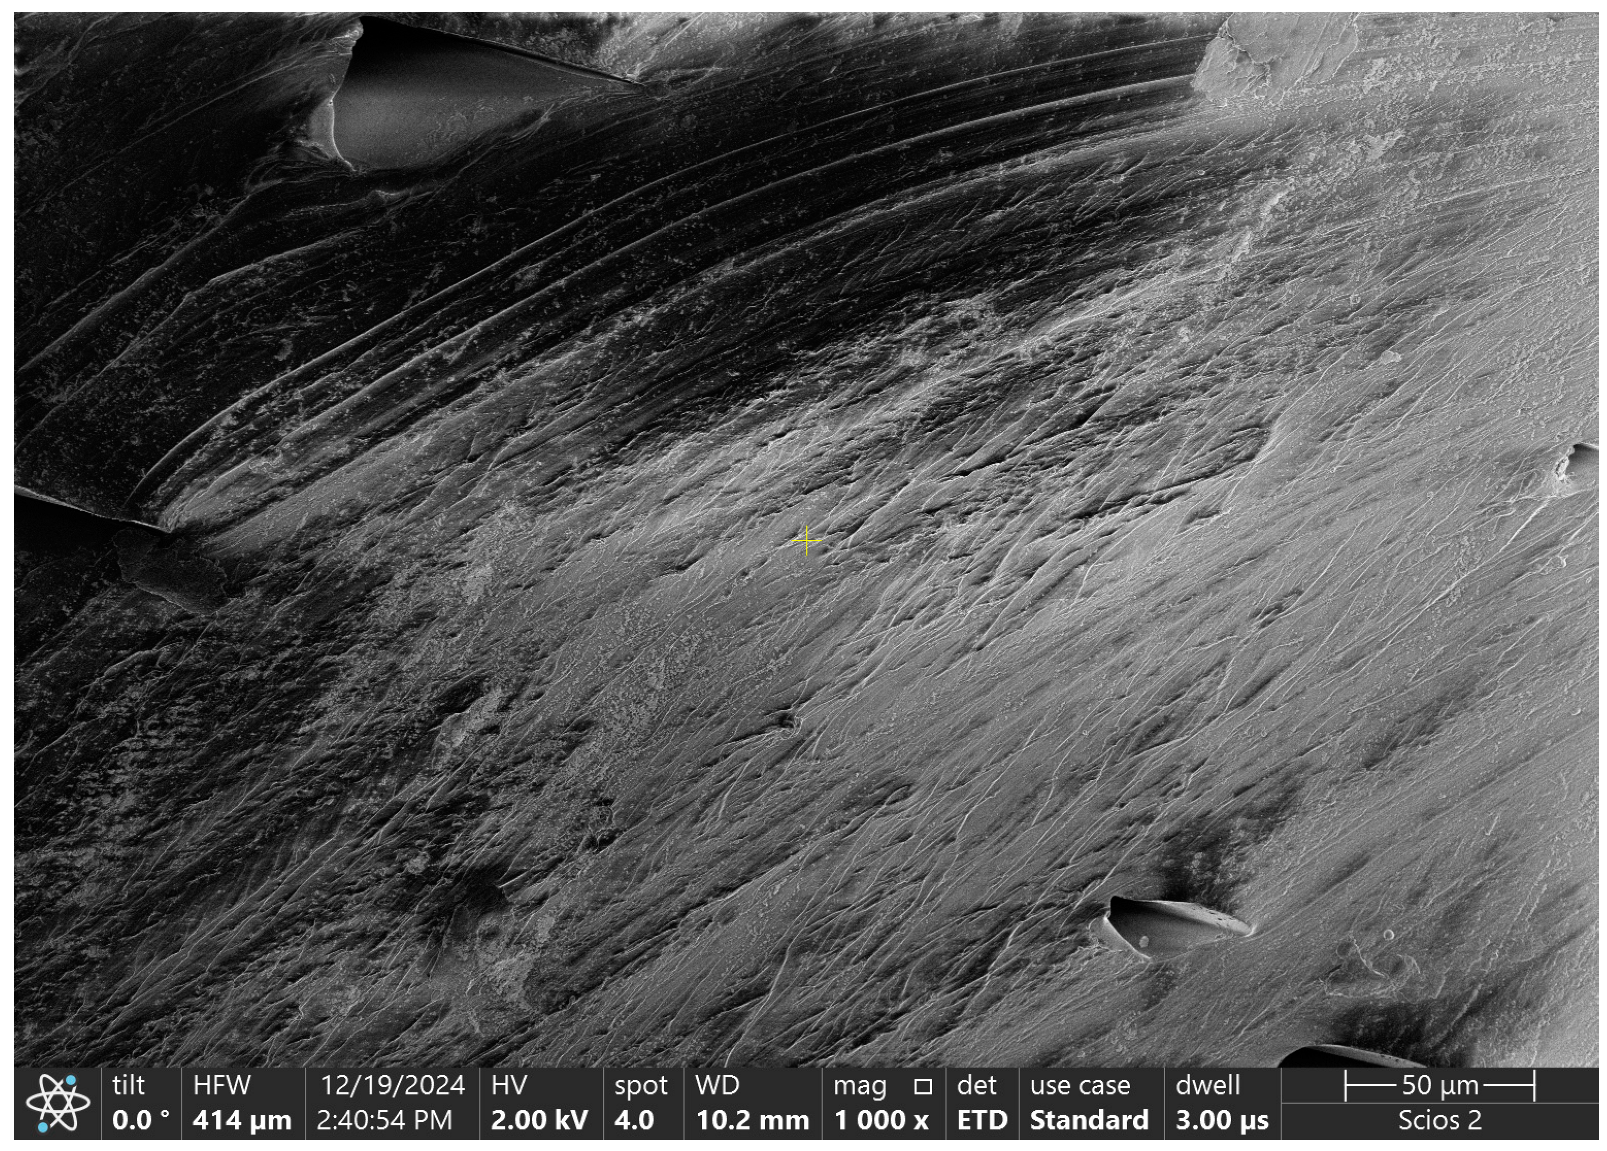
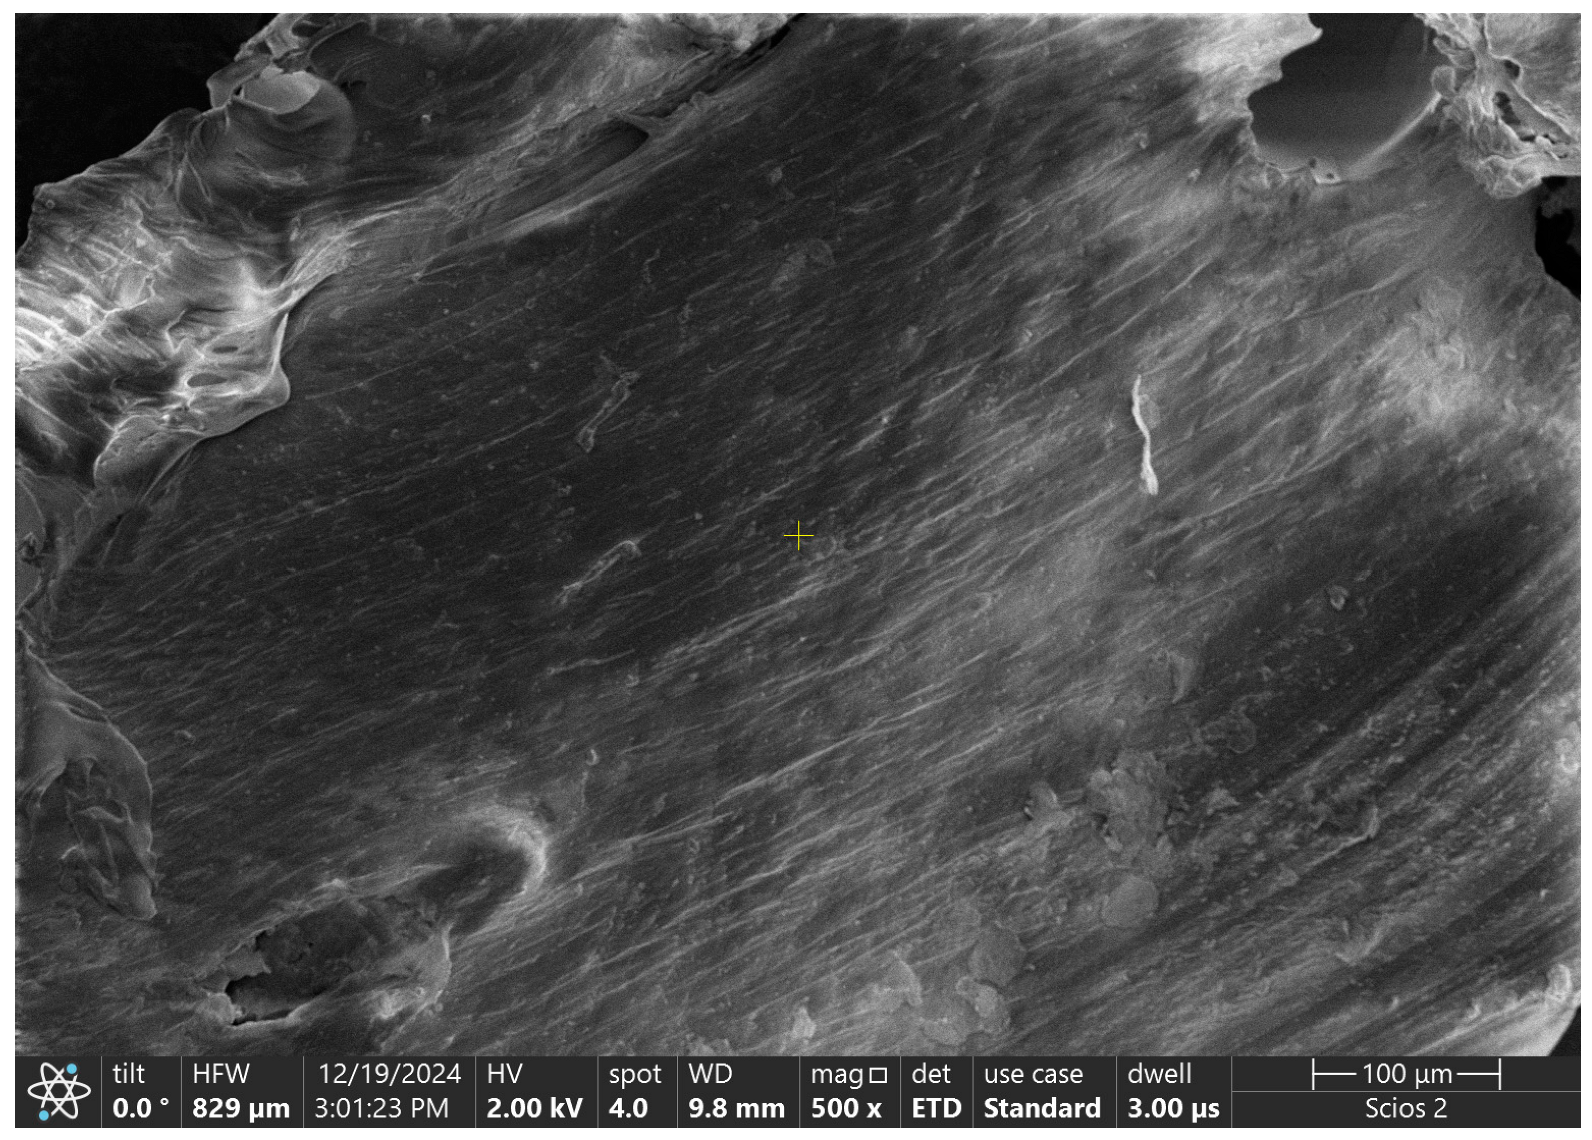
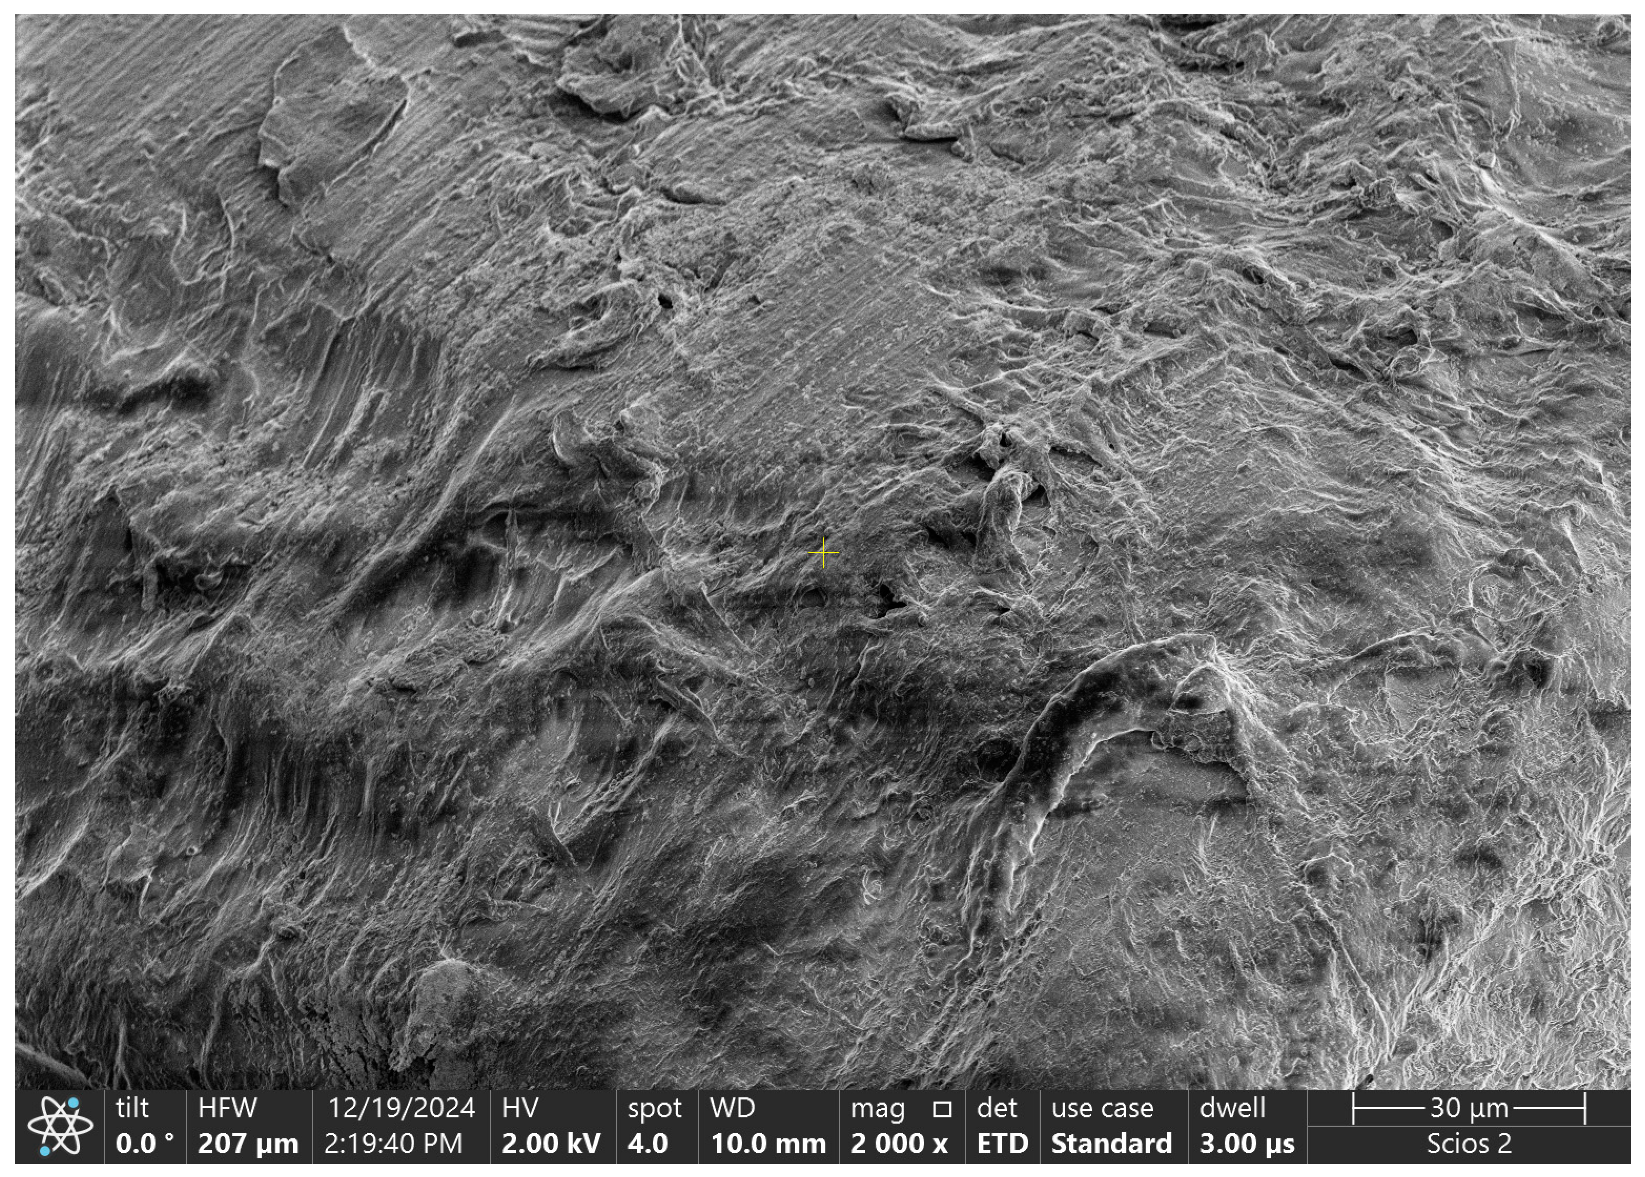
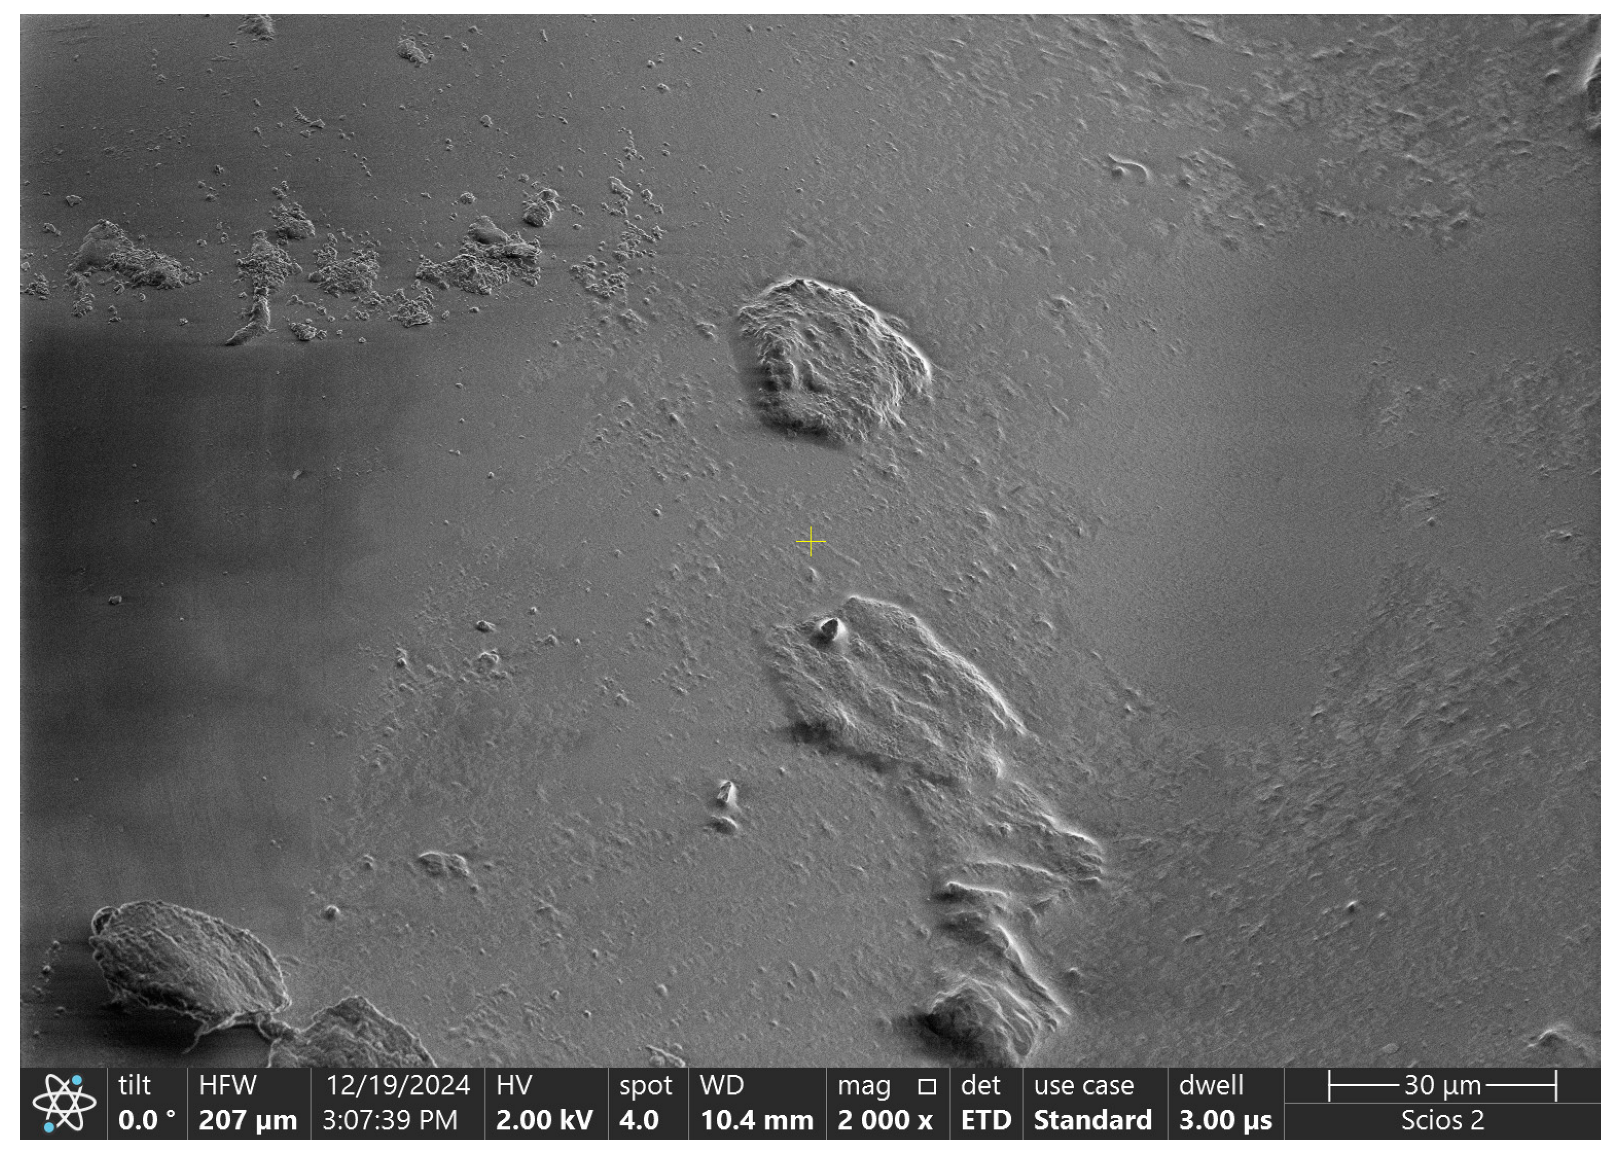
SEM images of the surfaces of the tested samples are shown in Table 6, both in their initial state, and also, after simulating the wear process.
Table 6.
SEM images of analyzed materials.
For the original belt, the data from Figure 6 show a high coefficient of friction (~1.2) and intermediate mass loss (~0.2 mg). This aligns with the SEM images, where the surface before testing appears smooth, but after testing, it exhibits prominent wear features such as scratches and cracks, indicating substantial material degradation.
Moving to 60A 70%, the coefficient of friction remains moderately high (~1.2), while the mass loss is intermediate (~0.4 mg). The SEM images reveal a relatively rough surface before testing, and after testing, some wear marks and indentations become evident. For 60A 100%, the highest coefficient of friction (~1.4) is observed, along with a high mass loss (~0.9 mg). The SEM images corroborate this, showing a smooth surface before testing and pronounced scratches after testing. In contrast, the 95A 70% material demonstrates a low coefficient of friction (~0.4) and minimal mass loss (~0.1 mg). Before testing, the SEM images show a relatively smooth surface, and after testing, only minor wear marks are visible. This indicates that the material exhibits excellent wear resistance while maintaining lower friction. Finally, the 95A 100% material exhibits the best tribological performance, with the lowest coefficient of friction (~0.2) and small mass loss (~0.1 mg). The SEM images support this, showing minimal surface alterations before and after testing.
It is observed that structures obtained with a low filling degree, such as 70%, are more porous. This allows the specimen, when pressed against the cardboard surface, to deform elastically, conforming to the surface of the mating piece (made of cardboard) and thereby contributing to more efficient braking (indicated by a higher friction coefficient). Increasing the filling degree results in greater belt rigidity and a microscopic reduction in the contact area between the two components of the friction pair. At the same time, a closer contact (a larger contact surface) between the two components at the microscopic level (in the case of a low filling degree) contributes to the development of higher shear forces and the displacement of a larger quantity of material from the surface of the component (the belt). A more pronounced smoothing is observed in Table 6, for the 70% filling degree after testing.
Significant differences are noted between materials 60A and 95A in terms of the friction coefficient, and therefore proportional differences in the wear rate also occur. Thus, material 60 exhibits much better friction characteristics compared to material 95 and compared (even superior) to the original material. The higher wear rate of material 60A compared to the original material may essentially be due to its structure, characterized by many surface peaks that will be torn off during operation. The original material has a surface with more rounded irregularities, which smooth out during operation without material detachment.
3.5. Results of Statistical Analysis
Figure 7 and Figure 8 show the main effect plots, respectively, and interaction plots for the measured data (coefficient of friction and mass loss).
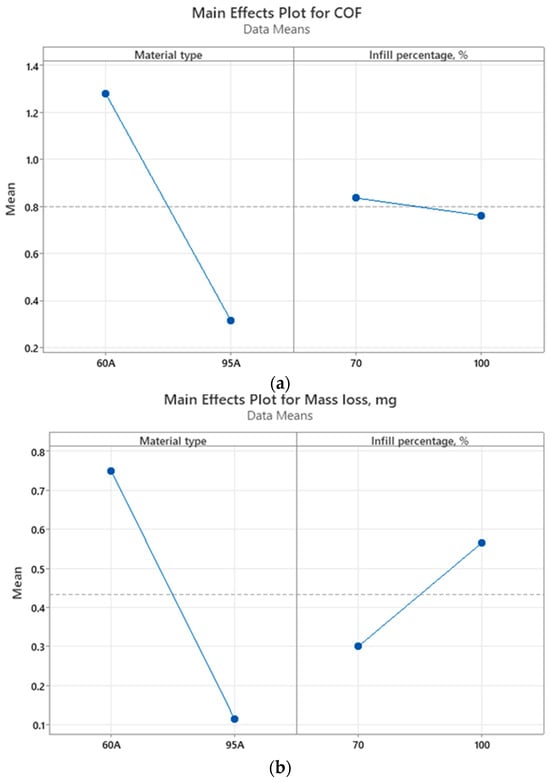
Figure 7.
Main effect plots for: (a) coefficient of friction; (b) mass loss.
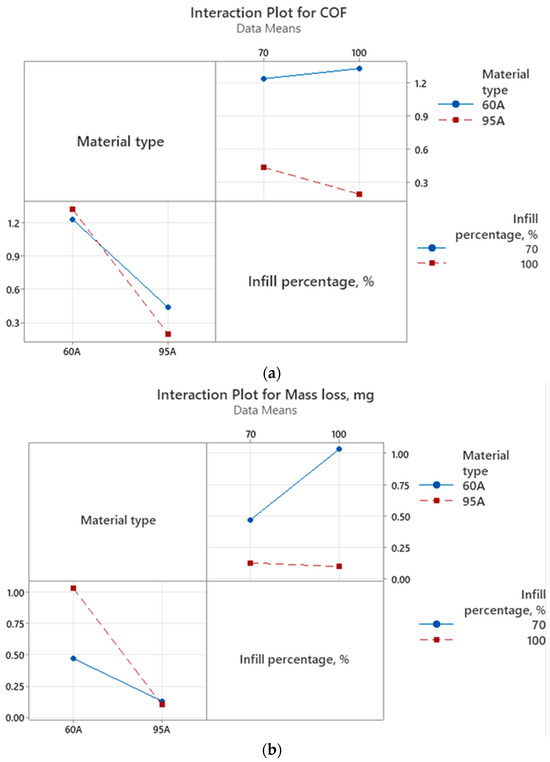
Figure 8.
Interaction plots for: (a) coefficient of friction; (b) mass loss.
The material type significantly affects the COF. The material 60A shows a higher COF compared to 95A, indicating that it provides better grip on the surface. The infill percentage also has a noticeable effect. A 70% infill results in a higher COF than 100%, indicating that reduced density enhances the material’s surface interaction, potentially due to increased surface compliance or deformation. The material type strongly influences mass loss, with 95A experiencing a significantly lower mass loss compared to 60A. The infill percentage impacts mass loss inversely to COF. A 70% infill leads to a lower mass loss than 100%.
In Figure 8a, the interaction plot for COF shows a clear distinction between the two materials, TPU 60A and TPU 95A. TPU 60A consistently demonstrates a significantly higher COF compared to TPU 95A, highlighting its superior grip. Interestingly, the infill percentage has a noticeable effect on both TPU 60A and TPU 95A. In the case of TPU 60A, increasing the infill from 70% to 100% slightly enhances the COF, likely due to increased surface stiffness and rigidity. On the other hand, TPU 95A shows a decrease in COF when increasing infill percentage. Consequently, TPU 60A, particularly at 100% infill, emerges as the better option for applications where the maximum grip is essential.
In contrast, the graph from Figure 8b, which presents the interaction plot for mass loss, reveals an important trade-off. While TPU 60A excels in COF, it exhibits a significantly higher mass loss compared to TPU 95A, especially at 100% infill. This indicates that although TPU 60A provides an excellent grip, it suffers from accelerated wear at higher infill percentages due to increased rigidity, which likely intensifies surface abrasion during use. Conversely, TPU 95A demonstrates remarkably low mass loss across all infill percentages, underscoring its superior wear resistance. Notably, the infill percentage has a minimal effect on TPU 95A, further enhancing its suitability for applications requiring durability and longevity.
The interaction between input variables, specifically the material type and infill percentage, has a significant impact on the tribological responses, namely the coefficient of friction (COF) and mass loss. The results indicate that the material type predominantly dictates the performance trends, with TPU 60A showing a higher COF and greater wear, while TPU 95A demonstrates a lower COF but exceptional wear resistance. However, the infill percentage modifies these responses differently for each material. For TPU 60A, increasing the infill percentage from 70% to 100% slightly enhances the COF but also significantly increases mass loss, suggesting that higher stiffness leads to improved grip but accelerates wear. In contrast, TPU 95A displays consistent behavior across different infill percentages, showing minimal changes in both COF and mass loss. This suggests that TPU 95A’s performance is more stable and less influenced by structural density.
An optimization analysis was carried out to find the best combination of material and infill percentage to achieve a maximum coefficient of friction and minimum mass loss, as illustrated in Table 7.
Table 7.
Optimization goals for measured parameters.
Table 8 shows the ranks allocated to each combination of materials.
Table 8.
Composite desirability and ranks.
The optimization plot in Figure 9 shows the impact of each factor (columns) on the responses or composite desirability (rows). Vertical red lines mark the current settings for each factor, with the red numbers at the top of each column indicating the specific factor levels. Horizontal blue lines and their corresponding values highlight the responses associated with the current factor settings. The 60A material with 70% infill is the most desirable option, achieving the best balance of friction and wear. The other combinations, while performing well in one metric (COF or mass loss), do not offer the same level of overall desirability.
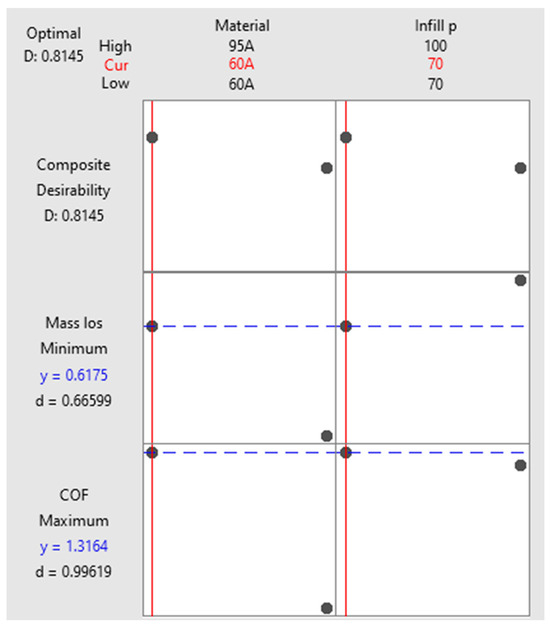
Figure 9.
Optimization plot.
4. Conclusions
The study explored the tribological behavior of various materials used in the active elements of transmission belts within pharmaceutical manipulators, focusing on achieving a balance between friction performance and wear resistance. The research highlighted several critical insights that are fundamental for optimizing belt design and material selection in industrial applications.
Firstly, the results demonstrated that the material type significantly influences both the coefficient of friction (COF) and wear resistance. Among the tested materials, TPU 60A and TPU 95A, both produced via 3D printing, showed distinct performance characteristics. TPU 60A achieved higher COF values, with the 100% infill variant exhibiting the highest friction, indicating a superior grip compared to the original belt. However, this advantage came at the cost of increased material wear, as evidenced by the substantial mass loss during testing. Conversely, TPU 95A demonstrated much lower COF values, suggesting a reduced grip, but exhibited very good wear resistance, particularly at 100% infill, where it experienced minimal mass loss.
Secondly, the study revealed that the infill percentage has a notable impact on the tribological performance of the materials, for both TPU 60A and TPU 95A.
From an application perspective, the findings suggest that TPU 60A with 70% infill strikes the best balance between friction and wear, making it the most suitable option for pharmaceutical manipulators that require high grip for effective packaging operations. This material infill combination achieved the highest composite desirability score in the optimization analysis, offering both reliable performance and moderate durability. However, for applications prioritizing longevity over grip, TPU 95A with a 70% infill percentage may be more appropriate.
While the present study primarily focused on infill density as a parameter, alternative infill patterns are indeed known to influence the mechanical and tribological properties of 3D printed parts. For instance, the analysis [35] of the three factors—deposition pattern, deposition speed, and layer height—reveals their combined influence on tribological performance. Future research could focus on the application of advanced 3D printing techniques, such as multi-material and gradient infill methods, specifically to enhance tribological and wear performance. These approaches enable the customization of material properties, improve stress distribution, and localize reinforcement, which are critical for reducing wear and optimizing frictional behavior.
The study’s methodological approach—incorporating statistical analysis, optimization, and real-world simulation of operating conditions—provides a robust framework for evaluating material performance in industrial settings. The use of 3D printing for sample preparation further highlights the potential of additive manufacturing to produce customized belt materials tailored to specific operational loadings.
Therefore, this research advances the understanding of tribological behavior in belt materials for pharmaceutical applications, emphasizing the critical balance between friction and wear. The findings contribute to the development of more efficient and durable transmission belts, ensuring reliability and sustainability in high-cycle manufacturing environments. Future work could explore additional materials and printing parameters, as well as the long-term performance of these materials under varying environmental conditions and operational loadings.
Author Contributions
Conceptualization, M.G.P. and M.S.; methodology, M.G.P., M.S., E.L., R.G.R. and M.T.; software, R.G.R. and M.T.; validation, M.G.P. and R.G.R.; formal analysis, M.G.P.; investigation, M.G.P., M.S., E.L., R.G.R. and M.T.; resources, M.G.P., M.S., E.L., R.G.R. and M.T.; data curation, M.G.P.; writing—original draft preparation, M.G.P., M.S., E.L., R.G.R. and M.T.; writing—review and editing, M.G.P., M.S., E.L., R.G.R. and M.T.; visualization, M.G.P.; supervision, M.G.P.; project administration, M.G.P.; funding acquisition, M.T. All authors have read and agreed to the published version of the manuscript.
Funding
This research received no external funding.
Data Availability Statement
The original contributions presented in the study are included in the article. Further inquiries can be directed to the corresponding authors.
Conflicts of Interest
The authors declare no conflicts of interest.
References
- Li, C.; Lee, C.-H. Surface Durability Study of 3D Printed Gears Using Two Different Materials. Mater. Plast. 2023, 60, 66–75. [Google Scholar] [CrossRef]
- Hanon, M.M.; Marczis, R.; Zsidai, L. Impact of 3D-Printing Structure on the Tribological Properties of Polymers. Ind. Lubr. Tribol. 2020, 72, 811–818. [Google Scholar] [CrossRef]
- Garg, N.; Rastogi, V.; Kumar, P. Process Parameter Optimization on the Dimensional Accuracy of Additive Manufacture Thermoplastic Polyurethane (TPU) Using RSM. Mater. Today Proc. 2022, 62, 94–99. [Google Scholar] [CrossRef]
- Garg, N.; Kumar, P. Multi-Objective Optimization of 3D Printing Parameters to Fabricate TPU for Tribological Applications. Proc. Inst. Mech. Eng. Part E J. Process Mech. Eng. 2024, 09544089241279168. [Google Scholar] [CrossRef]
- Hasdiansah, H.; Yaqin, R.I.; Pristiansyah, P.; Umar, M.L.; Priyambodo, B.H. FDM-3D Printing Parameter Optimization Using Taguchi Approach on Surface Roughness of Thermoplastic Polyurethane Parts. Int. J. Interact. Des. Manuf. 2023, 17, 3011–3024. [Google Scholar] [CrossRef]
- Fenollosa-Artes, F.; Jorand, L.; Tejo-Otero, A.; Lustig-Gainza, P.; Romero-Sabat, G.; Medel, S.; Uceda, R. Soft 3D Printing of Thermoplastic Polyurethane: Preliminary Study. Proc. Inst. Mech. Eng. Part B J. Eng. Manuf. 2023, 237, 1128–1135. [Google Scholar] [CrossRef]
- Ripeanu, R.G.; Tănase, M.; Portoacă, A.I.; Diniță, A. Assessing the Tribological Impact of 3D Printed Carbon-Reinforced ABS Composite Cylindrical Gears. Lubricants 2024, 12, 376. [Google Scholar] [CrossRef]
- Sato, S.; Yamaguchi, T.; Shibata, K.; Nishi, T.; Moriyasu, K.; Harano, K.; Hokkirigawa, K. Dry Sliding Friction and Wear Behavior of Thermoplastic Polyurethane against Abrasive Paper. Biotribology 2020, 23, 100130. [Google Scholar] [CrossRef]
- Sharma, A.; Chhabra, D.; Sahdev, R.; Kaushik, A.; Punia, U. Investigation of Wear Rate of FDM Printed TPU, ASA and Multi-Material Parts Using Heuristic GANN Tool. Mater. Today Proc. 2022, 63, 559–565. [Google Scholar] [CrossRef]
- Masmoudi, M.; Elleuch, K. The Effect of Time and Aging Temperature on Thermoplastic Polyurethane Elastomers Wear Behavior. In Proceedings of the First International Conference on Materials and Environment Durability, Hammamet, Tunisie, 22 March 2012. [Google Scholar]
- Boubakri, A.; Elleuch, K. Aging effect on behaviour of thermoplastic polyurethane. In Proceedings of the Third International Conference on Advances in Mechanical Engineering and Mechanics, Hammamet, Tunisia, 17–19 December 2006. [Google Scholar]
- Dangnan, F.; Espejo, C.; Liskiewicz, T.; Gester, M.; Neville, A. Friction and Wear of Additive Manufactured Polymers in Dry Contact. J. Manuf. Process. 2020, 59, 238–247. [Google Scholar] [CrossRef]
- Zhiani Hervan, S.; Altınkaynak, A.; Parlar, Z. Hardness, Friction and Wear Characteristics of 3D-Printed PLA Polymer. Proc. Inst. Mech. Eng. Part J J. Eng. Tribol. 2021, 235, 1590–1598. [Google Scholar] [CrossRef]
- Dhakal, N.; Espejo, C.; Morina, A.; Emami, N. Tribological Performance of 3D Printed Neat and Carbon Fiber Reinforced PEEK Composites. Tribol. Int. 2024, 193, 109356. [Google Scholar] [CrossRef]
- Bedi, S.S.; Mallesha, V. Investigating Tribological Performance in 3D-Printed PETG/Graphene Composites of Varying Composition. J. Reinf. Plast. Compos. 2024, 07316844241274294. [Google Scholar] [CrossRef]
- Gbadeyan, O.J.; Mohan, T.P.; Kanny, K. Tribological Properties of 3D Printed Polymer Composites-Based Friction Materials. In Tribology of Polymer and Polymer Composites for Industry 4.0; Jena, H., Katiyar, J.K., Patnaik, A., Eds.; Composites Science and Technology; Springer: Singapore, 2021; pp. 161–191. ISBN 9789811639029. [Google Scholar]
- Childs, P.R.N. Belt and Chain Drives. In Mechanical Design Engineering Handbook; Elsevier: Amsterdam, The Netherlands, 2019; pp. 533–597. ISBN 978-0-08-102367-9. [Google Scholar]
- Meng, W.; Yao, Y. General Belt Conveyors. In Handbook of Port Machinery; Tao, D., Yan, Y., Dong, D., Zhang, D., Eds.; Springer Nature: Singapore, 2024; pp. 1075–1129. ISBN 978-981-9948-47-5. [Google Scholar]
- Krol, O.; Sokolov, V.; Logunov, O.; Tsankov, P. Modernization of the Drive Belt Transmission for the Machining Center. In Advances in Design, Simulation and Manufacturing VII; Ivanov, V., Pavlenko, I., Edl, M., Machado, J., Xu, J., Eds.; Lecture Notes in Mechanical Engineering; Springer Nature: Cham, Switzerland, 2024; pp. 25–39. ISBN 978-3-031-63719-3. [Google Scholar]
- Kremer, A.; Bertsche, B.; Scholzen, A. The Influence of Environmental and Manufacturing Conditions on Lifetime and Reliability Predictions for Industrial Timing Belt Drives. Forsch. Ingenieurwes 2020, 84, 1–10. [Google Scholar] [CrossRef]
- Fuwen, H.; Jiajian, C.; Yunhua, H. Interactive Design for Additive Manufacturing: A Creative Case of Synchronous Belt Drive. Int. J. Interact. Des. Manuf. 2018, 12, 889–901. [Google Scholar] [CrossRef]
- Sniehotta, P. Design of Belt Wheels Using the 3D Printing Method. In Current Methods of Construction Design; Medvecký, Š., Hrček, S., Kohár, R., Brumerčík, F., Konstantová, V., Eds.; Lecture Notes in Mechanical Engineering; Springer International Publishing: Cham, Switzerland, 2020; pp. 589–595. ISBN 978-3-030-33145-0. [Google Scholar]
- Goh, G.D.; Yeong, W.Y. Applications of Machine Learning in 3D Printing. Mater. Today Proc. 2022, 70, 95–100. [Google Scholar] [CrossRef]
- Zhang, X.; Chu, D.; Zhao, X.; Gao, C.; Lu, L.; He, Y.; Bai, W. Machine Learning-Driven 3D Printing: A Review. Appl. Mater. Today 2024, 39, 102306. [Google Scholar] [CrossRef]
- Malashin, I.; Masich, I.; Tynchenko, V.; Gantimurov, A.; Nelyub, V.; Borodulin, A.; Martysyuk, D.; Galinovsky, A. Machine Learning in 3D and 4D Printing of Polymer Composites: A Review. Polymers 2024, 16, 3125. [Google Scholar] [CrossRef] [PubMed]
- FILAFLEX 60A—Softest Flexible TPU 3D PRO Printing Material US, 500 gm—Narrow Path 3D. Available online: https://np3dp.com/products/filaflex-60a-professional-flexible-3d-printing-material-us-500gm-1-75mm (accessed on 7 December 2024).
- Best TPU Filament Flexible 3D Printing TPU Material-eSUN. Available online: https://www.esun3d.com/etpu-95a-product/ (accessed on 7 December 2024).
- Portoaca, A.I.; Ripeanu, G.R.; Ion, N.; Tanase, M. The influence of 3d printing parameters and heat treatment on tribological behavior. Acta Tech. Napoc. 2023, 66, 537–546. [Google Scholar]
- Portoacă, A.I.; Ripeanu, R.G.; Diniță, A.; Tănase, M. Optimization of 3D Printing Parameters for Enhanced Surface Quality and Wear Resistance. Polymers 2023, 15, 3419. [Google Scholar] [CrossRef]
- Lee, S.-J.; Kim, C.-L. Influence of Surface Structure on Friction and Wear Characteristics of Silicone Rubber for Hydraulic Rod Seals. RSC Adv. 2023, 13, 33595–33602. [Google Scholar] [CrossRef] [PubMed]
- Prajapati, P.K.; Kumar, S.; Singh, K.K. Optimization of Tribological Behavior of CFRP Composites under Dry Sliding Condition Using Taguchi Method. Mater. Today Proc. 2020, 21, 1320–1329. [Google Scholar] [CrossRef]
- Recycled TPU Filament Reciflex, 100% From Recycled Origin. Available online: https://recreus.com/gb/filaments/4-reciflex.html?srsltid=AfmBOop-1WxfPqznKle-h1Gho2PiMRm5EXJxjV_FiLvfR4OFi4Mp0A9o (accessed on 3 January 2025).
- Kyriakidis, I.F.; Kladovasilakis, N.; Pechlivani, E.M.; Tsongas, K. Mechanical Performance of Recycled 3D Printed Sustainable Polymer-Based Composites: A Literature Review. J. Compos. Sci. 2024, 8, 215. [Google Scholar] [CrossRef]
- Djonyabe Habiba, R.; Malça, C.; Branco, R. Exploring the Potential of Recycled Polymers for 3D Printing Applications: A Review. Materials 2024, 17, 2915. [Google Scholar] [CrossRef]
- Portoaca, A.I.; Dinita, A.; Ripeanu, R.G.; Tănase, M. Analysis of Microstructural and Wear Mechanisms for 3D-Printed PET CF15 Using Box–Behnken Design. Lubricants 2024, 12, 410. [Google Scholar] [CrossRef]
Disclaimer/Publisher’s Note: The statements, opinions and data contained in all publications are solely those of the individual author(s) and contributor(s) and not of MDPI and/or the editor(s). MDPI and/or the editor(s) disclaim responsibility for any injury to people or property resulting from any ideas, methods, instructions or products referred to in the content. |
© 2025 by the authors. Licensee MDPI, Basel, Switzerland. This article is an open access article distributed under the terms and conditions of the Creative Commons Attribution (CC BY) license (https://creativecommons.org/licenses/by/4.0/).