Article

The Microstructure Evolution and Dynamic Recrystallization Mechanism of Cu-1.1–Ni-0.7–Co-0.45–Si-0.3Cr Alloys during High-Temperature Deformation

1
Provincial and Ministerial Co-Construction of Collaborative Innovation Center for Non-Ferrous Metal New Materials and Advanced Processing Technology, School of Materials Science and Engineering, Henan University of Science and Technology, Luoyang 471023, China
2
Henan Province Key Laboratory of Nonferrous Materials Science and Processing Technology, Luoyang 471023, China
3
Beijing Key Laboratory of Advanced High Temperature Materials, Central Iron and Steel Research Institute, Beijing 100081, China
4
Center for Advanced Measurement Science, National Institute of Metrology, Beijing 100029, China
5
Department of Mechanical Engineering, University of South Florida, Tampa, FL 33620, USA
*
Authors to whom correspondence should be addressed.
Coatings 2023, 13(3), 660; https://doi.org/10.3390/coatings13030660
Submission received: 8 February 2023 / Revised: 2 March 2023 / Accepted: 17 March 2023 / Published: 22 March 2023

Abstract

:
Copper alloys with a combination of good electrical conductivity and mechanical properties are widely used in automotive electronics, large-scale integrated circuits, and other fields. In this study, a new type of Cu–Ni–Si alloy with added trace elements of Co and Cr was fabricated. Hot compression tests of this alloy at different temperatures and strain rates were conducted using a Gleeble-1500D simulator. Then, the microstructure transformation and precipitation behaviors of the Cu-1.1–Ni-0.7–Co-0.45–Si-0.3Cr alloy were studied during a hot deformation process. The results show that the hot deformation behavior of the Cu-1.1–Ni-0.7–Co-0.45–Si-0.3Cr alloy includes continuous dynamic recrystallization (CDRX) and discontinuous dynamic recrystallization (DDRX). The intensity of the texture in the microstructure is decreased, and the randomness of the texture in the microstructure is increased together with the recrystallization progress. The degree of recrystallization of the new Cu-1.1–Ni-0.7–Co-0.45–Si-0.3Cr alloy is increased when the hot deformation temperature rises. Additionally, the results indicate that there are two types of precipitates which are formed in the alloy during the hot deformation process. These two precipitates can pin dislocations and grain boundaries, and therefore, they significantly improve the hot compression resistance of the Cu-1.1–Ni-0.7–Co-0.45–Si-0.3Cr alloy.

1. Introduction

Electrical contacts are important components in the circuit industry, requiring materials with high strength and high conductivity (electricity and thermal). Traditionally, Cu–Be alloys, Cu–Ti alloys, Cu–Zr alloys, and Cu–Cr–Zr alloys have been the choice materials for large-scale integrated circuits [1,2,3,4]. However, these materials have different disadvantages, such as contradictions between their toxic elements, electrical conductivity, and strength. With the development of science and technology, a series of new materials with synergistic enhancements of their strength and conductivity have been developed. Among them, Cu–Ni–Si alloys have been investigated extensively, owing to their combination of good electrical conductivity and good mechanical properties [5,6]. Relevant studies have shown that, in Cu–Ni–Si alloys, the fracture strength and electrical conductivity can reach about 800 MPa and 45% IACS, respectively [7,8].
Another effective way to enhance the comprehensive properties of copper alloys is the addition of trace elements, such as Mg [9], Ti [10], V [11], and so on. Fang et al. [12] added Mg into a copper alloy and demonstrated that Mg can improve the matrix fracture strength owing to its precipitate behavior and aging kinetics. Geng et al. [13] reported that Ti addition can change the alloy texture type, form new precipitates during aging, and improve the strength of a copper alloy. Furthermore, some research has suggested that Co and Cr are good trace elements and can be used for Cu–Ni–Si micro-alloys [14,15]. Krishna et al. [16] and Wei et al. [17] added Co into a Cu–Ni–Si matrix. They pointed out that cobalt addition can simultaneously enhance the fracture strength and electrical conductivity attributes for the following reasons. Firstly, Co can form Co2Si or (Ni, Co)2Si precipitates, which show a solid solution strengthening effect. Secondly, Co atoms can partially replace Ni atoms and therefore prevent the movement of the vacancy and improve the electrical performance. Cheng and Ban et al. [18,19] reported that Cr affects Cu–Ni–Si base alloy properties. Experiment data results show that Cr trace addition can clearly enhance the comprehensive properties due to Cr’s reducing effect on the grain size of alloys. Therefore, in order to improve the fracture strength and conductivity of Cu–Ni–Si base alloys simultaneously, a new type of Cu–Ni–Si alloy with trace Co and Cr addition was prepared in this work.
During the electrical contact process, the continuous opening and closing of the electrical contacts causes the arc line to shrink. This process generates a large amount of Joule heat, resulting in temperature rise and the deformation of the electrical contact material. Therefore, it is important to understand the hot compression behavior of copper alloys. However, much research has focused on the mechanical properties and conductivity properties of the new Cu–Ni–Si alloy. Thus, there is less research on the hot compression behavior of the alloy. Therefore, the microstructure evolution and precipitate analysis of the new Cu-1.1–Ni-0.7–Co-0.45–Si-0.3Cr alloy in a hot compression process were studied in this work. Hot processing maps were drawn, and the best working area for the Cu-1.1–Ni-0.7–Co-0.45–Si-0.3Cr alloy was obtained, which provides a reference basis and data support for the processing of copper alloys.

2. Material and Experimental

Standard cathode Cu (99.99%), Ni (99.95%), Si (99.95%), Co (99.95%), and Cr (99.95%) powders were used as raw materials in this work. All raw materials were purchased from Shanghai Bowei Technology Co. (Shanghai, China) The alloy was melted in a ZG-001 vacuum intermediate-frequency induction furnace, and the process was protected with argon to prevent the oxidation of the sample. The melting temperature was controlled at 1200 ± 50 °C, and the Cu-1.1–Ni-0.7–Co-0.45–Si-0.3Cr alloy was cast by pouring after the alloy was completely melted and evenly dispersed. Finally, a cylindrical ingot of Φ80 mm × 200 mm was obtained. The new Cu-1.1–Ni-0.7–Co-0.45–Si-0.3Cr alloy’s chemical composition was measured by inductively coupled plasma atomic emission spectrometry (PerkinElmer, Waltham, MA, USA), as shown in Table 1. Before extrusion testing, the ingots were firstly annealed for 1 h in a tubular furnace. Then, the ingots were extruded into Φ35 mm bars with the aid of an XJ-500 extrusion machine. After extrusion testing, Φ35 mm bars underwent solid solution treatment at 950 °C in a tubular furnace (HF-Kejing, Hefei, China) for 1 h.
A Gleeble-1500D thermo-mechanical simulator (Dynamic Systems Inc., Poestenkill, NY, USA) was used for hot compression testing. The cylinder samples used for hot deformation testing had a size of Φ8 mm × 12 mm. The compression of the cylinder samples was 60%. During the hot deformation testing, the hot deformation conditions were changed from 500 to 900 °C and from 0.001 to 1 s−1. The samples were cut in the compression direction after the hot compression test.
The electron backscattering diffraction (EBSD) technique was used to characterize the microstructure evolution of the cylinder samples during the hot compression process. The EBSD samples were firstly mechanically polished and then electro-polished. The electro-polishing solution was prepared with anhydrous ethanol and 98% phosphoric acid at a volume fraction of 1:1. At room temperature, the electro-polishing process was performed at a voltage of 5 V, and the time duration was 60 s. The microstructure was analyzed by TEM at a voltage of 200 kV. For the TEM testing, the samples were firstly mechanically polished to a thickness of 50 μm, and then a Gatan 691 ion thinner (Gatan Inc., Warrendale, PA, USA) was used for further thinning.

3. Results

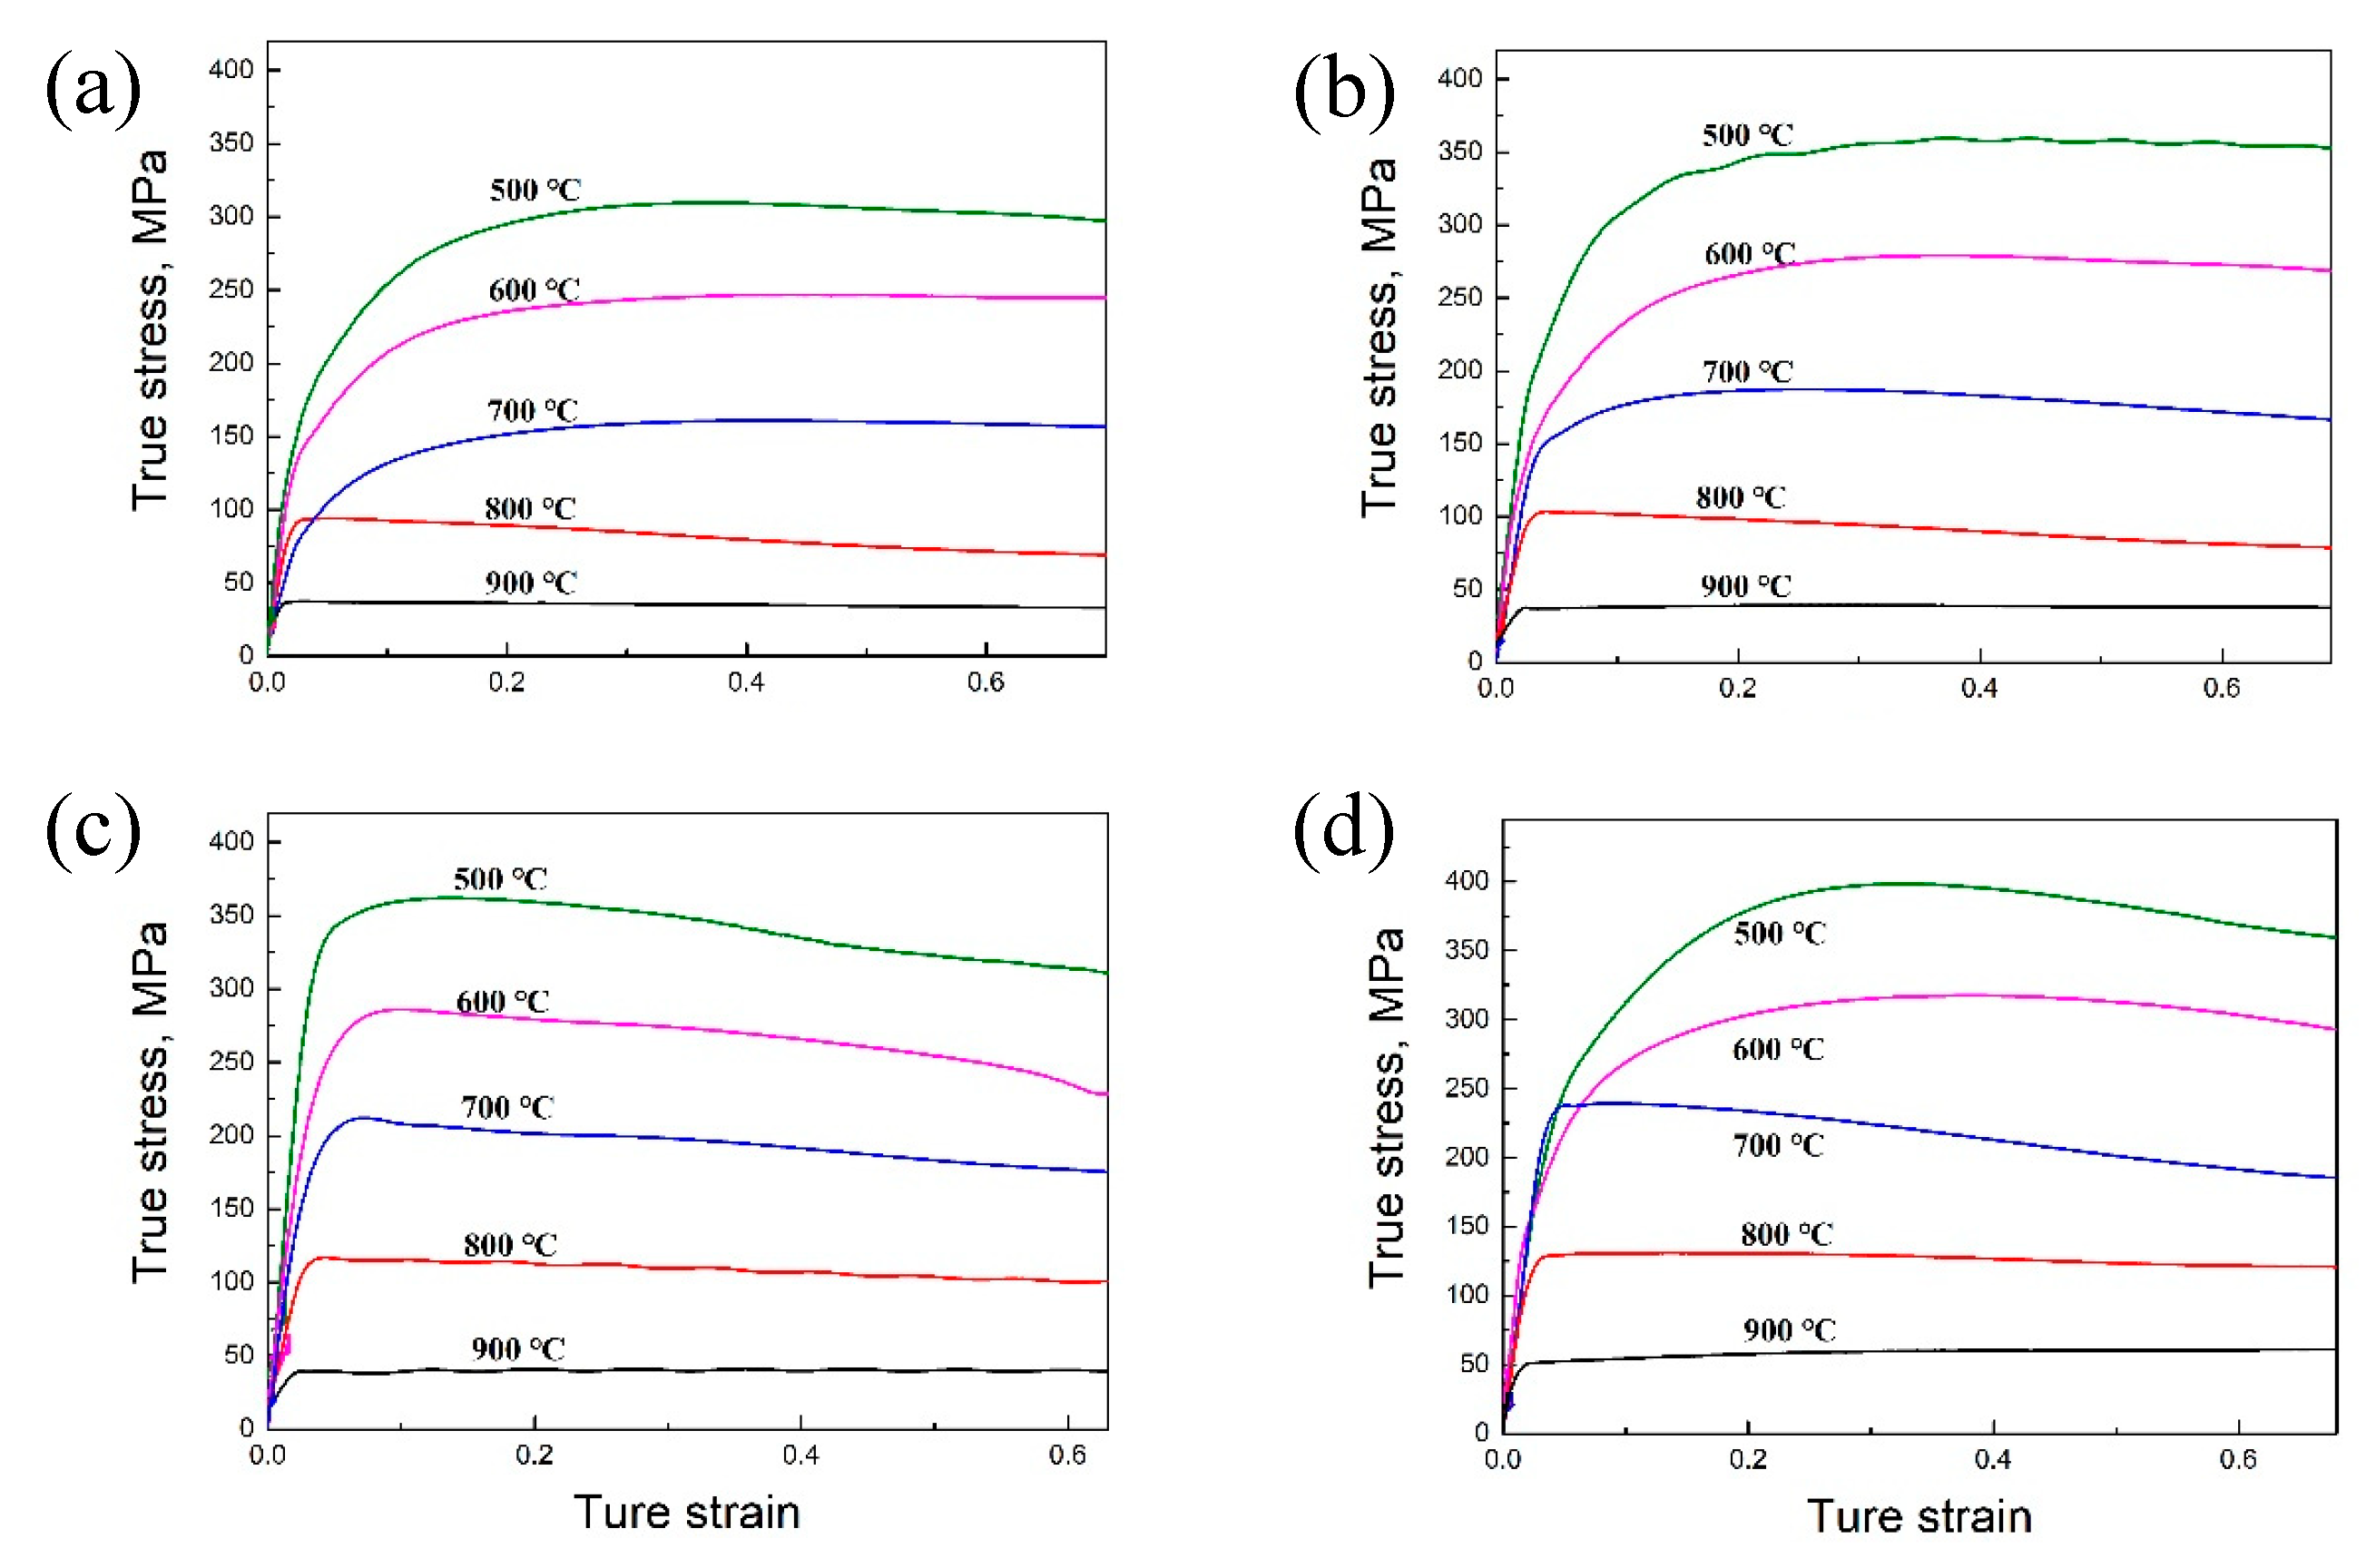
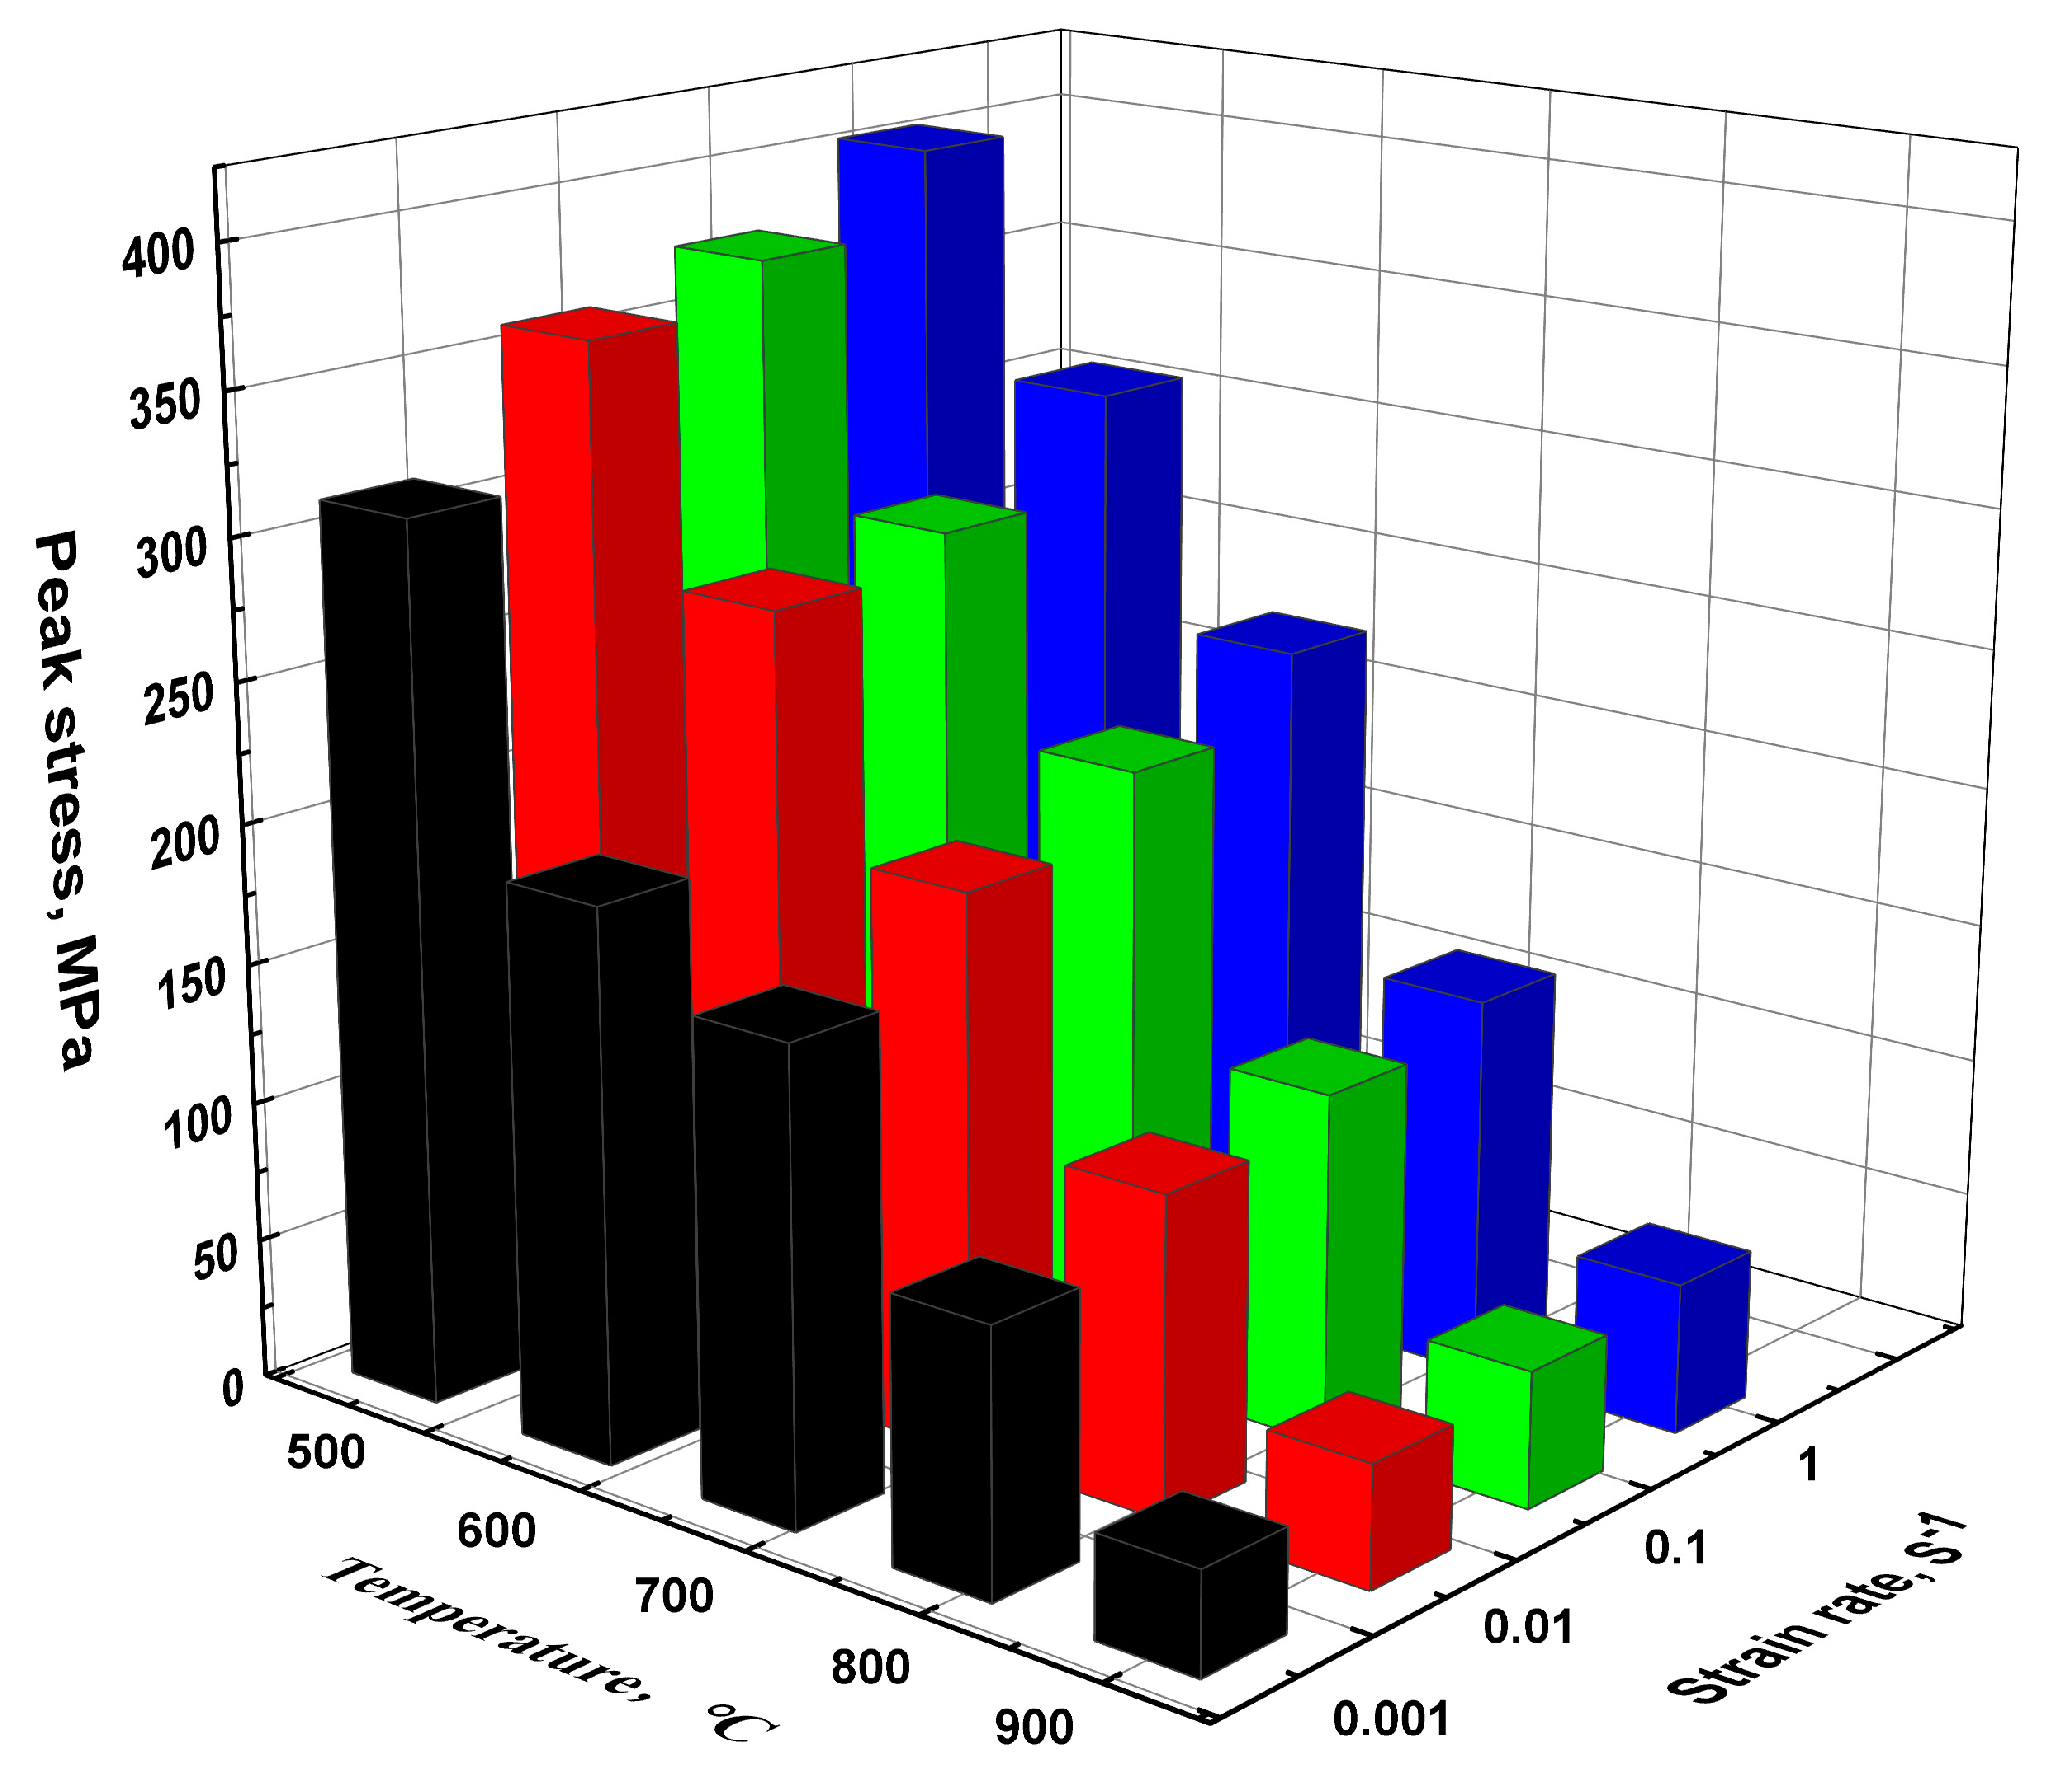
3.1. Flow Stress Behavior

Figure 1 shows the flow stress–strain curves of the new type of Cu-1.1–Ni-0.7–Co-0.45–Si-0.3Cr alloy under different hot compression conditions. Based on these flow stress curves, it can be concluded that with the increase in the true strain, the true stress increased rapidly in the early stages. Then, they reached a peak value and tended to become stable. This is because in the initial stages, many dislocations are generated and entangled, which results in the stress value increasing rapidly through the deformation process [20]. As is well-known, work hardening is accompanied by dynamic softening in the hot compression process. When the work hardening effect and the dynamic softening effect reach an equilibrium, the stress reaches a peak value and becomes stable [21]. In other words, at lower compression temperatures or under higher strain rate conditions, the true stress is increased. Moreover, the influence of the compression temperature on the stress value is more apparent than that of the strain rate.
Figure 2 shows the peak stress value for the new type of Cu-1.1–Ni-0.7–Co-0.45–Si-0.3Cr alloy under different deformation conditions. It can be found that the peak stress value clearly decreases with the increase in temperature at the same strain rate. For example, the peak stress value of the new type of Cu-1.1–Ni-0.7–Co-0.45–Si-0.3Cr alloy decreases from 312.7 MPa to 36.6 MPa, while the compression temperature increases from 500 to 900 °C at 0.001 s−1. This is mainly due to the increase in the grain boundary migration rate and vacancy diffusion rate, and the slip of the helical dislocation and the climb of the edge dislocation are more likely to occur at a higher temperature. In other words, dynamic softening is dominant when the compression temperature is high. Hence, the peak stress value for these alloys is smaller at high compression temperatures than low compression temperatures. For the same deformation temperature, the peak stress values of these alloys are increased at the high strain rate. For example, the peak stress value is 312 MPa when the strain rate is 0.001 s−1 and the deformation temperature is 500 °C. Additionally, the peak stress value is 403 MPa when the strain rate is 1 s−1 and the deformation temperature is 500 °C. This is because the dynamic softening of the new type of Cu-1.1–Ni-0.7–Co-0.45–Si-0.3Cr alloy is inhibited when the strain rate is increased.

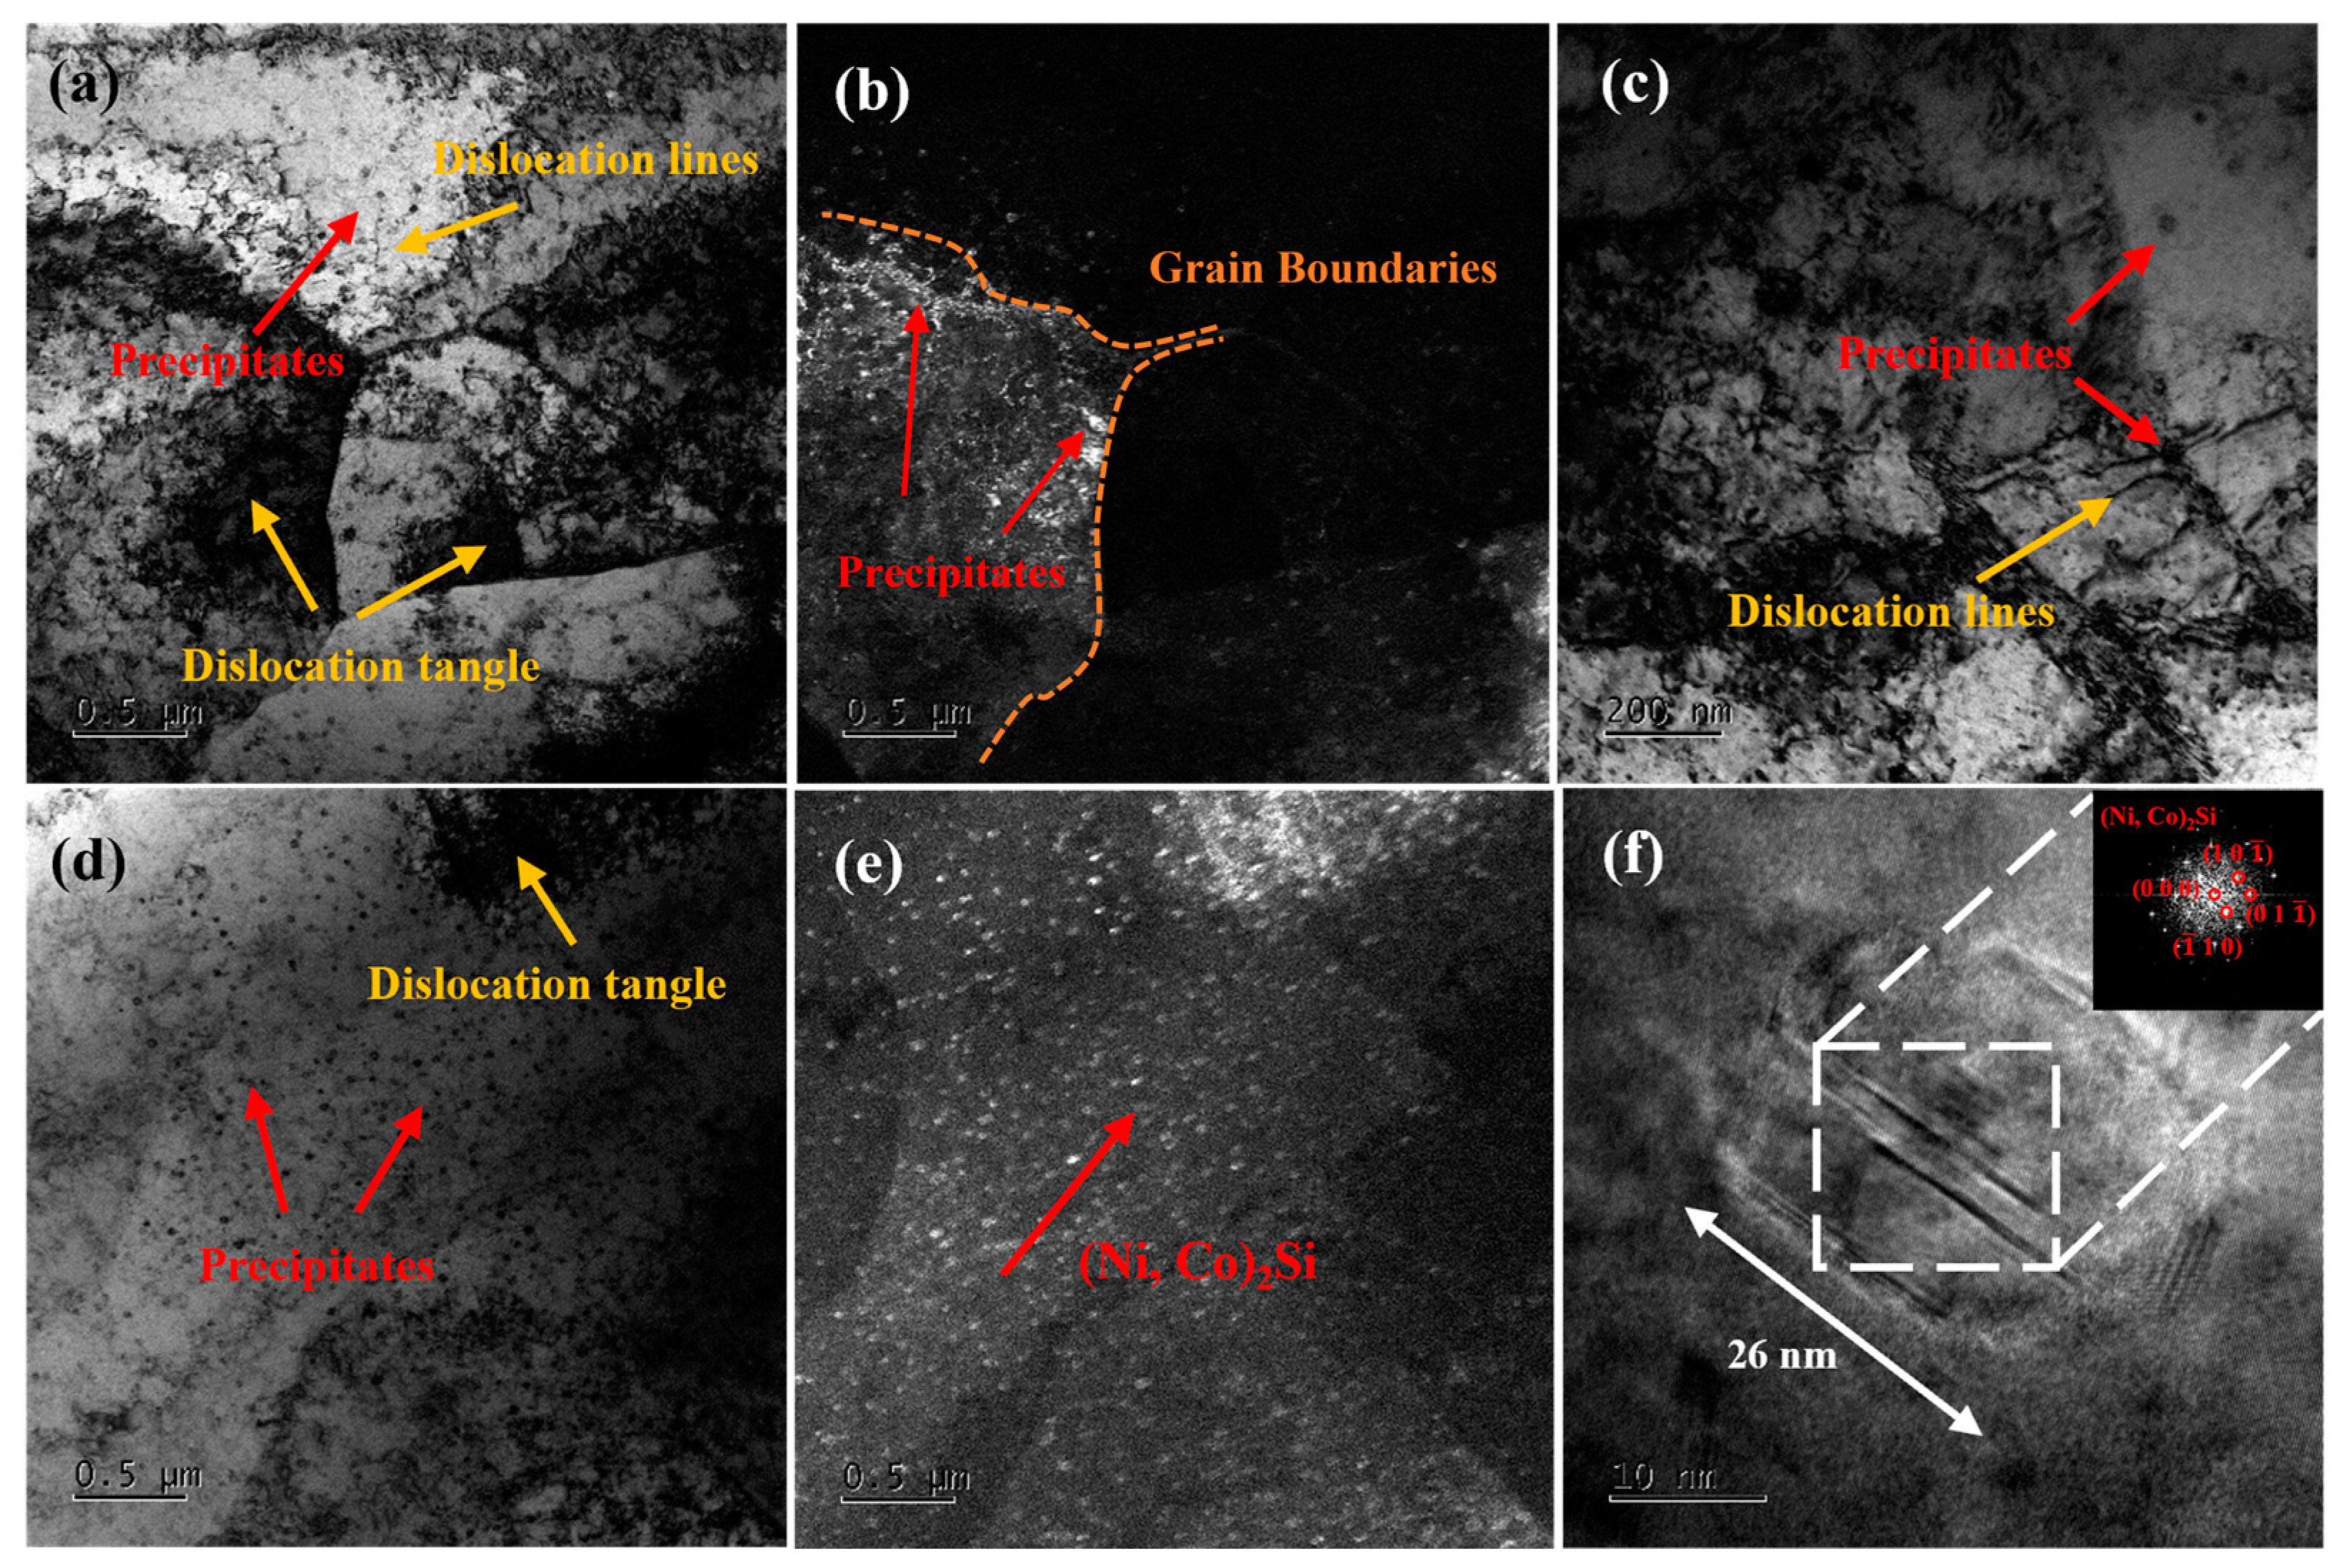
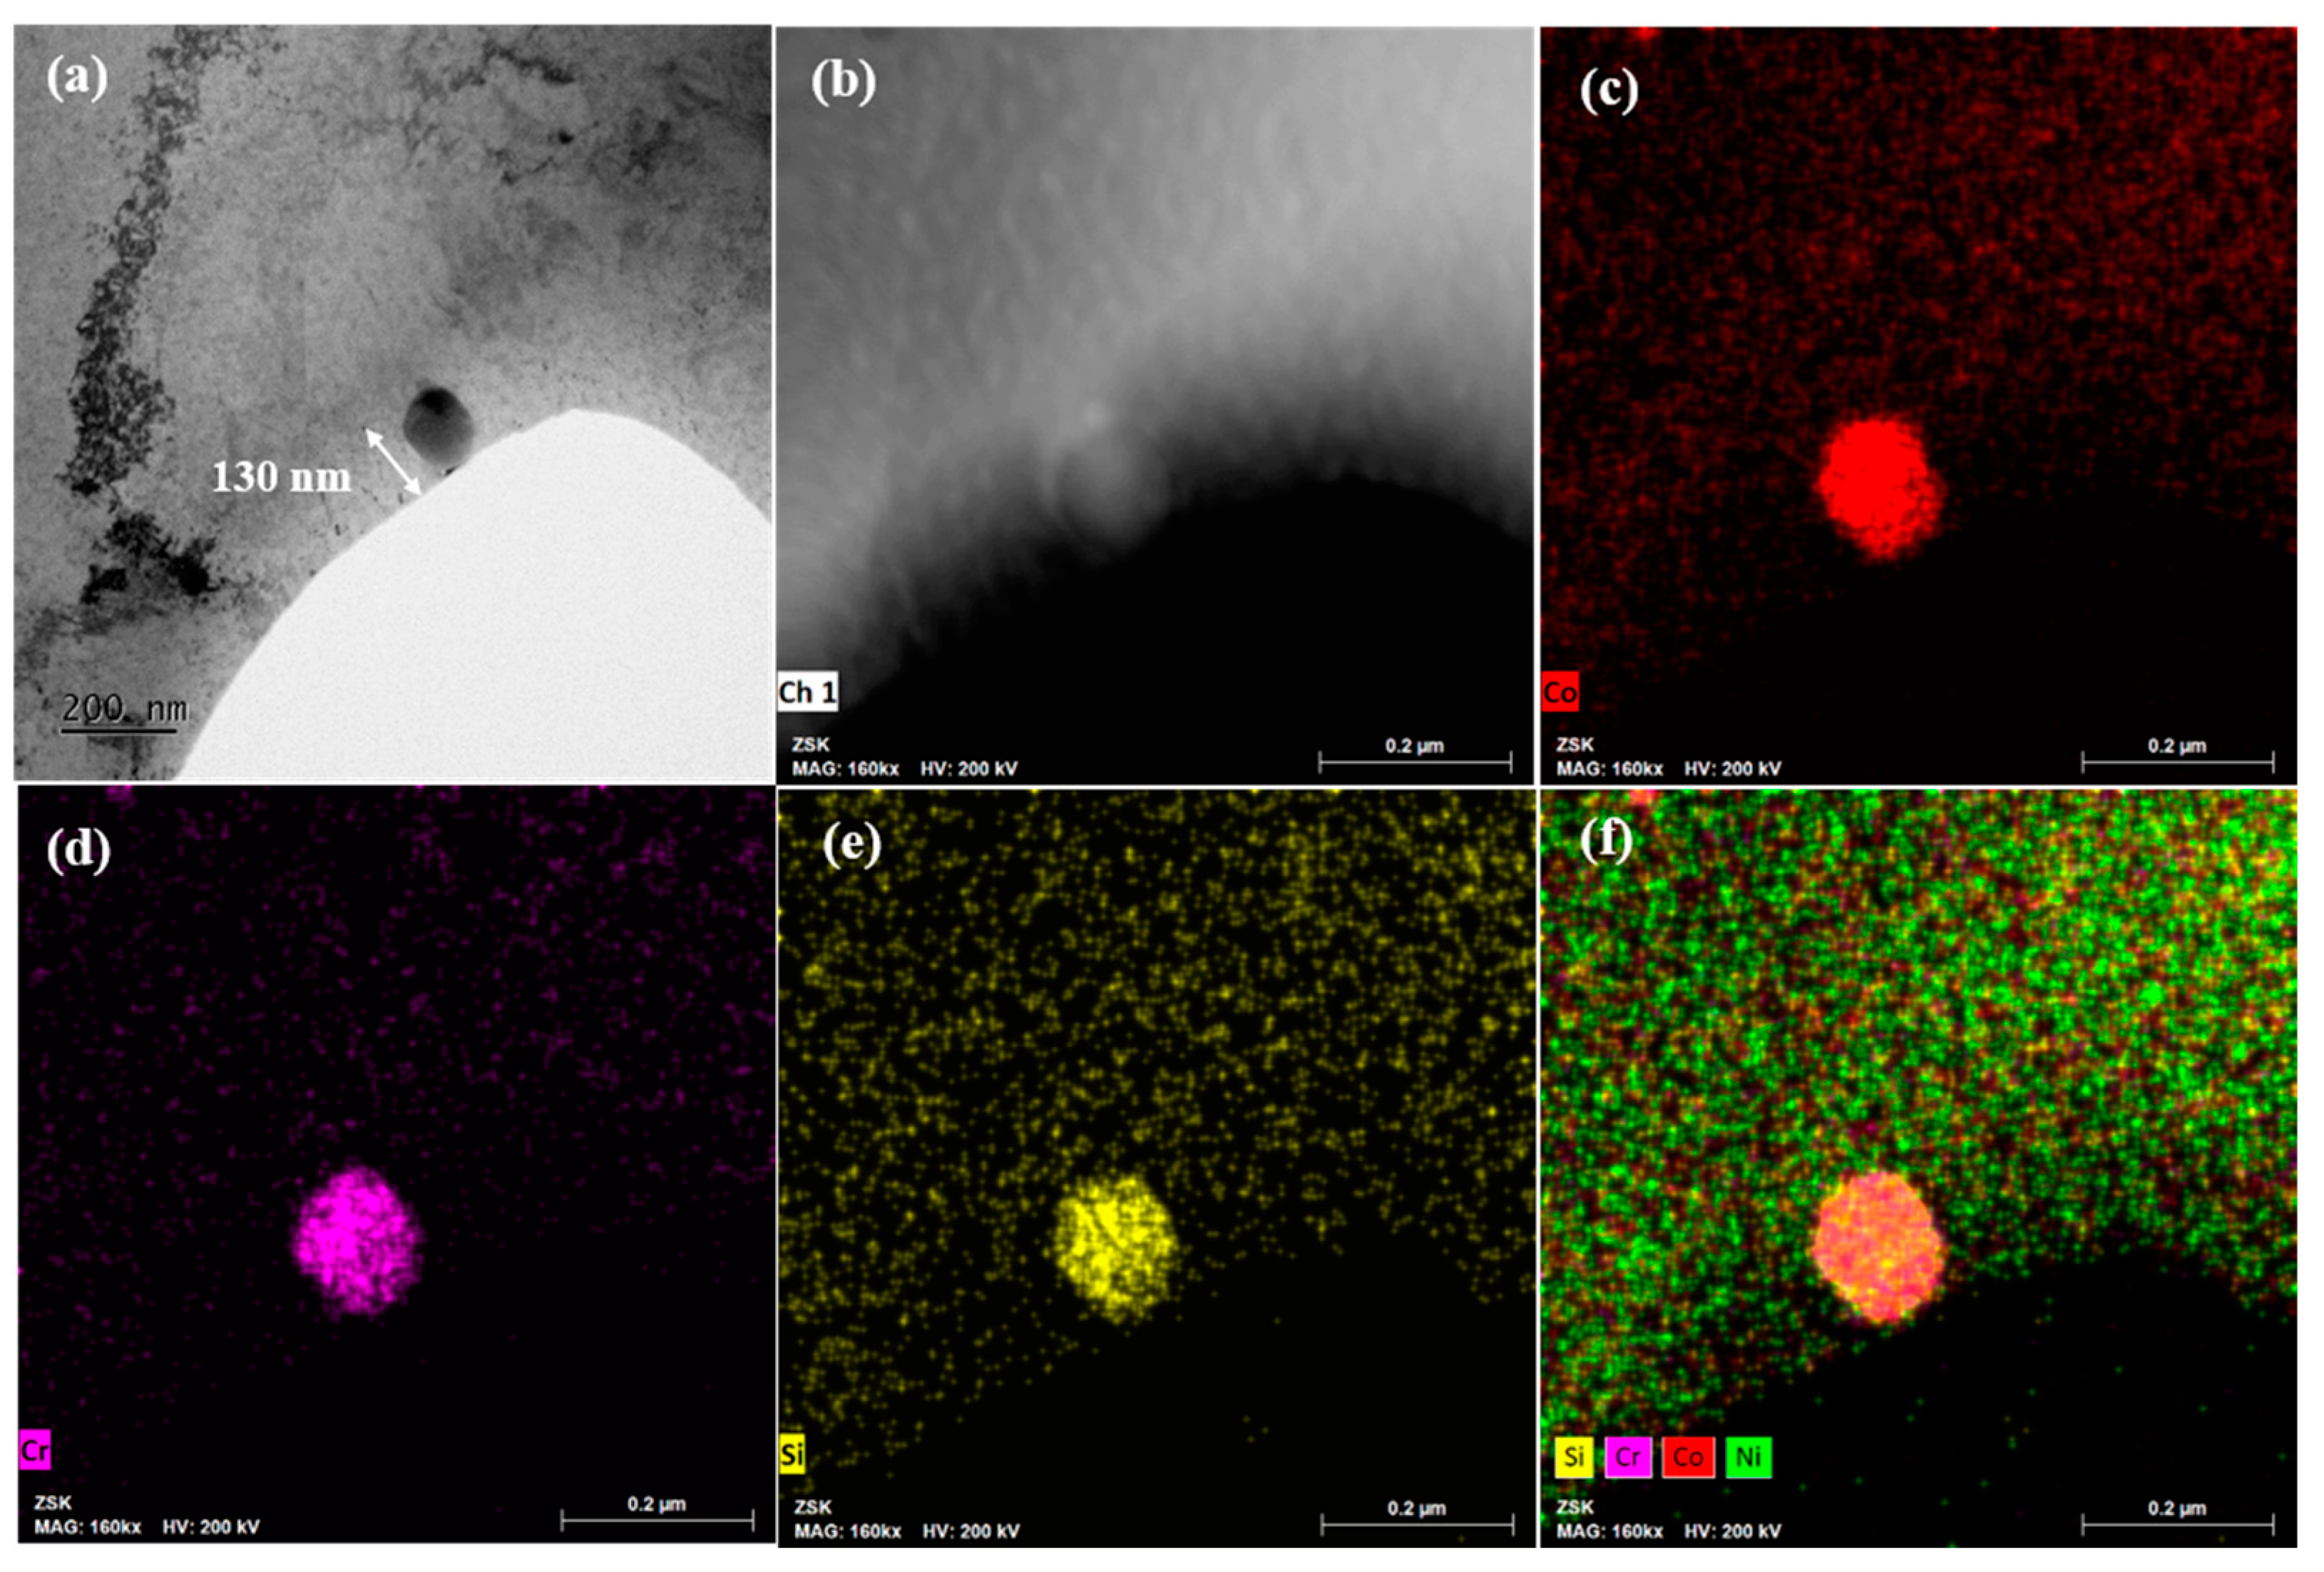
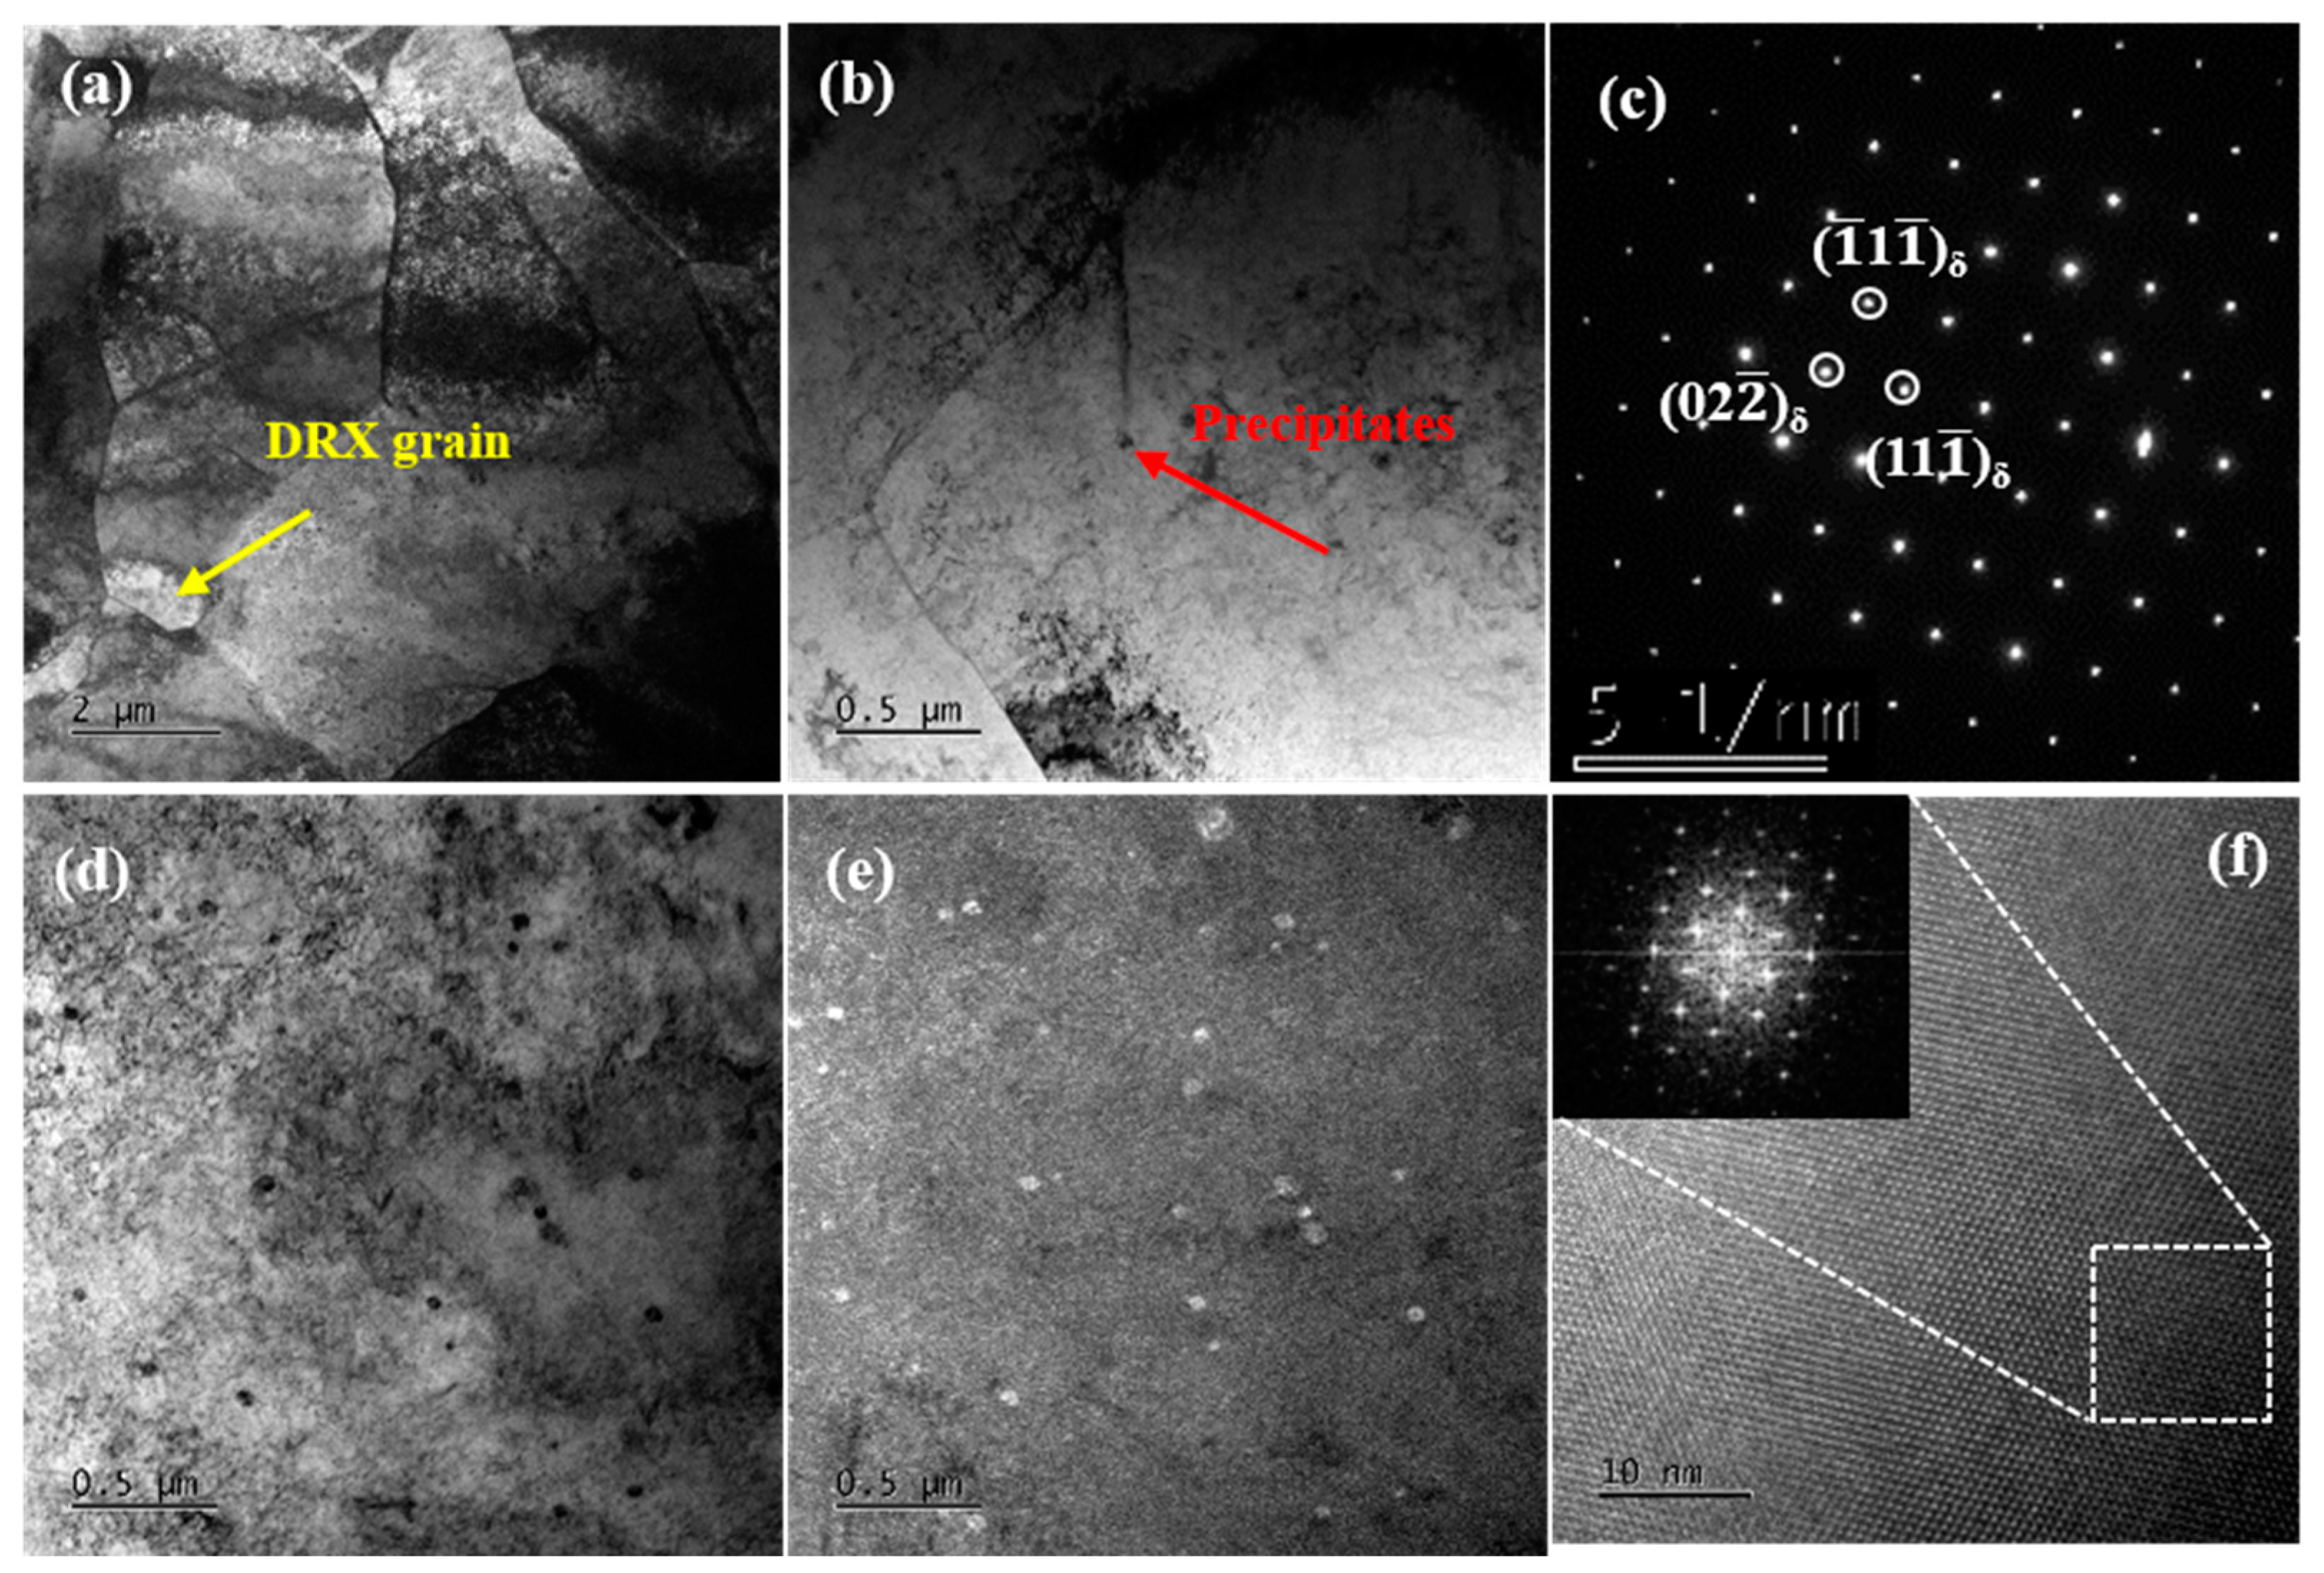
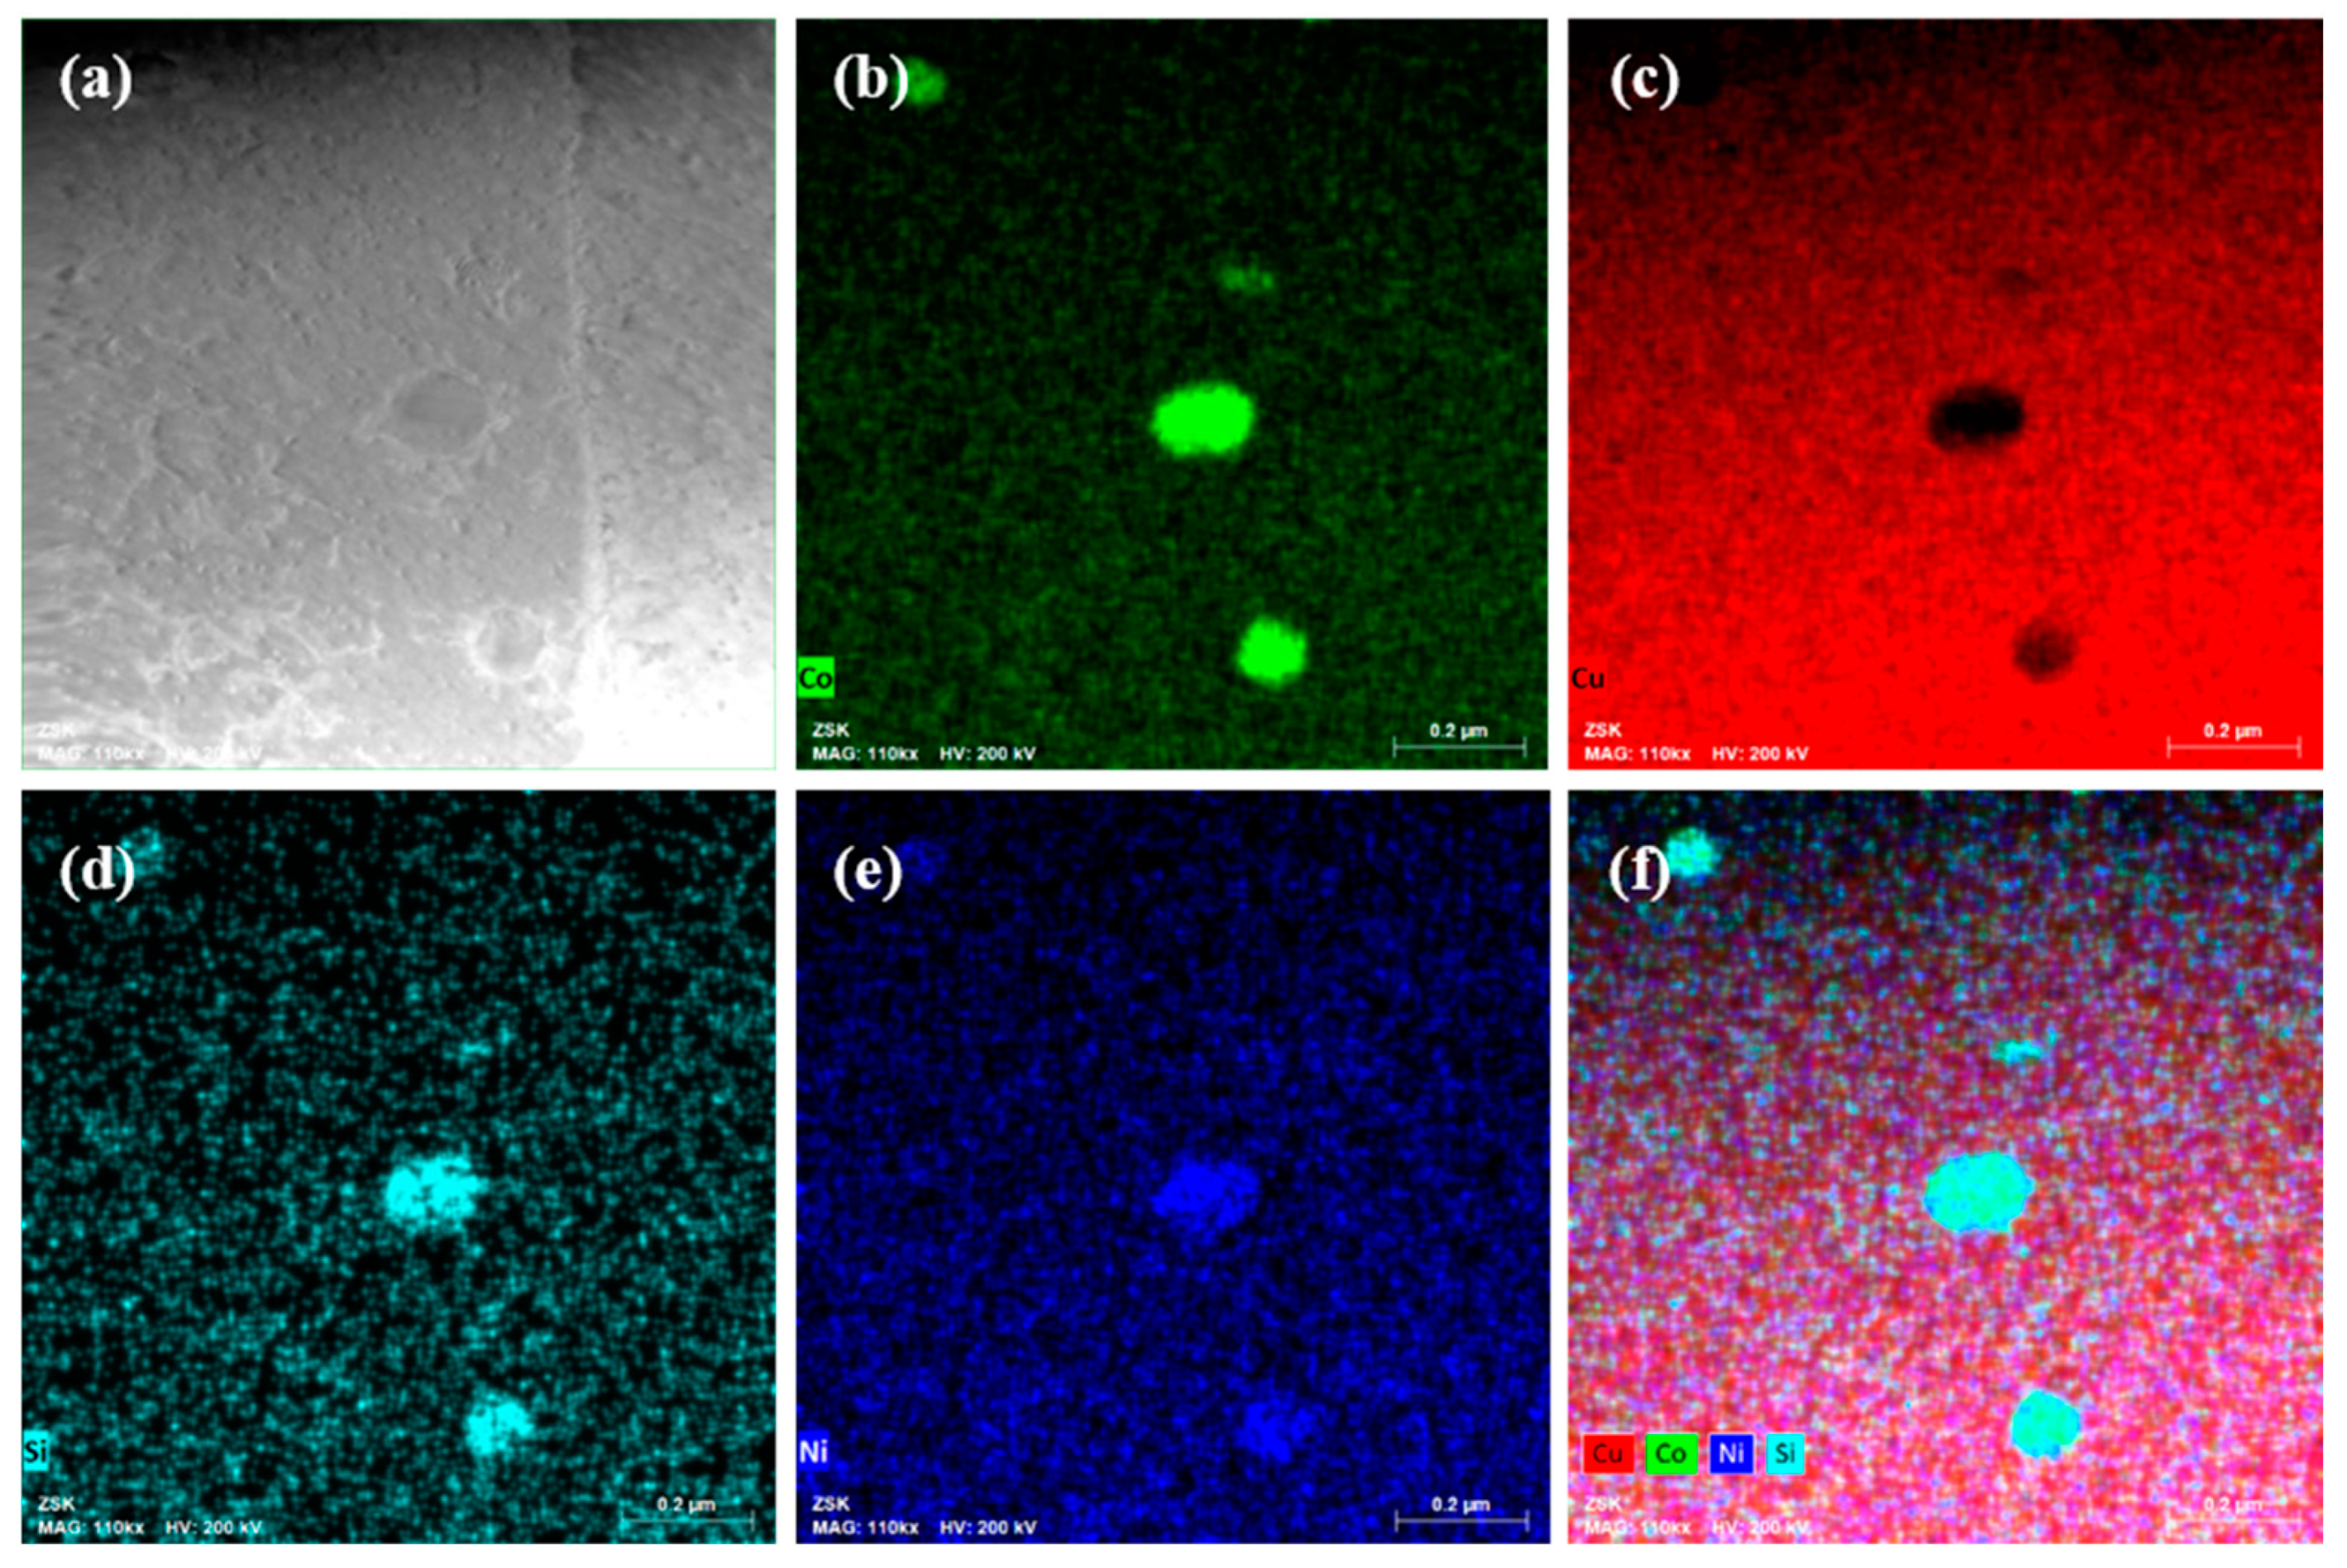
3.2. TEM Observation

Figure 3 shows the TEM results of the new type of Cu-1.1–Ni-0.7–Co-0.45–Si-0.3Cr alloy at a deformation temperature of 600 °C and strain rate of 0.01 s−1. Figure 3a,c show the bright-field TEM image of the alloy, and Figure 3b shows the dark-field TEM image corresponding to Figure 3a. One can see that many dislocation lines and dislocation tangles are present in the new type of Cu-1.1–Ni-0.7–Co-0.45–Si-0.3Cr alloy. Additionally, there is a greater dislocation density at the grain boundaries than in the grains. This is because dislocation slips proliferate during thermal deformation and accumulate at grain boundaries. At this temperature, the grain boundaries rapidly transform into high-angle grain boundaries, and the dislocation density of the grains decreases. The dark-field phase image shows that the precipitates gather at the grain boundaries, which play the role of nailing the grain boundaries and sub-grain boundaries. In addition, it can also be seen that many nanoscale precipitates are uniformly distributed in the new type Cu-1.1–Ni-0.7–Co-0.45–Si-0.3Cr alloy under these hot compression conditions. A related work has indicated that these small precipitates can pin the dislocations and the grain boundaries during the deformation process [22]. This is why the peak stress is high and the deformation resistance is good for these alloys at low deformation temperatures. In order to obtain more information about the precipitates and their morphology, high-resolution transmission electron microscopy (HRTEM) (Thermo Fisher Scientific Inc., Waltham, MA, USA) and fast Fourier transform (FFT) patterns of the precipitates were determined, as shown in Figure 3d–f. The results show that the precipitate is the (Ni, Co)2Si phase, and the average size of the precipitate phase is approximately 26 nm.
In addition, one can observe some large precipitates in the new type of Cu-1.1–Ni-0.7–Co-0.45–Si-0.3Cr alloy under these hot compression conditions, as seen in Figure 4. From Figure 4a,b, one can see that the size of the large precipitates is approximately 130 nm. Figure 4c–f shows the energy dispersive spectrum (EDS) (Thermo Fisher Scientific Inc., Waltham, MA, USA) results of the large precipitates. The results indicate that the chemical composition of these precipitates mainly includes Co, Cr, and Si elements, and the atomic ratio of the (Cr, Co):Si is approximately 2:1, as shown in Table 2. Therefore, the large precipitates in the new type of Cu-1.1–Ni-0.7–Co-0.45–Si-0.3Cr alloy may be a (Cr, Co)2Si phase.
Figure 5 shows the TEM results of the Cu-1.1–Ni-0.7–Co-0.45–Si-0.3Cr alloy at a deformation temperature of 800 °C and strain rate of 0.01 s−1. By comparison with the results in Figure 3 and Figure 5, it can be found that the density of the dislocation of the Cu-1.1–Ni-0.7–Co-0.45–Si-0.3Cr alloy at the deformation temperature of 800 °C is less than that at the deformation temperature of 600 °C. This is because the dislocations are consumed, and the dynamic softening effect is the main deformation mechanism at this high temperature. This also explains why the peak stress value at the high temperature is low. Furthermore, a new distortion-free grain is produced in the Cu-1.1–Ni-0.7–Co-0.45–Si-0.3Cr alloy at the deformation temperature of 800 °C. In Figure 5, one can see that some precipitates are distributed in the Cu-1.1–Ni-0.7–Co-0.45–Si-0.3Cr alloy, and the size of the precipitates is approximately 60 nm. However, as shown in Figure 5d,e, the contents of the precipitates at the deformation temperature of 800 °C are lower than those at the deformation temperature of 600 °C. Figure 5c, f shows the HRTEM micrograph and the diffraction pattern of the precipitates, and the results indicate that the precipitates also have a (Ni, Co)2Si structure. Figure 6 shows the EDS results of the precipitates in the Cu-1.1–Ni-0.7–Co-0.45–Si-0.3Cr alloy at a deformation temperature of 800 °C and 0.01 s−1. The results further illustrate that the precipitates’ phase is (Ni, Co)2Si.

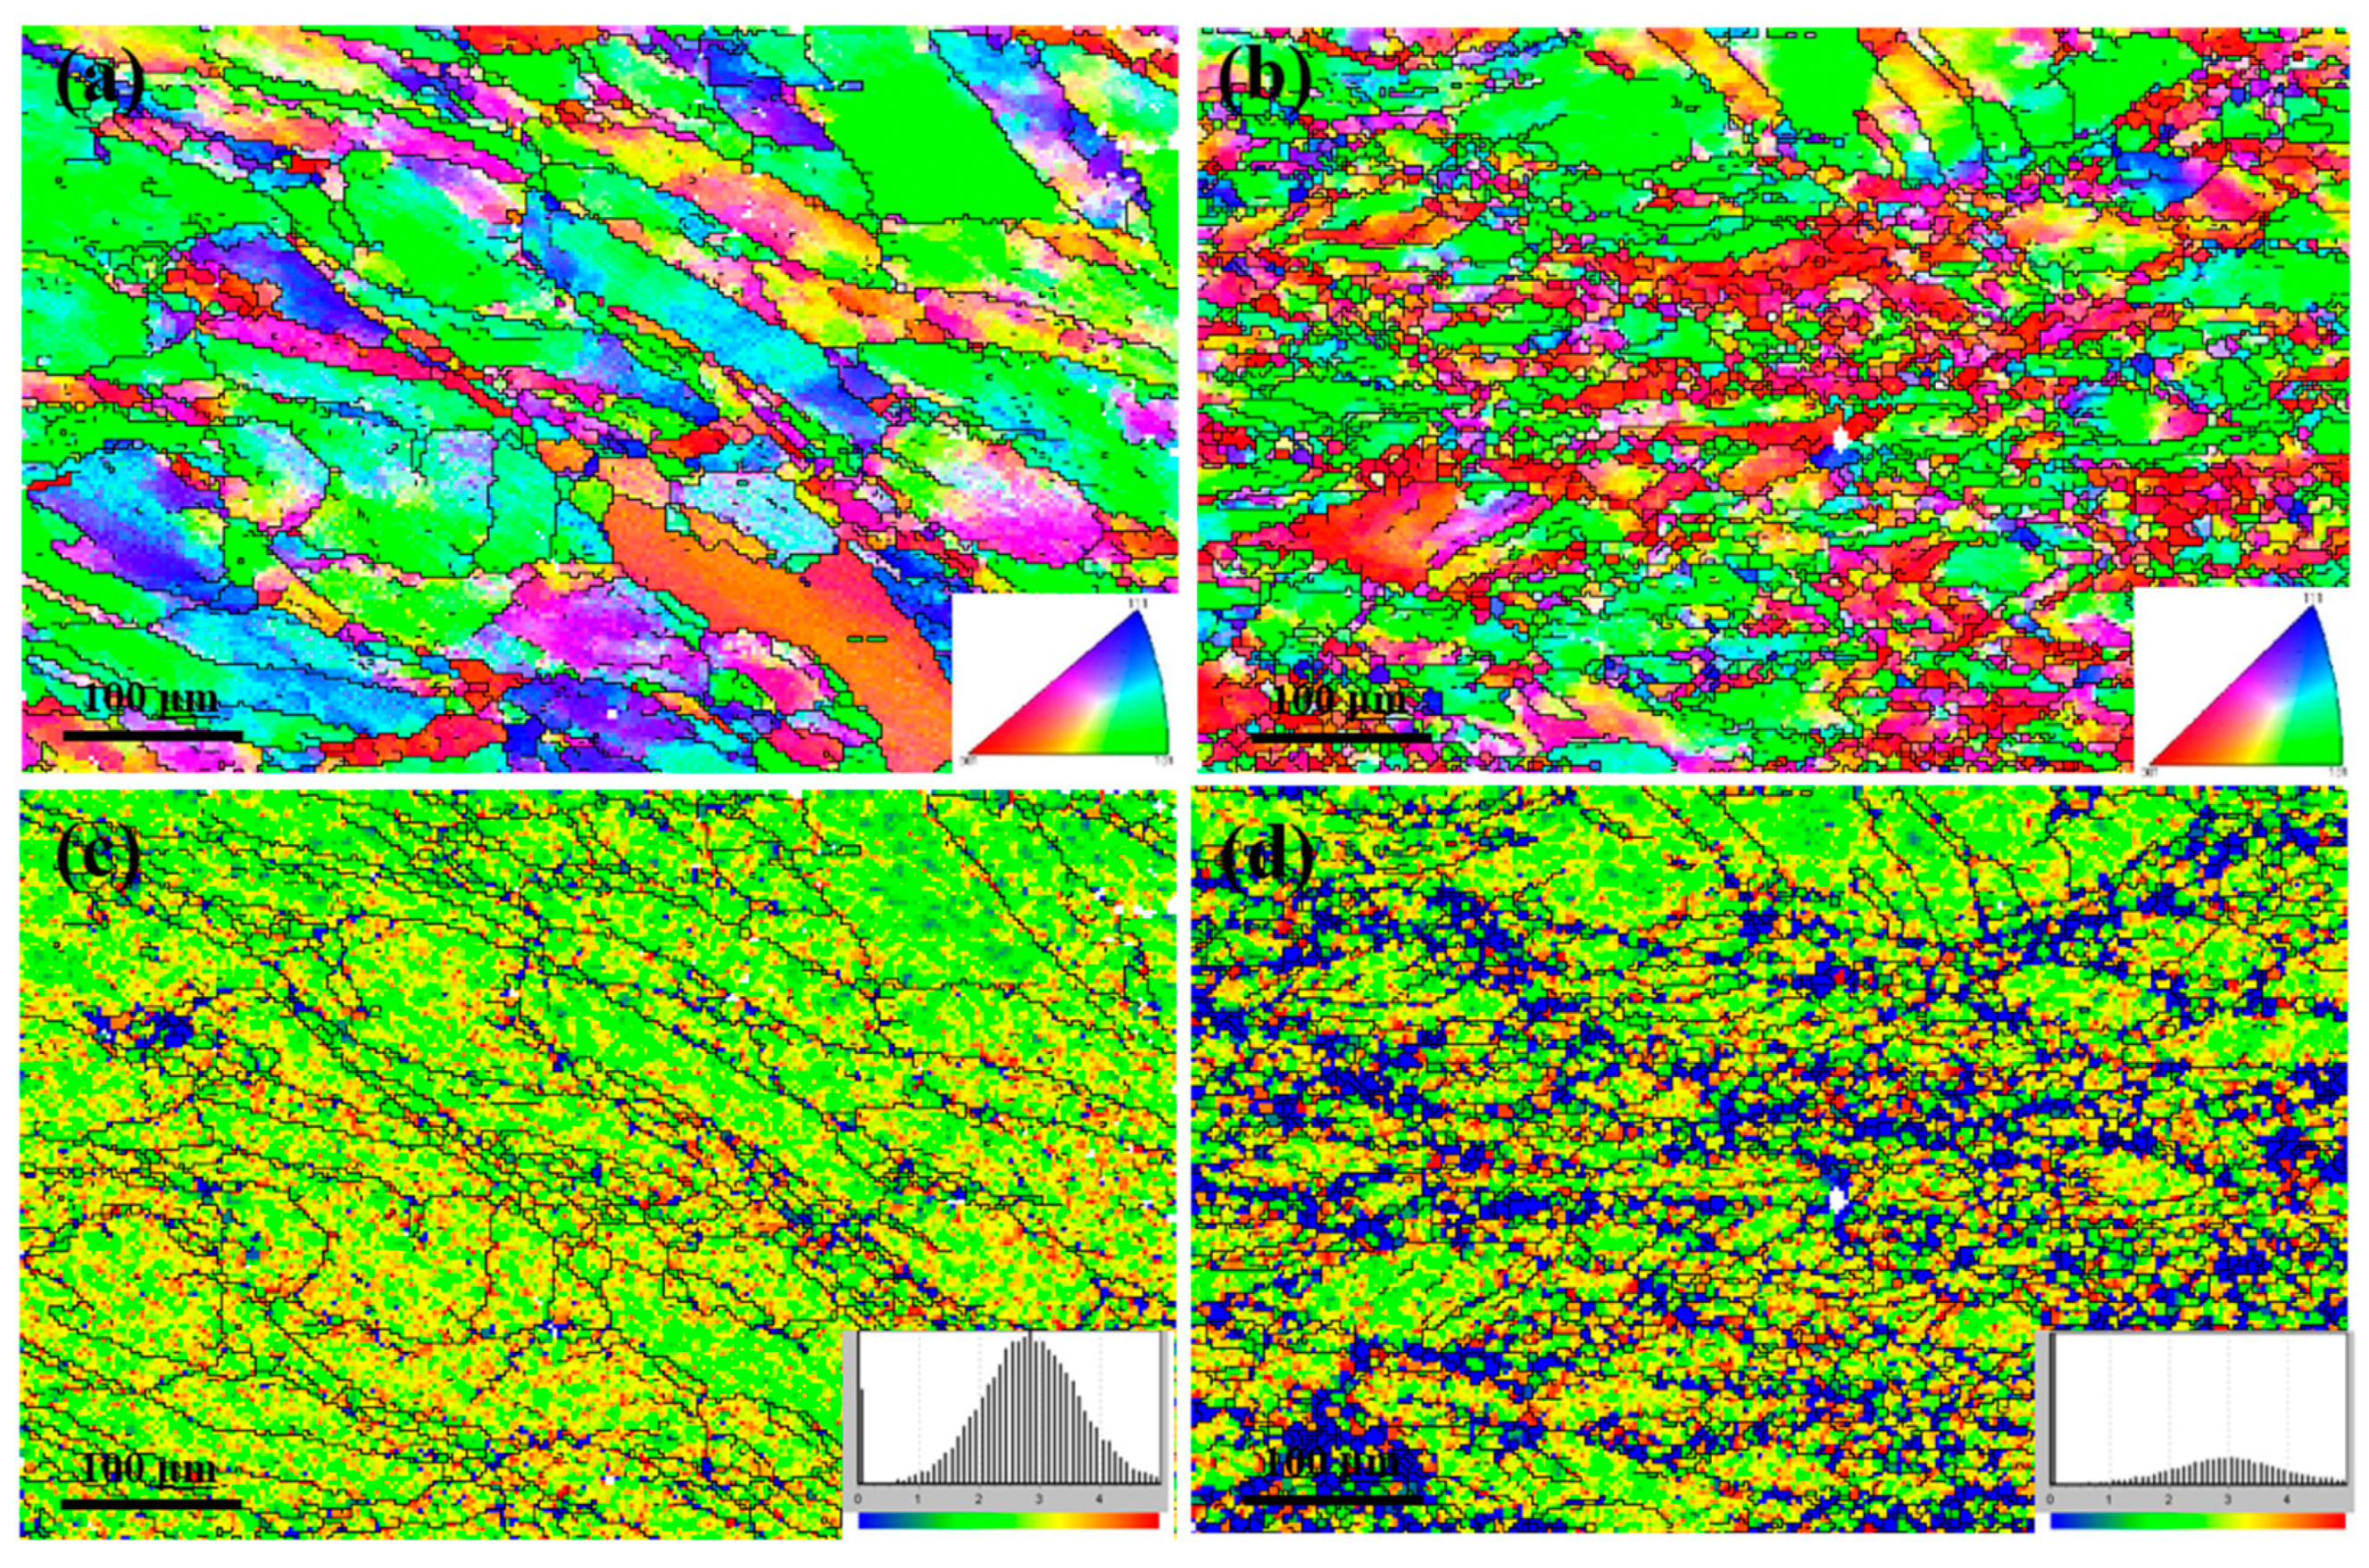
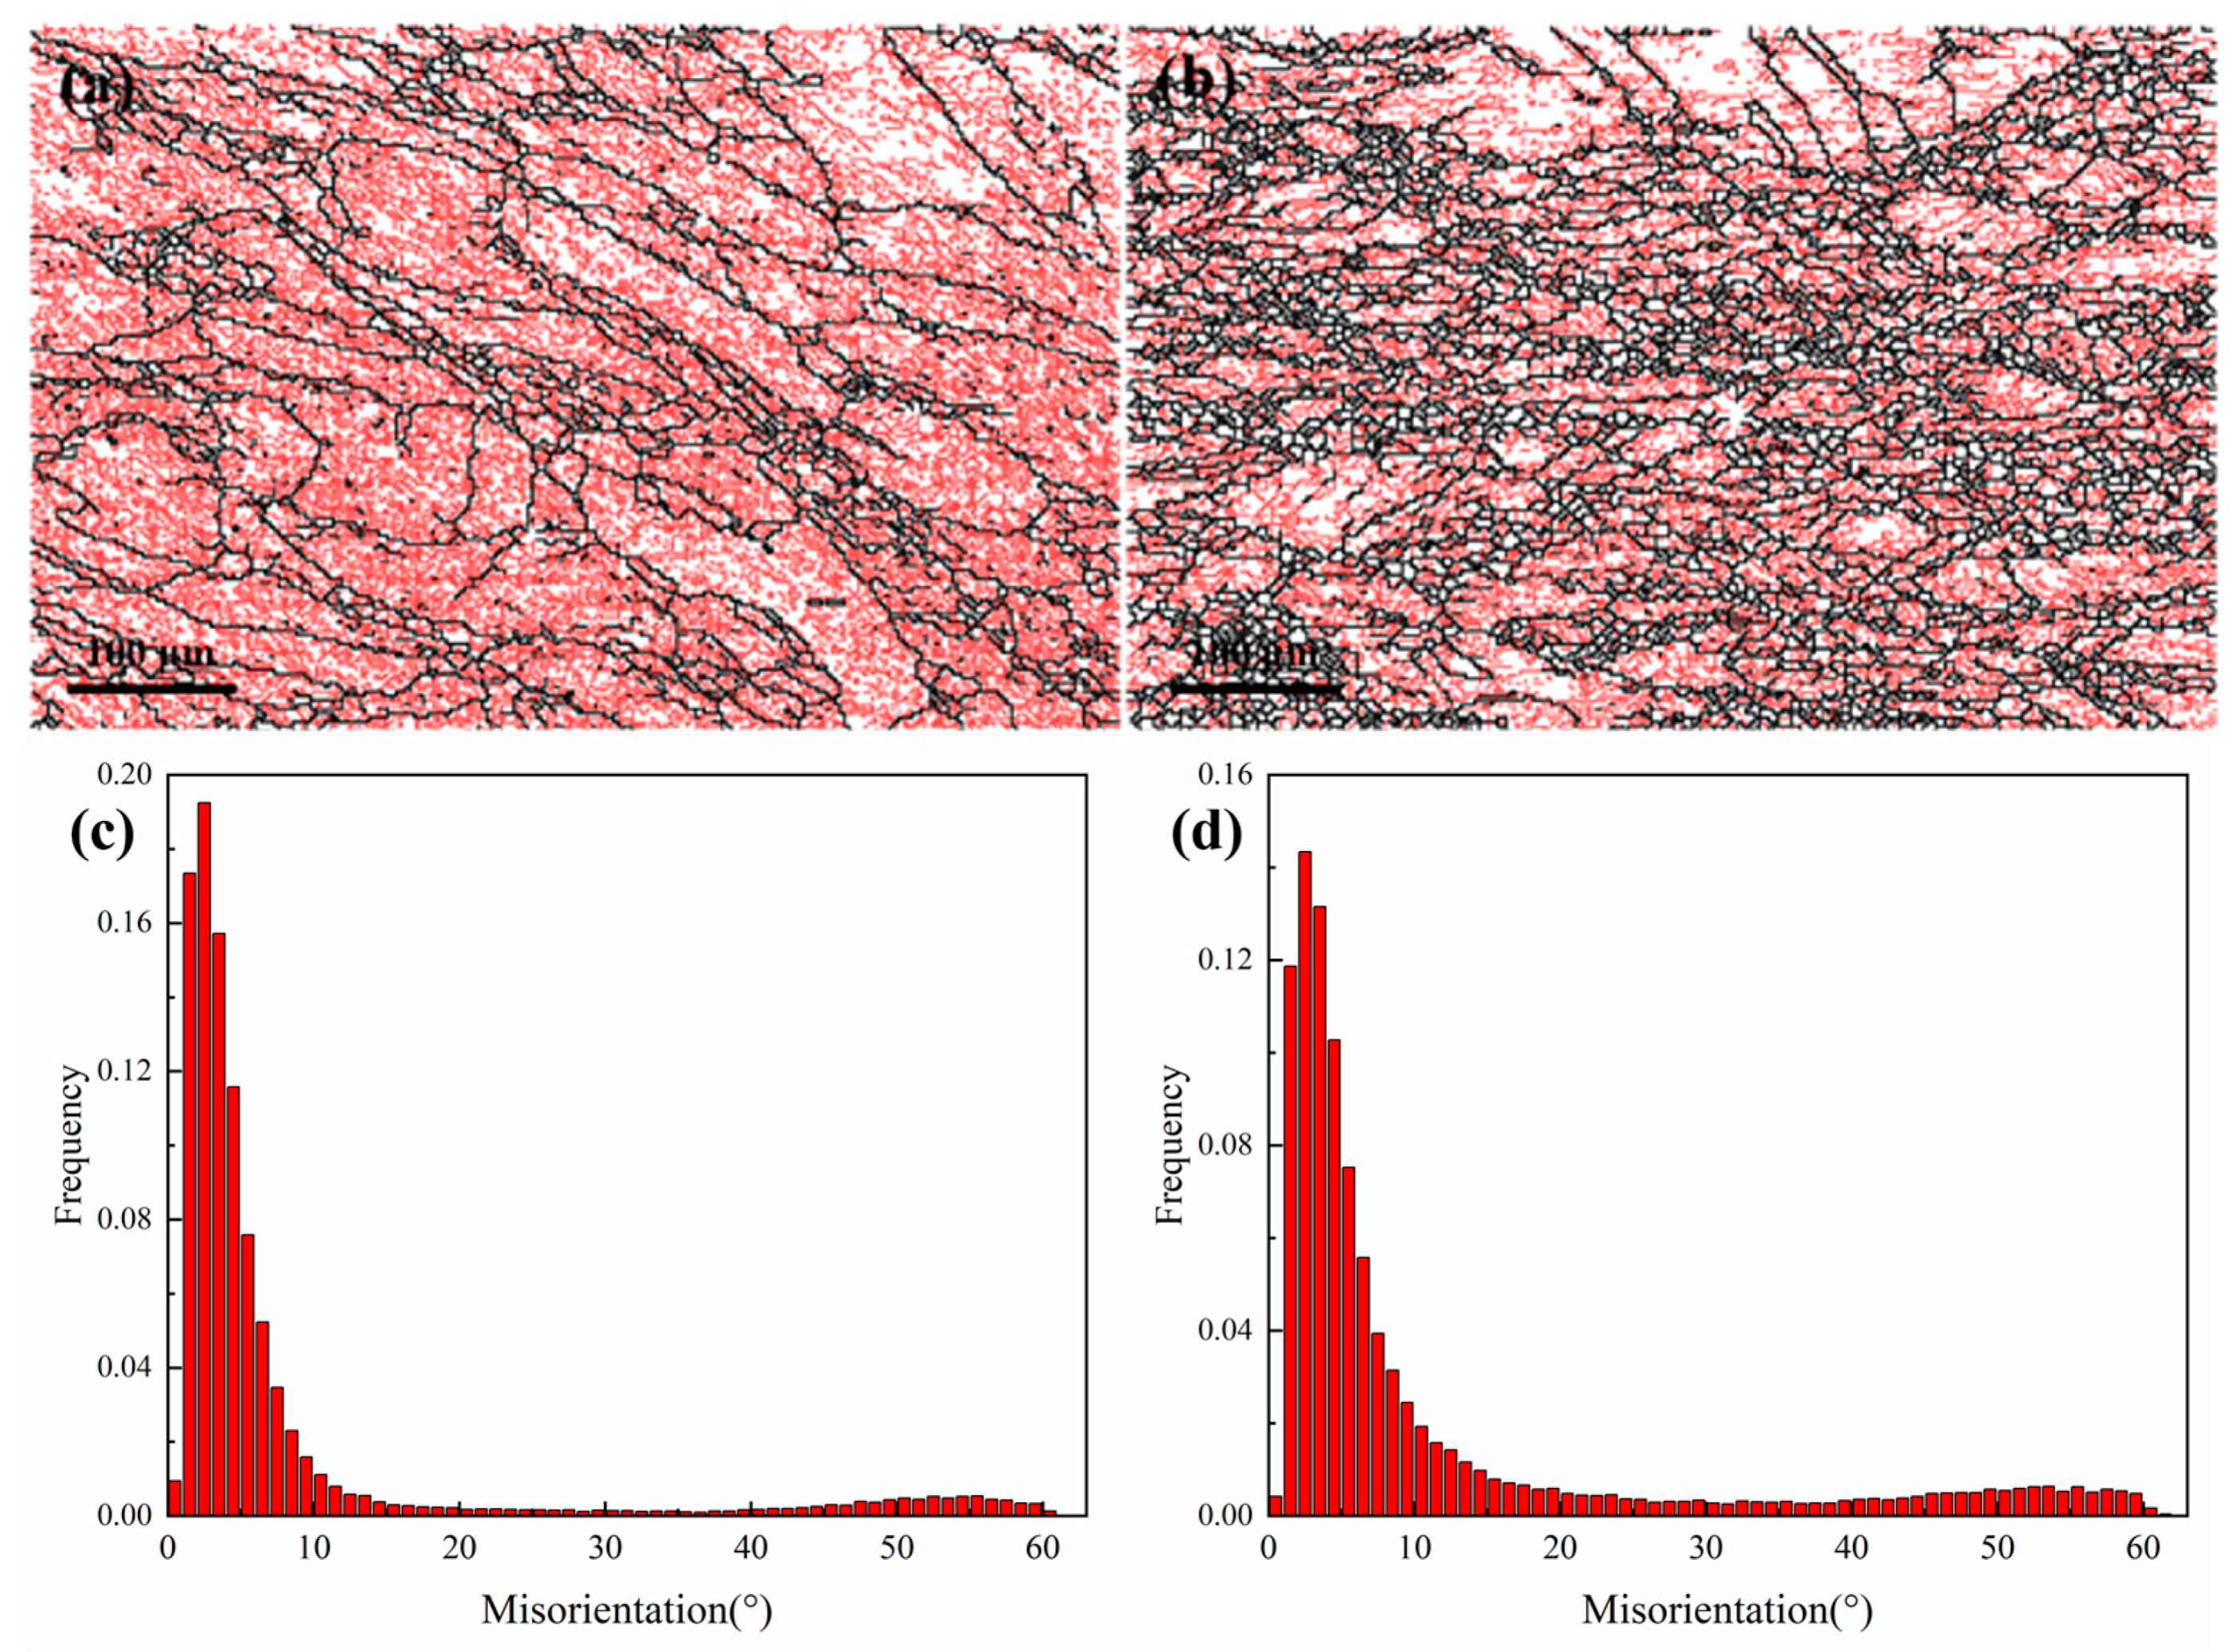
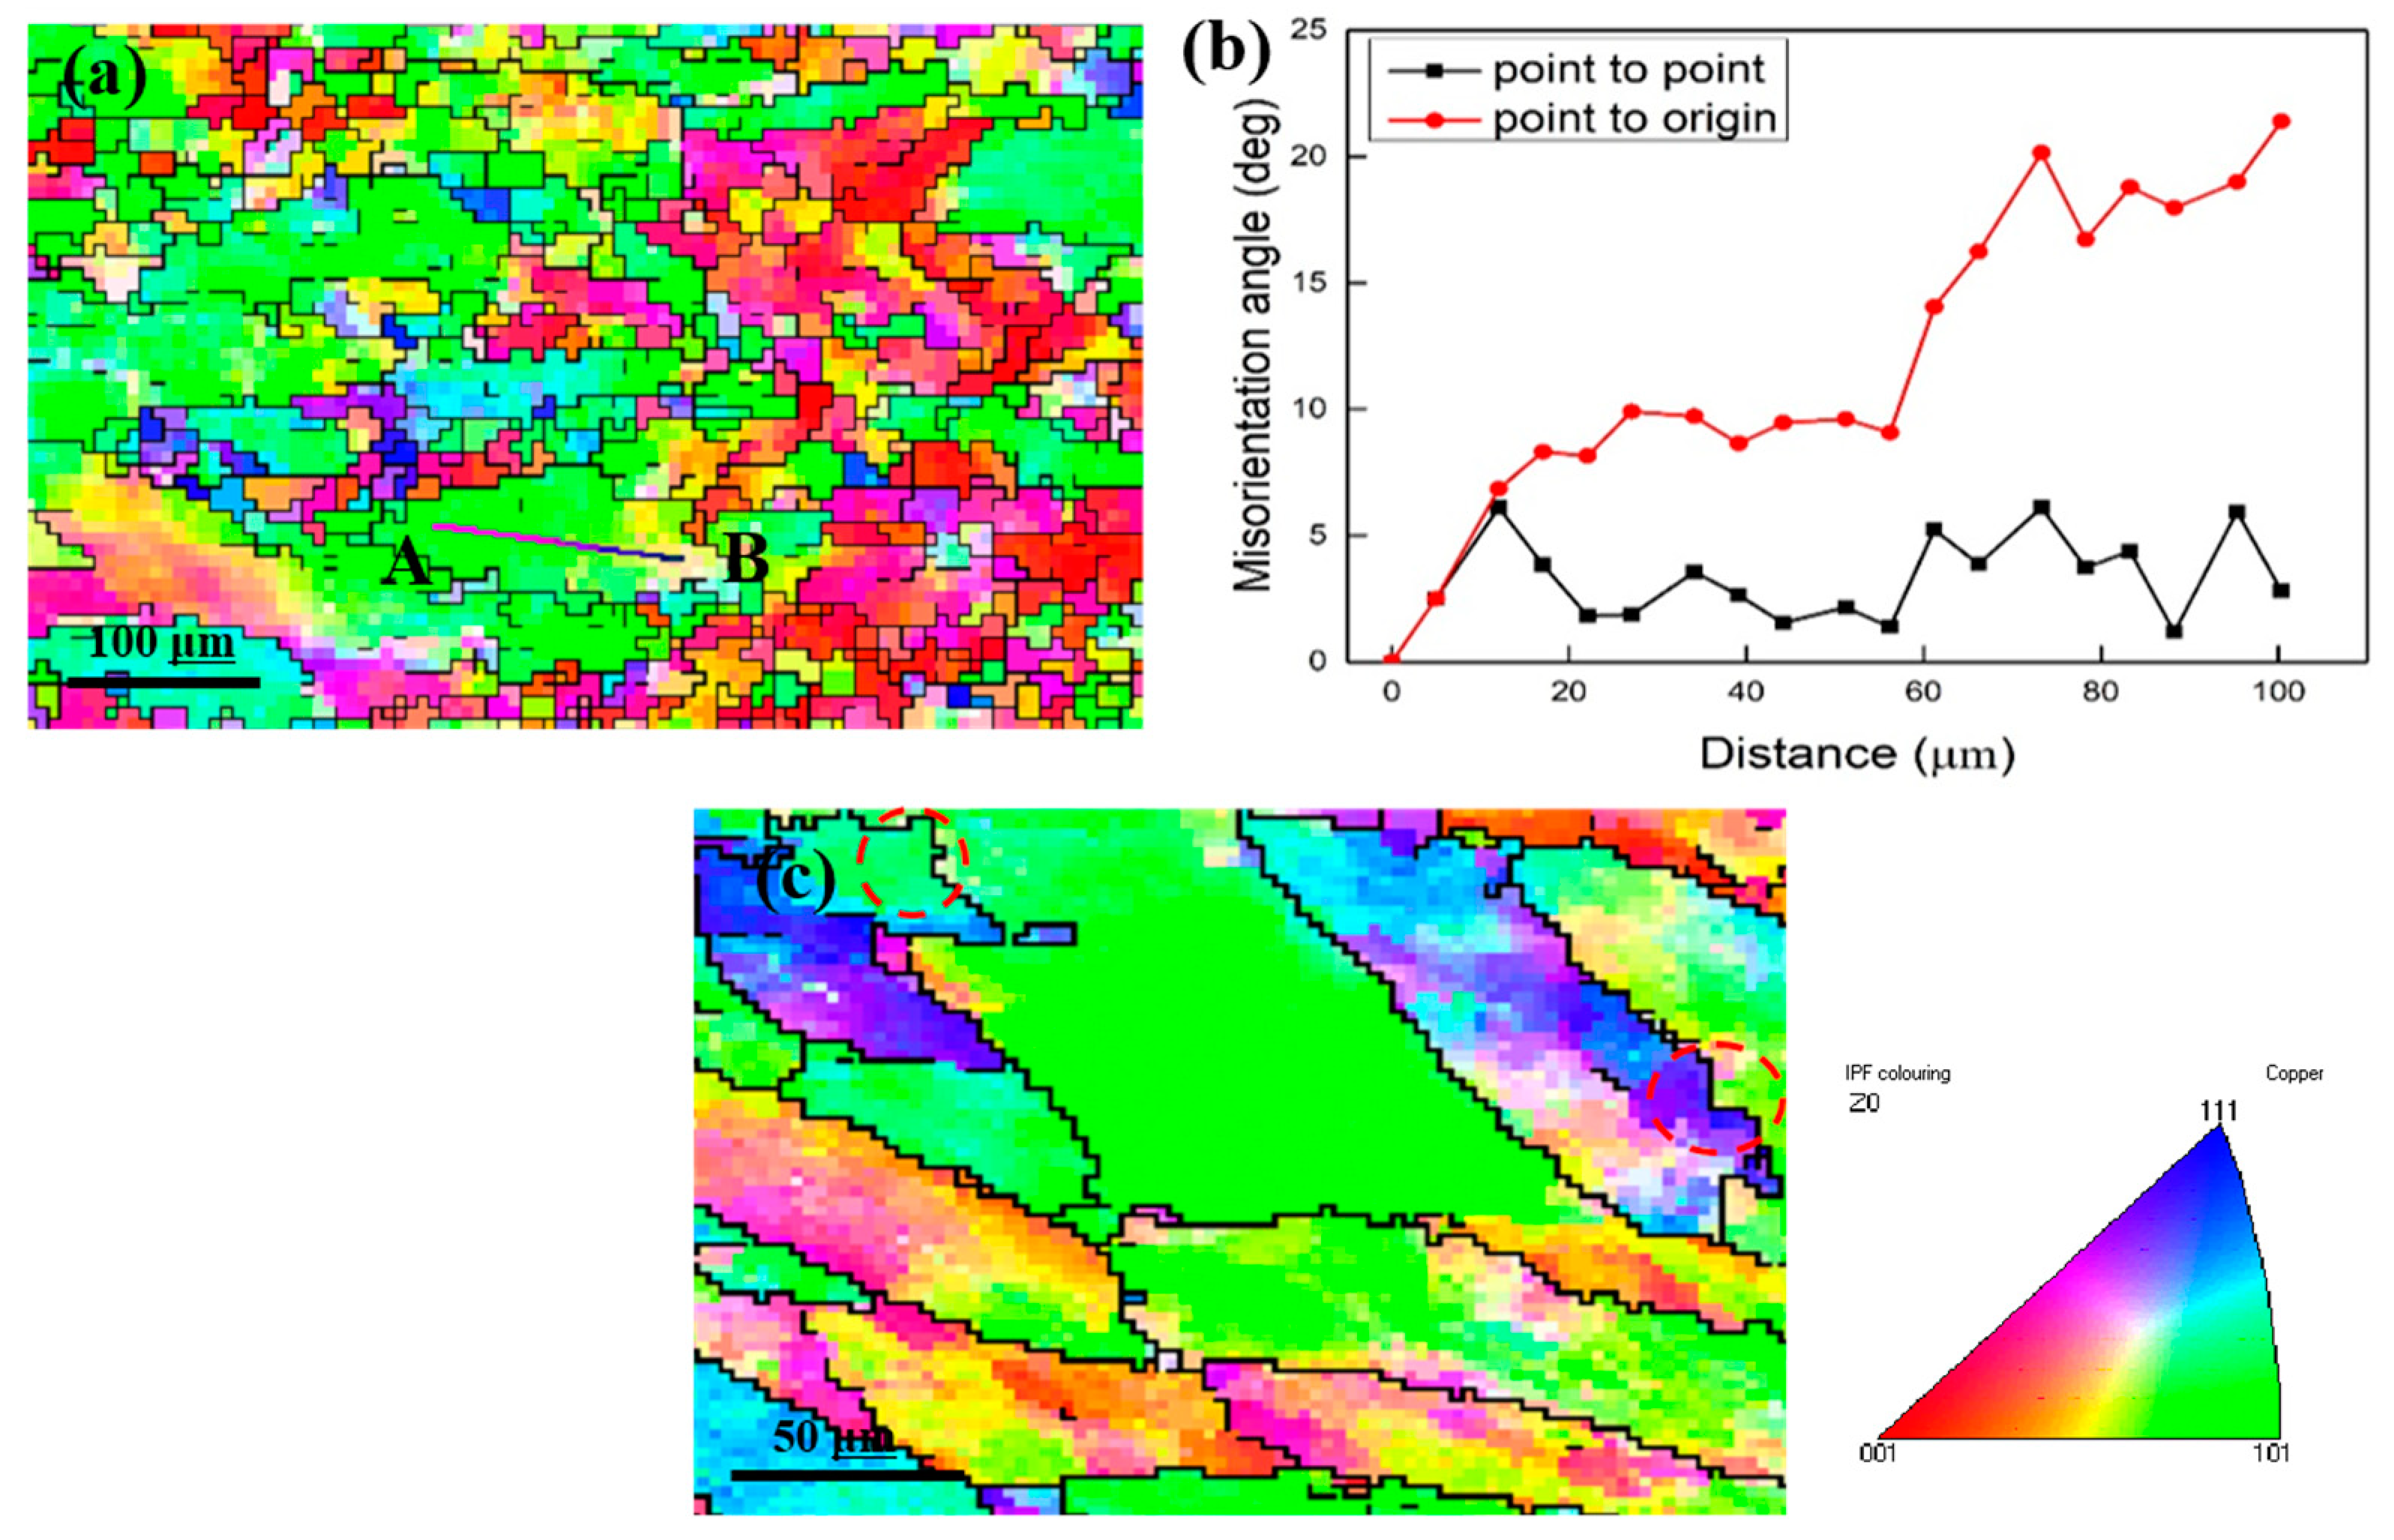
3.3. EBSD Observation

Figure 7 shows the EBSD results of the Cu-1.1–Ni-0.7–Co-0.45–Si-0.3Cr alloy at the deformation temperatures of 600 °C and 800 °C at 0.01 s−1. Figure 7a,b are the EBSD and inverse pole figure (IPF) results for the deformation temperatures of 600 °C and 800 °C, respectively. One can see that the structure of the alloy at 600 °C is one of coarse grains; however, the structure of the alloy at 800 °C is a “necklace” structure that has the characteristics of many small grains around coarse grains [23]. These results indicate that the alloy is formed through a recrystallization process when the deformation temperature reaches 800 °C, but this phenomenon does not occur when the deformation temperature is 600 °C. Figure 7c,d show the kernel average misorientation (KAM) results of the Cu-1.1–Ni-0.7–Co-0.45–Si-0.3Cr alloy for the deformation temperatures of 600 °C and 800 °C. It can be seen that the density of the dislocation in the alloy for the deformation temperature is 800 °C is low than that for the deformation temperature is 600 °C. Furthermore, there are no dislocations in the recrystallized grains (see Figure 7d), which suggests that the recrystallization process at the deformation temperature of 800 °C consumed the dislocation.
Figure 8 shows the orientation diagram and misorientation angle distribution of the Cu-1.1–Ni-0.7–Co-0.45–Si-0.3Cr alloy at the deformation temperatures of 600 °C and 800 °C when the strain rate is the same (0.01 s−1). The results suggest that there are many low-angle grain boundaries in the alloy when the deformation temperature is low, as shown in Figure 8a,c. However, when the deformation temperature rises, the number of high-angle grain boundaries in the alloy increases, as shown in Figure 8b,d. These results also illustrate that a high deformation temperature promotes the recrystallization process.

4. Discussion

4.1. Critical Strain

To analyze the occurrence of dynamic recrystallization during thermal deformation at different temperatures, the dynamic recrystallization model proposed by Poliak and Jonas [24,25] was used to quantify it. Poliak and Jonas suggested that there will be an inflection point in the work hardening rate ( θ )–stress ( σ ) when dynamic recrystallization occurs. Therefore, when dynamic recrystallization is beginning, there is a relationship between the work hardening rate and stress, as shown in the following formula:
2 θ σ = 0
The work hardening rate is a function of the stress σ and strain ε:
θ = σ ε
Then, the θ / σ derivative is:
θ σ = ( ln θ ) ε
Substituting Equation (3) into Equation (1) and using the strain ε instead of the stress σ , one can obtain:
ε ( ln θ ε ) = 0
Thus, in the ( ln θ ) / ε - ε curve, when 2 ( ln θ ) / ε 2 = 0 or the minimum value of the curve corresponds to the beginning of the dynamic recrystallization process, the stress and strain value indicate the start of the dynamic recrystallization, the critical stress, and the critical strain, respectively.
Figure 9 shows the ( ln θ ) / ε - ε curve of the Cu-1.1–Ni-0.7–Co-0.45–Si-0.3Cr alloy at different deformation temperatures when the strain rate is 0.01 s−1. From the figures, it can be seen that the critical strain values of the alloy at 600 °C, 700 °C, and 800 °C are 0.24, 0.085, and 0.05, respectively. This means that as the hot compression temperature increases, less strain is required for the alloy to undergo dynamic recrystallization. At different temperatures, the critical strain differences of the alloy are 0.155 and 0.035, respectively. This shows that with the same temperature difference, the lower thermal compression temperature leads to a significantly increased critical strain value. This result further illustrates that dynamic recrystallization occurs more readily when the deformation temperature is high.

4.2. Dynamic Recrystallization Mechanism

As mentioned above, there is an obvious dynamic recrystallization phenomenon of the Cu-1.1–Ni-0.7–Co-0.45–Si-0.3Cr alloy during the hot deformation process. Hence, it is important to study the dynamic recrystallization mechanism of the alloy’s deformation. As is well-known, the dynamic recrystallization mechanism mainly includes continuous dynamic recrystallization (CDRX) and discontinuous dynamic recrystallization (DDRX). Usually, the CDRX process is accompanied by the formation of dislocations and large-angle grain boundaries and a misorientation gradient in the grains [26,27]. These phenomena are verified by the above experimental results.
Furthermore, the CDRX process causes the point-to-origin orientations of the microstructure to exceed 15° [28,29]. Figure 10 shows the EBSD map and the misorientation distribution of the Cu-1.1–Ni-0.7–Co-0.45–Si-0.3Cr alloy. Figure 10b shows the point-to-point misorientation distribution and the point-to-origin misorientation distribution along the line A–B in Figure 10a. One can see that the point-to-point misorientation is less than 15°, and the point-to-origin misorientation along the line A–B is larger than 15° at the distance of 60 μm. Therefore, dynamic recrystallization clearly has a CDRX process. Related studies have reported that the DDRX process has typical characteristics of saw-tooth and bulging at the original coarse grain boundary [30]. In Figure 10c, it can also be found that there are many saw-tooths and a large degree of bulging at the grain boundary, as marked by the red circles. Hence, the dynamic recrystallization observed in this work also has a DDRX process. Generally, the CDRX process and the DDRX process have synergistic effects on dynamic recrystallization [31,32].

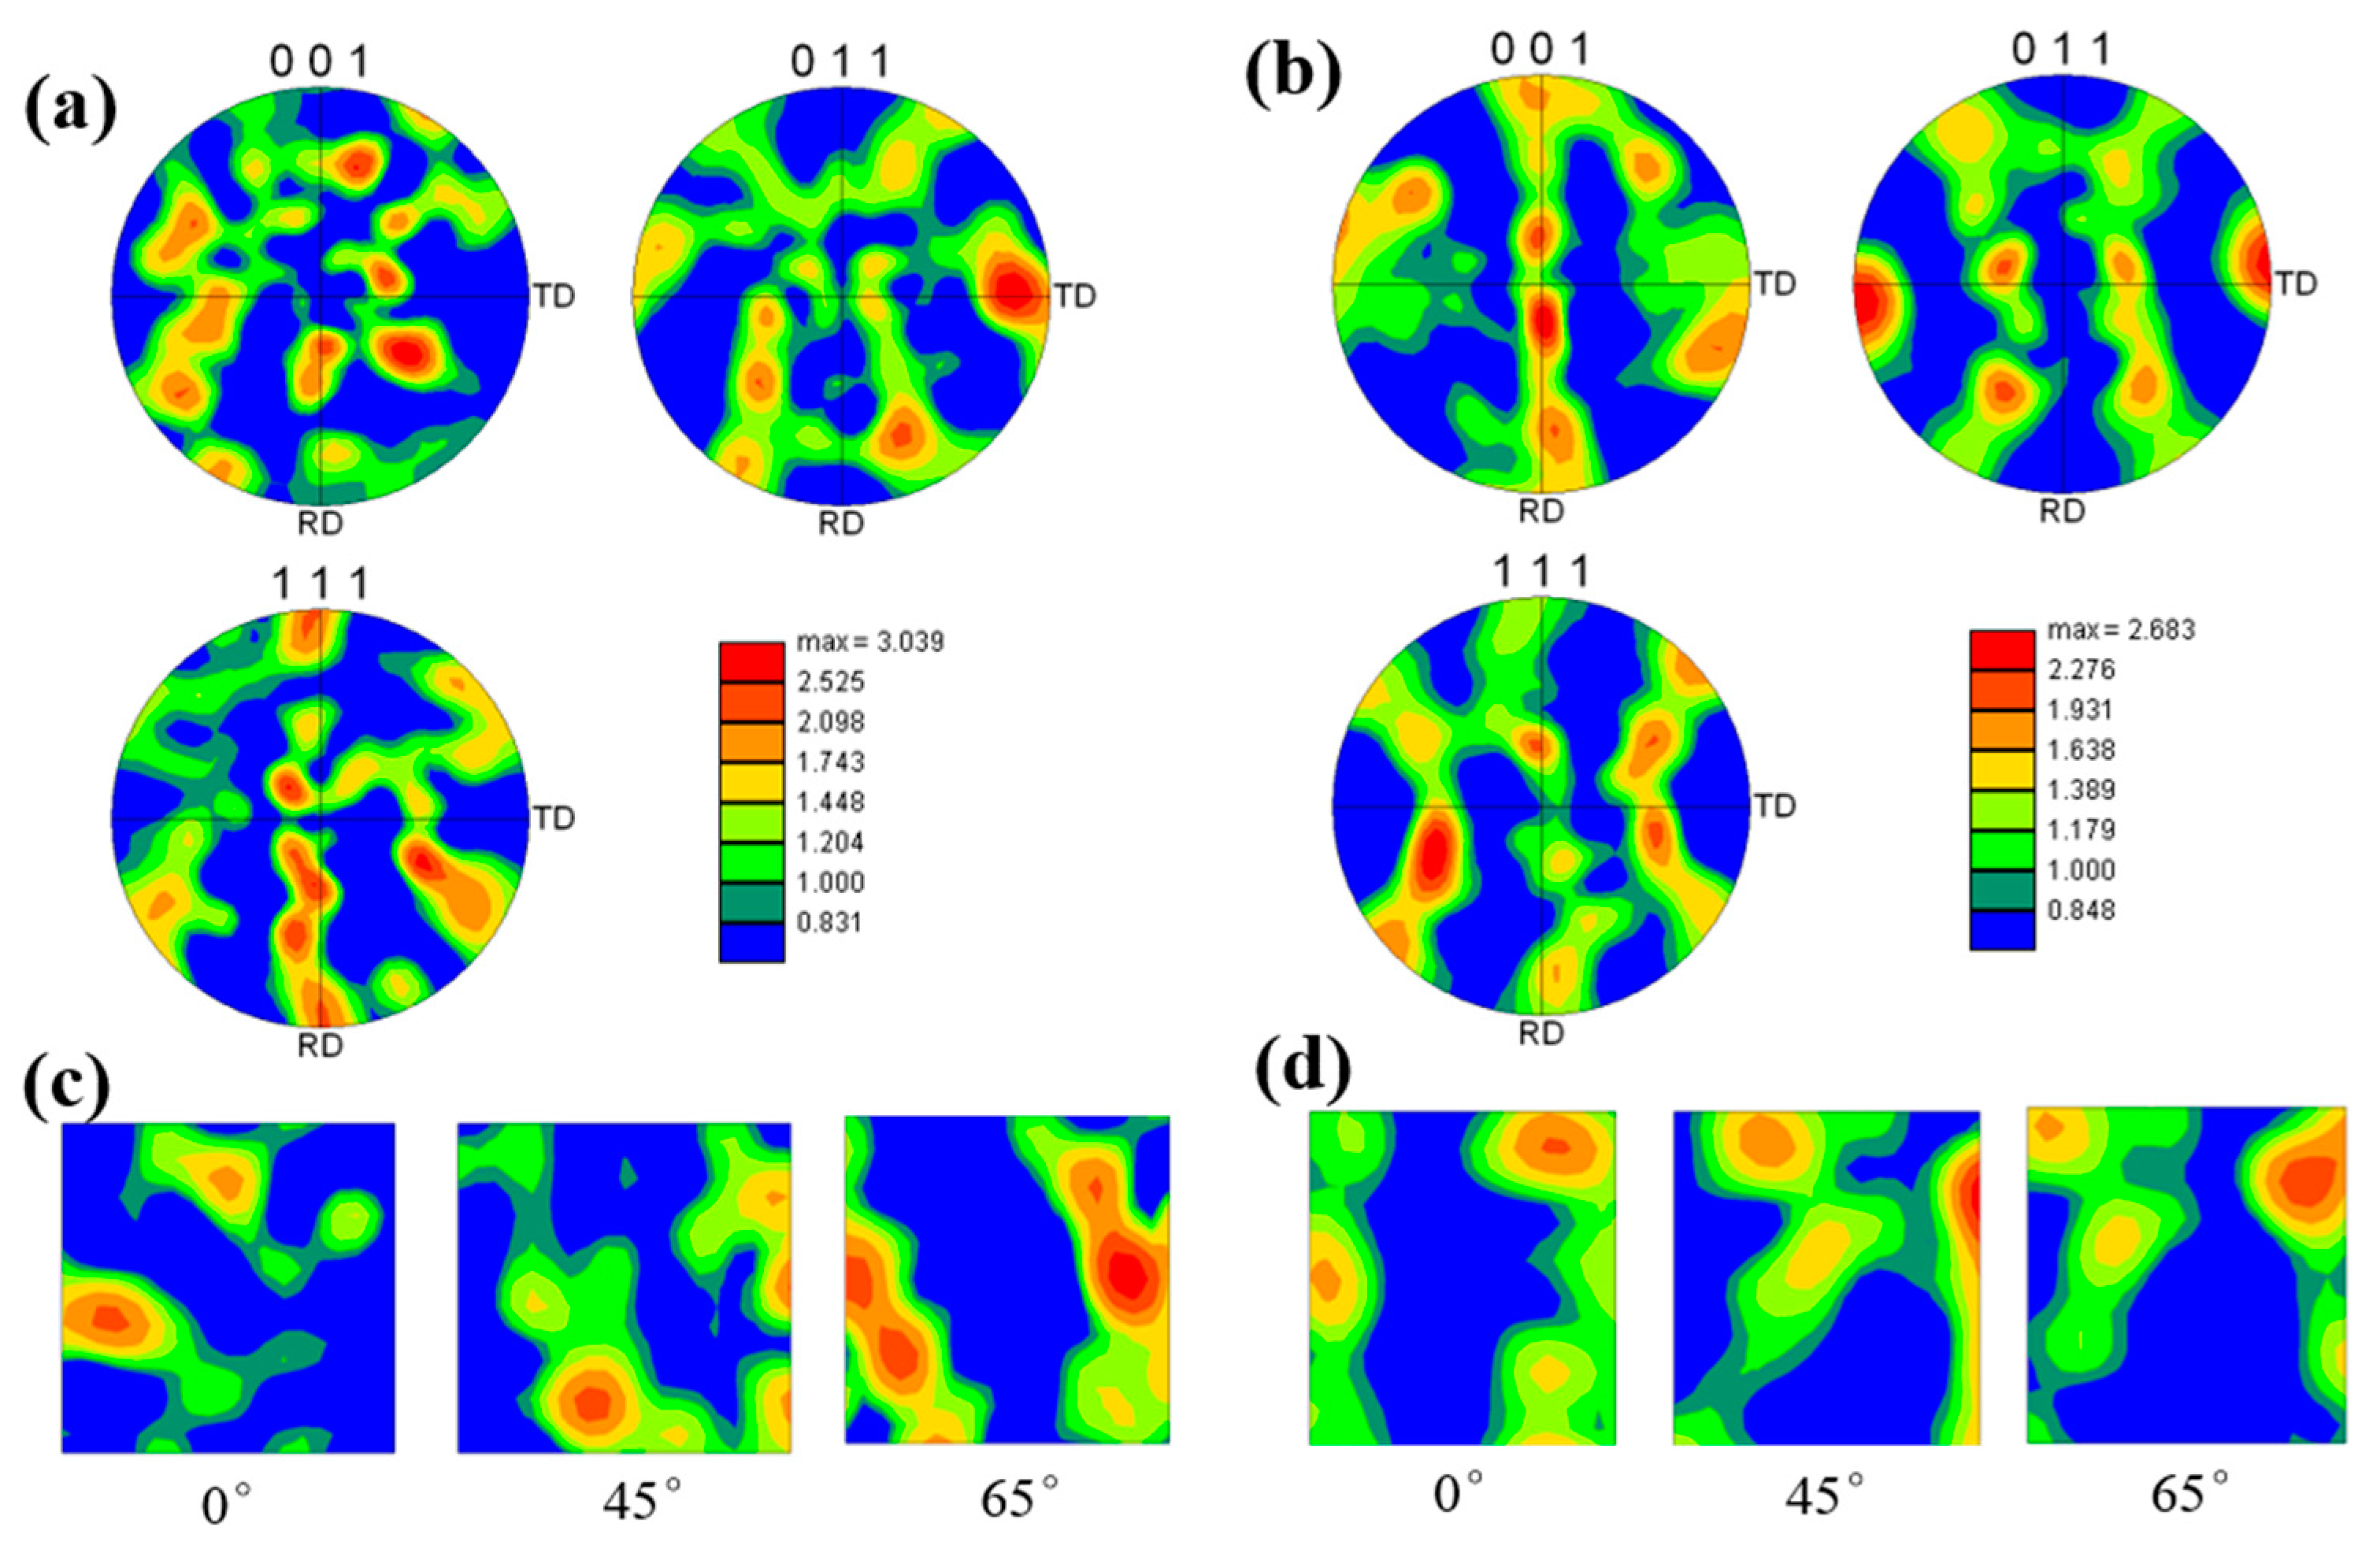
4.3. Texture Evolution

In this section, the texture evolution of the Cu-1.1–Ni-0.7–Co-0.45–Si-0.3Cr alloy is discussed. Figure 11 shows the pole figure and orientation distribution function (ODF) map of the Cu-1.1–Ni-0.7–Co-0.45–Si-0.3Cr alloy at the deformation temperatures of 600 °C and 800 °C at 0.01 s−1. In Figure 11a,b, the results indicate that the maximum texture strength of the alloy at the hot temperature of 600 °C is 3.03, and the maximum texture strength of the alloy is 2.68 when the hot temperature is 800 °C. This is because the texture strength of the alloy at the high deformation temperature is greater than that at the low deformation temperature. In order to reveal the texture types of the Cu-1.1–Ni-0.7–Co-0.45–Si-0.3Cr alloy, an ODF map of the alloy at the deformation temperatures of 600 °C and 800 °C was studied, as shown in Figure 11c,d. Usually, the ideal texture types include the following: goss, cube, copper, brass, S, <100>//X, <110>//X, and <111>//X [33]. By comparison with the standard ODF map [34], we find that the results suggest that the ideal texture types of the alloy at the hot deformation temperature of 600 °C are copper, goss, and brass textures, while the ideal texture types of the alloy at the hot deformation temperature of 800 °C are copper and S textures.
Figure 12 shows the results of the statistical analysis of each texture type in the Cu-1.1–Ni-0.7–Co-0.45–Si-0.3Cr alloy for the deformation temperatures of 600 °C and 800 °C. Additionally, the results indicate that the orientation distribution in the recrystallization process of the alloy is random at 800 °C. However, there is a preferred orientation in the recrystallization process of the alloy when the hot deformation temperature is 600 °C. For example, when the hot deformation temperature is 600 °C, the volume fraction of the <100>//X texture is approximately 15%, and <111>//X texture is approximately 28%. The volume fractions of these two textures are different when the hot deformation temperature is 600 °C. However, when the hot deformation temperature is 800 °C, the volume fractions of the <100>//X, <110>//X, and <111>//X textures are nearly same, being approximately 22%. These texture distribution results also explain why the texture intensity of the Cu-1.1–Ni-0.7–Co-0.45–Si-0.3Cr alloy is decreased when the hot deformation temperature is increased.

5. Conclusions

In this study, a new Cu–Ni–Si alloy with added Co and Cr elements was successfully fabricated. Then, these alloys underwent a hot compression test using the Gleeble-1500D simulator under different deformation conditions. Additionally, the recrystallization behavior and precipitate phase were investigated during hot deformation. The following conclusions were obtained:
(1)
The flow stress of the Cu-1.1–Ni-0.7–Co-0.45–Si-0.3Cr alloy is decreased when the strain rate is decreased and the hot deformation temperature is increased.
(2)
(Ni, Co)2Si and (Cr, Co)2Si precipitates were formed in the Cu-1.1–Ni-0.7–Co-0.45–Si-0.3Cr alloy during the hot compression process. Additionally, these two kinds of precipitates can hinder the movement of the grain boundaries and dislocations, thus resulting in an improvement in the deformation resistance of the alloy.
(3)
The dynamic recrystallization mechanism of the Cu-1.1–Ni-0.7–Co-0.45–Si-0.3Cr alloy mainly includes the DDRX process and the CDRX process, and these two dynamic recrystallization processes show synergistic effects. The critical strains of dynamic recrystallization corresponding to 600 °C, 700 °C, and 800 °C are 0.24, 0.085, and 0.05, respectively.
(4)
The texture intensity of the Cu-1.1–Ni-0.7–Co-0.45–Si-0.3Cr alloy is decreased with the increasing recrystallization degree. The texture orientation distribution becomes more random with the progression of recrystallization. The ideal texture types of the alloy at 600 °C are copper, goss, and brass textures, while the ideal texture types of the alloy at 800 °C are copper and S textures.

Author Contributions

Conceptualization, M.Z. and Y.B.; methodology, M.Z. and Y.B.; formal analysis, M.Z., Y.L. (Yunzhang Li) and Y.B.; investigation, Y.L. (Yunzhang Li), B.G., X.L. and L.F.; resources, M.Z., B.T. and Y.L. (Yong Liu); writing—original draft preparation, M.Z. and Y.B.; writing—review and editing, Y.L. (Yunzhang Li), S.T., Y.Z. and A.A.V.; supervision, M.Z., Y.Z., B.T. and Y.L. (Yong Liu); project administration, M.Z. and B.G; funding acquisition, M.Z. and Y.Z. All authors have read and agreed to the published version of the manuscript.

Funding

This work was supported by the National Natural Science Foundation of China (52071134, 92060102, 52101083), Outstanding Talents Innovation Fund of Henan Province (ZYQR201912164), the Program for Innovative Research Teams at the University of the Henan Province (22IRTSTHN001), and China Postdoctoral Science Foundation (2020M682316, 2021T140779).

Institutional Review Board Statement

Not applicable.

Informed Consent Statement

Not applicable.

Data Availability Statement

All data that support the findings of this study are included within the article.

Conflicts of Interest

The authors declare no conflict of interest.

References

  1. Nordstrom, T.V.; Rohde, R.W.; Mottern, D.J. Explosive Strengthening of a Cu-Be Alloy. Metall. Trans. A 1975, 6, 1561–1568. [Google Scholar] [CrossRef]
  2. Kamegawa, A.; Iwaki, T.; Okada, M. Simultaneous Enhancement of Electrical Conductivities and Mechanical Properties in Cu-Ti Alloy by Hydrogenation Process. In Materials Science Forum; Trans Tech Publications: Bäch, Switzerland, 2010; Volume 654, pp. 1319–1322. [Google Scholar]
  3. Kimura, H.; Inoue, A.; Muramatsu, N.; Shin, K.; Yamamoto, T. Ultrahigh Strength and High Electrical Conductivity Characteristics of Cu-Zr Alloy Wires with Nanoscale Duplex Fibrous Structure. Mater. Trans. 2006, 47, 1595–1598. [Google Scholar] [CrossRef] [Green Version]
  4. Zhang, S.; Li, R.; Kang, H.; Chen, Z.; Wang, W.; Zou, C.; Li, T.; Wang, T. A High Strength and High Electrical Conductivity Cu-Cr-Zr Alloy Fabricated by Cryorolling and Intermediate Aging Treatment. Mater. Sci. Eng. A 2017, 680, 108–114. [Google Scholar] [CrossRef]
  5. Zhao, D.M.; Dong, Q.M.; Liu, P.; Kang, B.X.; Huang, J.L.; Jin, Z.H. Structure and Strength of the Age Hardened Cu–Ni–Si Alloy. Mater. Chem. Phys. 2003, 79, 81–86. [Google Scholar] [CrossRef]
  6. Ban, Y.; Geng, Y.; Hou, J.; Zhang, Y.; Zhou, M.; Jia, Y.; Tian, B.; Liu, Y.; Li, X.; Volinsky, A.A. Properties and Precipitates of the High Strength and Electrical Conductivity Cu-Ni-Co-Si-Cr Alloy. J. Mater. Sci. Technol. 2021, 93, 1–6. [Google Scholar] [CrossRef]
  7. Geng, Y.; Ban, Y.; Wang, B.; Li, X.; Song, K.; Zhang, Y.; Jia, Y.; Tian, B.; Liu, Y.; Volinsky, A.A. A Review of Microstructure and Texture Evolution with Nanoscale Precipitates for Copper Alloys. J. Mater. Res. Technol. 2020, 9, 11918–11934. [Google Scholar] [CrossRef]
  8. Lee, S.; Matsunaga, H.; Sauvage, X.; Horita, Z. Strengthening of Cu–Ni–Si Alloy Using High-Pressure Torsion and Aging. Mater. Charact. 2014, 90, 62–70. [Google Scholar] [CrossRef]
  9. Krupiński, M.; Labisz, K.; Tański, T.; Krupińska, B.; Król, M.; Polok-Rubiniec, M. Influence of Mg Addition on Crystallisation Kinetics and Structure of the Zn-Al-Cu Alloy. Arch. Metall. Mater. 2016, 61, 785–790. [Google Scholar] [CrossRef] [Green Version]
  10. Pandey, P.; Prasad, A.S.; Baler, N.; Chattopadhyay, K. On the Effect of Ti Addition on Microstructural Evolution, Precipitate Coarsening Kinetics and Mechanical Properties in a Co–30Ni–10Al–5Mo–2Nb Alloy. Materialia 2021, 16, 101072. [Google Scholar] [CrossRef]
  11. Guo, Z.; Jie, J.; Liu, S.; Zhang, Y.; Qin, B.; Wang, T.; Li, T. Effect of V Addition on Microstructures and Mechanical Properties of Cu-15Ni-8Sn Alloy. Mater. Sci. Eng. A 2019, 748, 85–94. [Google Scholar] [CrossRef]
  12. Ning, F.; Chunming, Z.; Zunjie, W.; Hongwei, W.; Xuejian, Z.; Tao, C. Effect of Ge and Mg Additions on the Aging Response Behavior and Mechanical Properties of Al-Si-Cu Alloy. Mater. Sci. Eng. A 2021, 811, 141024. [Google Scholar] [CrossRef]
  13. Geng, Y.; Ban, Y.; Li, X.; Zhang, Y.; Jia, Y.; Tian, B.; Zhou, M.; Liu, Y.; Volinsky, A.A.; Song, K. Excellent Mechanical Properties and High Electrical Conductivity of Cu-Co-Si-Ti Alloy Due to Multiple Strengthening. Mater. Sci. Eng. A 2021, 821, 141639. [Google Scholar] [CrossRef]
  14. Wu, Y.; Li, Y.; Lu, J.; Tan, S.; Jiang, F.; Sun, J. Correlations between Microstructures and Properties of Cu-Ni-Si-Cr Alloy. Mater. Sci. Eng. A 2018, 731, 403–412. [Google Scholar] [CrossRef]
  15. Ozawa, A.; Watanabe, C.; Monzen, R. Influence of Co on Strength of Cu-Ni-Co-Si Alloy. In Materials Science Forum; Trans Tech Publications: Bäch, Switzerland, 2014; Volume 783, pp. 2468–2473. [Google Scholar]
  16. Chenna Krishna, S.; Srinath, J.; Jha, A.K.; Pant, B.; Sharma, S.C.; George, K.M. Microstructure and Properties of a High-Strength Cu-Ni-Si-Co-Zr Alloy. J. Mater. Eng. Perform. 2013, 22, 2115–2120. [Google Scholar] [CrossRef]
  17. Wei, H.; Chen, Y.; Zhao, Y.; Yu, W.; Su, L.; Tang, D. Correlation Mechanism of Grain Orientation/Microstructure and Mechanical Properties of Cu–Ni–Si–Co Alloy. Mater. Sci. Eng. A 2021, 814, 141239. [Google Scholar] [CrossRef]
  18. Cheng, J.Y.; Tang, B.B.; Yu, F.X.; Shen, B. Evaluation of Nanoscaled Precipitates in a Cu–Ni–Si–Cr Alloy during Aging. J. Alloys Compd. 2014, 614, 189–195. [Google Scholar] [CrossRef]
  19. Ban, Y.; Zhang, Y.; Jia, Y.; Tian, B.; Volinsky, A.A.; Zhang, X.; Zhang, Q.; Geng, Y.; Liu, Y.; Li, X. Effects of Cr Addition on the Constitutive Equation and Precipitated Phases of Copper Alloy during Hot Deformation. Mater. Des. 2020, 191, 108613. [Google Scholar] [CrossRef]
  20. Liu, J.; Wang, X.; Liu, J.; Liu, Y.; Li, H.; Wang, C. Hot Deformation and Dynamic Recrystallization Behavior of Cu-3Ti-3Ni-0.5 Si Alloy. J. Alloys Compd. 2019, 782, 224–234. [Google Scholar] [CrossRef]
  21. Ji, G.; Li, Q.; Ding, K.; Yang, L.; Li, L. A Physically-Based Constitutive Model for High Temperature Deformation of Cu-0.36 Cr-0.03 Zr Alloy. J. Alloys Compd. 2015, 648, 397–407. [Google Scholar] [CrossRef]
  22. Wei, H.; Chen, Y.; Li, Z.; Shan, Q.; Yu, W.; Tang, D. Microstructure Evolution and Dislocation Strengthening Mechanism of Cu–Ni–Co–Si Alloy. Mater. Sci. Eng. A 2021, 826, 142023. [Google Scholar] [CrossRef]
  23. Yang, P.; Zhou, M.; Zhang, Y.; Jia, Y.; Tian, B.; Liu, Y.; Li, X.; Volinsky, A.A. Effect of Y Addition on Microstructure Evolution and Precipitation of Cu-Co-Si Alloy during Hot Deformation. Mater. Charact. 2021, 181, 111502. [Google Scholar] [CrossRef]
  24. Saadatkia, S.; Mirzadeh, H.; Cabrera, J.-M. Hot Deformation Behavior, Dynamic Recrystallization, and Physically-Based Constitutive Modeling of Plain Carbon Steels. Mater. Sci. Eng. A 2015, 636, 196–202. [Google Scholar] [CrossRef] [Green Version]
  25. Poliak, E.I.; Jonas, J.J. A One-Parameter Approach to Determining the Critical Conditions for the Initiation of Dynamic Recrystallization. Acta Mater. 1996, 44, 127–136. [Google Scholar] [CrossRef]
  26. Mehtonen, S.V.; Palmiere, E.J.; Misra, R.D.K.; Karjalainen, L.P.; Porter, D.A. Dynamic Restoration Mechanisms in a Ti–Nb Stabilized Ferritic Stainless Steel during Hot Deformation. Mater. Sci. Eng. A 2014, 601, 7–19. [Google Scholar] [CrossRef]
  27. Lin, Y.C.; Wu, X.-Y.; Chen, X.-M.; Chen, J.; Wen, D.-X.; Zhang, J.-L.; Li, L.-T. EBSD Study of a Hot Deformed Nickel-Based Superalloy. J. Alloys Compd. 2015, 640, 101–113. [Google Scholar] [CrossRef]
  28. Zhang, H.; Zhang, K.; Zhou, H.; Lu, Z.; Zhao, C.; Yang, X. Effect of Strain Rate on Microstructure Evolution of a Nickel-Based Superalloy during Hot Deformation. Mater. Des. 2015, 80, 51–62. [Google Scholar] [CrossRef]
  29. Kumar, S.S.; Raghu, T.; Bhattacharjee, P.P.; Rao, G.A.; Borah, U. Strain Rate Dependent Microstructural Evolution during Hot Deformation of a Hot Isostatically Processed Nickel Base Superalloy. J. Alloys Compd. 2016, 681, 28–42. [Google Scholar] [CrossRef]
  30. Ban, Y.; Zhang, Y.; Tian, B.; Song, K.; Zhou, M.; Zhang, X.; Jia, Y.; Li, X.; Geng, Y.; Liu, Y.; et al. EBSD Analysis of Hot Deformation Behavior of Cu-Ni-Co-Si-Cr Alloy. Mater. Charact. 2020, 169, 110656. [Google Scholar] [CrossRef]
  31. Eghbali, B. Effect of Strain Rate on the Microstructural Development through Continuous Dynamic Recrystallization in a Microalloyed Steel. Mater. Sci. Eng. A 2010, 527, 3402–3406. [Google Scholar] [CrossRef]
  32. Sun, Y.; Zhang, C.; Feng, H.; Zhang, S.; Han, J.; Zhang, W.; Zhao, E.; Wang, H. Dynamic Recrystallization Mechanism and Improved Mechanical Properties of a near α High Temperature Titanium Alloy Processed by Severe Plastic Deformation. Mater. Charact. 2020, 163, 110281. [Google Scholar] [CrossRef]
  33. Haase, C.; Barrales-Mora, L.A. Influence of Deformation and Annealing Twinning on the Microstructure and Texture Evolution of Face-Centered Cubic High-Entropy Alloys. Acta Mater. 2018, 150, 88–103. [Google Scholar] [CrossRef] [Green Version]
  34. Higuera-Cobos, O.F.; Berríos-Ortiz, J.A.; Cabrera, J.M. Texture and Fatigue Behavior of Ultrafine Grained Copper Produced by ECAP. Mater. Sci. Eng. A 2014, 609, 273–282. [Google Scholar] [CrossRef]
Figure 1. Flow stress–strain curves of the new type of Cu-1.1–Ni-0.7–Co-0.45–Si-0.3Cr alloy at different compression temperatures with different strain rates: (a) 0.001 s−1, (b) 0.01 s−1, (c) 0. 1 s−1, (d) 1 s−1.
Coatings 13 00660 g001
Figure 2. Peak stress of the new type of Cu-1.1–Ni-0.7–Co-0.45–Si-0.3Cr alloy at different compression temperatures and strain rates.
Coatings 13 00660 g002
Figure 3. TEM and HRTEM images of the new type of Cu-1.1–Ni-0.7–Co-0.45–Si-0.3Cr alloy deformed at 600 °C and 0.01 s−1. (a) Bright-field TEM image, (b) dark-field TEM image of (a), (c) bright-field TEM image, (d) bright-field TEM image of precipitates, (e) dark-field TEM image of precipitates, (f) HRTEM image and corresponding FFT pattern of a (Ni, Co)2Si particle.
Coatings 13 00660 g003
Figure 4. Bright-field TEM image and EDS map. (a) Bright field image of large particles. (bf) EDS mapping of different elements in the large particles.
Coatings 13 00660 g004
Figure 5. TEM and HRTEM images of the new type of Cu-1.1–Ni-0.7–Co-0.45–Si-0.3Cr alloy deformed at 800 °C and 0.01 s−1. (a,b) Bright-field TEM image, (c) SAED analysis of precipitates in B, (d) bright-field TEM image, (e) dark-field TEM image of (d), (f) HRTEM image and corresponding FFT pattern of a (Ni, Co)2Si particle.
Coatings 13 00660 g005
Figure 6. EDS map of precipitates: (af) EDS mapping of different elements in the particles.
Coatings 13 00660 g006
Figure 7. EBSD-IPF and corresponding KAM maps of the new type of Cu-1.1–Ni-0.7–Co-0.45–Si-0.3Cr alloy in different deformation states: (a,c) 600 °C and 0.01 s−1, (b,d) 800 °C and 0.01 s−1.
Coatings 13 00660 g007
Figure 8. Orientation maps and misorientation angle distributions of the new type of Cu-1.1–Ni-0.7–Co-0.45–Si-0.3Cr alloy in different deformation states: (a,c) 600 °C and 0.01 s−1, (b,d) 800 °C and 0.01 s−1.
Coatings 13 00660 g008
Figure 9. Strain hardening rate ( ln θ ) / ε - ε curve of the new type of Cu-1.1–Ni-0.7–Co-0.45–Si-0.3Cr alloy at different deformation temperatures.
Coatings 13 00660 g009
Figure 10. CDRX and DDRX mechanisms of the new type of Cu-1.1–Ni-0.7–Co-0.45–Si-0.3Cr alloy: (a) EBSD map, (b) Misorientation distribution along the line A–B in (a), (c) Grain boundary bulging.
Coatings 13 00660 g010
Figure 11. Pole figure and ODF maps of the new type of Cu-1.1–Ni-0.7–Co-0.45–Si-0.3Cr alloy in different deformation states: (a,c) 600 °C and 0.01 s−1, (b,d) 800 °C and 0.01 s−1.
Coatings 13 00660 g011
Figure 12. Texture composition of the new type of Cu-1.1–Ni-0.7–Co-0.45–Si-0.3Cr alloy at deformation temperatures of 600 °C and 800 °C.
Coatings 13 00660 g012
Table 1. The nominal and analyzed compositions of the Cu-1.1–Ni-0.7–Co-0.45–Si-0.3Cr alloy.
AlloyAnalyzed Composition (wt.%)
NiCoSiCrCu
Cu-1.1–Ni-0.7–Co-0.45–Si-0.3Cr1.050.670.430.28Bal.
Table 2. The phase composition of the new type of Cu-1.1–Ni-0.7–Co-0.45–Si-0.3Cr alloy subjected to compression at 600 °C and 0.01 s−1.
NiCrCoSi(Cr+Co):Si
3.6518.3438.6325.69~2:1
Disclaimer/Publisher’s Note: The statements, opinions and data contained in all publications are solely those of the individual author(s) and contributor(s) and not of MDPI and/or the editor(s). MDPI and/or the editor(s) disclaim responsibility for any injury to people or property resulting from any ideas, methods, instructions or products referred to in the content.

