Abstract
Extra-functionalized oxidized graphenes are widely preferred for the removal of different pollutants, however, removal with pristine oxidized graphenes, i.e., graphene oxide (GO) and reduced graphene oxide (rGO) is vaguely explored. Herein, we report a comparative adsorption kinetics study of the removal of mercury(II) (Hg(II)) from water using eco-friendly prepared GO and rGO. This work consists of the synthesis protocol and the corresponding morphological and spectroscopical characterization of the obtained pristine adsorbents as well as the adsorption mechanism in terms of initial concentration, removal percentage, pseudo-first and pseudo-second-order models, intraparticle diffusion study, and pH analysis. In particular, scanning electron microscope (SEM) and transmission electron microscope (TEM) images evidence the presence of thin sheets with some defects on the GO structure, these defects substantially disappear in rGO, after reduction. Raman spectrum of rGO shows a less intense D* peak which is attributed to the diamond-like carbon phase. Most importantly, the equilibrium adsorption time in GO is 10 min with a removal percentage of ~28% while in rGO it is 20 min with a removal percentage of ~75%. The adsorption process of Hg(II) either in GO or rGO is more in line with the pseudo-second-order model, suggesting that the adsorption kinetics could be controlled by chemisorption. Our results evidence the interesting adsorbing properties of pristine oxidized graphenes and are expected to be useful for the proposal and study of non-extra functionalized graphene-based materials for water treatment.
1. Introduction
Carbon-based materials are widely proven to be the best choice for water purification technologies. Particularly, unmodified activated carbon is the most ideal due to its big internal surface and versatility in removing different pollutants such as organic compounds and heavy metals [1]. Chemically modified activated carbon seems to be one of the most efficient ways to improve its adsorption efficiencies. For example, the incorporation of sulfur (such as elemental sulfur, aqueous-phase sodium sulfide, or hydrogen sulfide) could improve the adsorption capacities [2]. However, sulfurization of activated carbon will reduce the number of micropores, which would restrict its adsorption capacity for long contact times. In this context, other alternatives were proposed such as activated carbon fibers [3], mesoporous carbons [4], carbon nanotubes [5], and oxidized graphenes [6] or depending on the pollutant properties, even magnetic materials (e.g., iron oxides and cobalt ferrite, see [7] and references inside). However, the construction of magnetic adsorbents lacks an easy operation in aqueous separation processes.
The removal methods of organic compounds and heavy metals include, for instance, membrane filtration [8], ion exchange [9], adsorption [10], electrocoagulation [11], and electrodeposition [12]. Among these methods and approaches, adsorption is the most prominent technique due to its simplicity, non-secondary treatment step, and cost-effective application [13]. In particular, oxidized graphenes, i.e., graphene oxide (GO) and reduced graphene oxide (rGO), appear as the best platforms in adsorption processes as well as water treatment [6].
Although the properties of oxidized graphenes are quite different from those of graphene or related ones (i.e., honeycomb-like structure and brilliant physical and chemical properties) [14,15,16,17,18], extra-functionalized versions of these oxidized graphenes have offered high adsorption capacity and binding affinity for metallic (pollutant) ions [19] because of their group functionalization (e.g., incorporating sulfur), oxidation degree, and higher specific surface area [20]. However, the removal of pollutants onto non-extra-functionalized (pristine) GO or rGO remains scarce or unclear.
Although there are several top-down approaches for preparing graphene and its derivatives (such as liquid exfoliation [21,22,23] or zeolite-shear exfoliation [24]), GO is typically synthesized by the oxidation of graphite following the Hummers or modified Hummers method [25], which is made by the oxidation of (flakes or powder) graphite with H2SO4, KMnO4, and NaNO3. While this approach has the advantage of large-scale production, it contains the liberation of residual ions ( and ) and toxic gases, during the synthesis process. To circumvent this environmental issue, we reported an eco-friendly protocol to prepare GO by excluding NaNO3 from the chemical reaction [26,27,28] and by using simple purification steps. As well, for the reduction of GO, citric acid (CA) was demonstrated to be an excellent green-reducing agent for preparing rGO compared to conventional chemical agents such as hydrazine [26]. To the best of our knowledge, a comparative work of the adsorption mechanics of mercury(II) (Hg(II)) on as-made oxidized graphenes has not yet been reported.
The focus on Hg(II) is because it is very dangerous for public health and the environment [29]. Particularly, Hg(II) can cause significant risk to the neurological development of fetuses, newborns, and children [30,31]. The discharge of Hg(II) into water occurs from industrial processes such as oil refineries [32], automobile manufacturing [33], and fossil fuel combustion [34]. With this in mind, it is important to develop new adsorbents and methods for the removal of Hg(II) from aqueous solutions.
In this communication, we report for the first time the removal of Hg(II) from water by using eco-friendly-prepared oxidized graphenes (i.e., GO and rGO) which exhibit interesting adsorption properties compared to conventional ones (such as activated carbon [35]). This work includes the preparation protocol of adsorbents and their characterization. Most importantly, the adsorption kinetics are scrutinized in terms of initial concentration, removal percentage, pseudo-first and pseudo-second-order models, intraparticle diffusion study, and pH analysis. Furthermore, the types of interactions between Hg(II) and GO and between Hg(II) and rGO are discussed.
2. Materials and Methods
2.1. Materials
All chemicals were used as received, without further purification. Graphite powder (<150 μm, 99.99%, Sigma-Aldrich, Burlington, MA, USA), Sulfuric acid (H2SO4, 95.0%–98.0%, Sigma-Aldrich, Burlington, MA, USA), Potassium permanganate (KMnO4, ≥99.0%, Sigma-Aldrich, Burlington, MA, USA), Hydrochloric acid (HCl, 37%, Sigma-Aldrich, Burlington, MA, USA), Citric acid (C6H8O7, ≥99.5%, Sigma-Aldrich, Burlington, MA, USA), Hydrogen peroxide (H2O2, 30%, Merk, Darmstadt, Germany), Sodium hydroxide (NaOH, 1310-73-2, 40.00 g/mol, Merk, Darmstadt, Germany), Mercury(II) oxide (HgO, 21908-53-2, 219.59 g/mol, Merk, Darmstadt, Germany).
2.2. Preparation of Graphene Oxide (GO)
A borosilicate glass flask was loaded with graphite (3.0 g), H2SO4 (70.0 mL), and KMnO4 (9.0 g) under stirring in an ice-water bath. The resulting mixture was agitated by adding 150.0 mL distilled water at ~90 °C. Additionally, 500.0 mL distilled water was added, followed by 15.0 mL H2O2. The resultant solution was collected and washed by centrifugation (at 10,000 rpm and 10 min) with HCl solution and distilled water several times up to set the pH ~6, and then dried under vacuum at 80 °C for 2 h to obtain graphite oxide powder.
As an example, 50 mg of graphite oxide was dispersed in 500 mL distilled water by ultrasonication for 15 min. The resultant dispersion was centrifuged to separate the GO flakes from unexfoliated graphite oxide. The complete detail of the procedure is given in [26] and the drying effect on the prepared GO samples in [28]. Elemental analysis of GO: C: 49.7%; O: 50.3%.
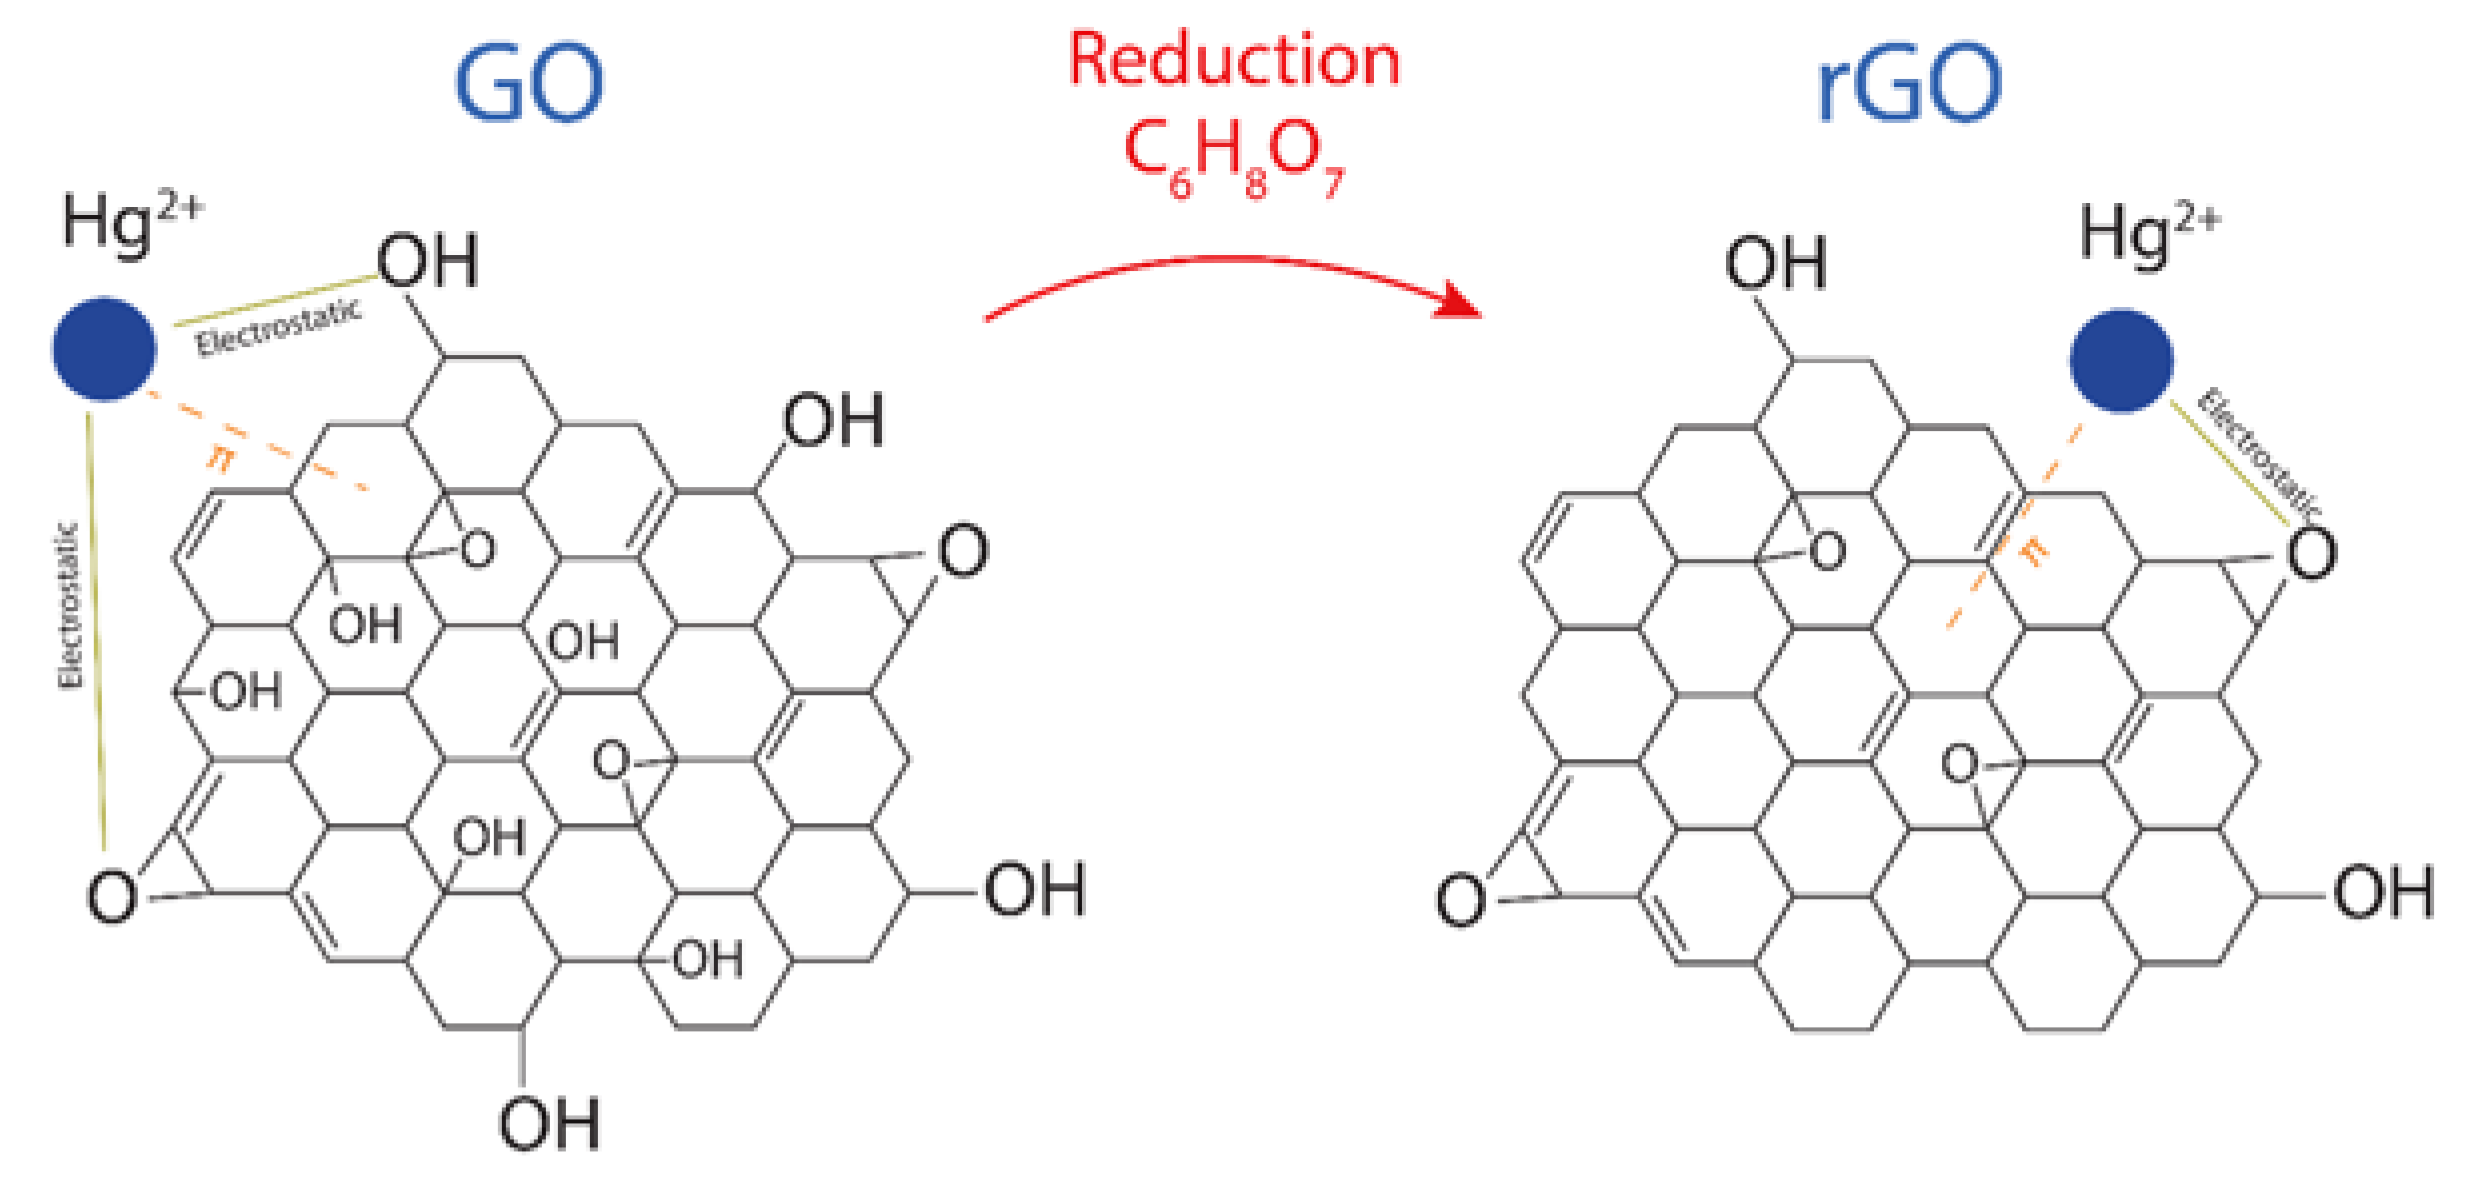
2.3. Preparation of Reduced Graphene Oxide (rGO)
Continuing with the previous subsection, the obtained dispersion was divided into two equal parts: one to obtain a homogenous GO dispersion (which is dried at 80 °C overnight to obtain GO powder), and the other was further treated for making rGO. Then, under vigorous agitation, 250 mg CA was slowly added to the dispersion, setting the reduction temperature at 95 °C for 0.5 h. To eliminate extra CA, the resultant precipitates were washed (three times) with distilled water by centrifugation. Lastly, the precipitated material was dried at 80 °C overnight to acquire rGO. The complete detail of the procedure is given in [26]. Elemental analysis of rGO: C: 62.9%; O: 37.1%.
2.4. Characterization of Oxidized Graphenes
The morphology study is carried out by:
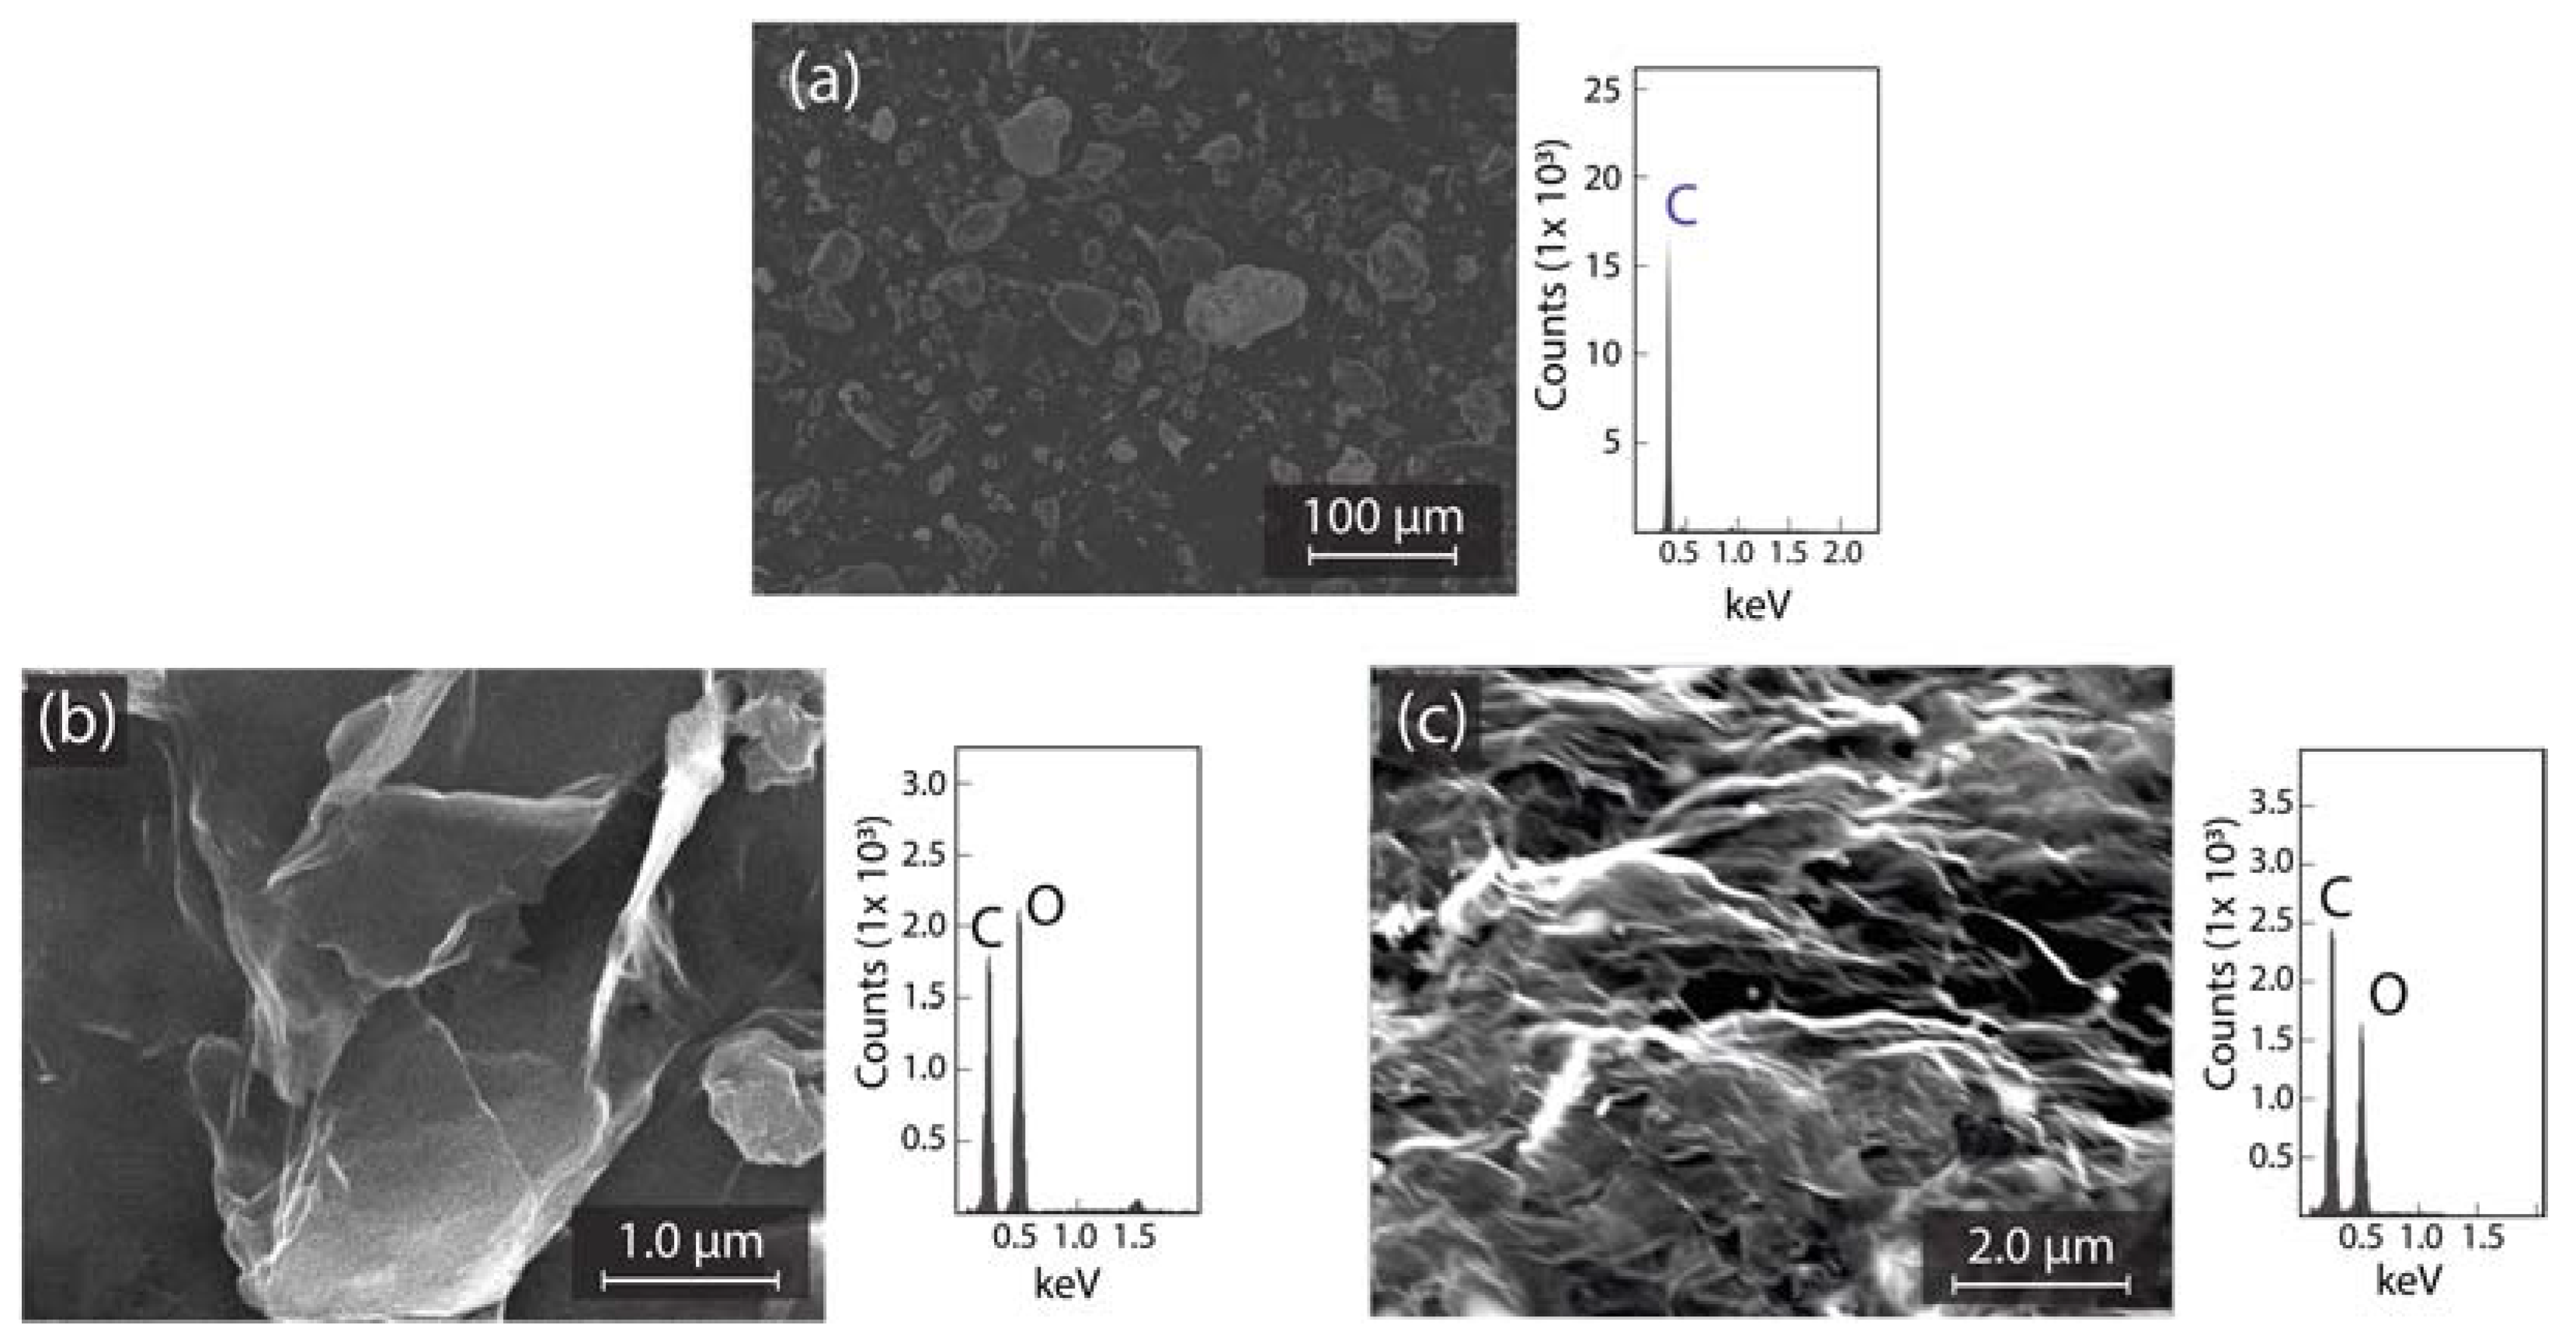
- Scanning electron microscope (SEM, JSM-IT100 InTouchScope, JEOL, Tokyo, Japan) equipped with a JEOL dispersive X-ray spectrometer (EDS);
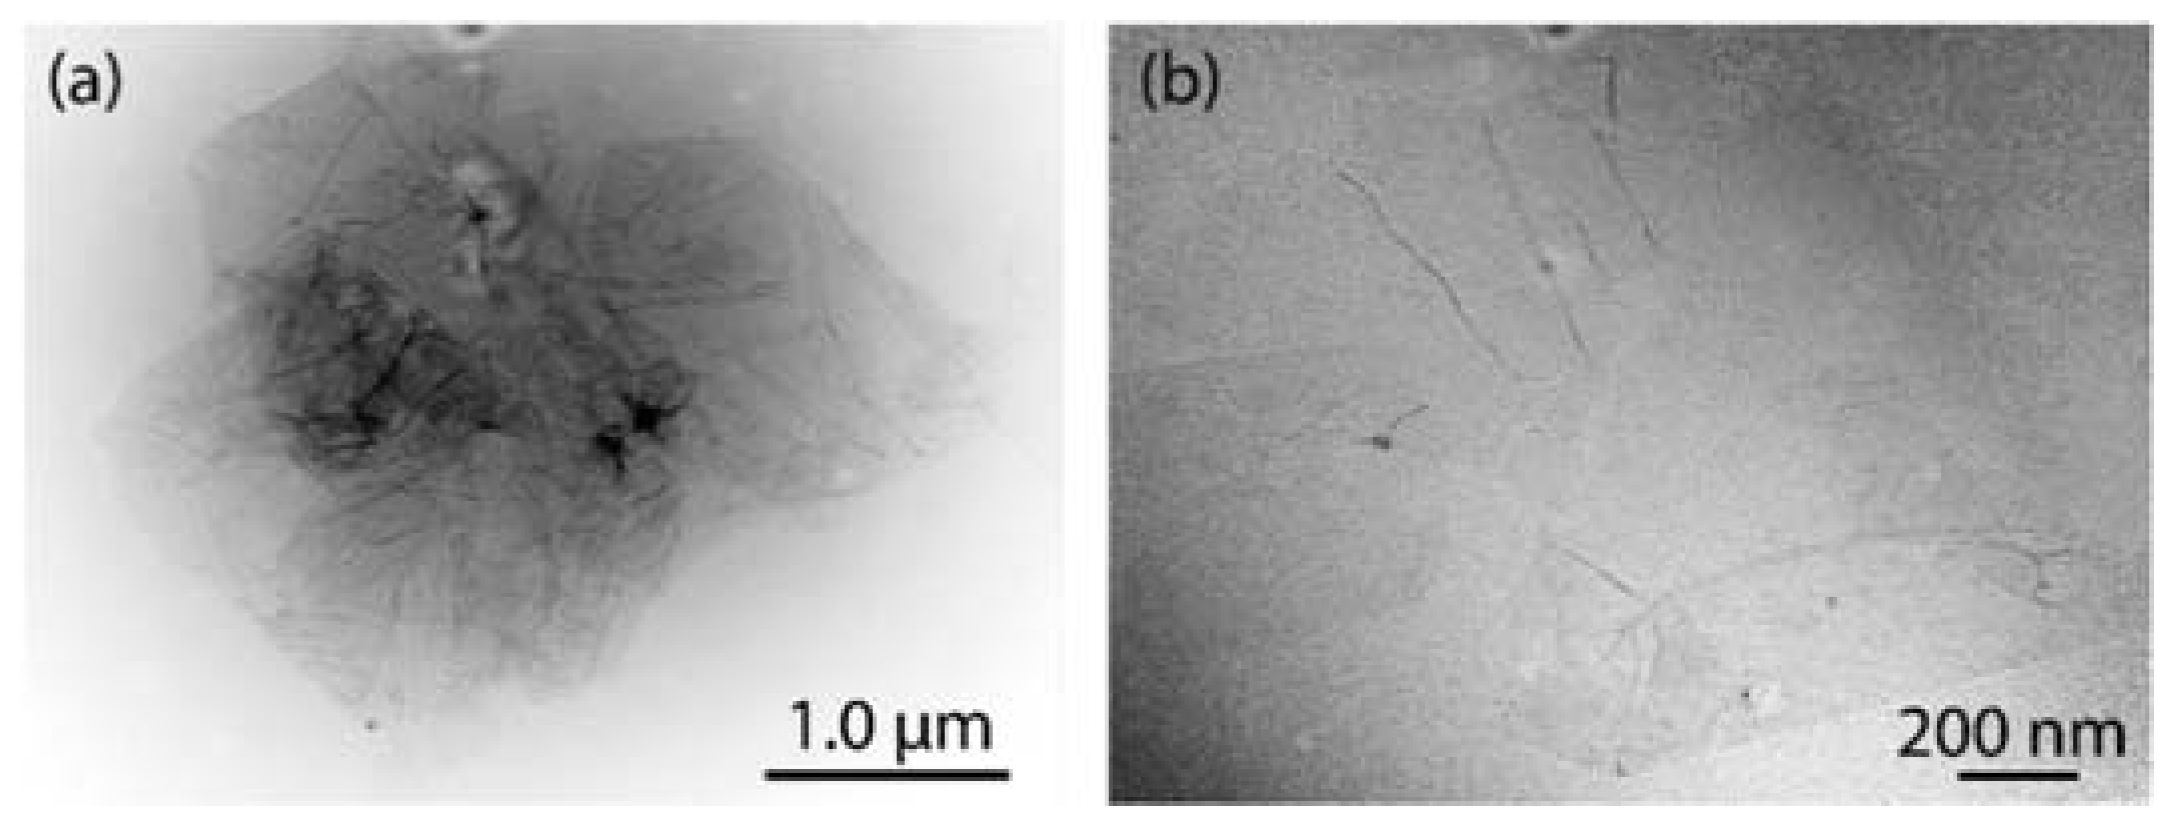
- Transmission electron microscope (TEM, JEM 1400 Plus, JEOL, Tokyo, Japan).
- The spectroscopical study is carried out by:
- Raman spectrometer (Jasco NRS-500 spectrometer, a 532 nm laser wavelength, and 100X objective, Jasco, Oklahoma City, OK, USA);
- Infrared spectrometer (Fourier transform infrared spectrometer, Jasco FT/IR 4000, Oklahoma City, OK, USA);
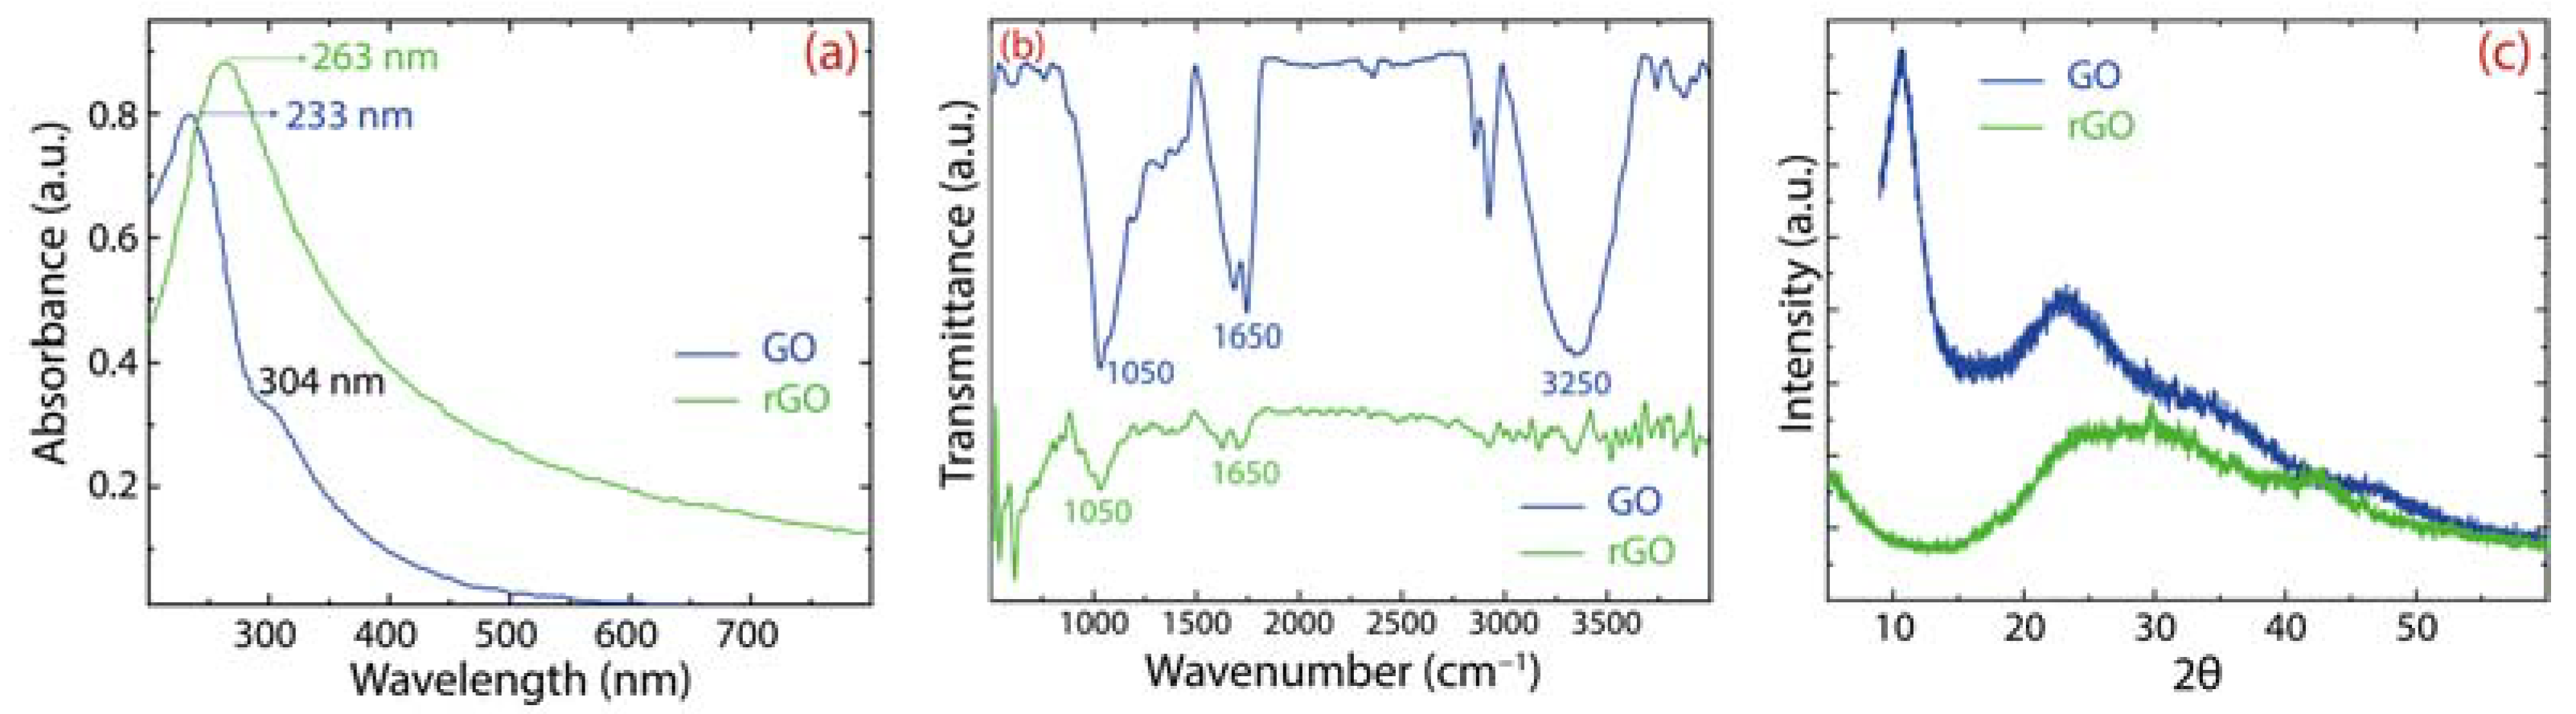
- UV–vis spectroscopy (Thermo Scientific, Evolution 220, Waltham, MA, USA);
- X-ray diffractometer (PANalytical Pro X-ray, Malvern, UK) in the diffraction angle (2θ) window of 5°–70°.
2.5. Experimental Set-Up
A 300 mL aqueous solution of HgO (150 mg·L−1) was added to a falcon tube. Then 200.0 mg GO sample was added to form a slurry. The mixture was stirred at room temperature for 1.0 h. During the stirring phase, the mixture was filtered at intervals through a 0.45 mm membrane filter for all samples, then the filtrates were analyzed by using AAS-cold vapor to determine the remaining Hg(II) content. HCl and NaOH 0.1 N were used to adjust the pH of the solutions (6.4). For the pH experiment, the pH of HgO solutions was adjusted with HCl and NaOH, and instantly, GO was added.
The same procedure and experimental conditions were carried out for the Hg(II)-rGO system.
3. Results and Discussions
3.1. Characterization of GO and rGO
We start by discussing the morphological transformation of graphite to GO and GO to rGO (discussed in Section 2.2). Figure 1 shows SEM images and EDS analyses of graphite (Figure 1a), GO (Figure 1b), and rGO (Figure 1c). The surface morphology of graphite displays a micro-powder (bulk) structure with a homogeneous lateral size <50 μm. The related elemental analysis evidence high carbon purity (Figure 1a, right panel). GO is characterized by a face-to-face (vertical or horizontal) stacking of flakes with wrinkles and folds on the surface. The elemental analysis of GO is C: 49.7%; O: 50.3% (Figure 1b, right panel). rGO shows a highly distorted structure with mesopores and micropores formation, avoiding the re-stacking of flakes after reduction. The elemental analysis of rGO is C: 62.9%; O: 37.1% (Figure 1c, right panel).
Figure 1.
SEM and EDS of (a) graphite source; (b) GO; and (c) rGO.
Figure 2 shows representative TEM images of GO (Figure 2a) and rGO (Figure 2b). Thin sheets with some folds and wrinkles on the surface and edges are observed for the obtained GO. Compared to strong oxidation processes (e.g., [25]), the eco-friendly prepared GO is not mostly crumpled at the surface or edges, suggesting non-critical damage to its structure. The dark areas can be attributed to a high density of sp3 hybridized regions. After reduction, rGO nanosheets with a regular in-plane surface and unfolded edges are observed. The undetected dark regions allow assuming that sp2 hybridization (of intrinsic graphene) has substantially recovered. The semitransparent feature observed in both GO and rGO proposes that these sheets seem to be free of impurities, an important result for different applications from thin-film smart coatings to high-frequency electronics.
Figure 2.
TEM measurements of (a) GO and (b) rGO.
The Raman spectrum of GO and rGO are shown in Figure 3. Three significant peaks are noted in GO, the D peak at 1347 cm−1, the G peak at 1577 cm−1, and the 2D peak in the region from 2500 to 2800 cm−1 (Figure 3a,b). The D peak is attributed to structural deficiencies, corresponding to a large number of disorderly carbon atoms. The G peak appears as an effect of sp2 hybridized carbon atoms. The 2D peak is composed of two bands, i.e., the intense 2D1A band at 2679 cm−1 and a less intense 2D2A band at 2755 cm−1. The 2D peak arises due to the splitting of the electrons in the stacked graphene layers [28].
Figure 3.
Raman spectra of (a,b) GO, and (c,d) rGO. The Raman spectrum was fitted using Lorentzian functions. For a better appreciation, (b,d) are zoomed 7 and 4 times, respectively.
Other less intense bands are detected, the D** band at 1511 cm−1, the D′ band at 1608 cm−1, and the D+G band at 2937 cm−1. The D** and D+G bands are a consequence of hydrogenated carbon vibrations [36]. The D′ band appears due to defects such as folded edges, vacancies, and the change of sp2 sp3 hybridization [37]. Particularly, a decrease in the intensity of the D′ band can be taken as straight evidence of the reduction of GO [6].
Similar peaks and bands appear in rGO, however, three important characteristics are observed (after the reduction process), which are discussed as follows:
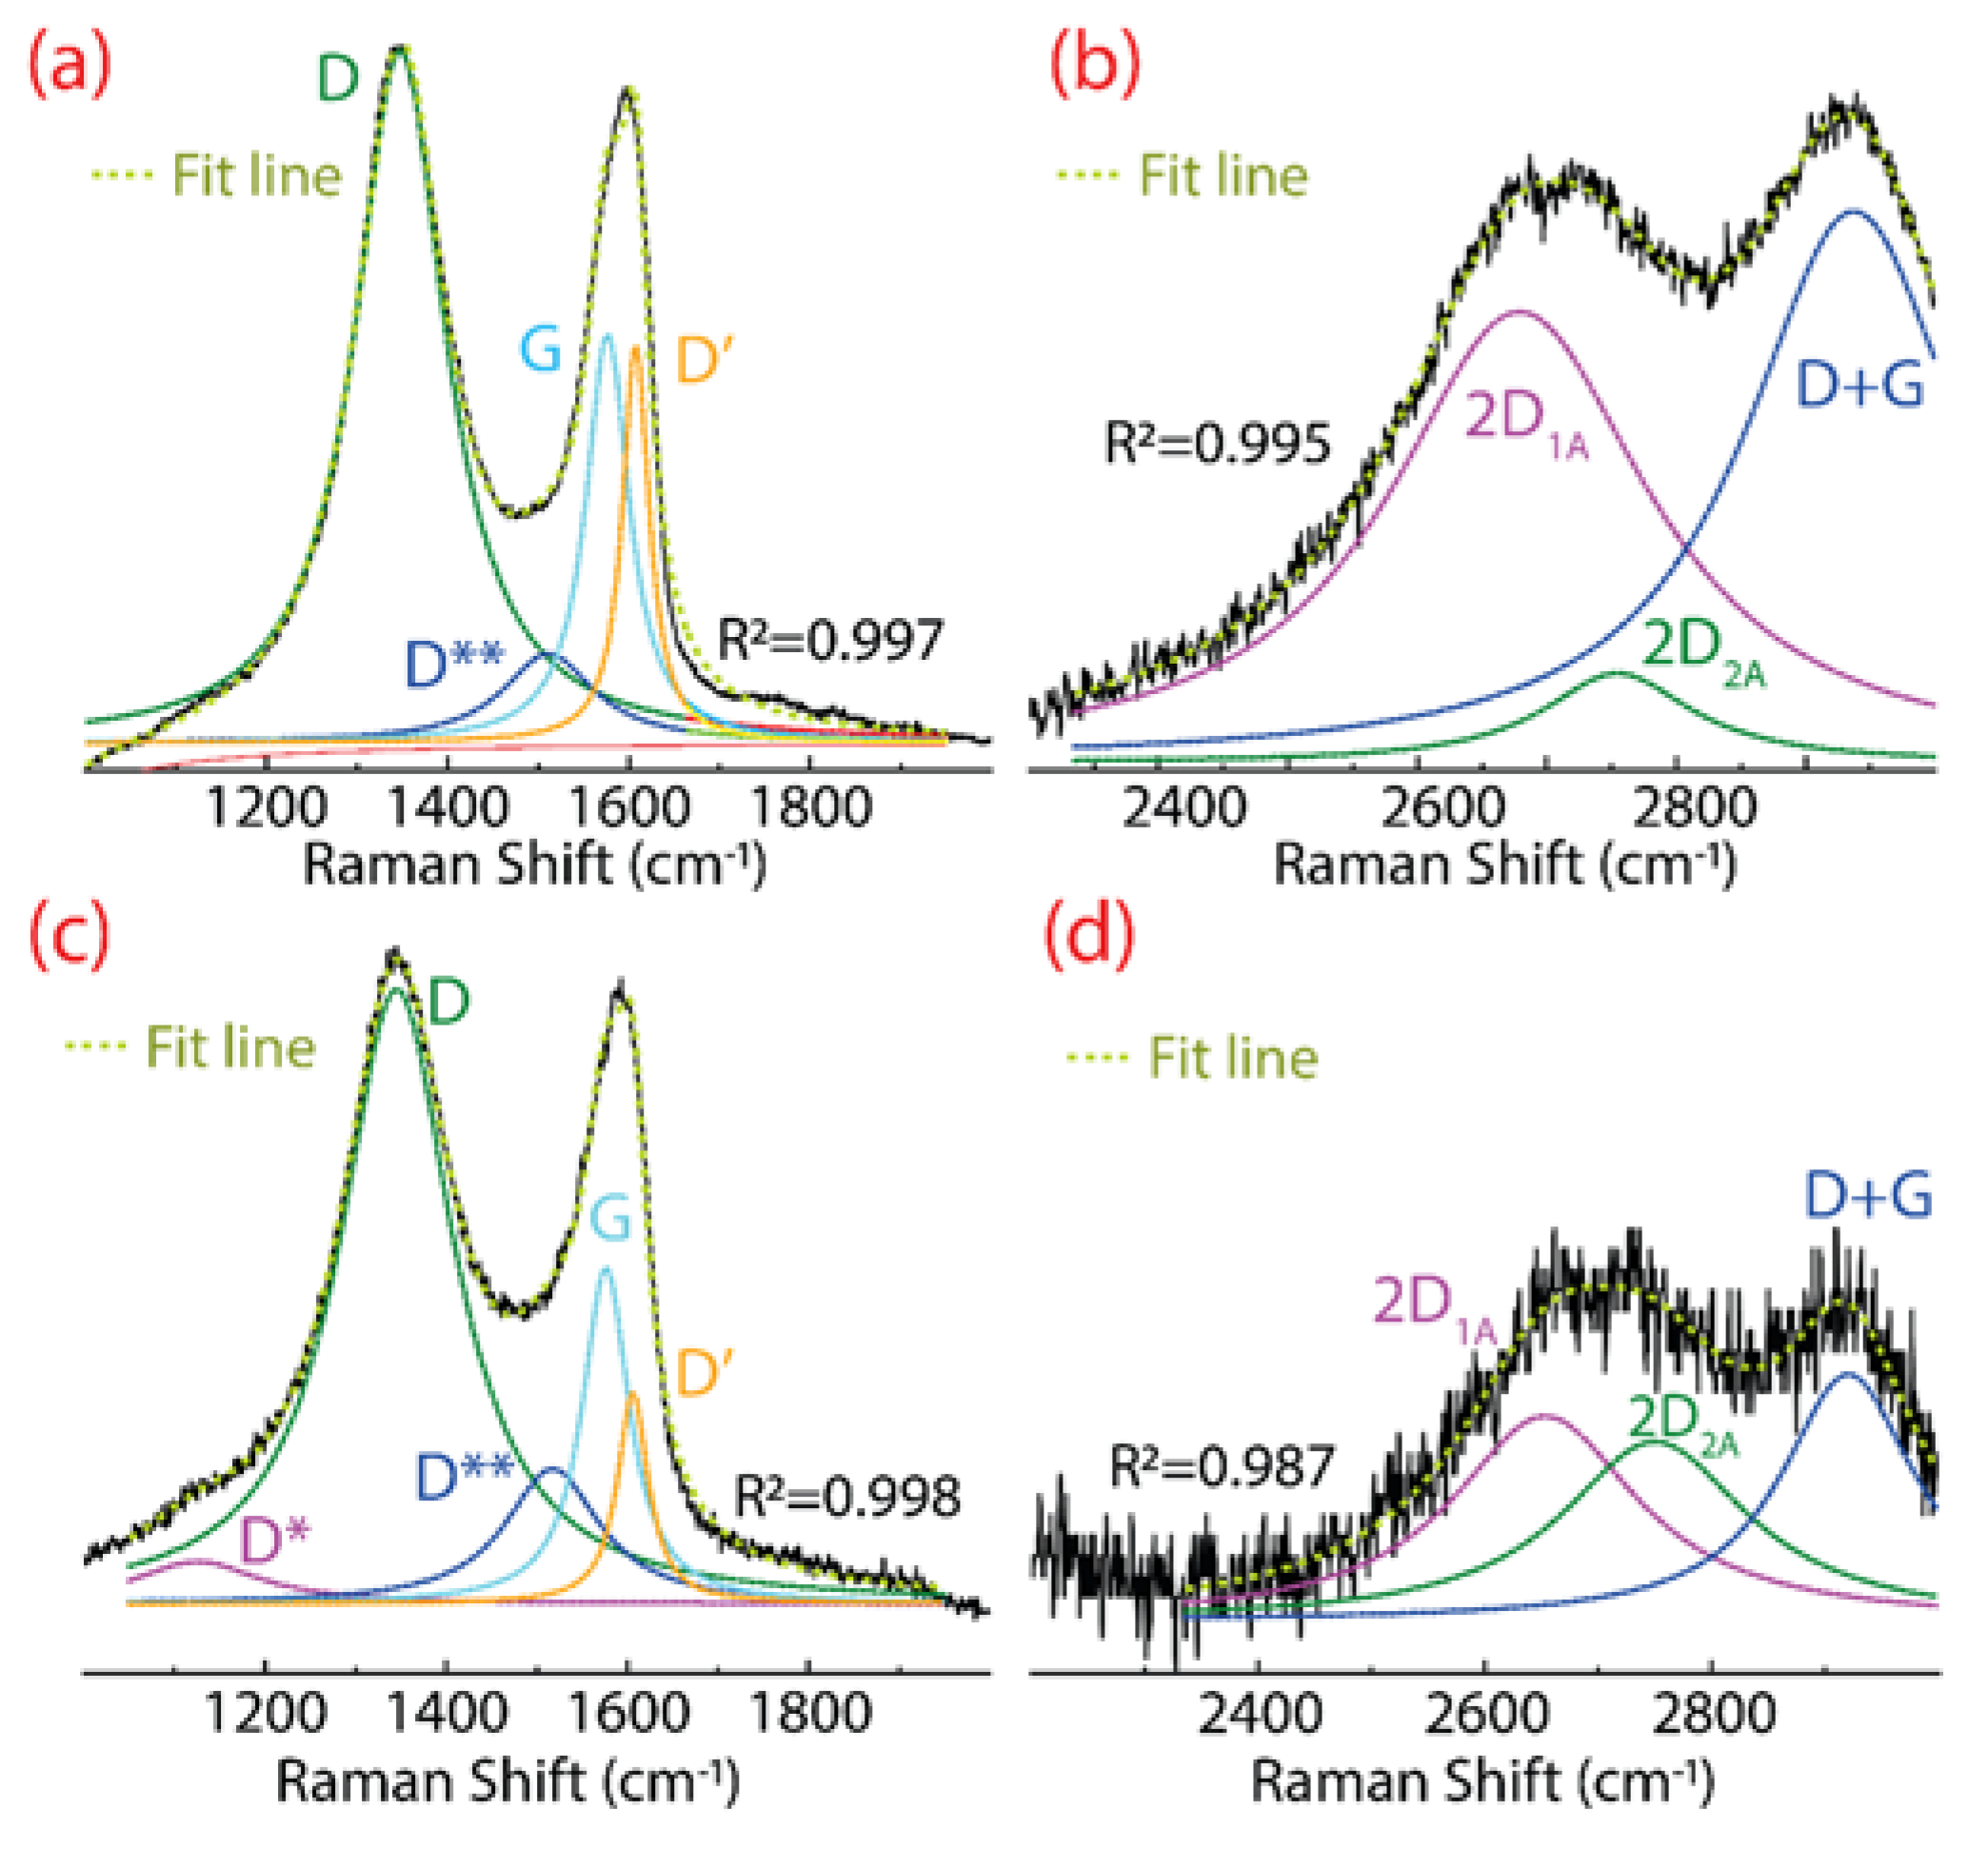
- A barely noticeable D* band is detected at 1124 cm−1, which can be attributed to the sp3 diamond line of disordered amorphous carbons, i.e., diamond-like carbon phase [38];
- The intensity of the D band is markedly attenuated, further confirming the change of GO into rGO.
For additional evidence of the preparation of GO and rGO, Figure 4 shows the spectroscopic characterization by UV–Vis (Figure 4a), IR (Figure 4b), and XRD (Figure 4c) techniques. GO displays a peak at 233 nm and a less intense peak at 304 nm (blue curve). The first peak is connected with the transitions in CC bonds and the second peak is connected with the transition in CO bonds. After the reduction process, the main peak redshifts at 263 nm (green curve), suggesting that the electronic conjugation of graphene was restored.
Figure 4.
Spectroscopical characterization of GO and rGO: (a) UV–Visible (UV–vis); (b) IR spectra; and (c) XRD analysis.
The existence of oxygen functional groups is demonstrated by FT–IR measurements with the following characteristic functional groups: CCC at 1050 cm−1, CO at 1650 cm−1, and O (or water molecules) at 3250 cm−1 [26,27]. These oxygen-containing functional groups produce a hydrophilic GO with a good dispersibility in water. After reduction, these prominent peaks are significantly weakened in rGO, confirming the noteworthy removal of oxygen groups. It is important to highlight that GO is very dispersible in water compared to rGO, which frequently leads to poor adsorption processes. This idea is another motivation for the present comparative work.
Lastly, the crystallinity transformation of GO to rGO is proved by XRD measurements. GO shows a narrow peak at 2, which corresponds to a (bigger) lattice spacing of 0.81 nm, confirming the change of graphite onto GO. After the reduction process, the peak becomes broader and shifts towards angles, 2, which corresponds to a lattice spacing of 0.39 nm, confirming the removal of intercalated water molecules or functional groups, which decreases the distance between rGO layers.
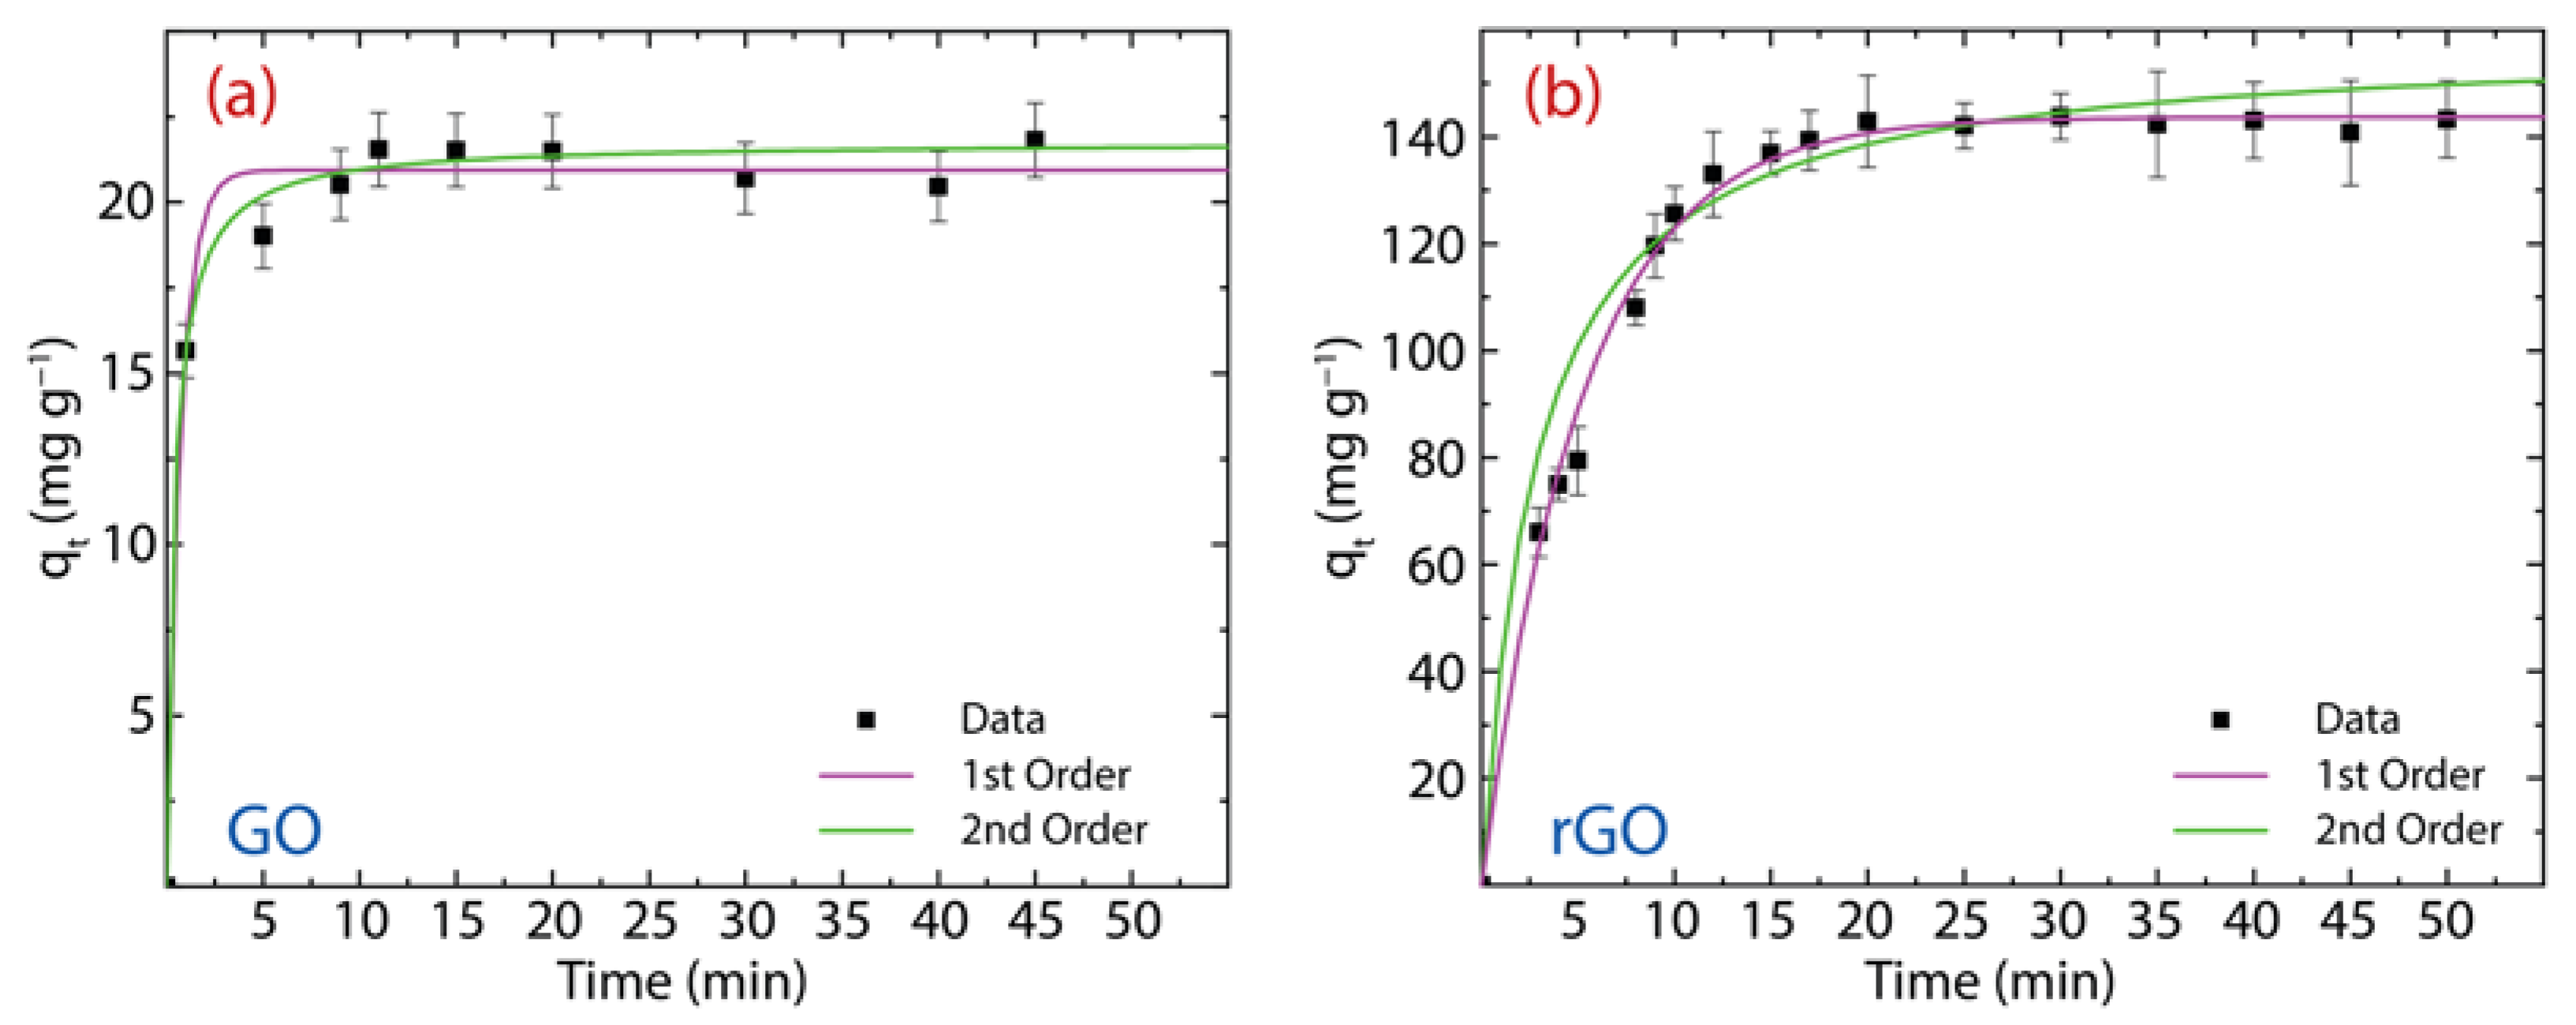
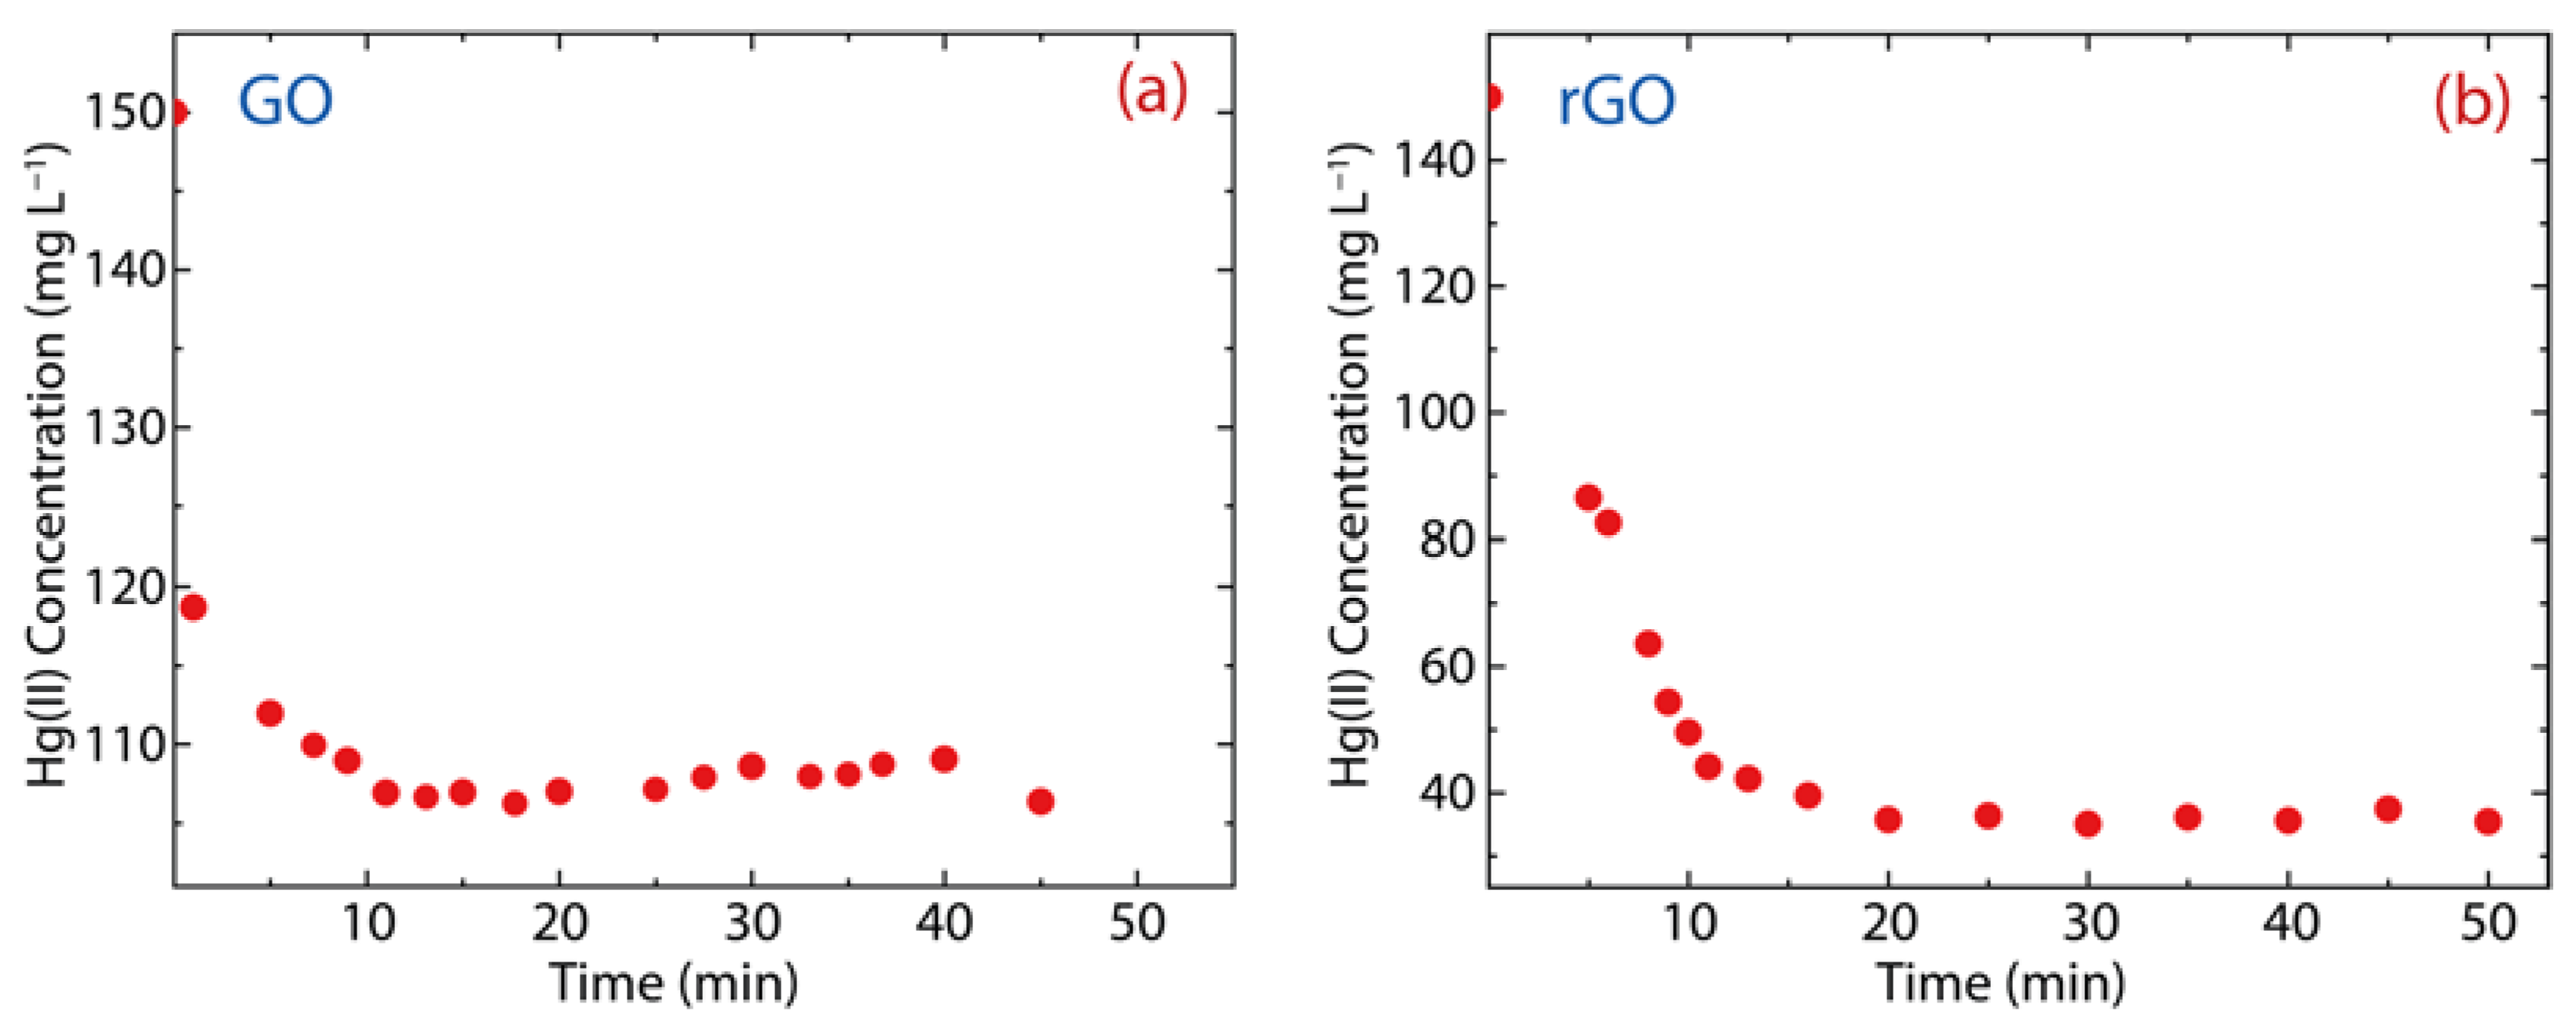
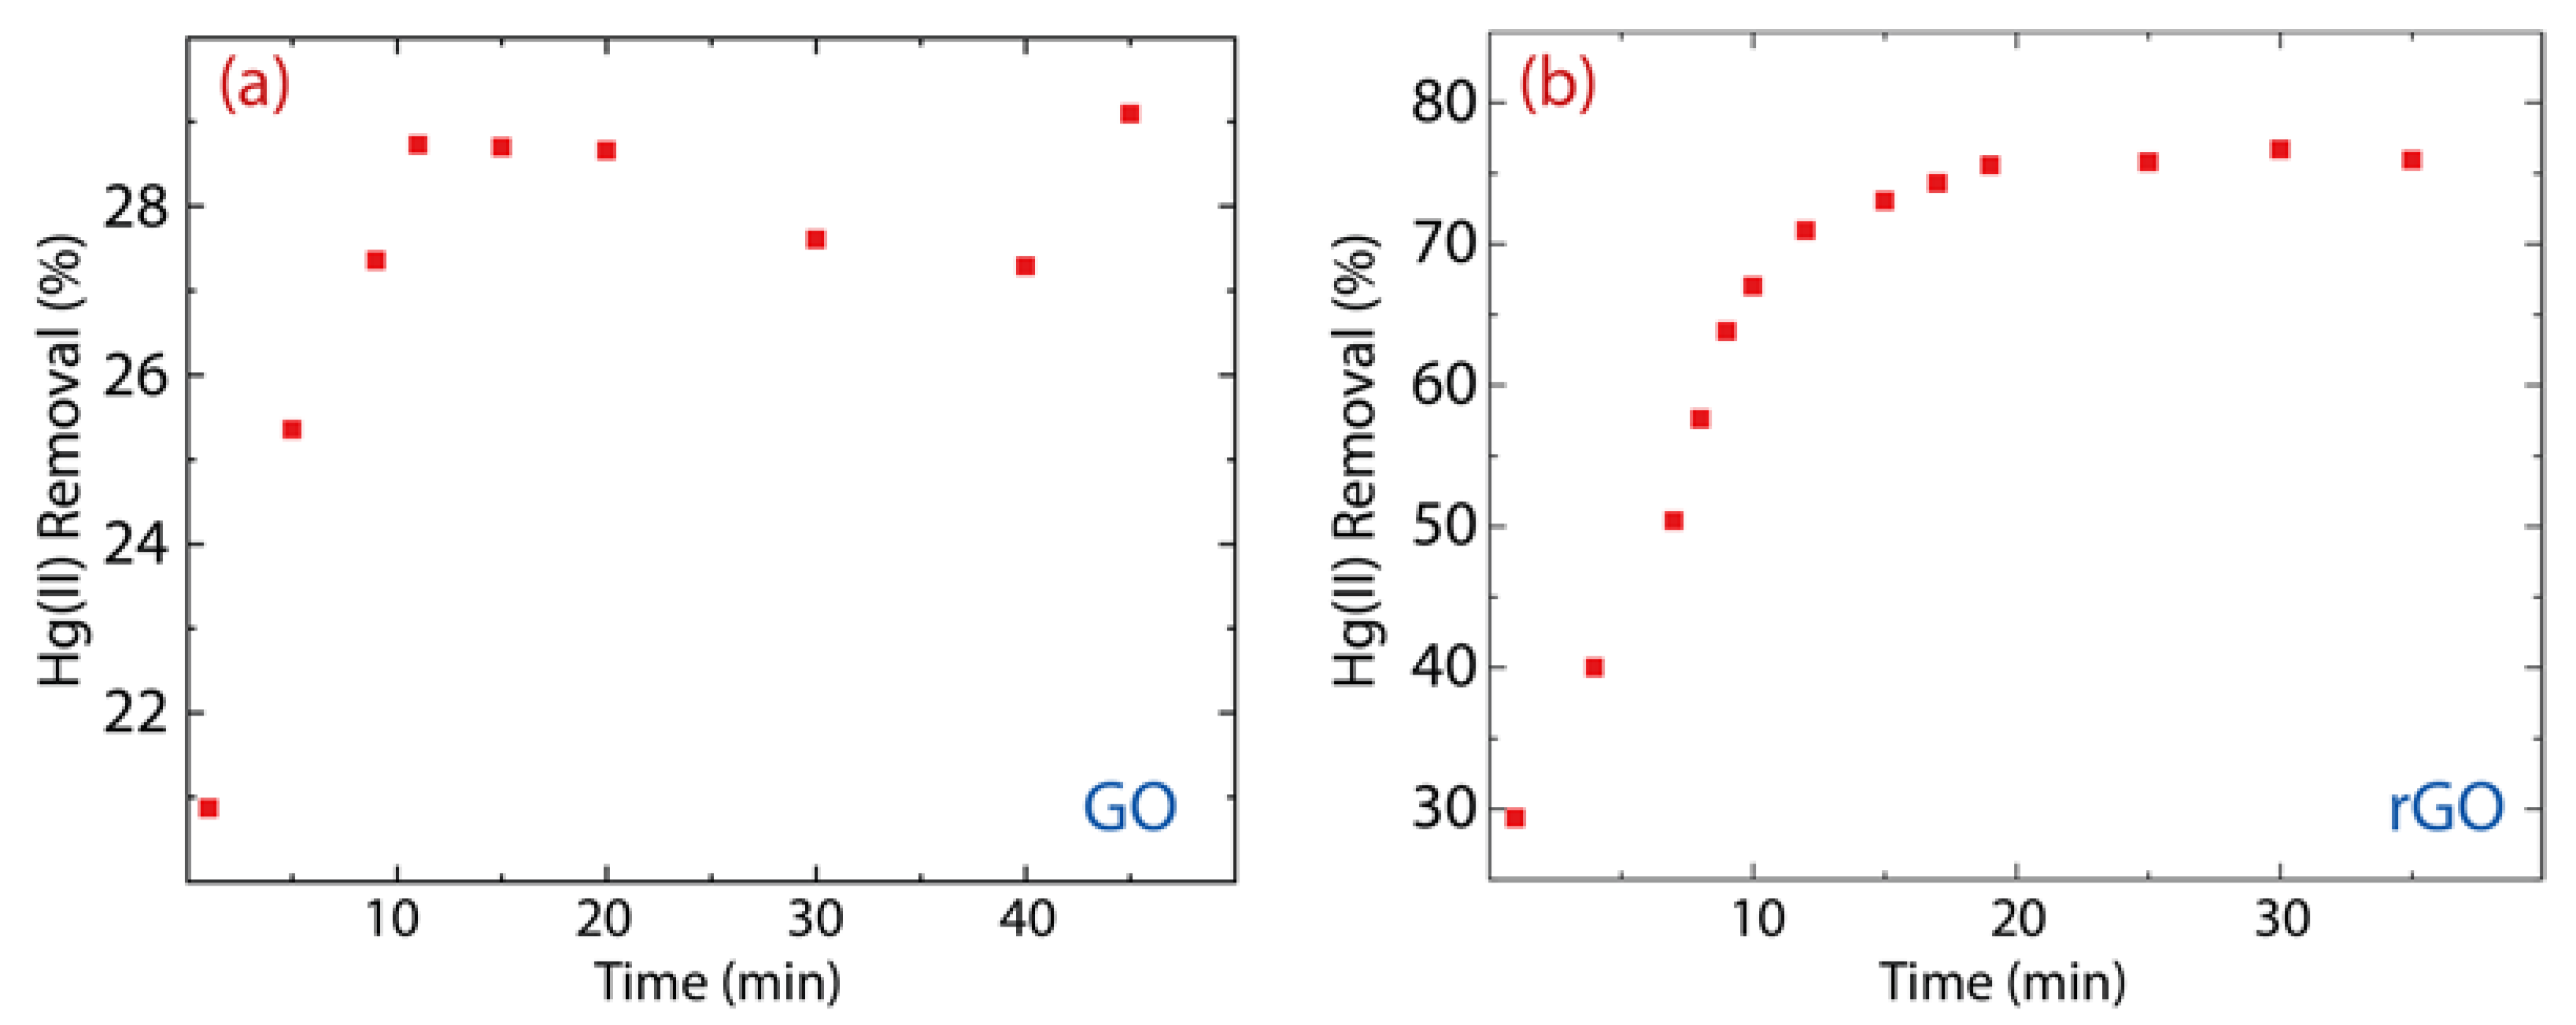
3.2. Hg(II) Adsorption Kinetics and Removal Percentage of GO and rGO
Although oxygen functional groups (such as hydroxyl, epoxy, carboxyl, and carbonyl groups [20]) are randomly distributed in GO and rGO at the surface or edges, the predominant oxygen-containing functional groups on the surface are hydroxyl (COH) and epoxy (COC) groups. With this in mind, Figure 5 proposes the interaction mechanism between Hg(II) and GO or Hg(II) and rGO, which is expected to be, mainly, electrostatic due to the negatively charged surface of the adsorbents and the cationic behavior of Hg(II). Recently, by density functional calculations [6], it was demonstrated that the O-free zones also play an important role in the adsorption effectiveness of rGO. This fact is attributed to the presence and increased number of the interactions after the reduction of GO [39]. Then, superior adsorption effectiveness is expected in rGO compared to GO.
Figure 5.
Adsorption of Hg(II) on GO and rGO after and before the reduction process, showing the involved electrostatic and interactions.
The amount of Hg(II) adsorbed () on GO or rGO at the time () can be calculated as follows:
where is the initial Hg(II) concentration (150 mg·L−1) and is the Hg(II) concentration at the time (). is the adsorbent mass (g) and is the volume of the solution (L). At the equilibrium, the following expression appears:
where is the equilibrium concentration and is the adsorption capacity. Then, the removal effectiveness () (also called removal percentage or Hg(II) removal (%)) of GO and rGO can be calculated as:
Figure 6 shows the adsorption kinetics of Hg(II) onto GO or rGO at room temperature, considering an interaction time ranging from 1 to 60 min. As observed, GO can rapidly adsorb Hg(II) ions after 10 min (the equilibrium adsorption time of GO) (Figure 6a), while the equilibrium adsorption time in rGO is 20 min (Figure 6b). This result is ascribed to the fact that rGO has more active adsorption sites [6], which is due to a higher number of oxygen-free zones recovered after reduction.
Figure 6.
Adsorption kinetics of Hg(II) on (a) GO and (b) rGO with experimental conditions: = 150 mg·L−1, = 500 mg, and = 250 mL.
The remaining Hg(II) concentration in the solution treated with GO is 107 mg·L−1 (Figure 6a), i.e., 28% of the Hg(II) content was removed (Figure 7a). Considering the contact time (60 min), the removal percentage of GO ranges from 21% to 29%, which shows an increase of 8%. Interestingly, the Hg(II) remaining Hg(II) concentration in the solution treated with rGO was around 40 mg·L−1 (Figure 6b), i.e., 75% of Hg(II) content was removed (Figure 7b). The removal percentage of rGO ranges from 29% to 77%, which shows an increase of 48%. These results confirm our previous idea, that is, rGO shows higher efficiency than GO.
Figure 7.
Removal percentage of Hg(II) on (a) GO and (b) rGO with experimental conditions: = 150 mg·L−1, = 500 mg, and = 250 mL.
Therefore, we propose that the effectiveness of rGO is attributed (i) to attractive electrostatic interactions due to the existence of oxygen-containing functional groups as well as (ii) to the perpendicular interactions created in the oxygen-free zones. Instead, in GO, only electrostatic interactions are predominant.
3.3. Pseudo-First and Pseudo-Second-Order Kinetics Study
The adsorption mechanism of Hg(II) onto GO and Hg(II) onto rGO is reported in Figure 8. The parameters of adsorption kinetics were estimated by using the pseudo-first-order (PFO) model described as follows:
here, represents the PFO rate constant, is the adsorption capacity at a specific time (), and is the equilibrium adsorption capacity. The pseudo-second-order (PSO) model was further used to obtain the parameters of adsorption kinetics, which are described as:
here, denotes the PFO rate constant. The computed parameters are reported in Table 1 and the corresponding plot in Figure 8a for GO and Figure 8b for rGO.
Figure 8.
PFO and PSO study for the adsorption of Hg(II) on (a) GO and (b) rGO with experimental conditions: = 150 mg·L−1, = 500 mg, and = 250 mL.
Table 1.
Estimated parameters at 298 K of PFO and PSO models.
Now, we analyze the adsorption mechanism of Hg(II) onto GO with an equilibrium adsorption time of 10 min (discussed in the previous subsection). From the PFO model (magenta curve), the estimated value ( mg·g−1) is very close to the experimental result of mg·g−1. Instead, the PSO model (green curve) slightly overestimate the value ( mg·g−1). By comparing the high correlation value (R2) and sum square error (SSE) values, the adsorption kinetics process is more in line with the PSO model, suggesting that the adsorption kinetics process could be controlled mostly by chemisorption [6]. The latter statement is further confirmed by the root-mean-square deviation (RMSE) value (0.680). The value is 13.4 min−1.
The adsorption mechanism of Hg(II) on rGO is carried out using an equilibrium adsorption time of 20 min. A close picture of the PFO (magenta curve) and PSO (green curve) models show that the values of the equilibrium adsorption capacity ( mg·g−1 and mg·g−1, respectively) are slightly above the experimental value ( mg·g−1). The values of R2 and SSE demonstrate that the adsorption kinetics process is best described by the PSO model, telling us that the adsorption kinetics process could also be controlled by chemisorption. This assertion is confirmed by the RMSE value (0.680). Nevertheless, the physisorption cannot be completely ruled out due to the presence of oxygen-free zones with (weak) perpendicular interactions. The value is 0.118 g mg−1·min−1.
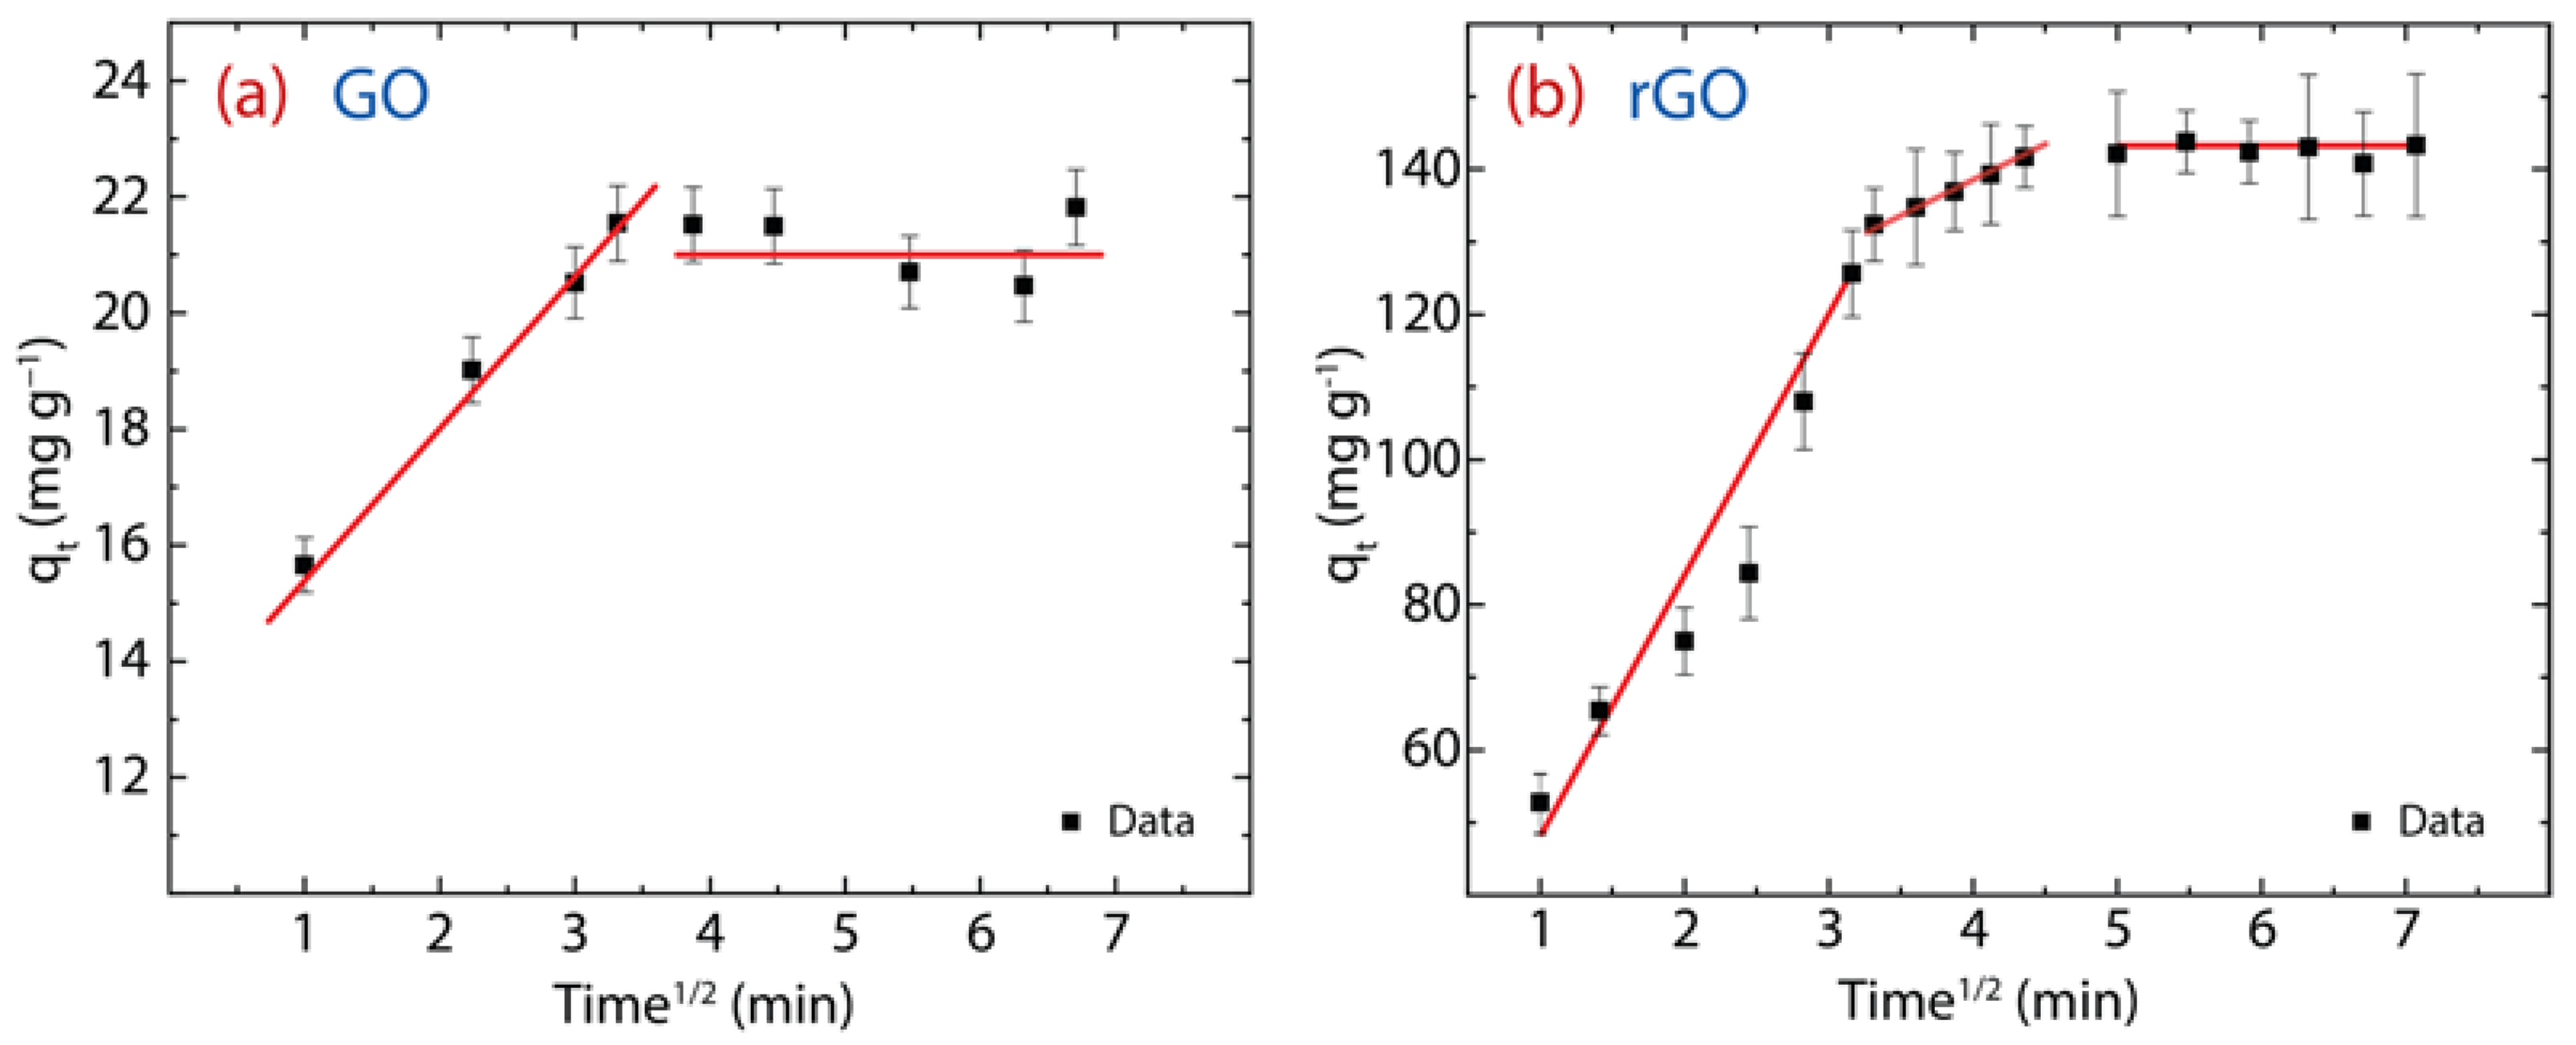
3.4. Intraparticle Diffusion Analysis
The diffusion of Hg(II) through the GO or rGO structure can be estimated by the intraparticle diffusion (IPD) model, expressed as:
here, denotes the IPD rate constant (mg·g−1·min1/2) and intercept C, describes the boundary layer effect or surface adsorption [6]. From the theoretical part: (i) if C is zero, there is no boundary layer effect and subsequently, the linear line should pass through the origin (which is absent in the present work), and (ii) if C is greater than zero, the greater the contribution of the surface adsorption. The parameters of the IPD model are reported in Table 2 and the resulting plot is shown in Figure 9a for GO and Figure 9b for rGO.
Table 2.
Estimated parameters of the IPD model at 298 K.
Figure 9.
IPD study showing different regions of linearity of the adsorption behavior on (a) GO and (b) rGO with experimental conditions: = 150 mg·L−1, = 500 mg, and = 250 mL.
Firstly, the values observed in Hg(II) on GO (i.e., ) and Hg(II) on rGO (i.e., ) display greater surface adsorption, leading to cationic mercury to move from the surface to the internal structure of the adsorbent. However, the C value in rGO is approximately five times higher than that found in GO, suggesting that rGO has a larger active adsorption surface, which we assume is due to the recovery of sp2 hybridization after the reduction process.
Secondly, two linear stages are noted in GO: the early stage is linked to the faster movement of cationic mercury from the aqueous solution to the GO surface, and the second stage is linked to the very slow diffusion of cationic mercury through the internal GO structure (Figure 9a). Instead, rGO shows an intermediate region that is linked to the gradual diffusion of cationic mercury from larger pores to smaller pores (Figure 9) [6]. The porous structure of rGO can be seen in Figure 1c. These outcomes confirm that GO does not have many active sites for capturing Hg(II) ions and therefore its adsorption capacity is reduced.
To further explore the diffusion process, the adsorption factor () is estimated by:
where is the ratio of the initial adsorption quantity and is the final adsorption quantity at the longest . The values of in GO () and rGO () indicate intermediate initial adsorption and strong initial adsorption, respectively [40].
For comparison purposes, Table 3 shows the parameter of the IPD model observed in some graphene-based adsorbents. Similar values are observed in other extra-functionalized graphene oxides or more complex structures.
Table 3.
Comparison of the parameters of the intraparticle diffusion (IPD) model.
Coming back, the greatest adsorption of Hg(II) ions occurs on the rGO surface, confirming a recovered sp2 character compared to GO. To clarify this fact, we can assume the following:
- At the nanoscale, the sp3 hybridization reduces the surface area of GO (Figure 2a), decreasing, in turn, the number of active sites for Hg(II) adsorption. Instead, in rGO, when recovered (totally or partially) of the sp2 hybridization, the number of active sites increases due to the high surface area of rGO (Figure 2b), increasing its adsorption effectiveness;
- At the microscale, the adsorption properties of rGO are superior to those of GO, regardless of whether the rGO sheets are in the nanometer range (Figure 2b) while those of GO are in the micrometer range (Figure 2a), suggesting that the efficiency of rGO is mainly influenced by the type of hybridization (nanoscale) and not by the lateral size (microscale).
These assertions motivate an extended work and can be corroborated with a statistical approach by analyzing SEM, TEM, or AFM (atomic force microscope) images of the interacting Hg(II)-rGO system.
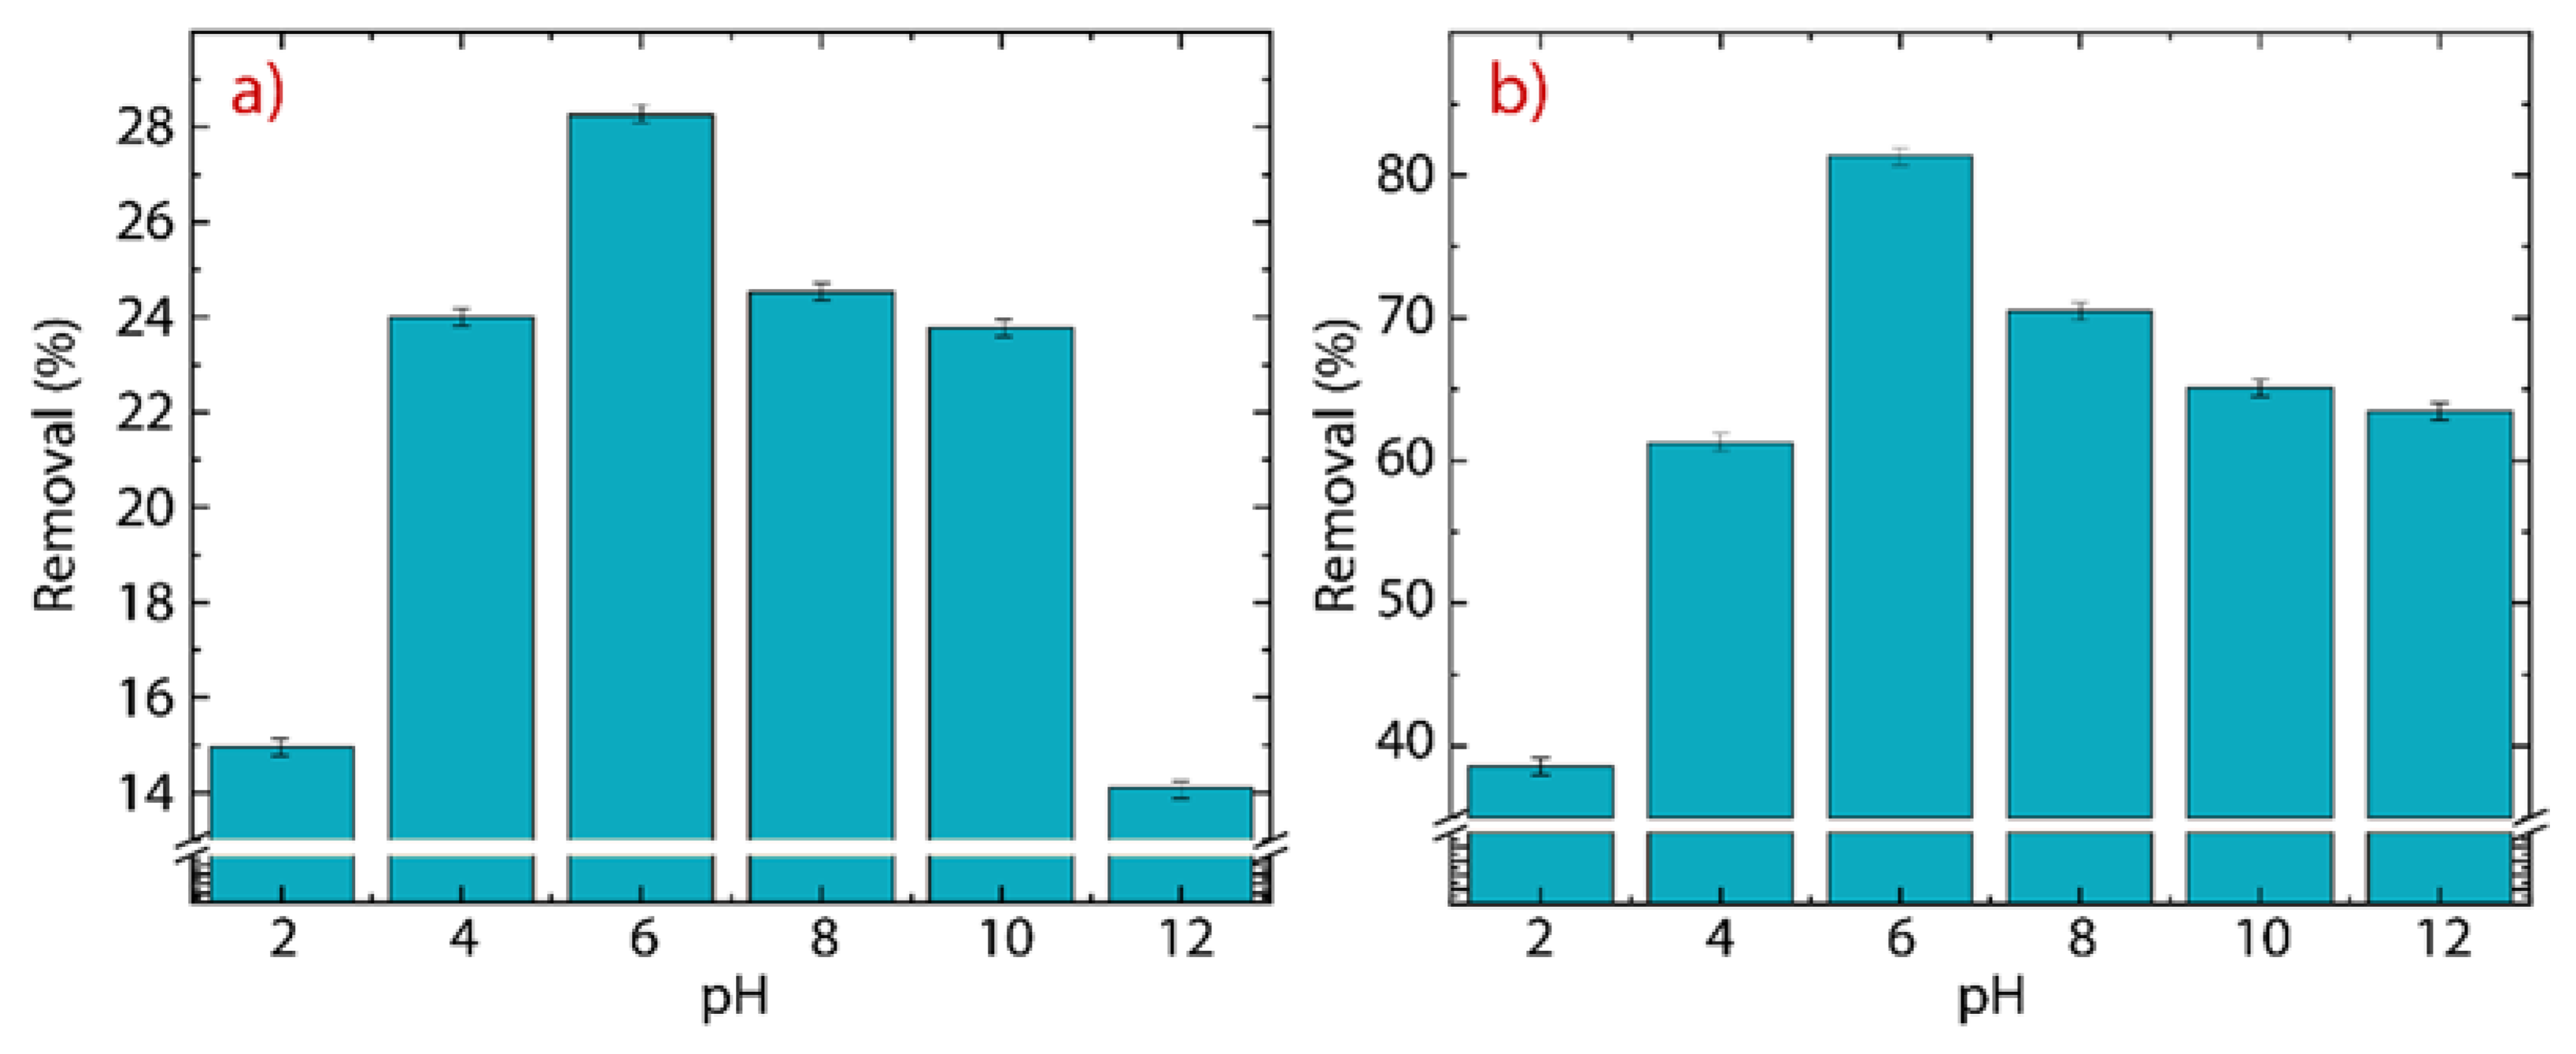
3.5. Effect of the pH
The consequence of the pH on the removal of Hg(II) ions is shown in Figure 10a for GO and Figure 10b for rGO. It is important to mention that mercury oxide (HgO) is not entirely solvable in water and it precipitates at pH values > 8 [6]. Therefore, the pH experiment is carried out at 298 K in a range of between 2 and 12 to further explore this fact.
Figure 10.
Adsorption of Hg(II) as a function of the initial pH on (a) GO and (b) rGO with experimental conditions: = 150 mg·L−1, = 500 mg, and = 250 mL.
In GO, the removal percentage increases from % at pH up to % at pH. After that, the removal percentage decreases from % at pH down to % at pH. The drop in the removal efficiency of Hg(II) ions at high pH values (8) is attributed precisely to the poor solubility of HgO. The average removal percentage, in the pH window from 4 to 8, is 25.32%, which agrees with the value observed in Figure 7a.
In rGO, the initial removal percentage of % at pH is higher than the value found at the same pH in GO and even the average value, emphasizing the superior adsorbent properties of rGO. A close-up image shows that the maximum removal percentage of % at pH, is 3.3 times greater than the maximum value of removal percentage found in GO. The average removal percentage from 4 to 8 is 73.2%, which is in good agreement with the value observed in Figure 7b.
4. Conclusions
In summary, we demonstrated an eco-friendly protocol for preparing GO and rGO as well as the morphological and spectroscopical characterization of the obtained oxidized graphenes based on SEM, TEM, EDS, UV–vis, FTIR, XRD, and Raman techniques. Most importantly, we presented a comparative adsorption study which is analyzed in terms of the adsorption kinetics approach.
In particular, the adsorption mechanism of Hg(II) onto GO is governed, mainly, by attractive interactions, i.e., electrostatic interactions between the negatively charged surface and cationic pollutant. The Hg(II)-rGO system also presents this type of electrostatic interaction, but in addition, the perpendicular interactions of the oxygen-free zones contribute to the substantial improvement of the Hg(II) adsorption processes. The latter is corroborated by analyzing the removal percentage, which is just 28% in GO and 75% in rGO. This superior removal percentage is maintained regardless of the pH value. From the PFO and PSO models, the adsorption kinetics process is governed by chemisorption. The results of the IPD model allow us to claim that in rGO, the adsorption occurs mainly on the surface, indicating the recovery of the sp2 hybridization after the reduction of GO with the proposed green reducing agent, say, citric acid.
Hence, the present work proposes pristine oxidized graphenes as promising adsorbents to treat water with probable scalability to remove different heavy metals or organic pollutants, particularly, pollutants with a cation behavior.
Author Contributions
Conceptualization, C.V.G. and S.B.; Data curation, T.T., M.G. and C.V.G.; Formal analysis, L.S.C. and C.V.G.; Funding acquisition, T.T.; Investigation, T.T., L.S.C. and C.V.G.; Methodology, M.A.P., J.C.G.G., A.S. and F.A.A.; Validation, F.A.A. and M.G.; Visualization, M.G.; Writing—original draft, C.V.G. All authors have read and agreed to the published version of the manuscript.
Funding
This work was supported by the Universidad Técnica Particular de Loja (UTPL-Ecuador) (RUC No. 1190068729001). Part of this work was also supported by the FONDOCyT from the Ministry of Higher Education Science and Technology of the Dominican Republic (Grant No. 2018-2019-3A9-139).
Institutional Review Board Statement
Not applicable.
Informed Consent Statement
Not applicable.
Data Availability Statement
Not applicable.
Acknowledgments
T.T., M.G. and C.V.G. wish to thank Escuela Superior Politécnica de Chimborazo and Yachay Tec for their hospitality during the completion of this work. Additionally, the authors would like to thank the Ecuadorian National Department of Science and Technology (SENESCYT).
Conflicts of Interest
The authors declare no conflict of interest.
References
- Rao, M.M.; Reddy, D.H.K.K.; Venkateswarlu, P.; Seshaiah, K. Removal of Mercury from Aqueous Solutions Using Activated Carbon Prepared from Agricultural By-Product/Waste. J. Environ. Manag. 2009, 90, 634–643. [Google Scholar] [CrossRef] [PubMed]
- Pillay, K.; Cukrowska, E.M.; Coville, N.J. Improved Uptake of Mercury by Sulphur-Containing Carbon Nanotubes. Microchem. J. 2013, 108, 124–130. [Google Scholar] [CrossRef]
- Hsi, H.-C.; Rood, M.J.; Rostam-Abadi, M.; Chen, S.; Chang, R. Effects of Sulfur Impregnation Temperature on the Properties and Mercury Adsorption Capacities of Activated Carbon Fibers (ACFs). Environ. Sci. Technol. 2001, 35, 2785–2791. [Google Scholar] [CrossRef] [PubMed]
- Liu, M.-X.; Deng, X.-X.; Zhu, D.-Z.; Duan, H.; Xiong, W.; Xu, Z.-J.; Gan, L.-H. Magnetically Separated and N, S Co-Doped Mesoporous Carbon Microspheres for the Removal of Mercury Ions. Chin. Chem. Lett. 2016, 27, 795–800. [Google Scholar] [CrossRef]
- Tawabini, B.; Al-Khaldi, S.; Atieh, M.; Khaled, M. Removal of Mercury from Water by Multi-Walled Carbon Nanotubes. Water Sci. Technol. 2010, 61, 591–598. [Google Scholar] [CrossRef]
- Tene, T.; Arias Arias, F.; Guevara, M.; Nuñez, A.; Villamagua, L.; Tapia, C.; Pisarra, M.; Torres, F.J.; Caputi, L.S.; Vacacela Gomez, C. Removal of Mercury (II) from Aqueous Solution by Partially Reduced Graphene Oxide. Sci. Rep. 2022, 12, 6326. [Google Scholar] [CrossRef]
- Yu, J.-G.; Yue, B.-Y.; Wu, X.-W.; Liu, Q.; Jiao, F.-P.; Jiang, X.-Y.; Chen, X.-Q. Removal of Mercury by Adsorption: A Review. Environ. Sci. Pollut. Res. 2016, 23, 5056–5076. [Google Scholar] [CrossRef]
- Urgun-Demirtas, M.; Benda, P.L.; Gillenwater, P.S.; Negri, M.C.; Xiong, H.; Snyder, S.W. Achieving Very Low Mercury Levels in Refinery Wastewater by Membrane Filtration. J. Hazard. Mater. 2012, 215, 98–107. [Google Scholar] [CrossRef]
- Chiarle, S.; Ratto, M.; Rovatti, M. Mercury Removal from Water by Ion Exchange Resins Adsorption. Water Res. 2000, 34, 2971–2978. [Google Scholar] [CrossRef]
- An, D.; Sun, X.; Cheng, X.; Cui, L.; Zhang, X.; Zhao, Y.; Dong, Y. Investigation on Mercury Removal and Recovery Based on Enhanced Adsorption by Activated Coke. J. Hazard. Mater. 2020, 384, 121354. [Google Scholar] [CrossRef]
- Chaturvedi, S.I. Mercury Removal Using Fe–Fe Electrodes by Electrocoagulation. Int. J. Mod. Eng. Res. 2013, 3, 101–108. [Google Scholar]
- Fertonani, F.L.; Benedetti, A.V.; Servat, J.; Portillo, J.; Sanz, F. Electrodeposited Thin Mercury Films on Pt–Ir Alloy Electrodes. Thin Solid Films 1999, 349, 147–154. [Google Scholar] [CrossRef]
- Liu, Z.; Zhou, J.; Jin, L.; Zhou, Q.; Zhou, L.; Lu, Y.; Li, B. Mercury Removal from Syngas by Metal Oxides Based Adsorbent: A Review. Fuel 2022, 327, 125057. [Google Scholar] [CrossRef]
- Coello-Fiallos, D.; Tene, T.; Guayllas, J.L.; Haro, D.; Haro, A.; Gomez, C.V. DFT Comparison of Structural and Electronic Properties of Graphene and Germanene: Monolayer and Bilayer Systems. Mater. Today Proc. 2017, 4, 6835–6841. [Google Scholar] [CrossRef]
- Sindona, A.; Pisarra, M.; Gomez, C.V.; Riccardi, P.; Falcone, G.; Bellucci, S. Calibration of the Fine-Structure Constant of Graphene by Time-Dependent Density-Functional Theory. Phys. Rev. B 2017, 96, 201408. [Google Scholar] [CrossRef]
- Sindona, A.; Pisarra, M.; Bellucci, S.; Tene, T.; Guevara, M.; Gomez, C.V. Plasmon Oscillations in Two-Dimensional Arrays of Ultranarrow Graphene Nanoribbons. Phys. Rev. B 2019, 100, 235422. [Google Scholar] [CrossRef]
- Scarcello, A.; Alessandro, F.; Polanco, M.A.; Gomez, C.V.; Perez, D.C.; De Luca, G.; Curcio, E.; Caputi, L.S. Evidence of Massless Dirac Fermions in Graphitic Shells Encapsulating Hollow Iron Microparticles. Appl. Surf. Sci. 2021, 546, 149103. [Google Scholar] [CrossRef]
- Tene, T.; Guevara, M.; Viteri, E.; Maldonado, A.; Pisarra, M.; Sindona, A.; Vacacela Gomez, C.; Bellucci, S. Calibration of Fermi Velocity to Explore the Plasmonic Character of Graphene Nanoribbon Arrays by a Semi-Analytical Model. Nanomaterials 2022, 12, 2028. [Google Scholar] [CrossRef]
- Tene, T.; Bellucci, S.; Guevara, M.; Viteri, E.; Arias Polanco, M.; Salguero, O.; Vera-Guzmán, E.; Valladares, S.; Scarcello, A.; Alessandro, F.; et al. Cationic pollutant removal from aqueous solution using reduced graphene oxide. Nanomaterials 2022, 12, 309. [Google Scholar] [CrossRef]
- Gomez, C.V.; Robalino, E.; Haro, D.; Tene, T.; Escudero, P.; Haro, A.; Orbe, J. Structural and Electronic Properties of Graphene Oxide for Different Degree of Oxidation. Mater. Today Proc. 2016, 3, 796–802. [Google Scholar] [CrossRef]
- Gomez, C.V.; Guevara, M.; Tene, T.; Villamagua, L.; Usca, G.T.; Maldonado, F.; Tapia, C.; Cataldo, A.; Bellucci, S.; Caputi, L.S. The Liquid Exfoliation of Graphene in Polar Solvents. Appl. Surf. Sci. 2021, 546, 149046. [Google Scholar] [CrossRef]
- Vacacela Gomez, C.; Tene, T.; Guevara, M.; Tubon Usca, G.; Colcha, D.; Brito, H.; Molina, R.; Bellucci, S.; Tavolaro, A. Preparation of Few-Layer Graphene Dispersions from Hydrothermally Expanded Graphite. Appl. Sci. 2019, 9, 2539. [Google Scholar] [CrossRef] [Green Version]
- Cayambe, M.; Zambrano, C.; Tene, T.; Guevara, M.; Usca, G.T.; Brito, H.; Molina, R.; Coello-Fiallos, D.; Caputi, L.S.; Gomez, C.V. Dispersion of Graphene in Ethanol by Sonication. Mater. Today Proc. 2021, 37, 4027–4030. [Google Scholar] [CrossRef]
- Tubon Usca, G.; Vacacela Gomez, C.; Guevara, M.; Tene, T.; Hernandez, J.; Molina, R.; Tavolaro, A.; Miriello, D.; Caputi, L.S. Zeolite-Assisted Shear Exfoliation of Graphite into Few-Layer Graphene. Crystals 2019, 9, 377. [Google Scholar] [CrossRef] [Green Version]
- Marcano, D.C.; Kosynkin, D.V.; Berlin, J.M.; Sinitskii, A.; Sun, Z.; Slesarev, A.; Alemany, L.B.; Lu, W.; Tour, J.M. Improved Synthesis of Graphene Oxide. ACS Nano 2010, 4, 4806–4814. [Google Scholar] [CrossRef]
- Tene, T.; Tubon Usca, G.; Guevara, M.; Molina, R.; Veltri, F.; Arias, M.; Caputi, L.S.; Vacacela Gomez, C. Toward Large-Scale Production of Oxidized Graphene. Nanomaterials 2020, 10, 279. [Google Scholar] [CrossRef] [Green Version]
- Chen, J.; Yao, B.; Li, C.; Shi, G. An Improved Hummers Method for Eco-Friendly Synthesis of Graphene Oxide. Carbon N. Y. 2013, 64, 225–229. [Google Scholar] [CrossRef]
- Tene, T.; Guevara, M.; Valarezo, A.; Salguero, O.; Arias Arias, F.; Arias, M.; Scarcello, A.; Caputi, L.S.; Vacacela Gomez, C. Drying-Time Study in Graphene Oxide. Nanomaterials 2021, 11, 1035. [Google Scholar] [CrossRef]
- Tchounwou, P.B.; Ayensu, W.K.; Ninashvili, N.; Sutton, D. Environmental Exposure to Mercury and Its Toxicopathologic Implications for Public Health. Environ. Toxicol. Int. J. 2003, 18, 149–175. [Google Scholar] [CrossRef]
- Clifton, J.C., II. Mercury Exposure and Public Health. Pediatr. Clin. N. Am. 2007, 54, 237.e1–237.e45. [Google Scholar] [CrossRef]
- Apostoli, P.; Catalani, S. Metal Ions Affecting Reproduction and Development. In Metal Ions in Toxicology: Effects, Interactions, Interdependencies; Sigel, A., Sigel, H., Sigel, R.K.O., Eds.; De Gruyter: Berlin, Germany, 2010; Volume 8, pp. 263–303. [Google Scholar]
- Mojammal, A.H.M.; Back, S.-K.; Seo, Y.-C.; Kim, J.-H. Mass Balance and Behavior of Mercury in Oil Refinery Facilities. Atmos. Pollut. Res. 2019, 10, 145–151. [Google Scholar] [CrossRef]
- Takahashi, F.; Yamagata, M.; Yasuda, K.; Kida, A. Impact of Mercury Emissions from Incineration of Automobile Shredder Residue in Japan. Appl. Geochem. 2008, 23, 584–593. [Google Scholar] [CrossRef]
- Liu, G.; Cai, Y.; O’Driscoll, N.; Feng, X.; Jiang, G. Overview of Mercury in the Environment. In Environmental Chemistry and Toxicology of Mercury; Wiley: Hoboken, NJ, USA, 2012; pp. 1–12. [Google Scholar]
- Arias, F.E.A.; Beneduci, A.; Chidichimo, F.; Furia, E.; Straface, S. Study of the Adsorption of Mercury (II) on Lignocellulosic Materials under Static and Dynamic Conditions. Chemosphere 2017, 180, 11–23. [Google Scholar] [CrossRef] [PubMed]
- Cançado, L.G.; Jorio, A.; Ferreira, E.H.M.; Stavale, F.; Achete, C.A.; Capaz, R.B.; Moutinho, M.V.O.; Lombardo, A.; Kulmala, T.S.; Ferrari, A.C. Quantifying Defects in Graphene via Raman Spectroscopy at Different Excitation Energies. Nano Lett. 2011, 11, 3190–3196. [Google Scholar] [CrossRef] [Green Version]
- Shroder, R.E.; Nemanich, R.J.; Glass, J.T. Analysis of the Composite Structures in Diamond Thin Films by Raman Spectroscopy. Phys. Rev. B 1990, 41, 3738. [Google Scholar] [CrossRef]
- Schwan, J.; Ulrich, S.; Batori, V.; Ehrhardt, H.; Silva, S.R.P. Raman Spectroscopy on Amorphous Carbon Films. J. Appl. Phys. 1996, 80, 440–447. [Google Scholar] [CrossRef] [Green Version]
- Wijaya, R.; Andersan, G.; Santoso, S.P.; Irawaty, W. Green reduction of graphene oxide using kaffir lime peel extract (Citrus hystrix) and its application as adsorbent for methylene blue. Sci. Rep. 2020, 10, 667. [Google Scholar] [CrossRef]
- Ofomaja, A.E.; Naidoo, E.B.; Pholosi, A. Intraparticle Diffusion of Cr (VI) through Biomass and Magnetite Coated Biomass: A Comparative Kinetic and Diffusion Study. S. Afr. J. Chem. Eng. 2020, 32, 39–55. [Google Scholar]
- Guo, Y.; Deng, J.; Zhu, J.; Zhou, X.; Bai, R. Removal of Mercury (II) and Methylene Blue from a Wastewater Environment with Magnetic Graphene Oxide: Adsorption Kinetics, Isotherms and Mechanism. RSC Adv. 2016, 6, 82523–82536. [Google Scholar] [CrossRef]
- Diagboya, P.N.; Olu-Owolabi, B.I.; Adebowale, K.O. Synthesis of Covalently Bonded Graphene Oxide-Iron Magnetic Nanoparticles and the Kinetics of Mercury Removal. RSC Adv. 2015, 5, 2536–2542. [Google Scholar] [CrossRef]
- Henriques, B.; Gonçalves, G.; Emami, N.; Pereira, E.; Vila, M.; Marques, P.A.A.P. Optimized graphene oxide foam with enhanced performance and high selectivity for mercury re-moval from water. J. Hazard. Mater. 2016, 301, 453–461. [Google Scholar] [CrossRef] [PubMed]
- Sadeghi, M.H.; Tofighy, M.A.; Mohammadi, T. One-Dimensional Graphene for Efficient Aqueous Heavy Metal Adsorption: Rapid Removal of Arsenic and Mercury Ions by Graphene Oxide Nanoribbons (GONRs). Chemosphere 2020, 253, 126647. [Google Scholar] [CrossRef] [PubMed]
- Cui, L.; Guo, X.; Wei, Q.; Wang, Y.; Gao, L.; Yan, L.; Yan, T.; Du, B. Removal of Mercury and Methylene Blue from Aqueous Solution by Xanthate Functionalized Magnetic Graphene Oxide: Sorption Kinetic and Uptake Mechanism. J. Colloid Interface Sci. 2015, 439, 112–120. [Google Scholar] [CrossRef]
Publisher’s Note: MDPI stays neutral with regard to jurisdictional claims in published maps and institutional affiliations. |
© 2022 by the authors. Licensee MDPI, Basel, Switzerland. This article is an open access article distributed under the terms and conditions of the Creative Commons Attribution (CC BY) license (https://creativecommons.org/licenses/by/4.0/).