
The Impact of Bias and Nitrogen Pressure on TiNbN Coatings in Arc-PVD Processes—A Multifactorial Study


Abstract
:1. Introduction
2. Materials and Methods
2.1. Sample Preparation and Layer Deposition
2.2. Coating Thickness, Structure and Morphology Analysis
2.3. Mechanical Properties Testing
2.4. Numerical Analysis and Statistical Methods
3. Results
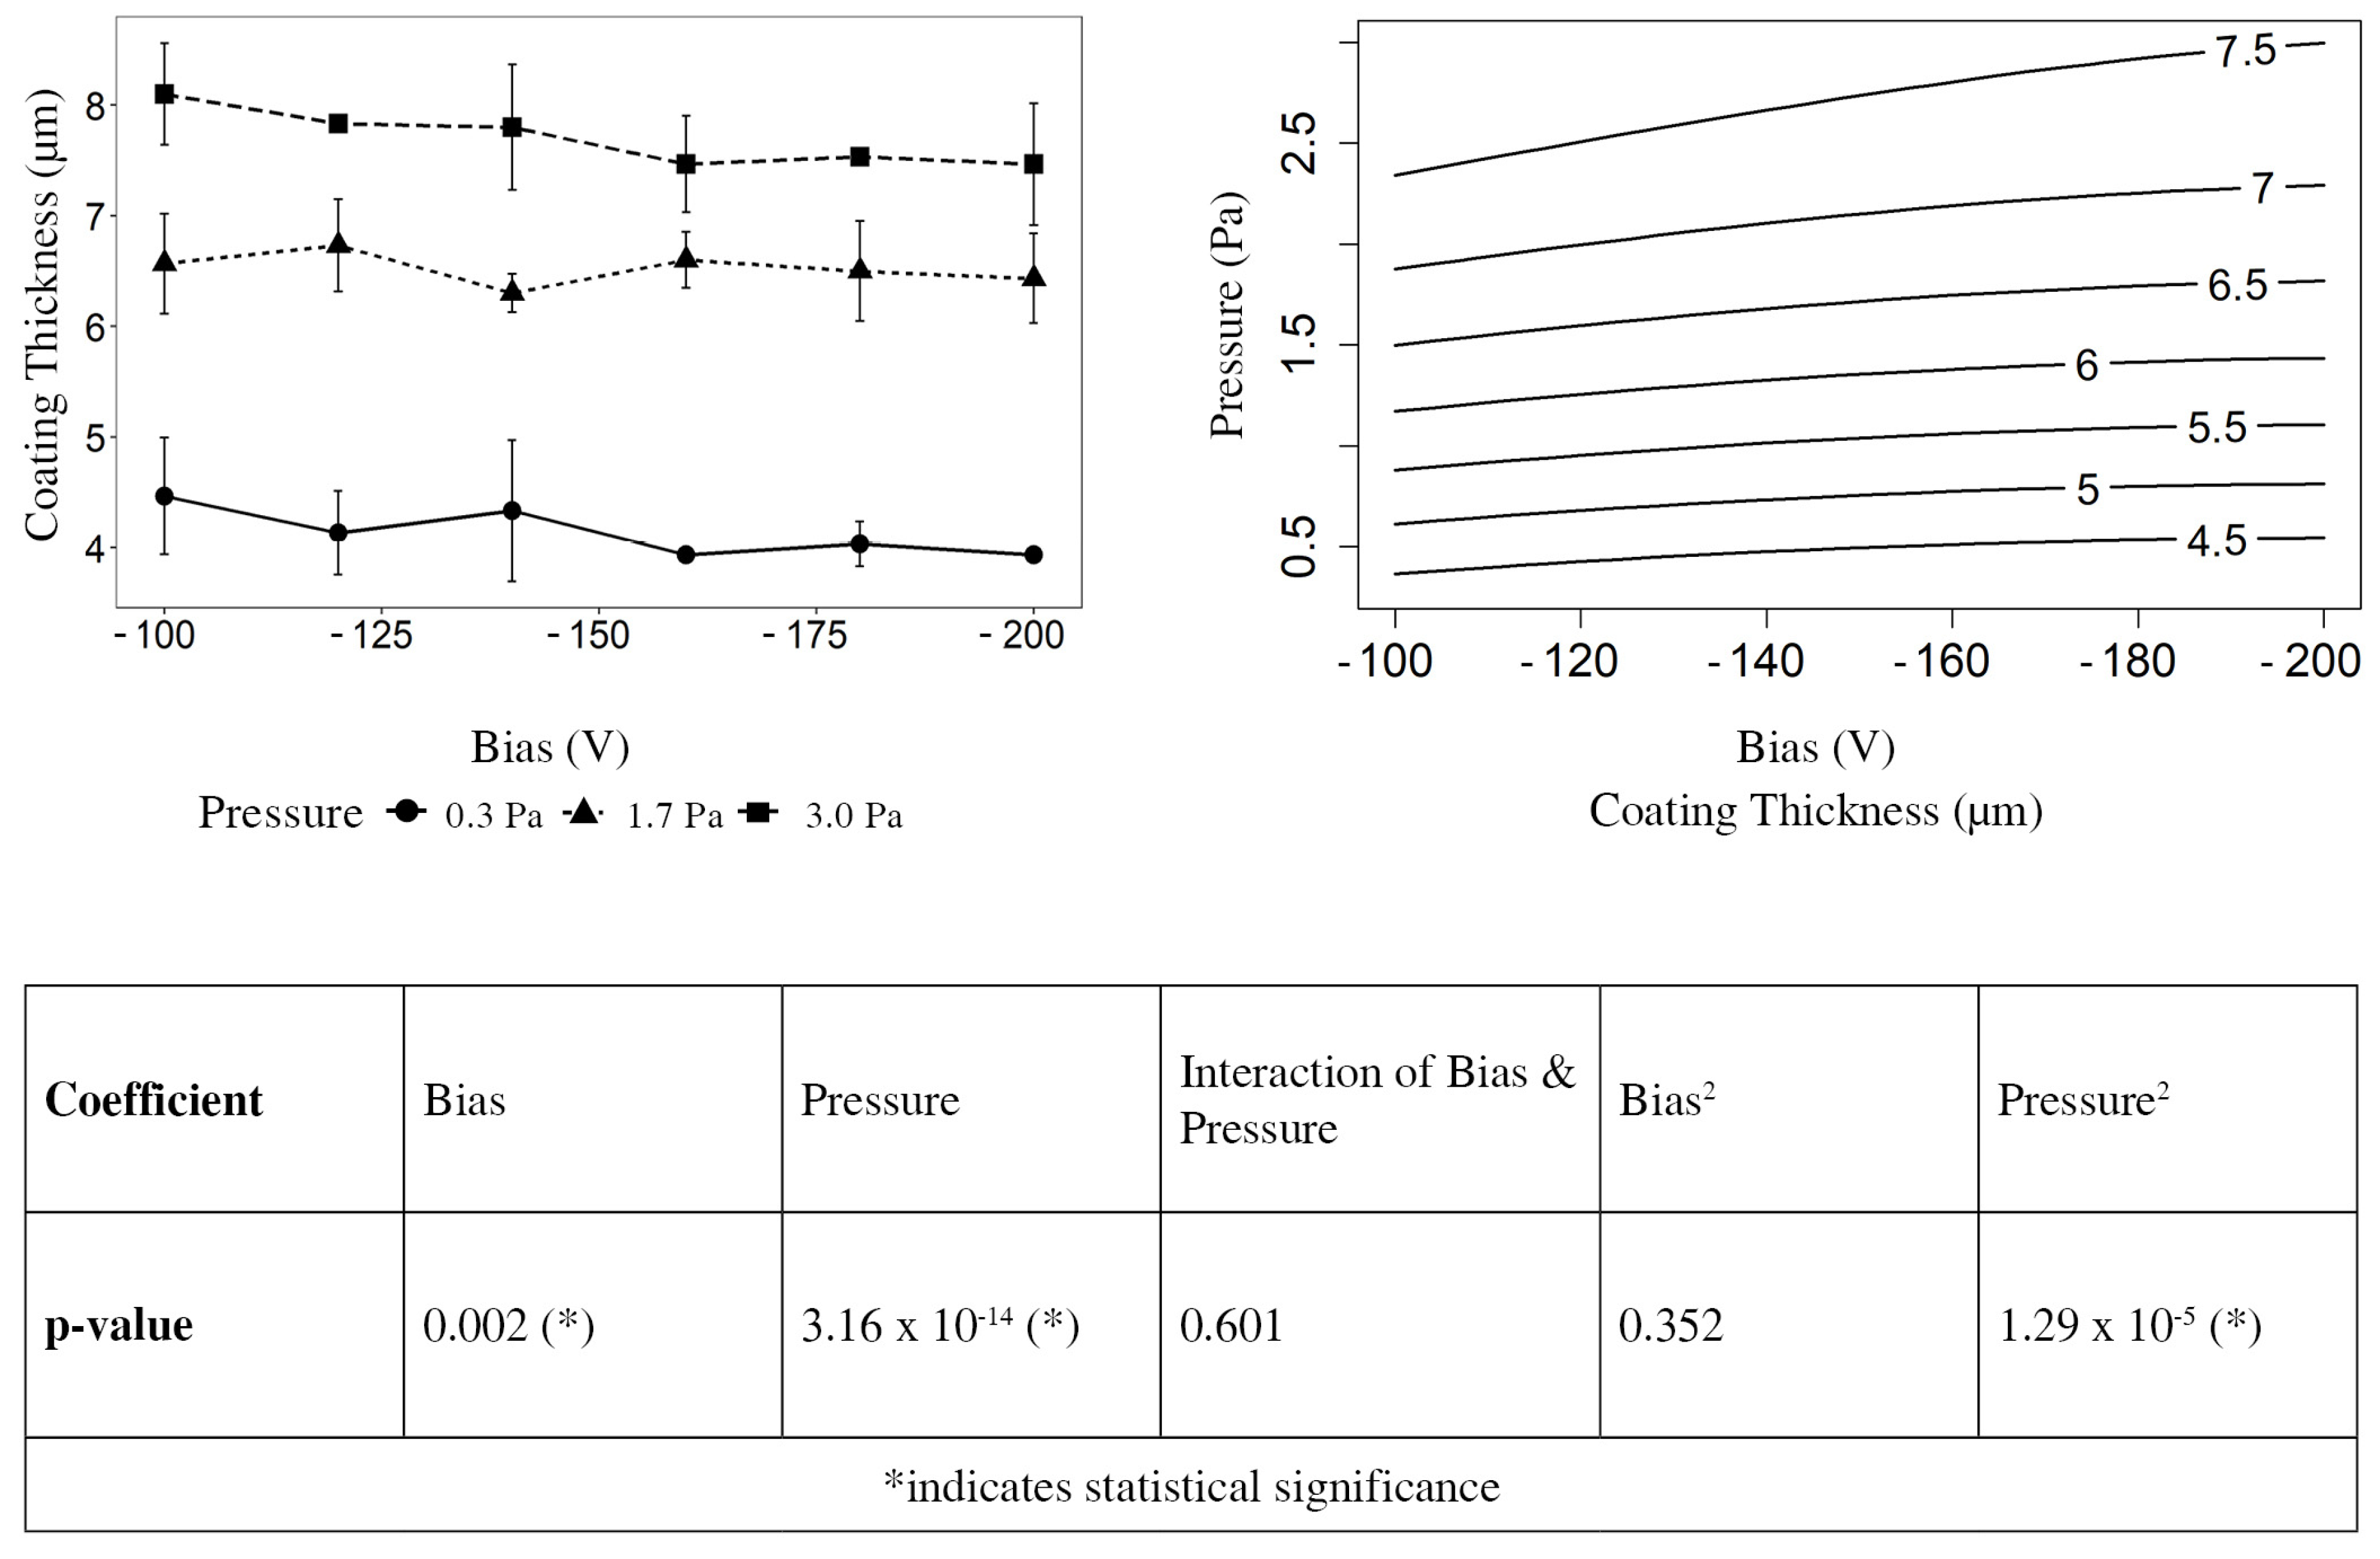
3.1. Coating Thickness
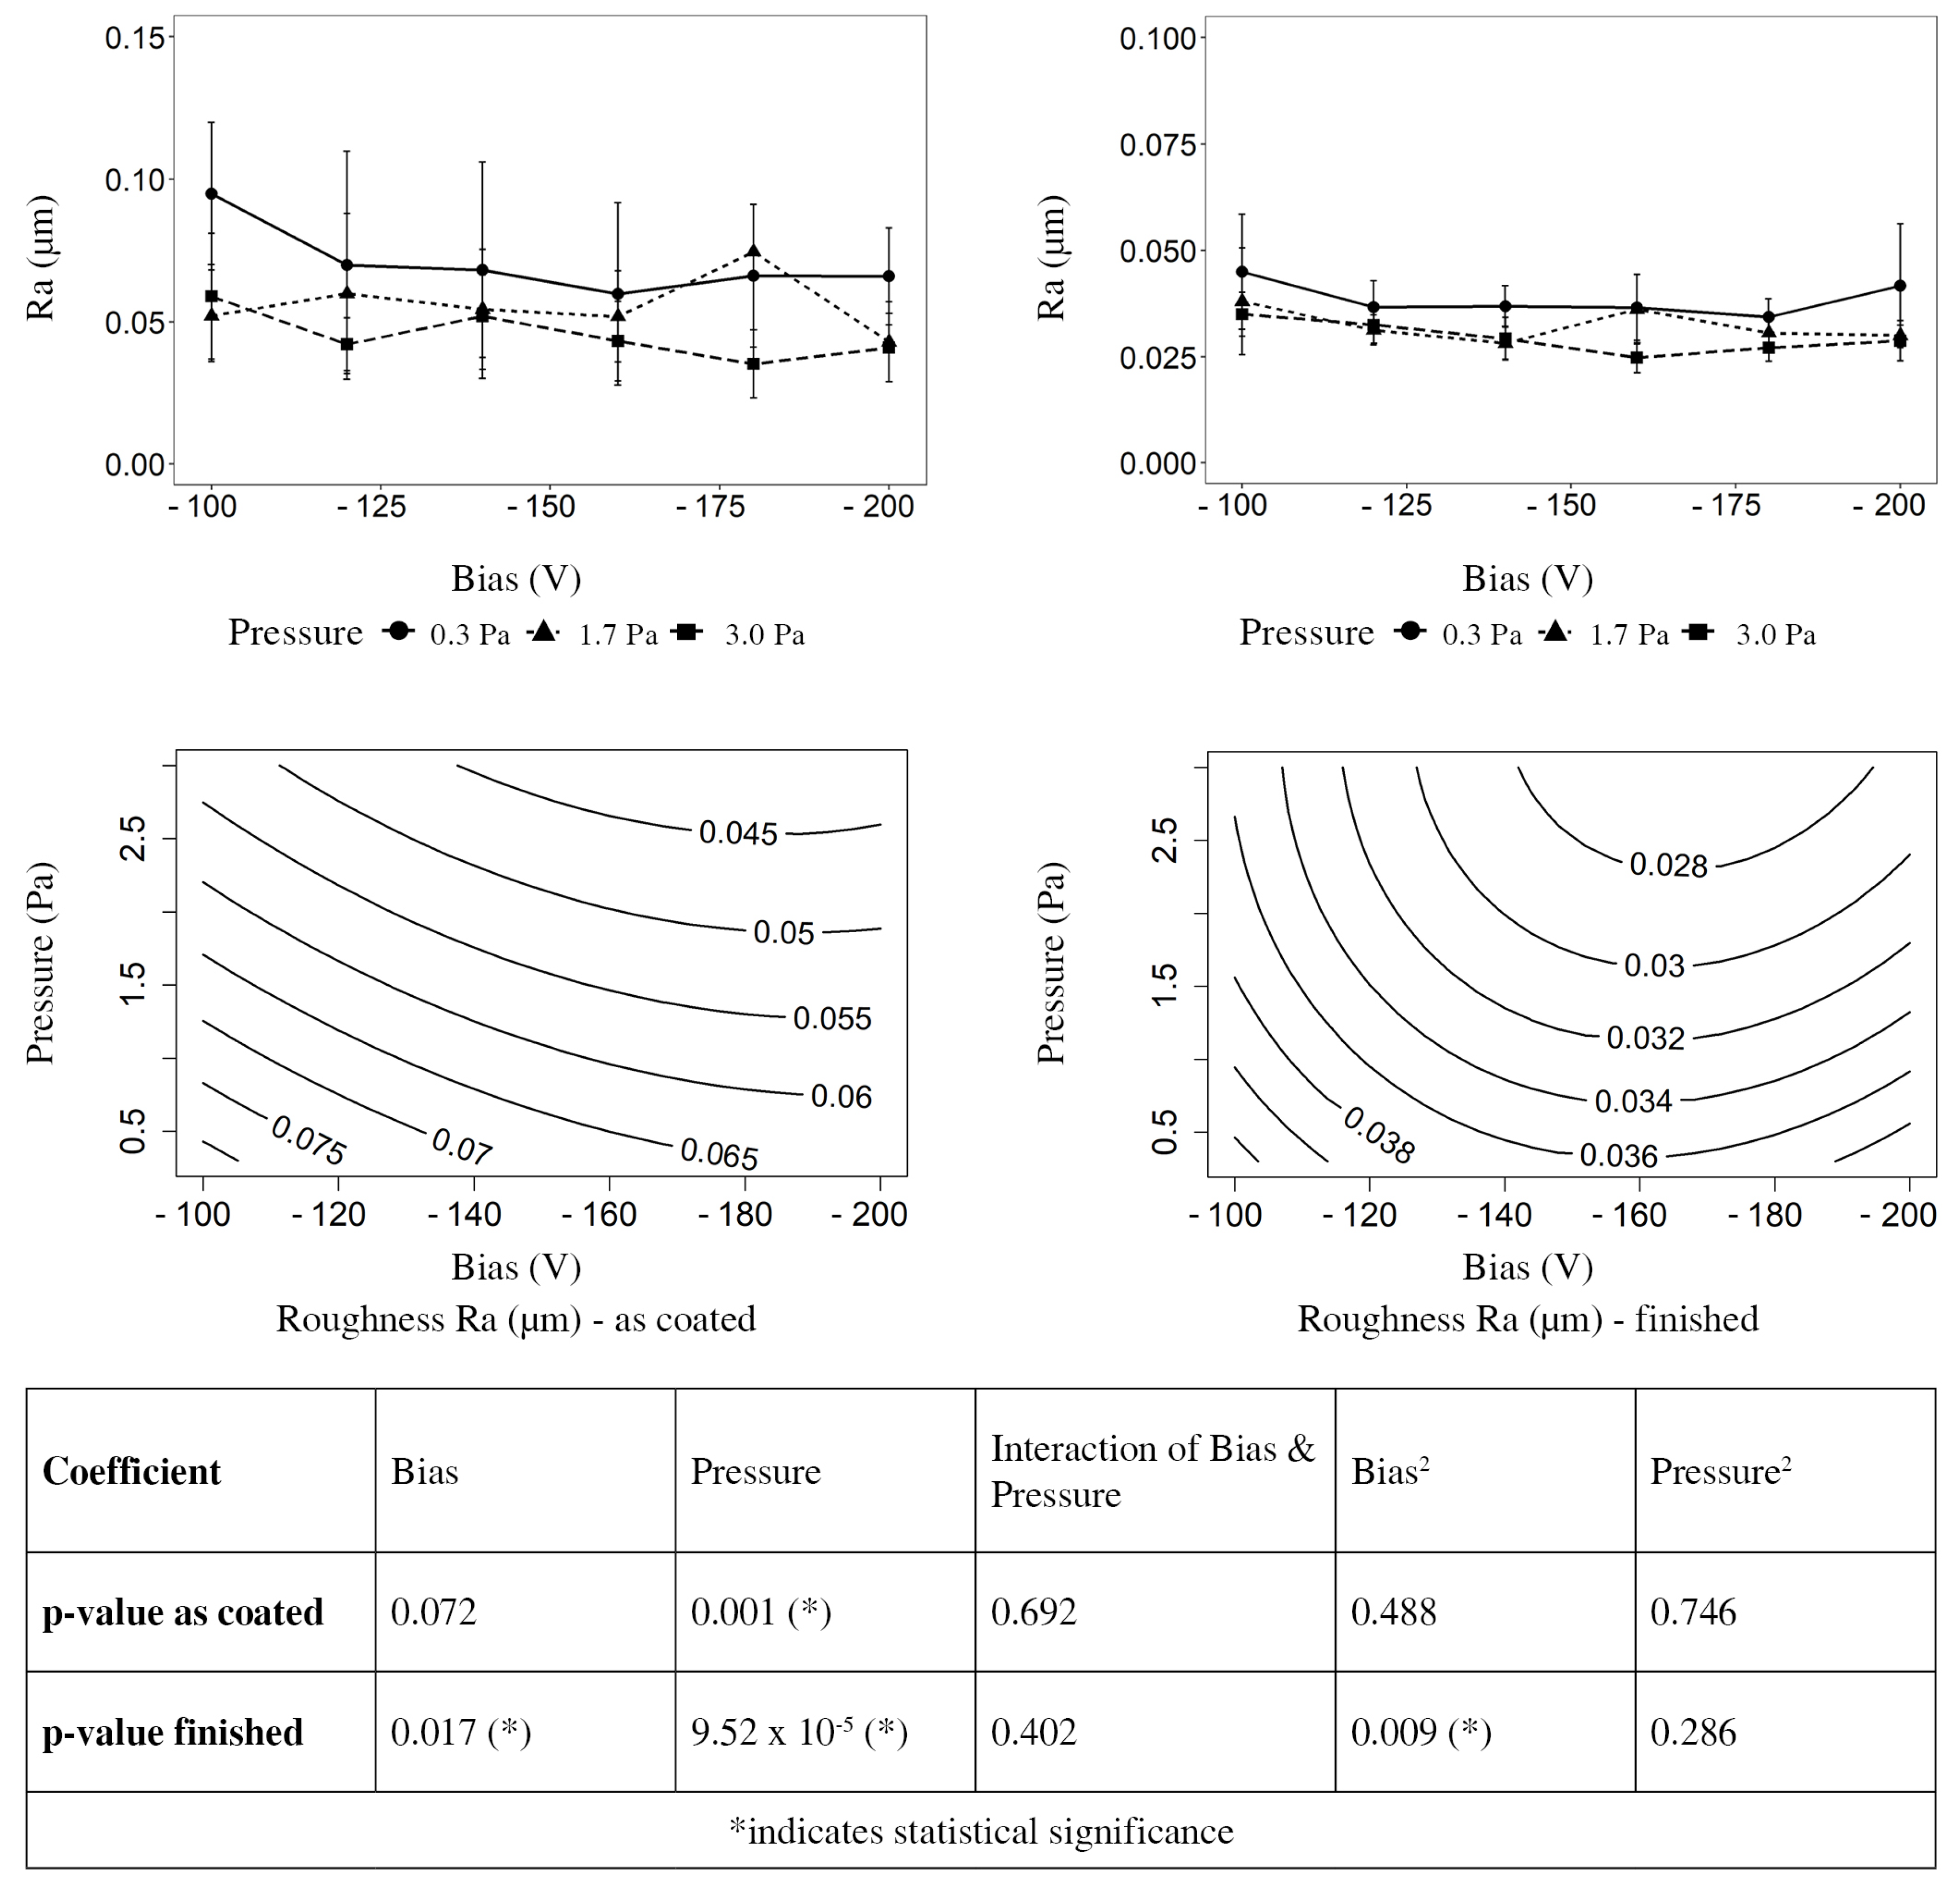
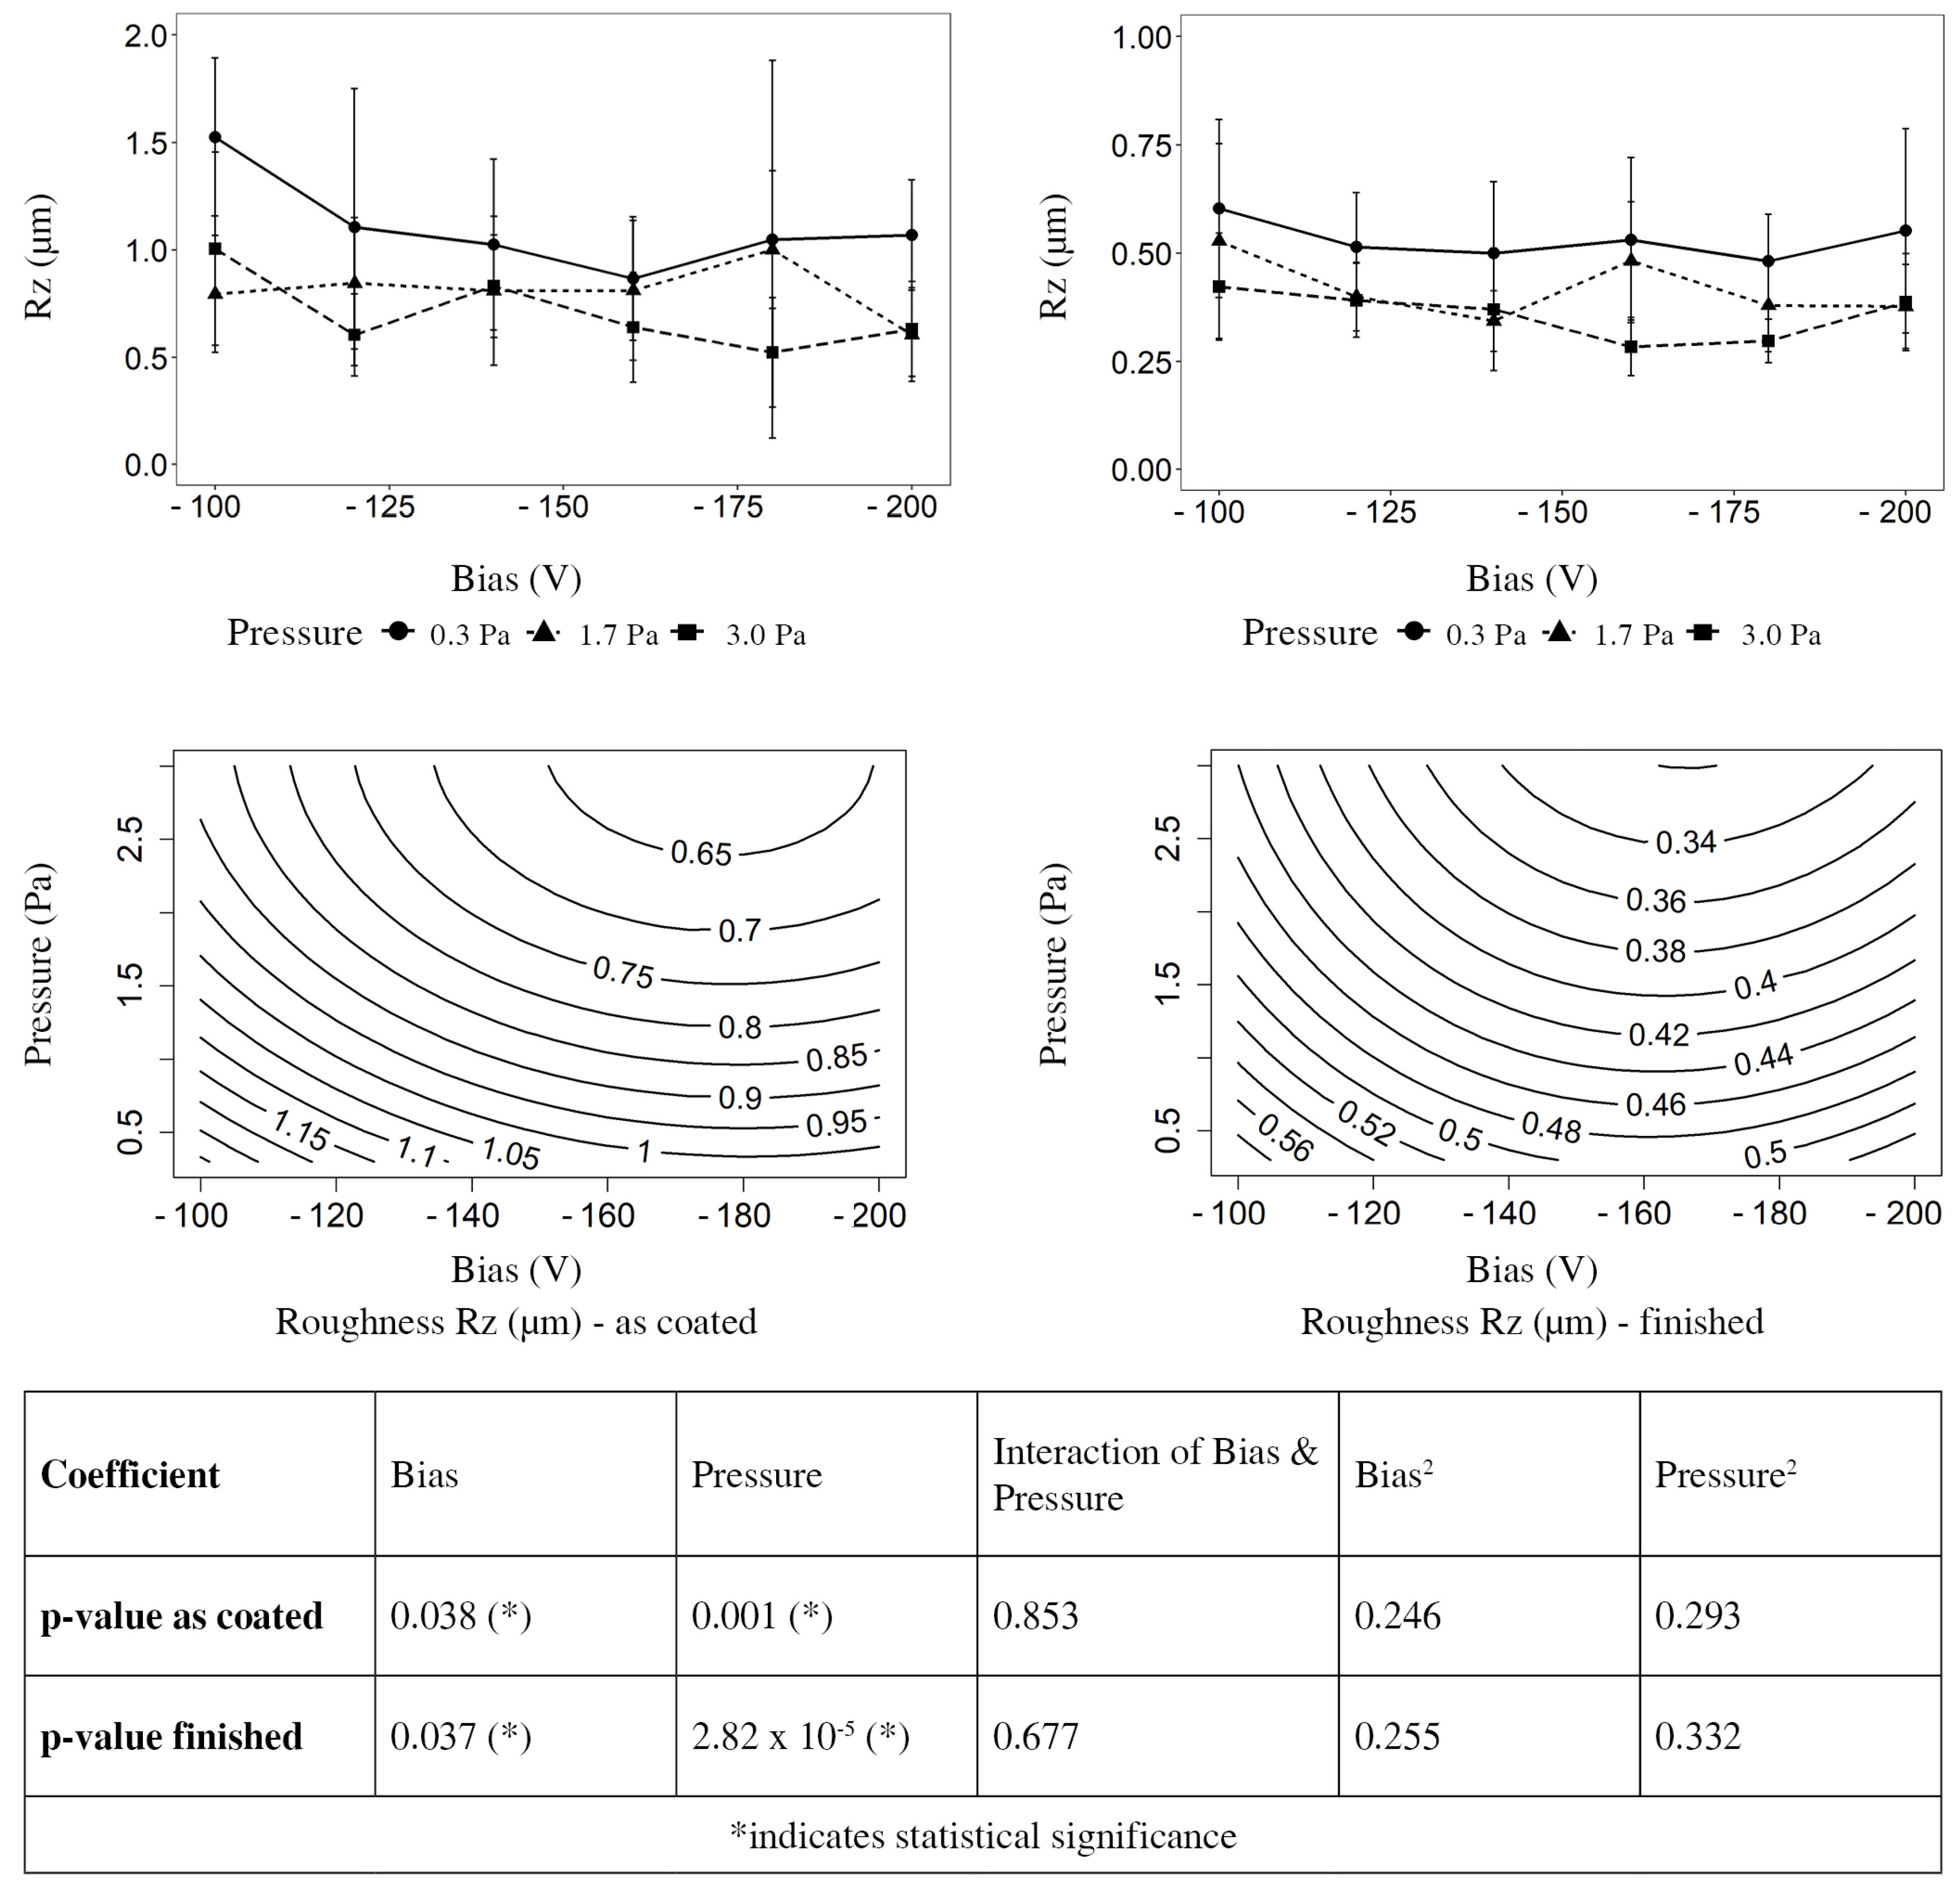
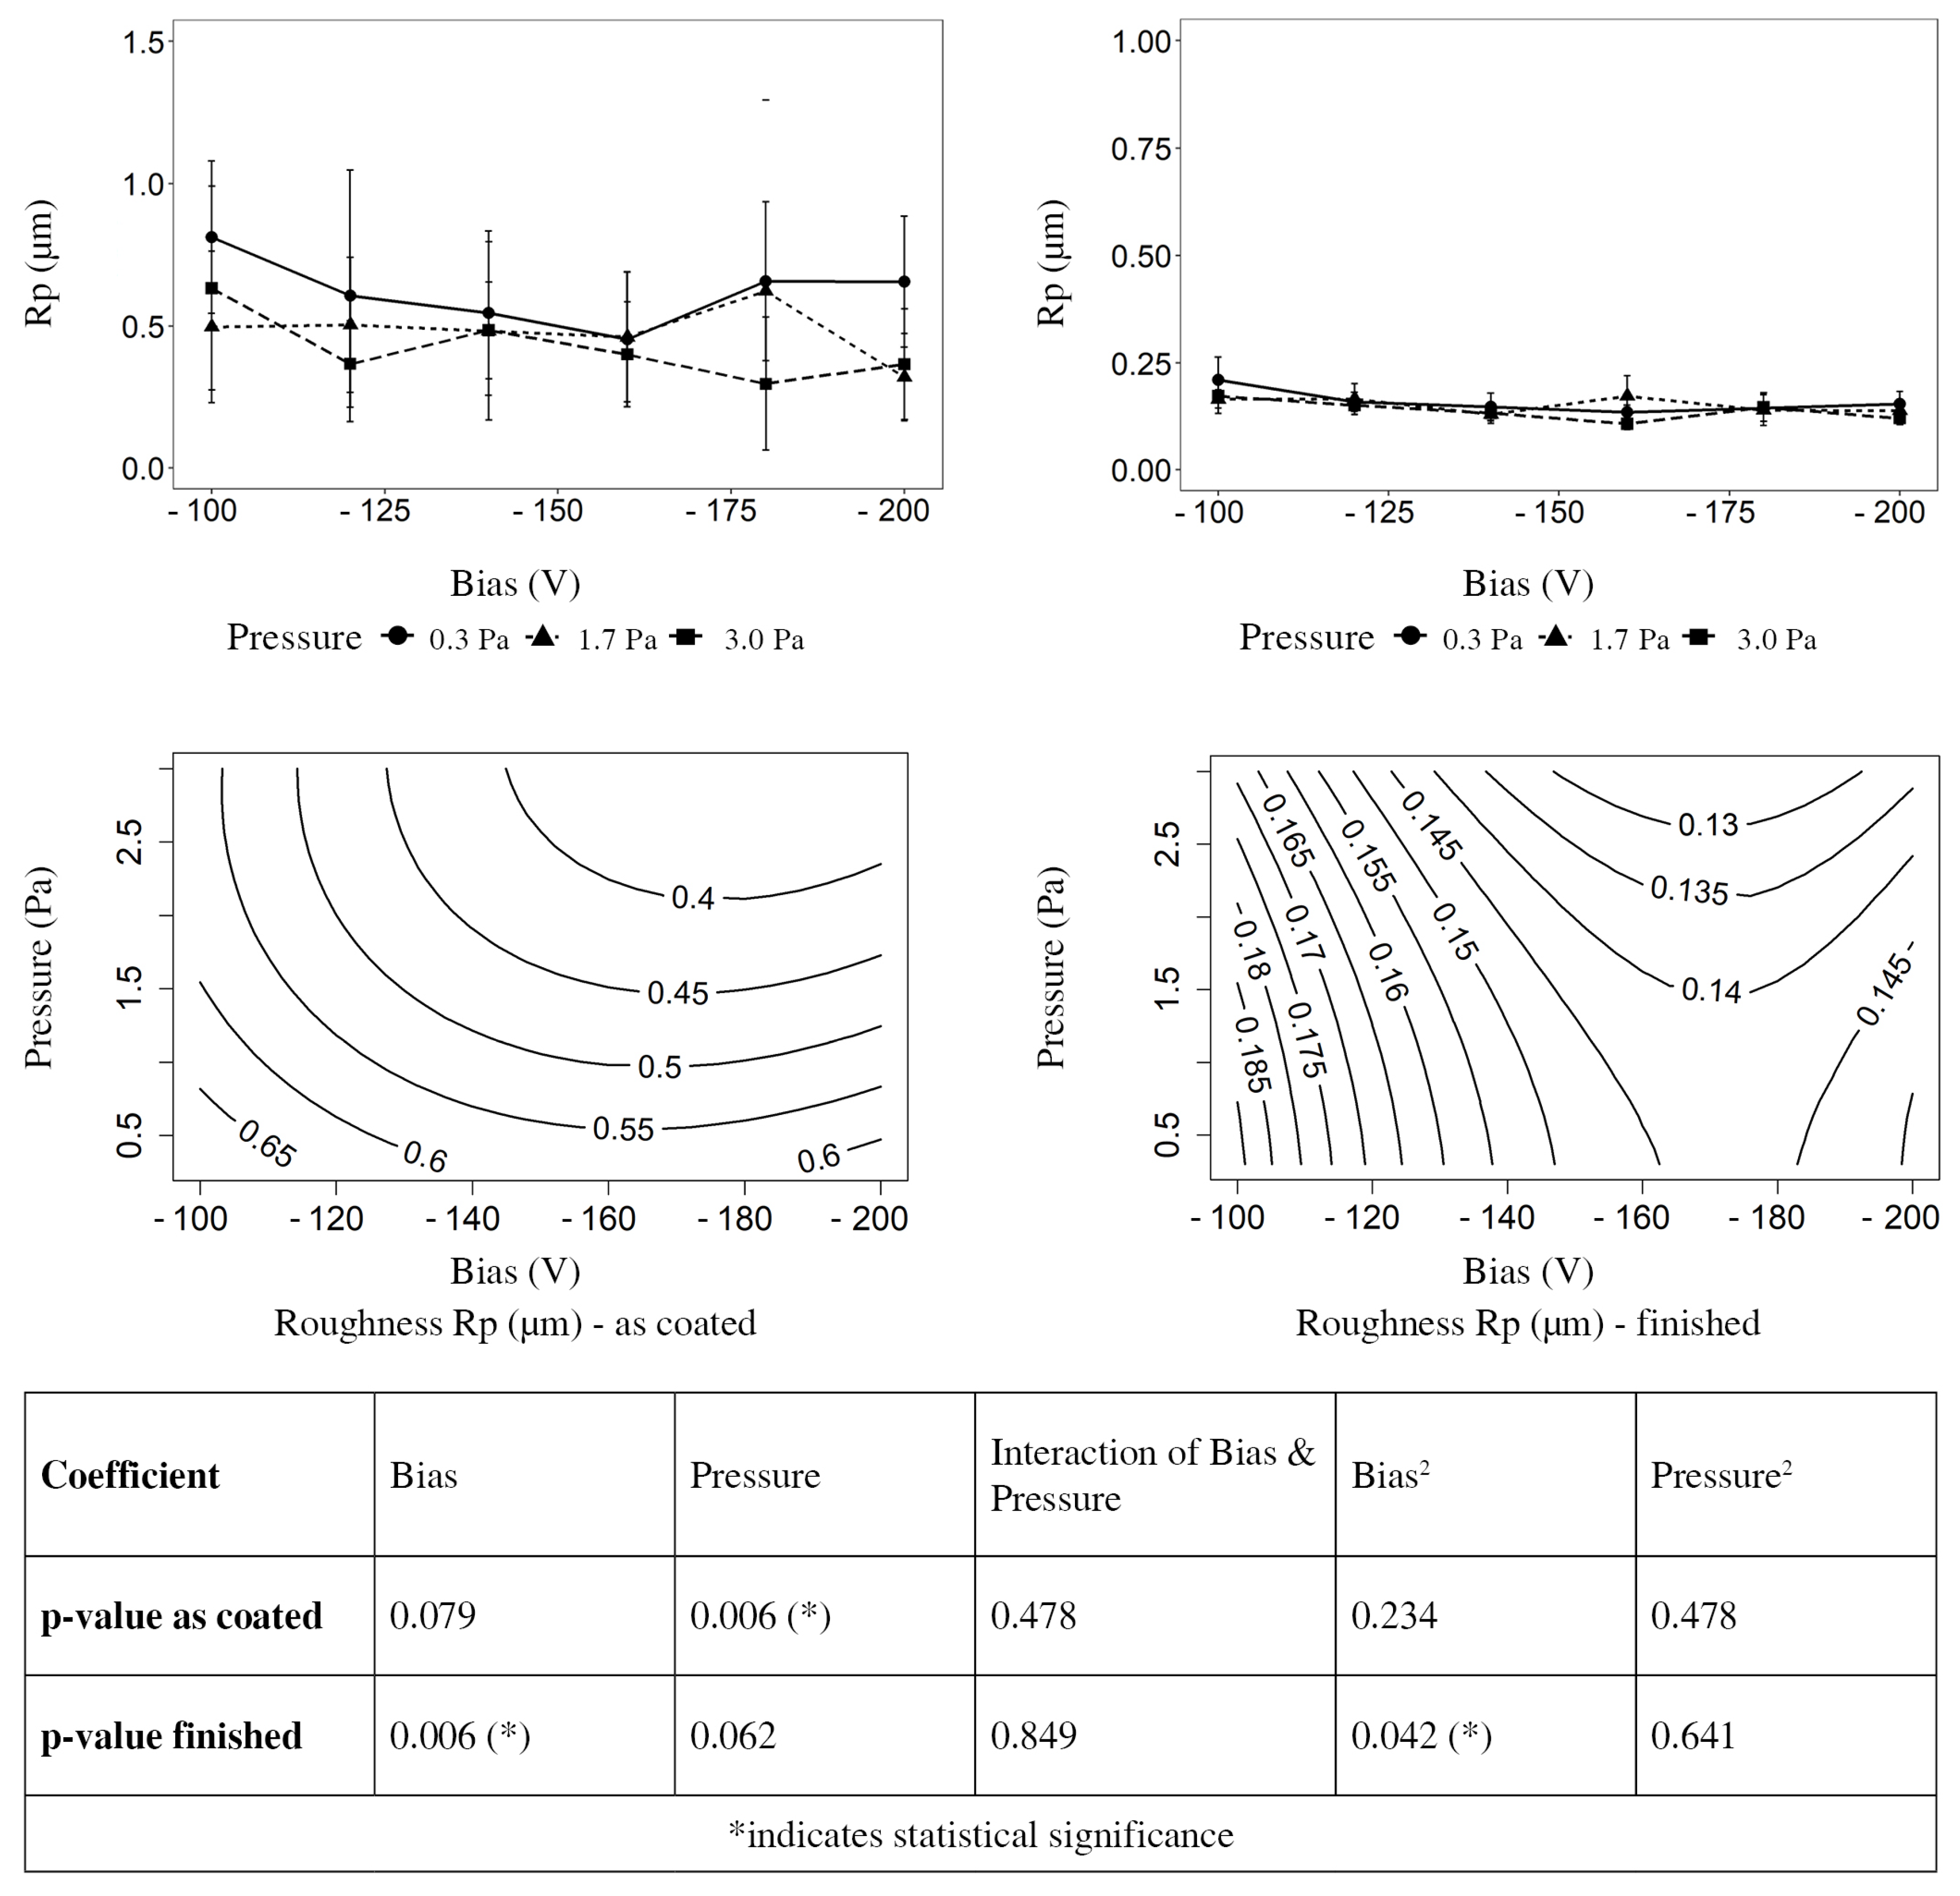
3.2. Roughness
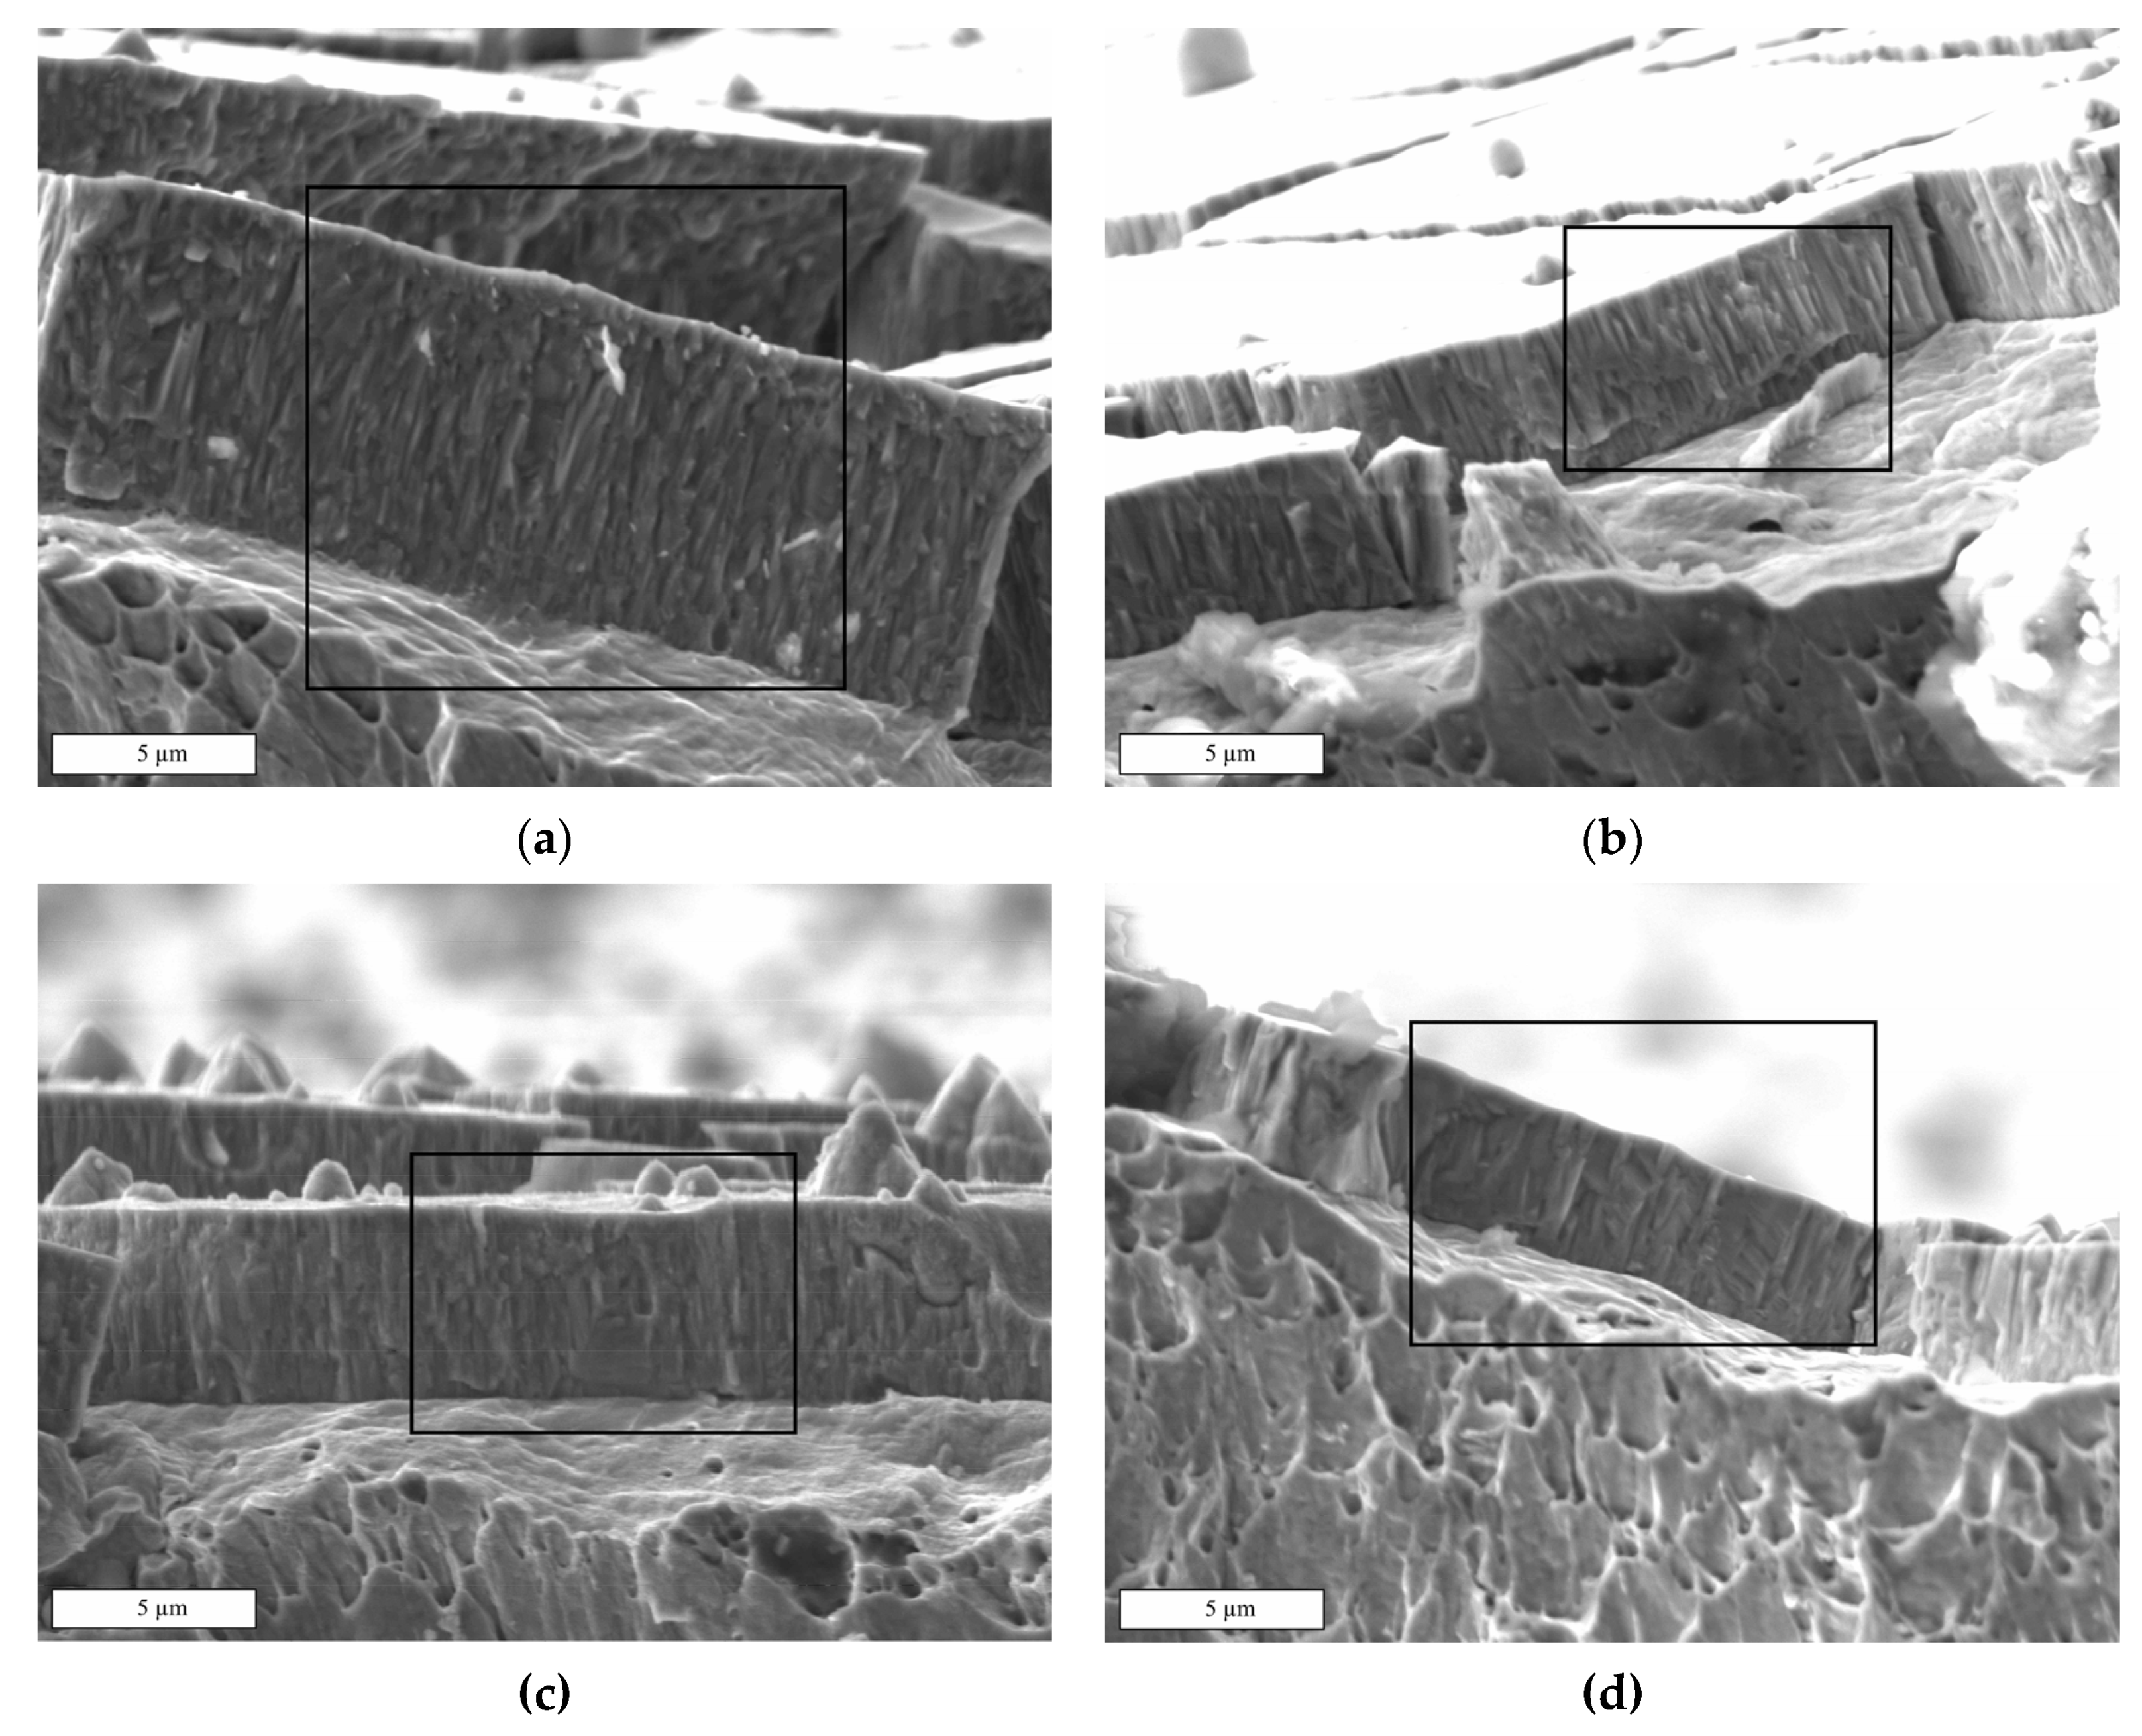
3.3. SEM
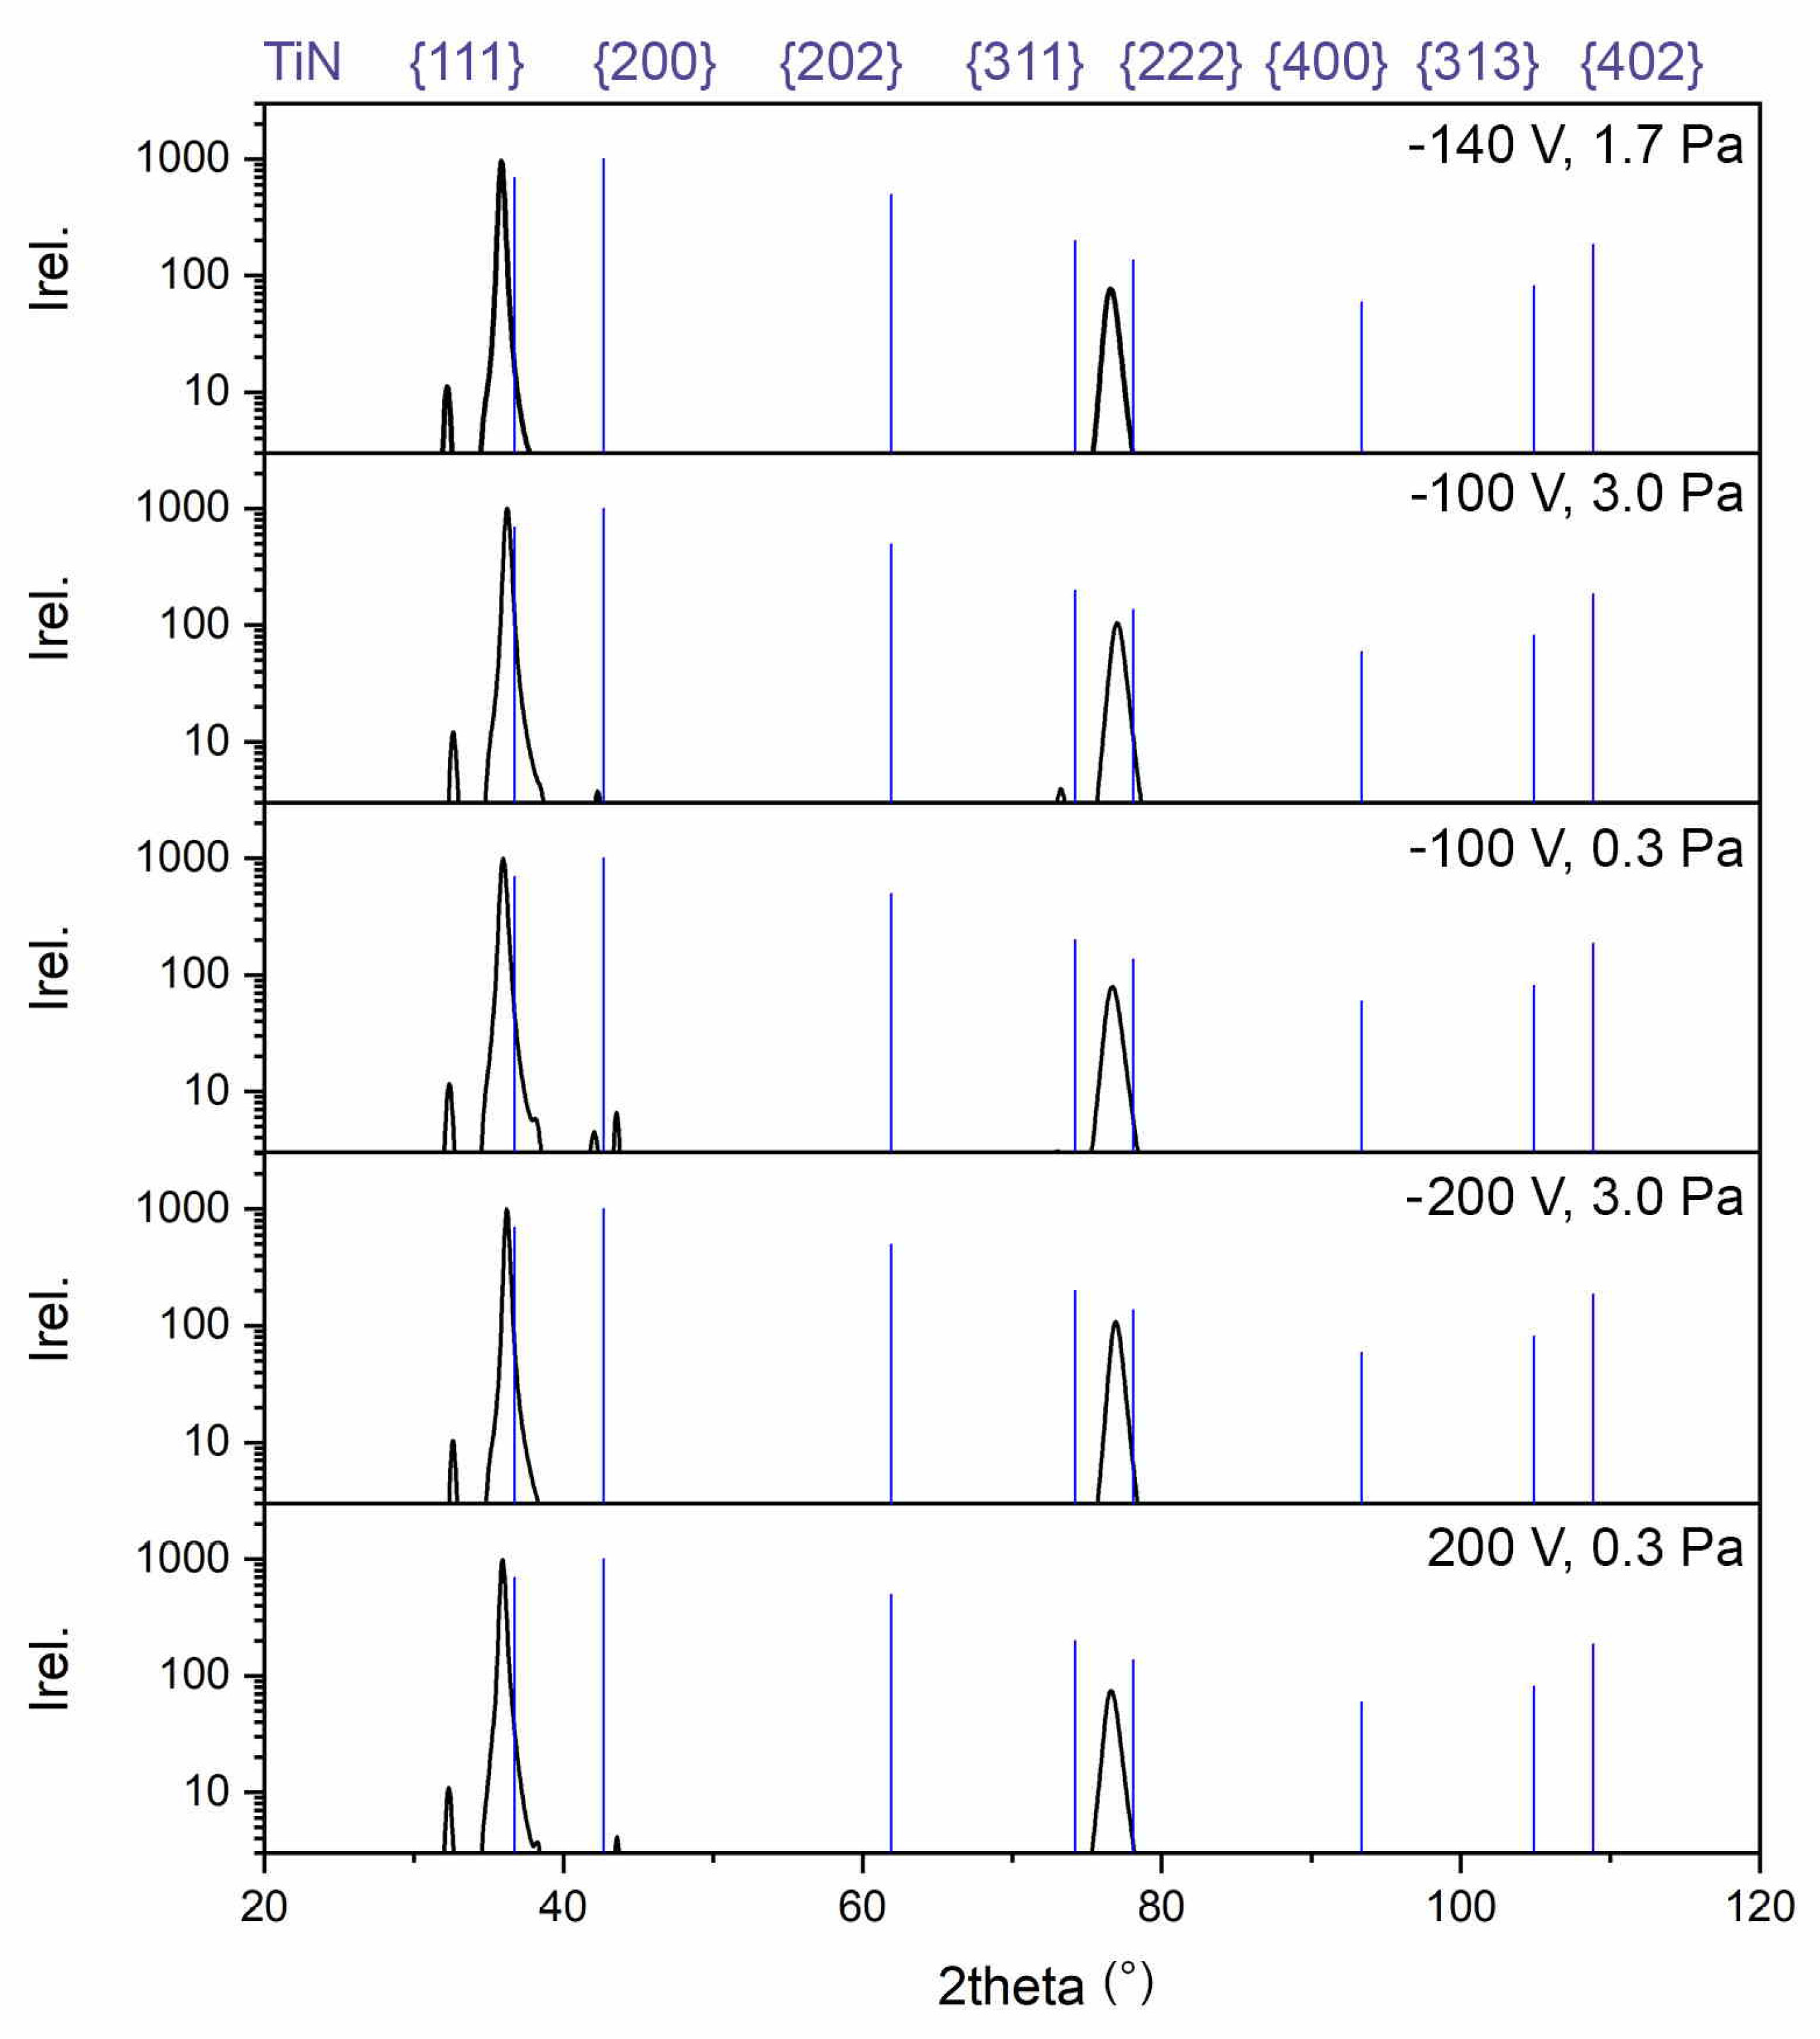
3.4. XRD Analysis
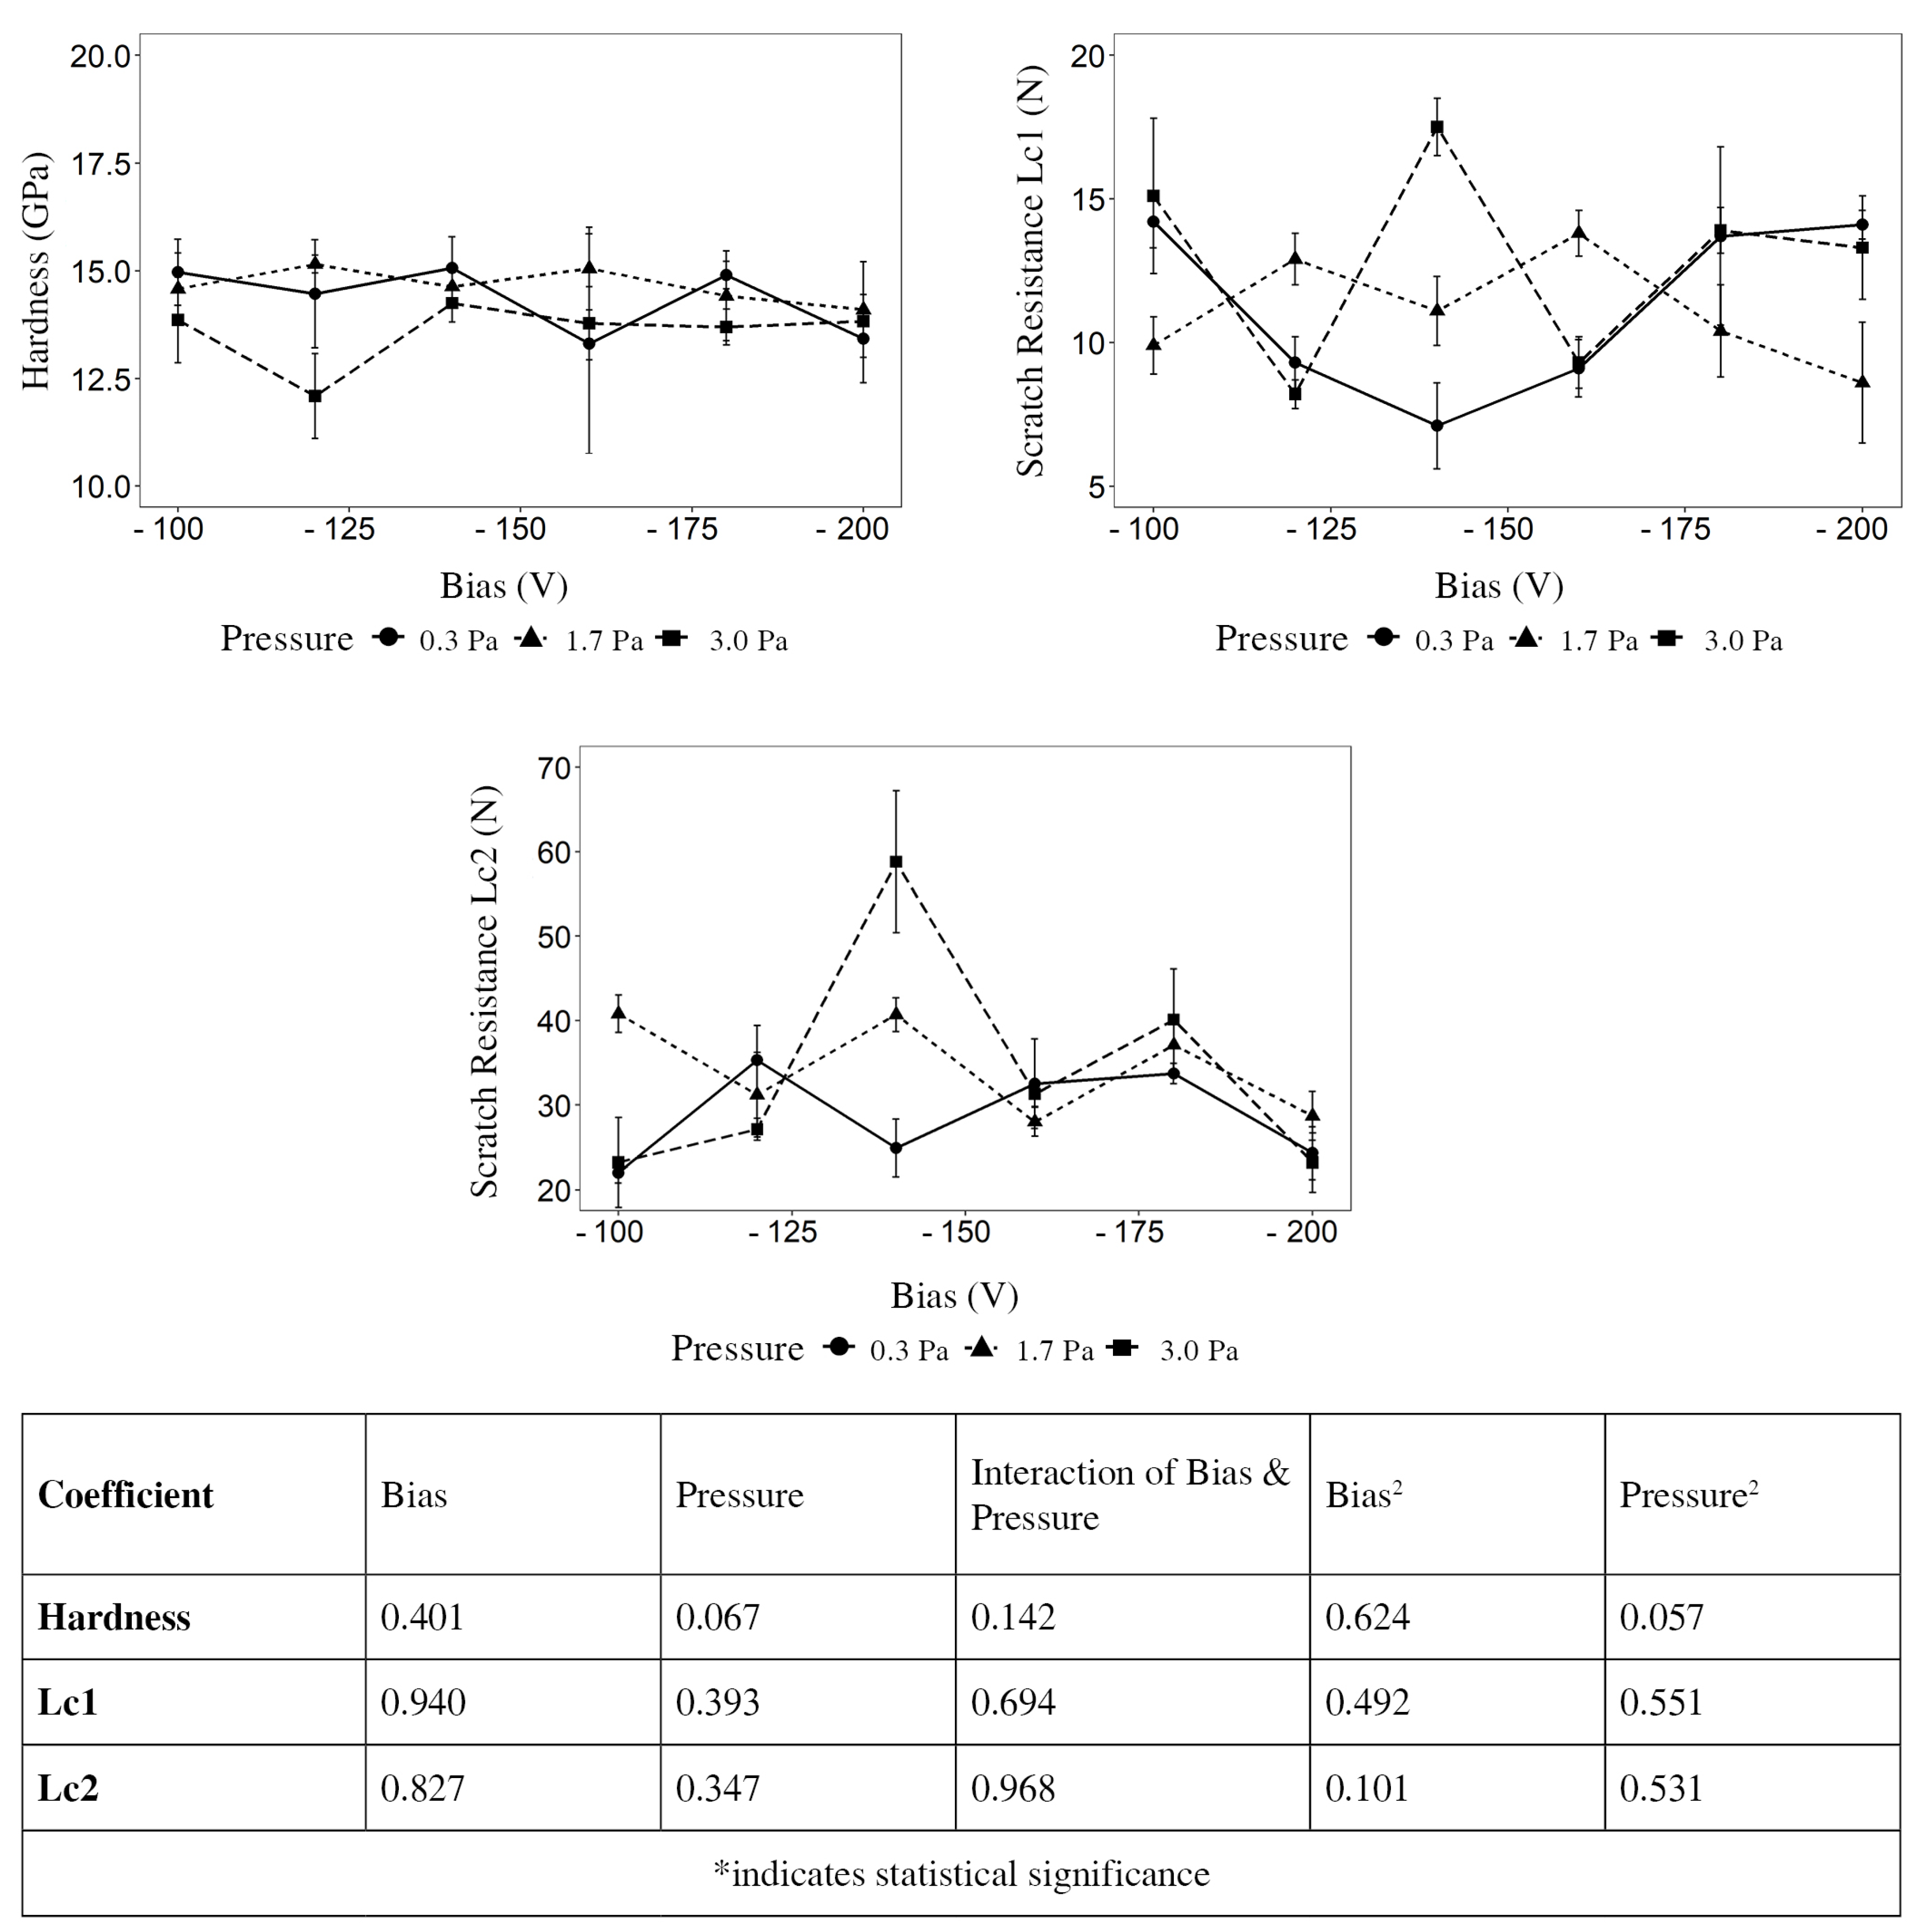
3.5. Hardness
3.6. Scratch Resistance
4. Discussion
4.1. Coating Thickness and Roughness
4.2. Structure
4.3. Hardness and Scratch Test
5. Conclusions
- The nitrogen pressure and the substrate bias of the arc evaporation process show a significant impact on the coating properties of TiNbN.
- The coating thickness is affected by the bias and the pressure, while the nitrogen pressure is the predominant factor.
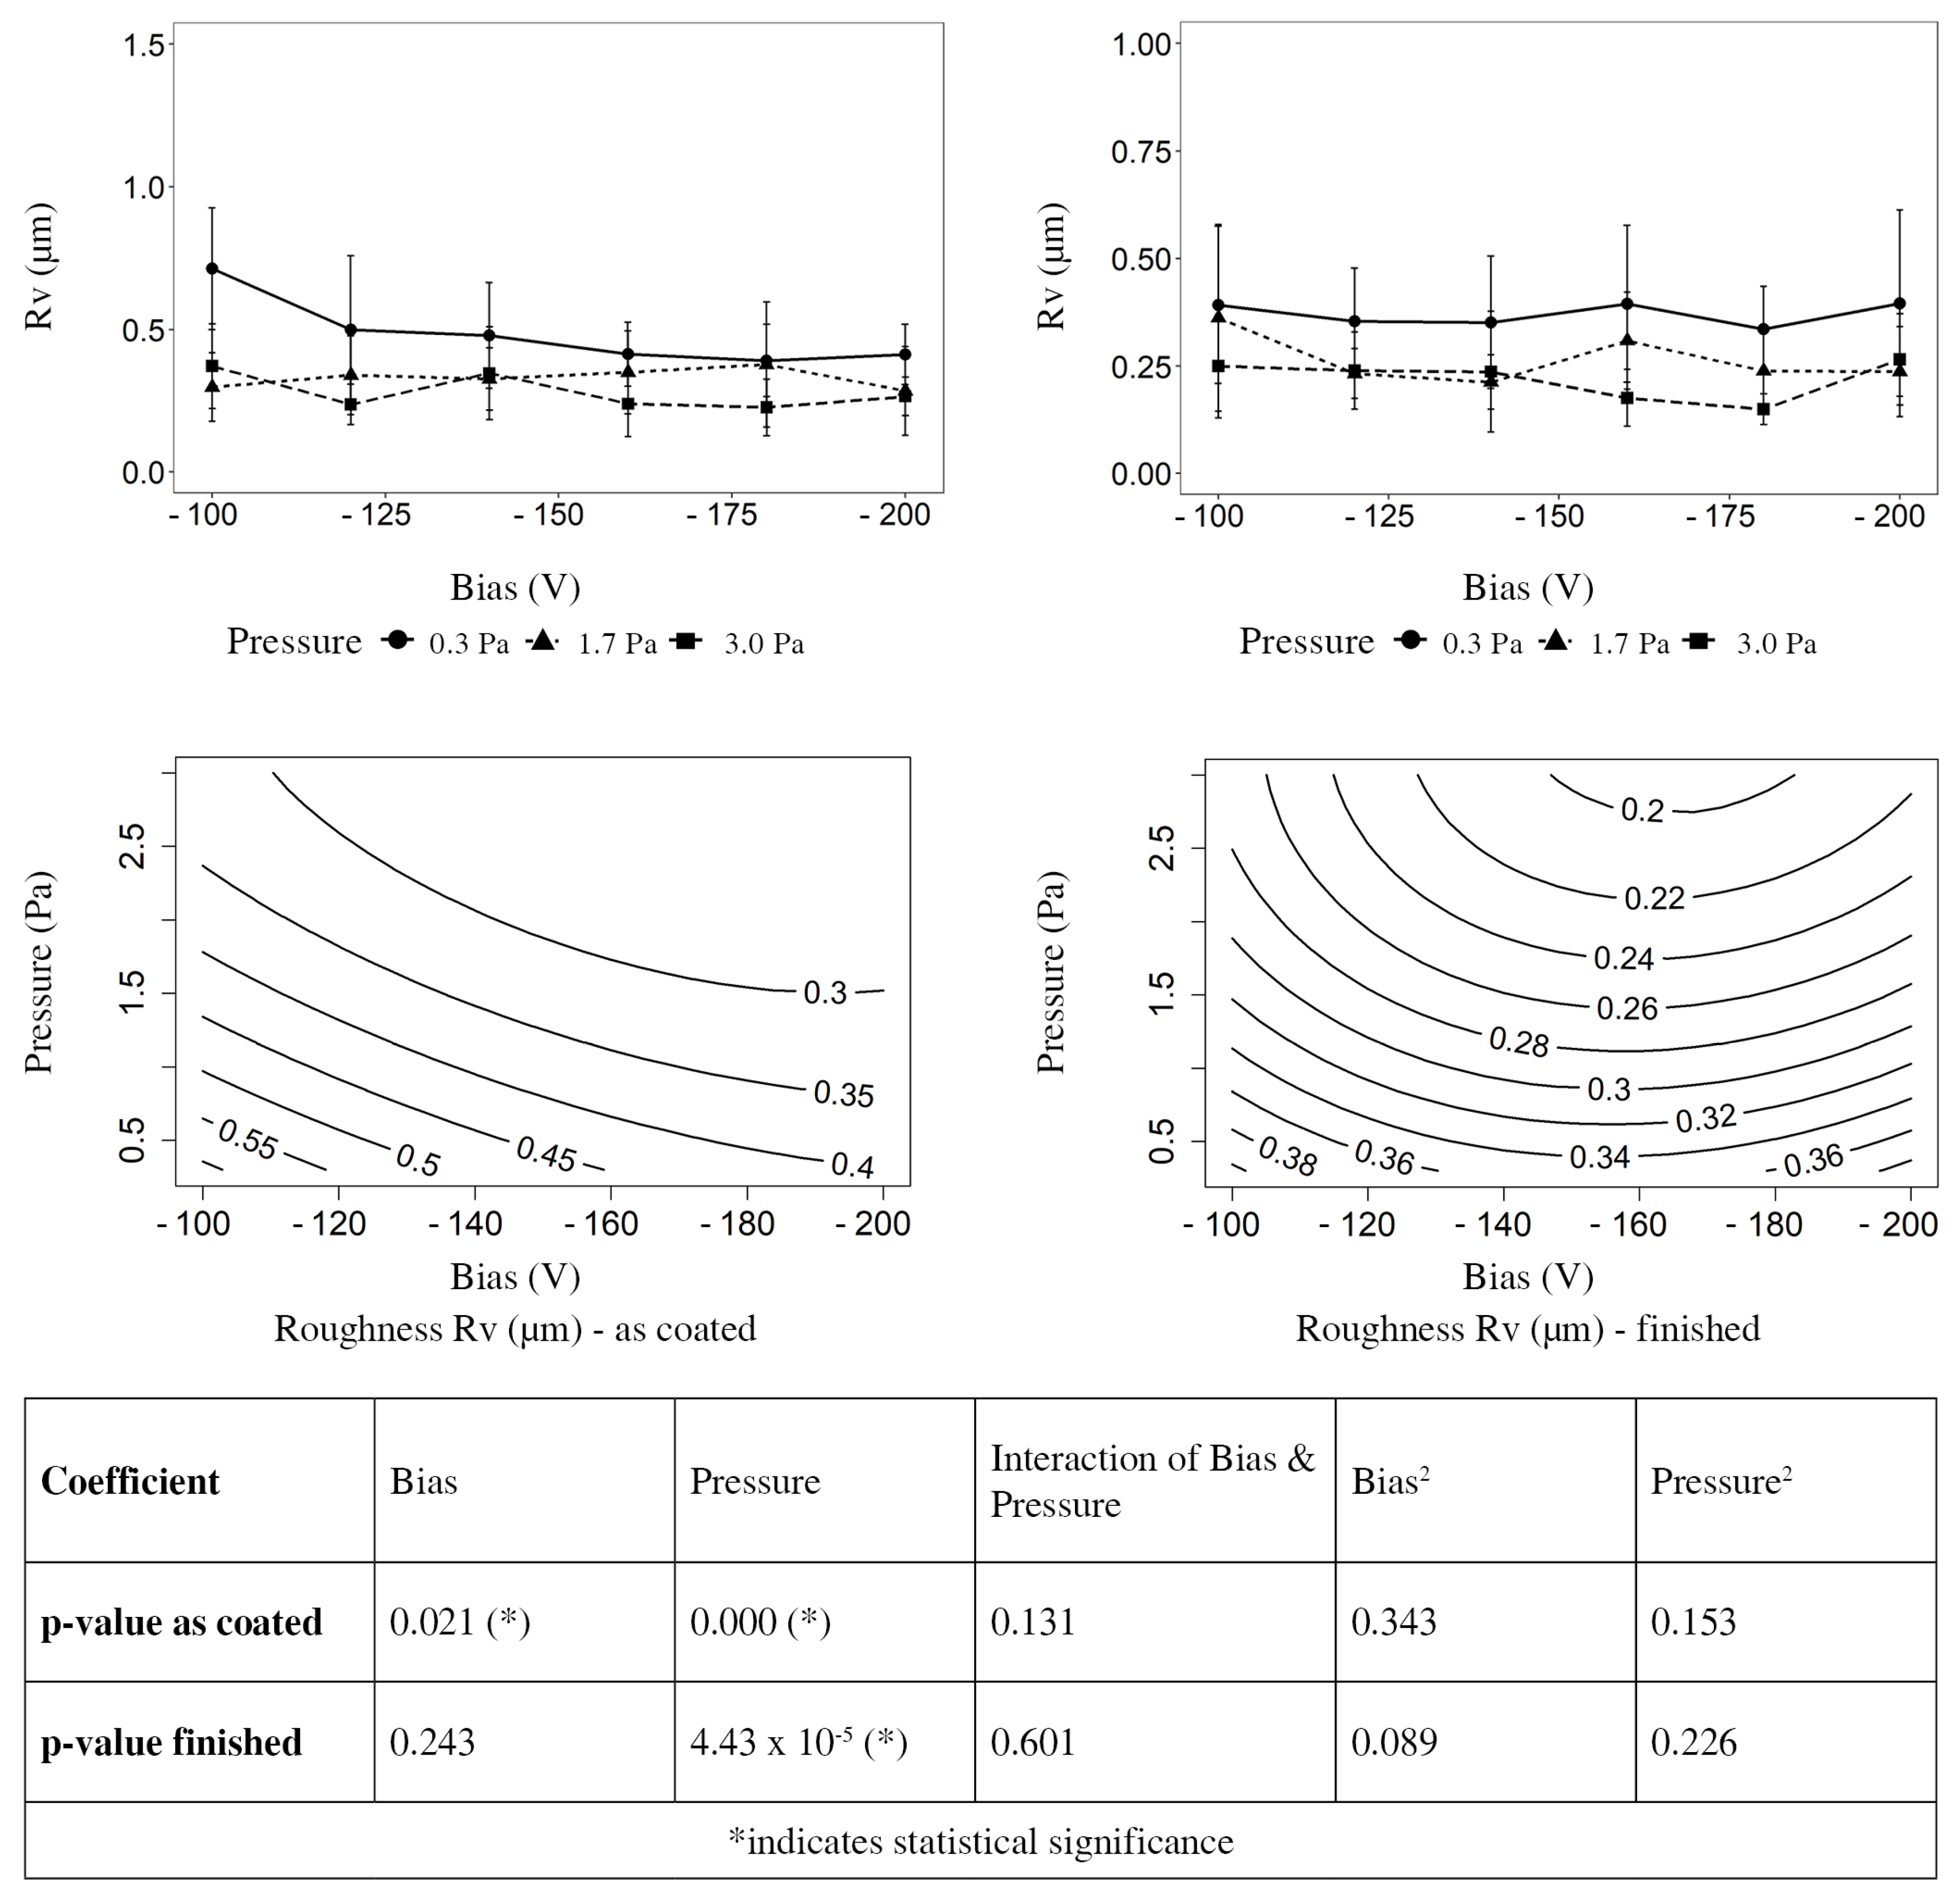
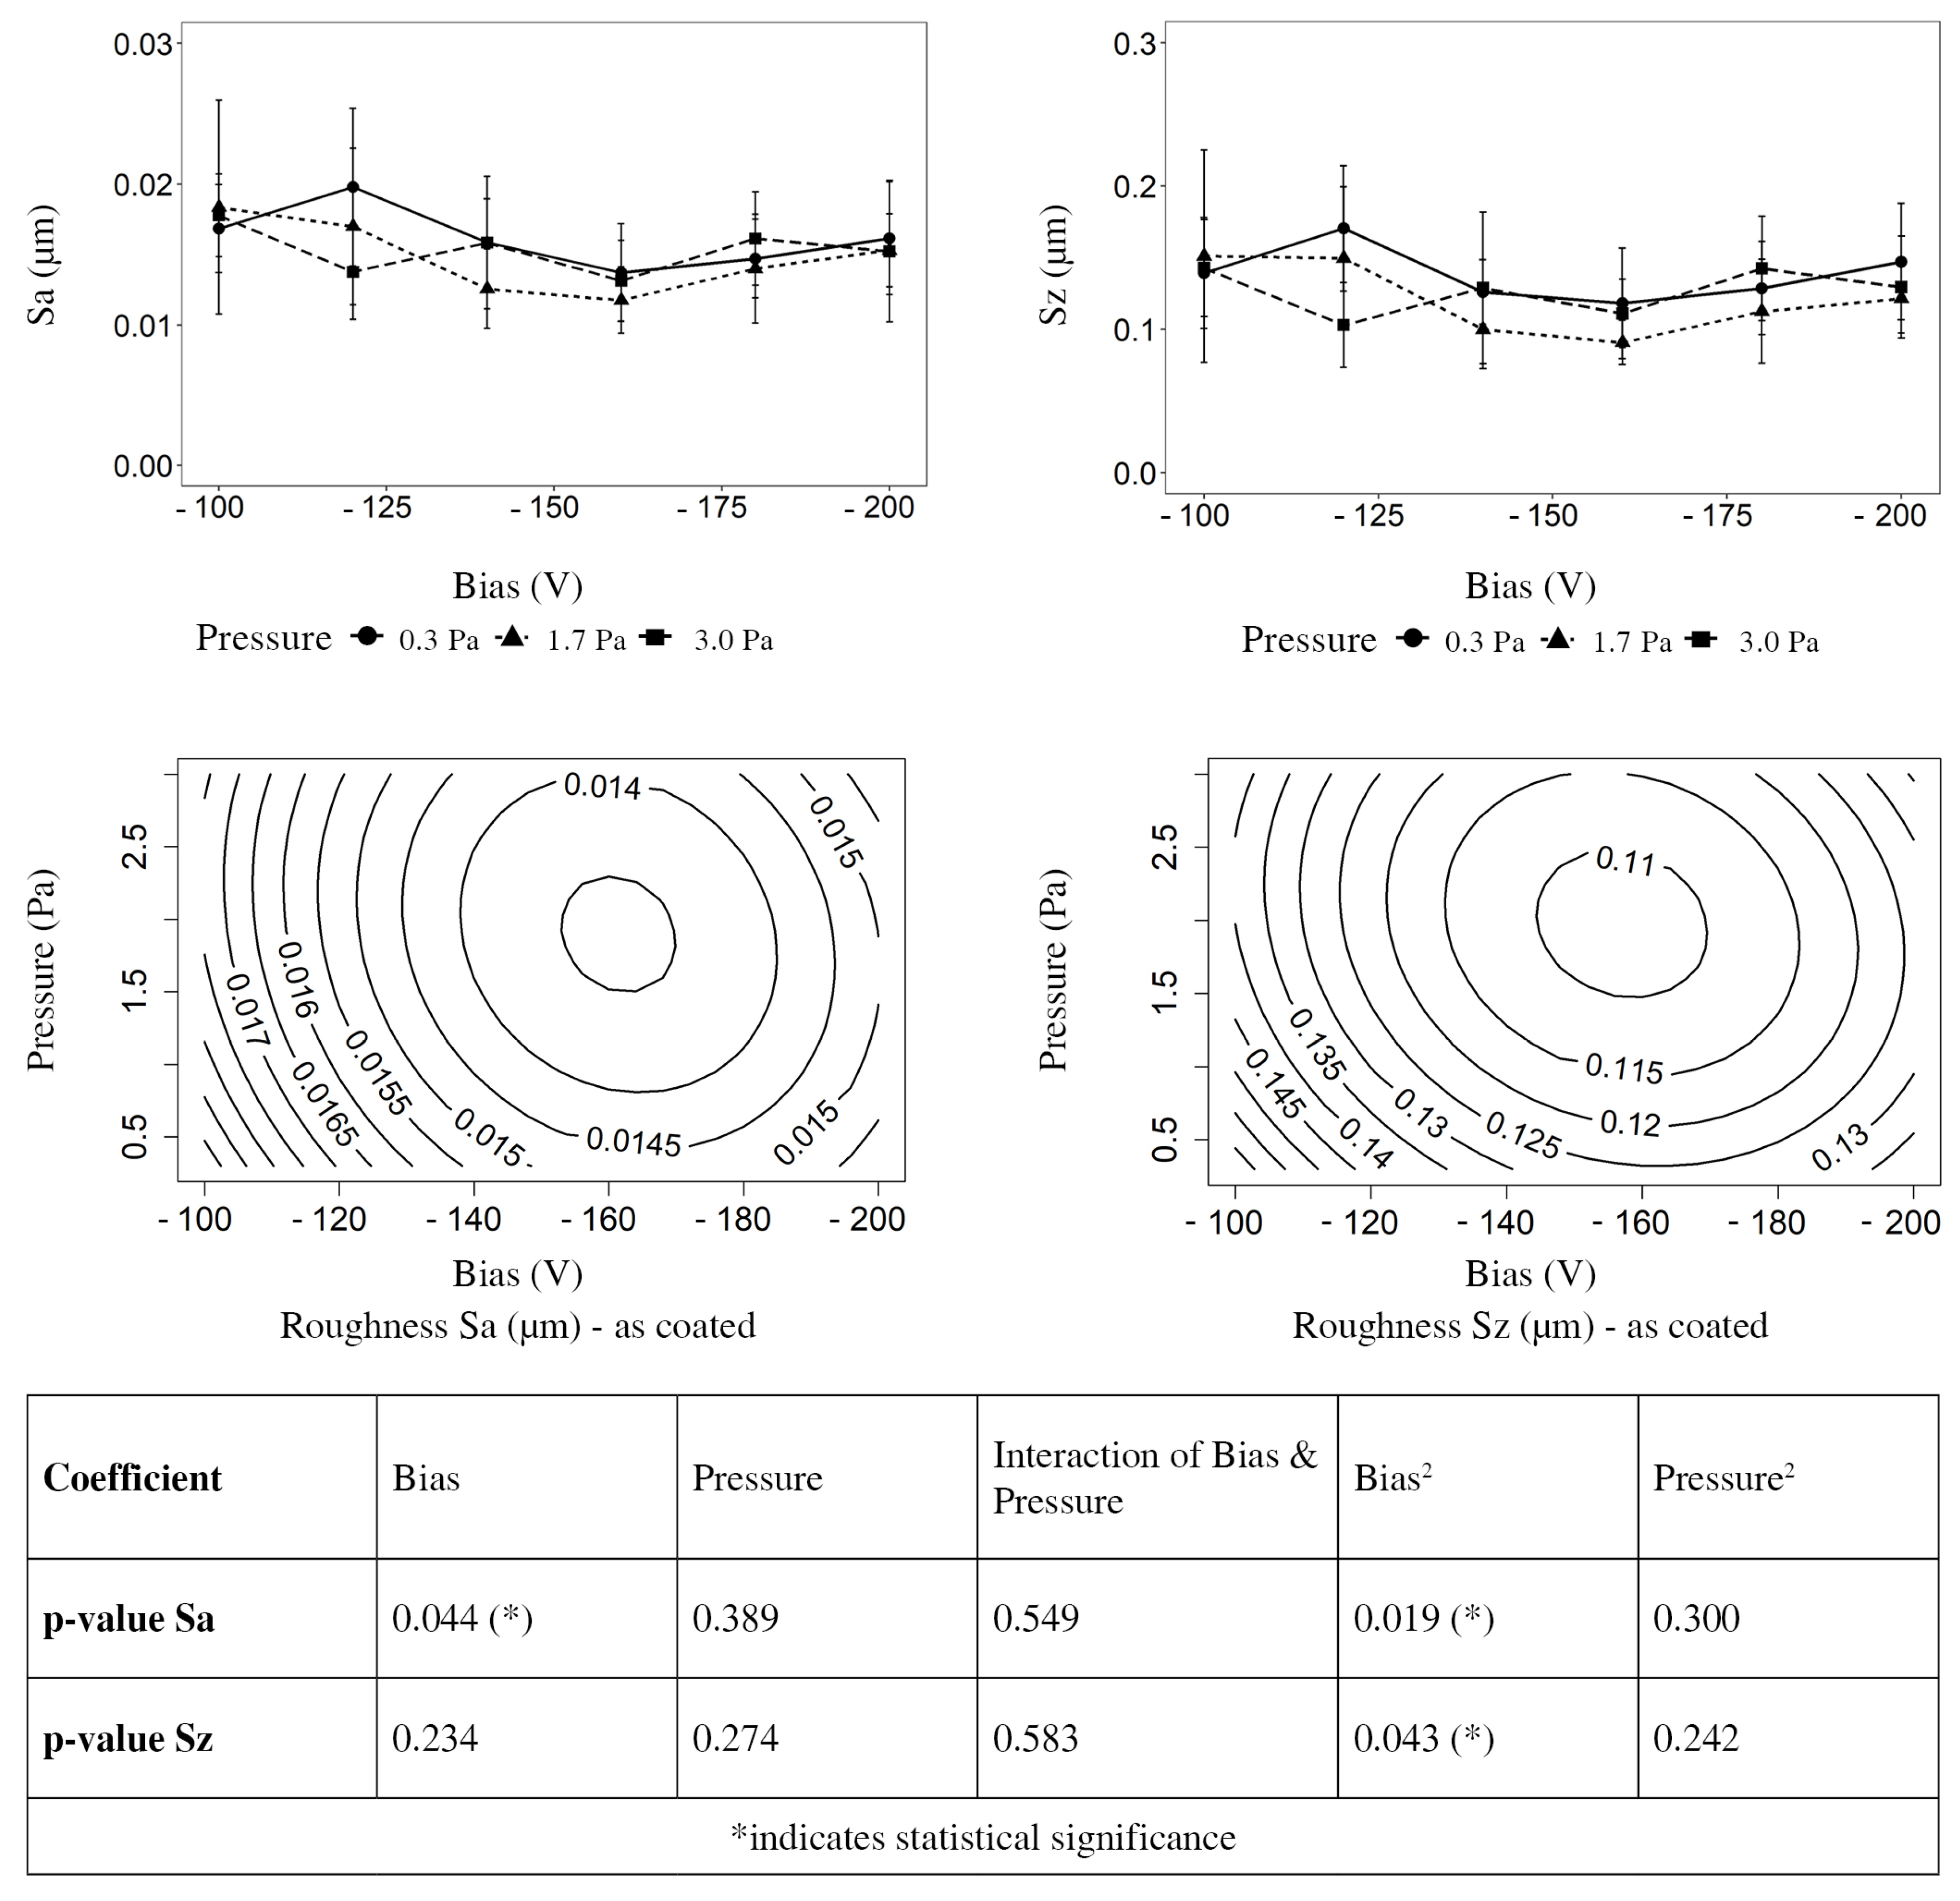
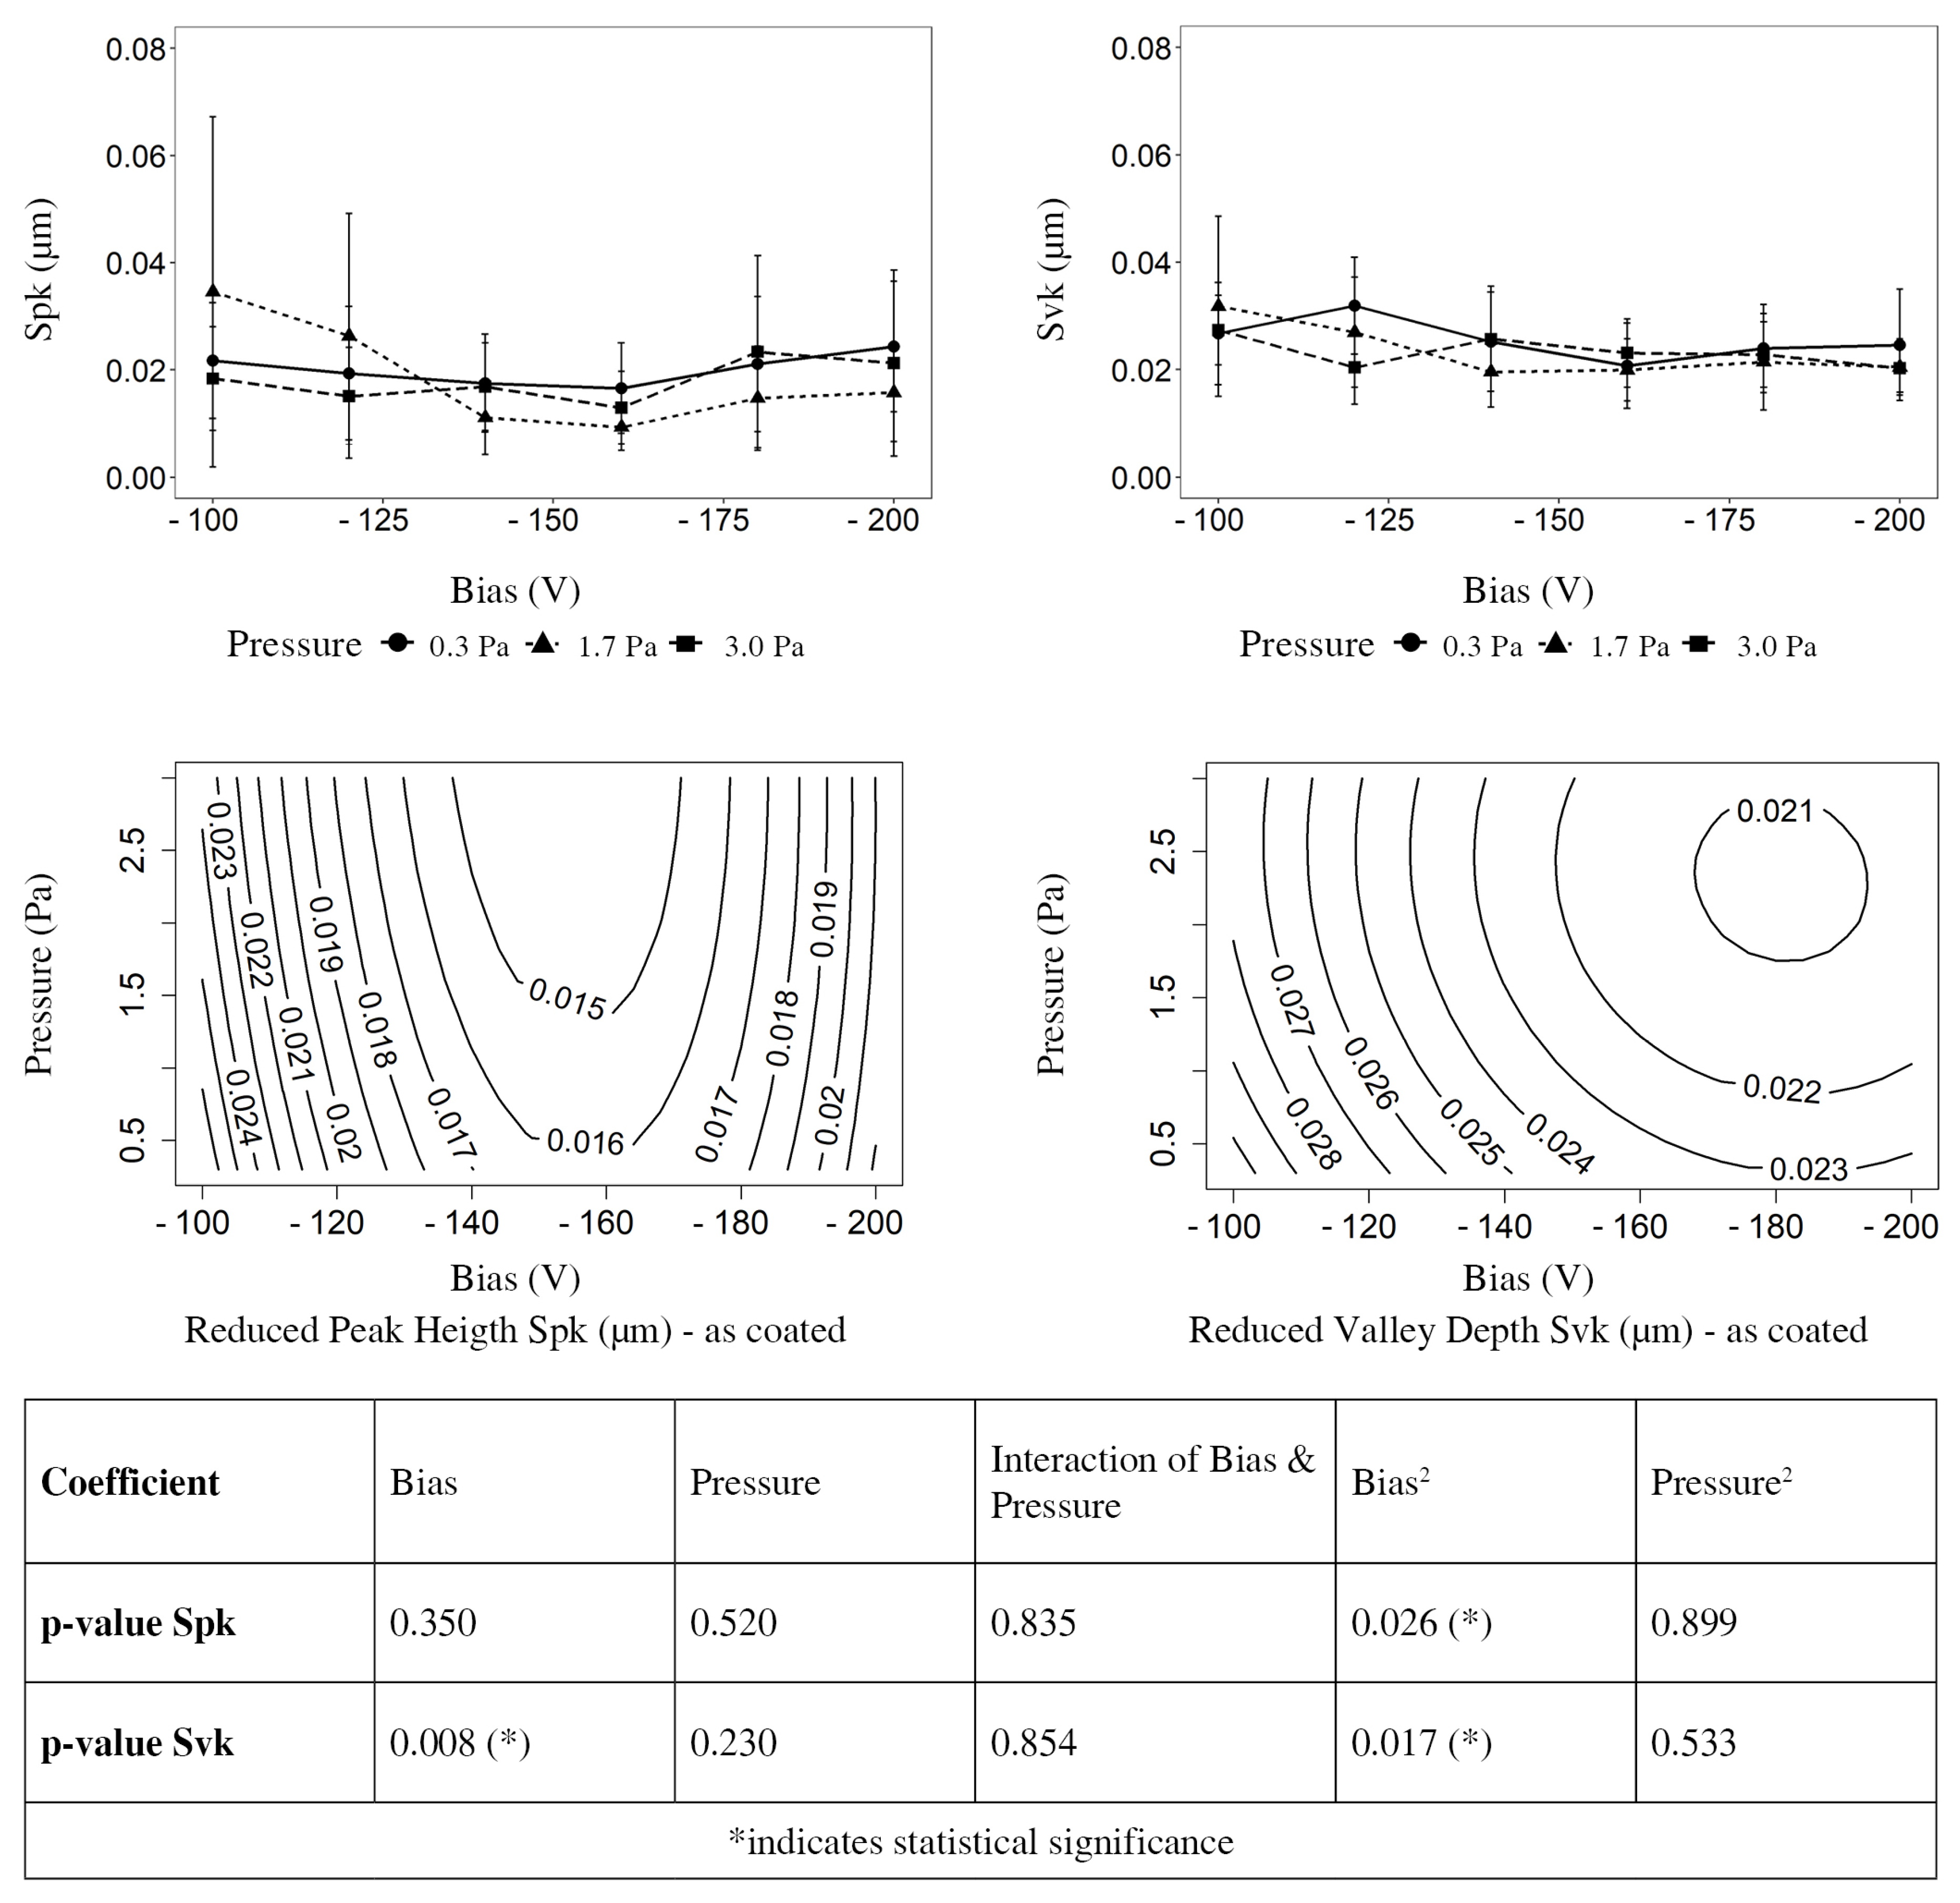
- The line roughness (Ra, Rz, Rp, Rv) and the surface roughness (Sa, Sz, Spk, Svk) are significantly affected by the bias and the pressure.
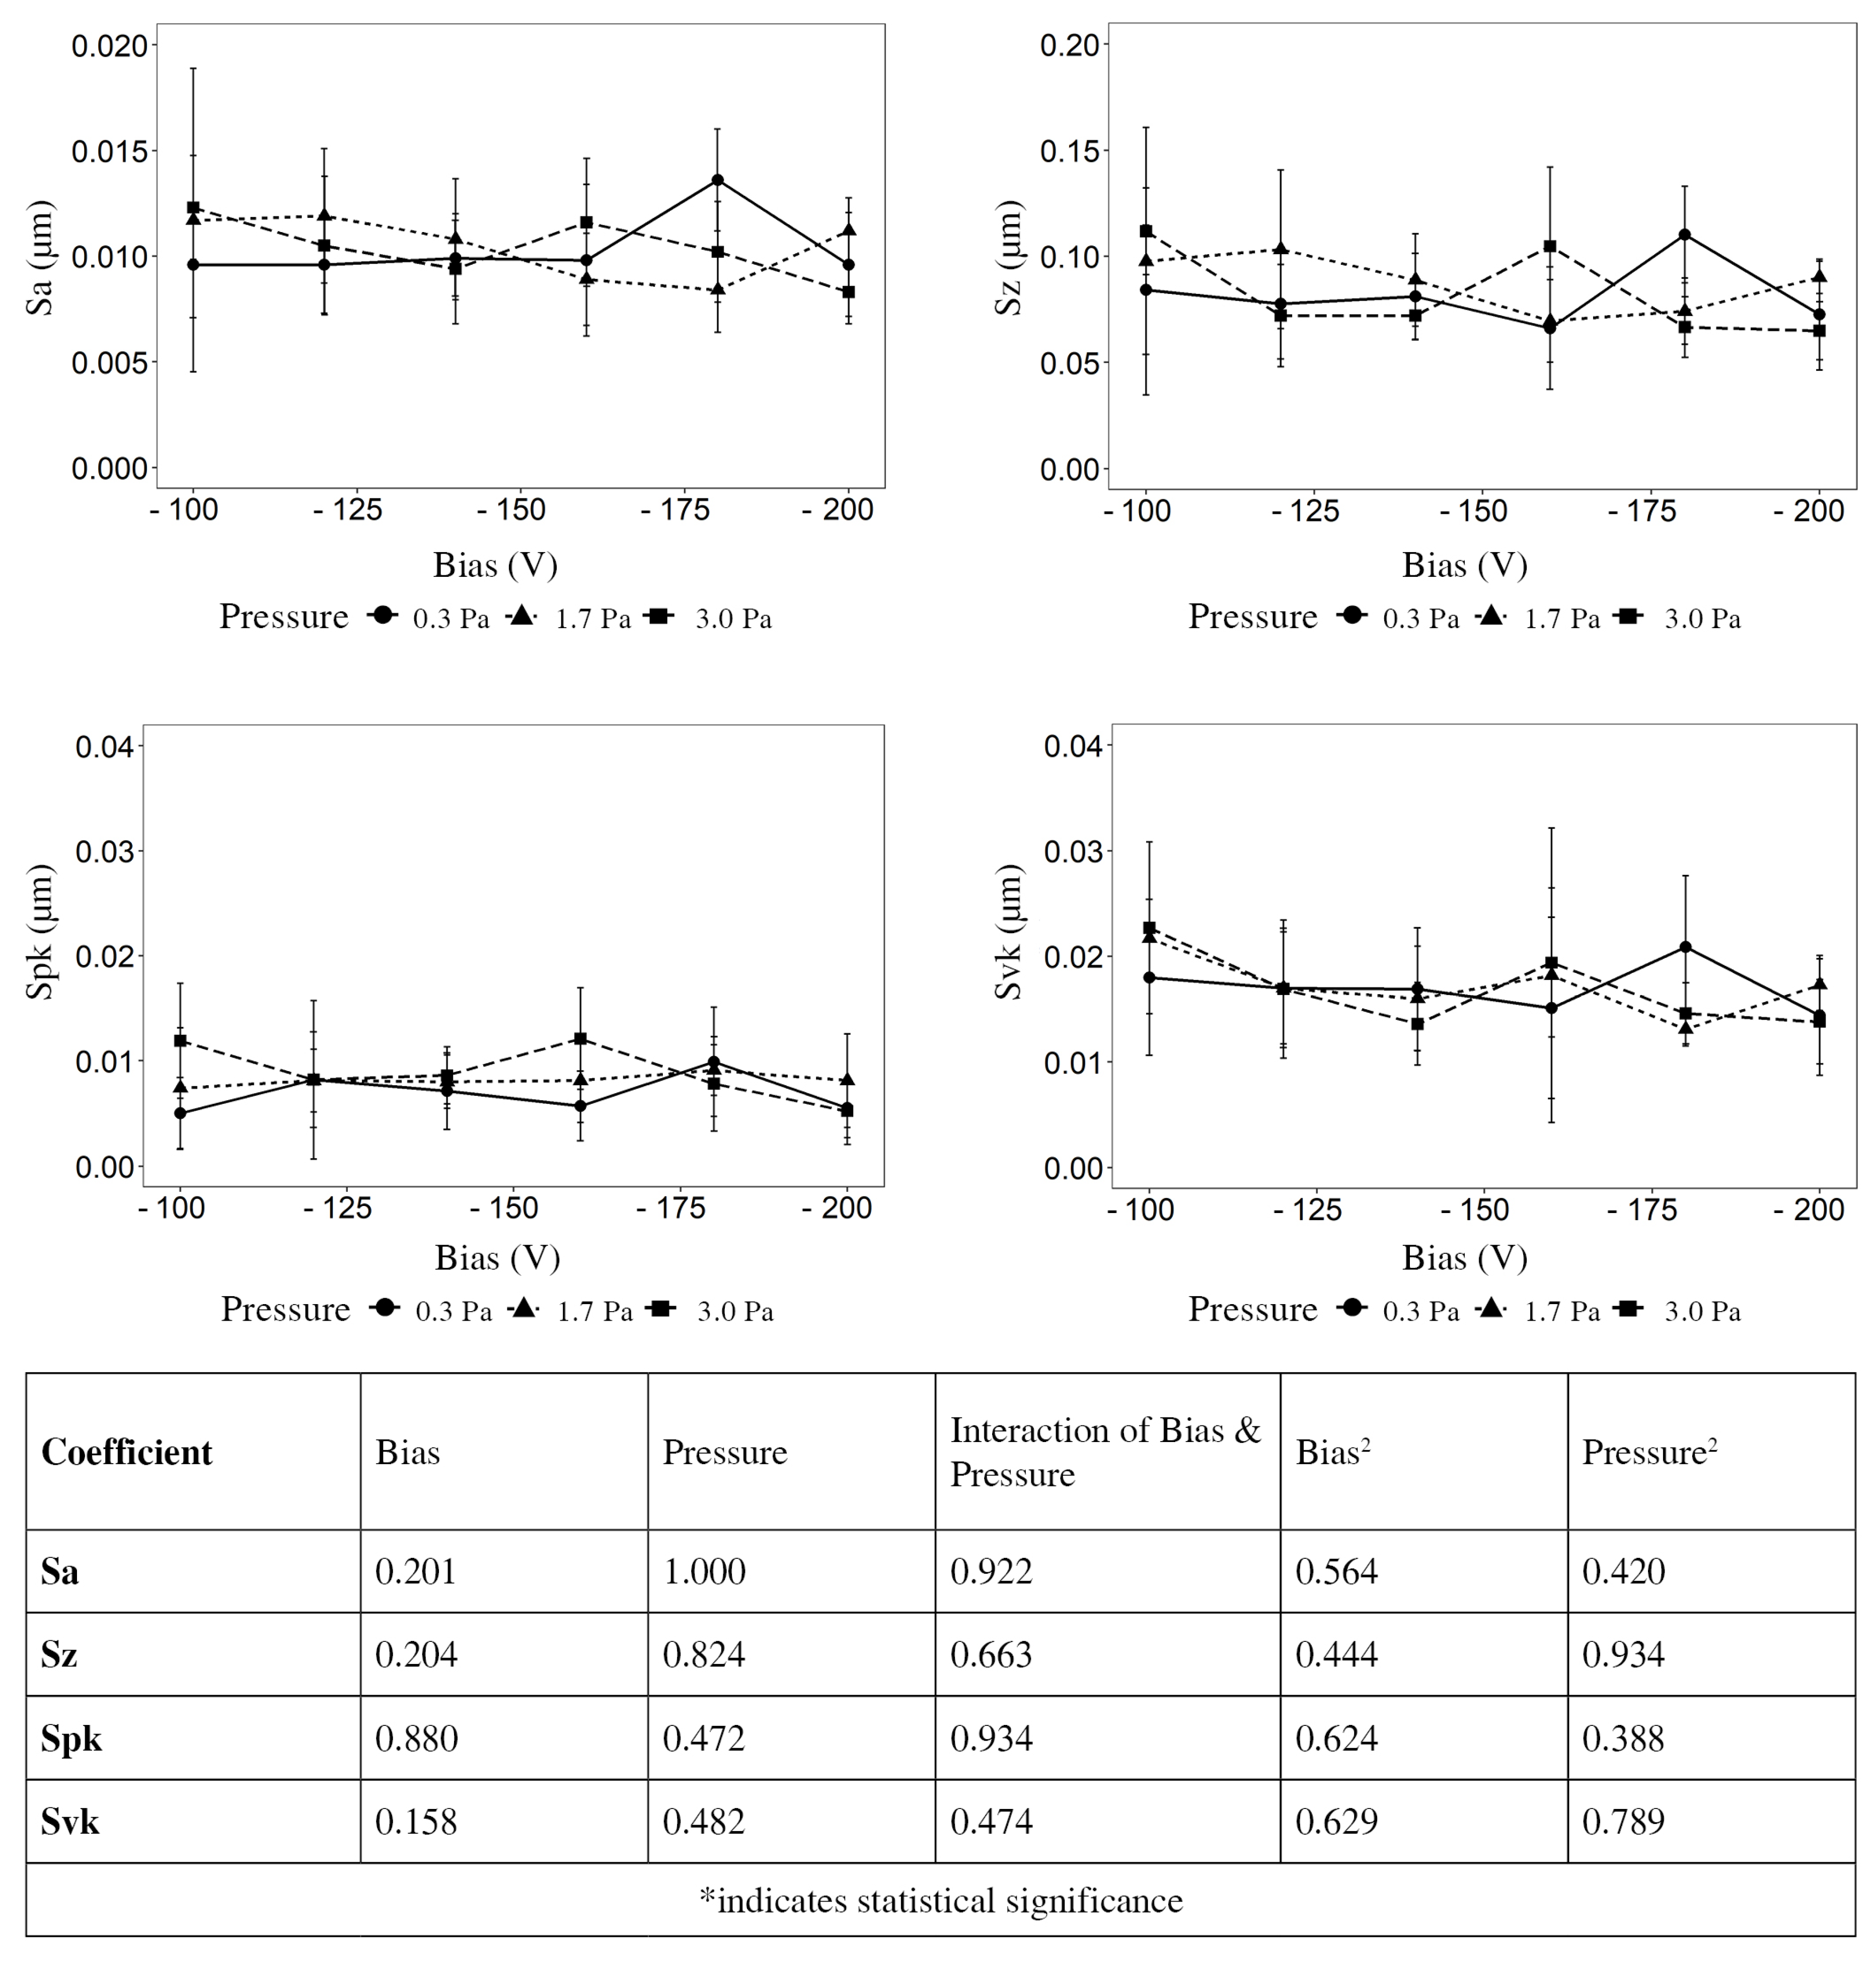
- After finishing, the line roughness and surface roughness are reduced to Ra < 0.05 µm and Rp < 0.25 µm. There is no statistically significant impact of the bias and pressure after finishing.
- The structure of the grain growth is affected by the substrate bias, exhibiting a fine grain growth at −100 V (Zone T according to Thornton) and a consistent columnar growth at −200 V (Zone 2 according to Thornton).
- All samples show a cubic TiN-like structure with {111} fibre texture in XRD analysis.
- The hardness and scratch resistance did not show a statistically significant impact of the substrate or pressure within the analysed parameter field.
Author Contributions
Funding
Institutional Review Board Statement
Informed Consent Statement
Data Availability Statement
Acknowledgments
Conflicts of Interest
References
- Breugem, S.J.M.; Linnartz, J.; Sierevelt, I.; Bruijn, J.D.; Driessen, M.J.M. Evaluation of 1031 primary titanium nitride coated mobile bearing total knee arthroplasties in an orthopedic clinic. World J. Orthop. 2017, 8, 922–928. [Google Scholar] [CrossRef] [PubMed]
- Thomas, P.; Hisgen, P.; Kiefer, H.; Schmerwitz, U.; Ottersbach, A.; Albrecht, D.; Summer, B.; Schinkel, C. Blood cytokine pattern and clinical outcome in knee arthroplasty patients: Comparative analysis 5 years after standard versus “hypoallergenic” surface coated prosthesis implantation. Acta Orthop. 2018, 89, 646–651. [Google Scholar] [CrossRef] [Green Version]
- Fabry, C.; Zietz, C.; Baumann, A.; Bader, R. Wear performance of sequentially cross-linked polyethylene inserts against ion-treated CoCr, TiNbN-coated CoCr and Al2O3 ceramic femoral heads for total hip replacement. Lubricants 2015, 3, 14–26. [Google Scholar] [CrossRef]
- Fabry, C.; Zietz, C.; Baumann, A.; Ehall, R.; Bader, R. High wear resistance of femoral components coated with titanium nitride: A retrieval analysis. Knee Surg. Sport. Traumatol. Arthrosc. 2018, 26, 2630–2639. [Google Scholar] [CrossRef] [PubMed]
- Varnum, C. Outcomes of different bearings in total hip arthroplasty—Implant survival, revision causes, and patient-reported outcome. Dan. Med. J. 2017, 64, 1–22. [Google Scholar]
- Gispert, M.P.; Serro, A.P.; Colaço, R.; Pires, E.; Saramago, B. Wear of ceramic coated metal-on-metal bearings used for hip replacement. Wear 2007, 263, 1060–1065. [Google Scholar] [CrossRef]
- Łępicka, M.; Grądzka-Dahlke, M.; Pieniak, D.; Pasierbiewicz, K.; Kryńska, K.; Niewczas, A. Tribological performance of titanium nitride coatings: A comparative study on TiN-coated stainless steel and titanium alloy. Wear 2019, 422–423, 68–80. [Google Scholar] [CrossRef]
- Herbster, M.; Döring, J.; Nohava, J.; Lohmann, C.H.; Halle, T.; Bertrand, J. Retrieval study of commercially available knee implant coatings TiN, TiNbN and ZrN on TiAl6V4 and CoCr28Mo6. J. Mech. Behav. Biomed. Mater. 2020, 112, 10403. [Google Scholar] [CrossRef]
- Thienpont, E. Titanium niobium nitride knee implants are not inferior to chrome cobalt components for primary total knee arthroplasty. Arch. Orthop. Trauma Surg. 2015, 135, 1749–1754. [Google Scholar] [CrossRef]
- Schroeder, S.; Braun, S.; Mueller, U.; Schroeder, M.; Sonntag, R.; Jaeger, S.; Kretzer, J.P. Polyethylene wear and metal release of TiNbN-coated knee implants. Wear 2020, 458–459, 203426. [Google Scholar] [CrossRef]
- Serro, A.P.; Completo, C.; Colaço, R.; dos Santos, F.; da Silva, C.L.; Cabral, J.M.S.; Araújo, H.; Pires, E.; Saramago, B. A comparative study of titanium nitrides, TiN, TiNbN and TiCN, as coatings for biomedical applications. Surf. Coatings Technol. 2009, 203, 3701–3707. [Google Scholar] [CrossRef]
- Kienle, A.; Graf, N.; Krais, C.; Wilke, H.J. The move-c cervical artificial disc—Design, materials, mechanical safety. Med. Devices Evid. Res. 2020, 13, 315–324. [Google Scholar] [CrossRef] [PubMed]
- Bergschmidt, P.; Bader, R.; Finze, S.; Schulze, C.; Kundt, G.; Mittelmeier, W. Comparative Study of Clinical and Radiological Outcomes of Unconstrained Bicondylar Total Knee Endoprostheses with Anti-allergic Coating. Open Orthop. J. 2011, 5, 354–360. [Google Scholar] [CrossRef] [PubMed] [Green Version]
- Golizadeh, M.; Mendez Martin, F.; Kolozsvári, S.; Anders, A.; Franz, R. Cathode spot behavior in nitrogen and oxygen gaseous atmospheres and concomitant cathode surface modifications. Surf. Coatings Technol. 2021, 421, 127441. [Google Scholar] [CrossRef]
- Oh, K.; Kalanov, D.; Birtel, P.; Anders, A. High-resolution observation of cathodic arc spots in a magnetically steered arc plasma source in low pressure argon, nitrogen, and oxygen atmospheres. J. Appl. Phys. 2021, 130, 183304. [Google Scholar] [CrossRef]
- Oh, K.; Kalanov, D.; Anders, A. High-resolution observation of cathode spots in a magnetically steered vacuum arc plasma source. Plasma Sources Sci. Technol. 2021, 30, 095005. [Google Scholar] [CrossRef]
- Thornton, J.A. Influence of Apparatus Geometry and Deposition Conditions on the Structure and Topography of Thick Sputtered Coatings. J. Vac. Sci. Technol. 1974, 11, 666–670. [Google Scholar] [CrossRef]
- Thornton, J.A. High Rate Thick Film Growth. Annu. Rev. Mater. Sci. 1977, 7, 239–260. [Google Scholar] [CrossRef]
- Thornton, J.A. The microstructure of sputter-deposited coatings. J. Vac. Sci. Technol. A Vac. Surf. Film. 1986, 4, 3059–3065. [Google Scholar] [CrossRef]
- Messier, R.; Giri, A.P.; Roy, R.A. Revised structure zone model for thin film physical structure. J. Vac. Sci. Technol. A Vac. Surf. Film. 1984, 2, 500–503. [Google Scholar] [CrossRef]
- Ali, M.; Hamzah, E.; Qazi, I.A.; Toff, M.R.M. Effect of cathodic arc PVD parameters on roughness of TiN coating on steel substrate. Curr. Appl. Phys. 2010, 10, 471–474. [Google Scholar] [CrossRef]
- Wang, M.; Ma, G.; Liu, X.; Dong, C. Morphology and mechanical properties of TiN coatings prepared with different PVD methods. Rare Met. Mater. Eng. 2016, 45, 3080–3084. [Google Scholar] [CrossRef]
- Ahlgren, M.; Blomqvist, H. Influence of bias variation on residual stress and texture in TiAlN PVD coatings. Surf. Coatings Technol. 2005, 200, 157–160. [Google Scholar] [CrossRef]
- Joo, Y.K.; Zhang, S.H.; Yoon, J.H.; Cho, T.Y. Optimization of the adhesion strength of Arc ion plating TiALN films by the taguchi method. Materials 2009, 2, 699–709. [Google Scholar] [CrossRef]
- Anders, A. A structure zone diagram including plasma-based deposition and ion etching. Thin Solid Film. 2010, 518, 4087–4090. [Google Scholar] [CrossRef] [Green Version]
- Ragone, V.; Canciani, E.; Biffi, C.A.; D’Ambrosi, R.; Sanvito, R.; Dellavia, C.; Galliera, E. CoCrMo alloys ions release behavior by TiNbN coating: An in vitro study. Biomed. Microdevices 2019, 21, 61. [Google Scholar] [CrossRef]
- Bidossi, A.; Bottagisio, M.; De Grandi, R.; De Vecchi, E. Ability of adhesion and biofilm formation of pathogens of periprosthetic joint infections on titanium-niobium nitride (TiNbN) ceramic coatings. J. Orthop. Surg. Res. 2020, 15, 1–10. [Google Scholar] [CrossRef] [Green Version]
- Cicek, H.; Baran, O.; Keles, A.; Totik, Y.; Efeoglu, I. A comparative study of fatigue properties of TiVN and TiNbN thin films deposited on different substrates. Surf. Coatings Technol. 2017, 332, 296–303. [Google Scholar] [CrossRef]
- Arora, J.S. Additional Topics on Optimum Design; Elsevier: Amsterdam, The Netherlands, 2017; ISBN 9780128008065. [Google Scholar]
- DIN ISO 5832-12; Implants for Surgery—Metallic Materials—Part 12: Wrought cobalt-chromium-molybdenum alloy (ISO 5832-12:2007). ISO: Geneva, Switzerland, 2009.
- DIN EN ISO 26423; Fine Ceramics (Advanced Ceramics, Advanced Technical Ceramics)—Determination of Coating Thickness by Crater-Grinding Method (ISO 26423:2009); German version EN ISO 26423:2016. ISO: Geneva, Switzerland, 2016.
- DIN EN ISO 4287; Geometrical Product Specifications (GPS)—Surface Texture: Profile Method—Terms, Definitions and Surface Texture Parameters (ISO 4287:1997 + Cor 1:1998 + Cor 2:2005 + Amd 1:2009); German version EN ISO 4287:1998 + AC:2008 + A1:2009. ISO: Geneva, Switzerland, 2010.
- DIN EN ISO 4288; Geometrical Product Specification (GPS)—Surface Texture: Profile Method—Rules and Procedures for the Assessment of Surface Texture (ISO 4288:1996). German Version EN ISO4288:1997. ISO: Geneva, Switzerland, 1998.
- Shi, R.; Wang, B.; Yan, Z.; Wang, Z.; Dong, L. Effect of surface topography parameters on friction and wear of random rough surface. Materials 2019, 12, 2762. [Google Scholar] [CrossRef] [Green Version]
- Chateigner, D.; Chen, X.; Cirriotti, M.; Downs, R.T.; Gražulis, S.; Kaminsky, W.; Le Bail, A.; Lutterotti, L.; Matsushita, Y.; Merkys, A.; et al. Crystallography Open Database. Available online: https://www.crystallography.net/cod/ (accessed on 19 March 2022).
- Brandenburg, H.P.K. Crystal Impact. Available online: https://www.crystalimpact.com/match/ (accessed on 19 March 2022).
- DIN EN ISO 14577-4; Metallic Materials—Instrumented Indentation Test for Hardness and Materials Parameters—Part 4: Test Method for Metallic and Non-Metallic Coatings. ISO: Geneva, Switzerland, 2016.
- DIN EN ISO 20502; Fine Ceramics (Advanced Ceramics, Advanced Technical Ceramics)—Determination of Adhesion of Ceramic Coatings by Scratch Testing (ISO 20502:2005 including Cor 1:2009); German version EN ISO 20502:2016. ISO: Geneva, Switzerland, 2016.
- Lenth, R.V. Response-surface methods in R, using RSM. J. Stat. Softw. 2009, 32, 1–17. [Google Scholar] [CrossRef] [Green Version]
- Keles, O.; Taptik, Y.; Eryilmaz, O.L.; Urgen, M.; Çakir, A.F. Optimization of arc-PVD TiN coating process parameters by Taguchi technique. Qual. Eng. 1999, 12, 29–36. [Google Scholar] [CrossRef]
- Popov, V.L. Method of reduction of dimensionality in contact and friction mechanics: A linkage between micro and macro scales. Friction 2013, 1, 41–62. [Google Scholar] [CrossRef] [Green Version]
- Wang, Y.; Wang, Q.J.; Lin, C.; Shi, F. Development of a set of stribeck curves for conformal contacts of rough surfaces. Tribol. Trans. 2006, 49, 526–535. [Google Scholar] [CrossRef]
- Bachchhav, B.; Bagchi, H. Effect of surface roughness on friction and lubrication regimes. Mater. Today Proc. 2020, 38, 169–173. [Google Scholar] [CrossRef]


| Element | wt % |
|---|---|
| Cobalt (Co) | Balance |
| Chromium (Cr) | 27.50 |
| Molybdenum | 5.50 |
| Iron (Fe) | 0.31 |
| Manganese (Mn) | 0.81 |
| Nickel (Ni) | 0.11 |
| Silicon (Si) | 0.62 |
| Carbon (C) | 0.04 |
Publisher’s Note: MDPI stays neutral with regard to jurisdictional claims in published maps and institutional affiliations. |
© 2022 by the authors. Licensee MDPI, Basel, Switzerland. This article is an open access article distributed under the terms and conditions of the Creative Commons Attribution (CC BY) license (https://creativecommons.org/licenses/by/4.0/).
Share and Cite
Dempwolf, H.; Proft, M.; Baumann, A.; Malz, S.; Keßler, O. The Impact of Bias and Nitrogen Pressure on TiNbN Coatings in Arc-PVD Processes—A Multifactorial Study. Coatings 2022, 12, 935. https://doi.org/10.3390/coatings12070935
Dempwolf H, Proft M, Baumann A, Malz S, Keßler O. The Impact of Bias and Nitrogen Pressure on TiNbN Coatings in Arc-PVD Processes—A Multifactorial Study. Coatings. 2022; 12(7):935. https://doi.org/10.3390/coatings12070935
Chicago/Turabian StyleDempwolf, Henry, Matthias Proft, Axel Baumann, Sinah Malz, and Olaf Keßler. 2022. "The Impact of Bias and Nitrogen Pressure on TiNbN Coatings in Arc-PVD Processes—A Multifactorial Study" Coatings 12, no. 7: 935. https://doi.org/10.3390/coatings12070935
APA StyleDempwolf, H., Proft, M., Baumann, A., Malz, S., & Keßler, O. (2022). The Impact of Bias and Nitrogen Pressure on TiNbN Coatings in Arc-PVD Processes—A Multifactorial Study. Coatings, 12(7), 935. https://doi.org/10.3390/coatings12070935