Article

Grey Correlation Analysis of Physical Properties and Evaluation Index of Graphene-Oxide-Modified Asphalt

1
School of Civil Engineering, Northeast Forestry University, Harbin 150040, China
2
College of Civil and Architectural Engineering, Heilongjiang Institute of Technology, Harbin 150050, China
*
Author to whom correspondence should be addressed.
Coatings 2022, 12(6), 770; https://doi.org/10.3390/coatings12060770
Submission received: 17 April 2022 / Revised: 30 May 2022 / Accepted: 1 June 2022 / Published: 3 June 2022

Abstract

:
The purpose of this study is to analyze the behavior of the performance index of graphene-oxide-modified asphalt. The deviation problem caused by determining graphene oxide content by single performance or several independent properties is also investigated. By testing the physical properties of graphene-oxide-modified asphalt with different admixtures (0%, 0.5%, 1.0%, 1.5%, 2.0% by mass) in terms of viscosity, penetration, softening point, ductility, rheology, etc., it is concluded that the addition of graphene oxide could improve the individual properties of the matrix asphalt by 3% to 250%. Moreover, the grey correlation analysis method is used to calculate and analyze the correlation between the performance of graphene-oxide-modified asphalt and the content of graphene oxide. The latter has the most significant effect on the softening point, the penetration, and the 135 °C Brookfield viscosity of modified asphalt. The content of graphene oxide in graphene-oxide-modified asphalt is calculated based on the above three performance indexes, and an estimation error of less than 0.15% is observed. This proves that the new determination method is reasonable. Finally, by combining the macroscopic properties and the multi-factor statistical analysis, a reference basis is provided for the quality control of the graphene-oxide-modified asphalt.

1. Introduction

Bitumen is an organic mixture produced by the distillation of crude oil. Although the chemical composition of asphalt is variable and complex, it is usually characterized by four components, including aromatic fraction (80% carbon, 15% hydrogen), asphaltene, gum, and saturated fraction [1,2]. Due to its advantages in flexibility, fluidity, suitable viscoelastic behavior, long-term durability, and water resistance, asphalt is qualified to be one of the most important materials in concrete mixtures for paving streets [1,3]. In order to obtain good paving results and to make it resistant to climatic conditions and heavy loads, researchers have improved its properties by adding modifiers [4] to extend its service life.
In recent years, with the development of nanotechnology, two-dimensional (2D) materials such as graphene, graphite nanoplatelets (GNPs), and graphene oxide (GO) have gained a wide range of applications in many fields. Among these different 2D materials, graphene is a single-layer carbon sheet with a hexagonal stacked-lattice structure. It has many unique properties, such as high carrier mobility at room temperature, high specific surface area, high strength, strong thermal conductivity, high temperature resistance, good light transmission, and high Young’s modulus, etc. [5]. Due to its excellent properties, graphene and its derivatives are considered to be universal materials able to improve and reconstruct any material or structure [5]. Therefore, the application of graphene and its derivatives such as graphite nanoplatelets (GNPs) and graphene oxide (GO) materials in pavement engineering is also receiving increasing attention.
Graphene oxide (GO), which is an inorganic nanomaterial, is one of the most important classes of graphene materials. Similar to graphene, GO has a two-dimensional nanosheet layer structure with a layer spacing of 0.7–1.2 nm. This structure theoretically retains some of the excellent physical properties of graphene, such as high strength, high temperature resistance, and low weight [6]. In addition, the good oxygen barrier and inter-solubility with organic solvents properties make GO a new type of asphalt modifier that is attracting more research interest [7]. Furthermore, the cost of nanomaterials is trending downwards and is likely to decrease further as manufacturing methods continue to be optimized. This will increase the scalability of graphene oxide as an asphalt modifier and offer more possibilities for constructing good-quality roads [8].
The addition of GO to asphalt, as analyzed by Zeng et al. [9], increased the softening point, the viscosity, the asphalt residual permeability, and especially, the residual permeability. However, the ductility and permeability values were reduced. GO improved the high-temperature stability and asphalt heat-aging resistance, but it did not improve the bitumen crack resistance, within an optimum GO content between 0.5 wt% and 0.7 wt%. Wu et al. [10] added 0.5% and 1.0% GO as modifiers to base asphalt and found that the GO improved the high-temperature properties of the base asphalt, while it had a lower impact on the low-temperature properties. Abbas [11] showed that GO-modified asphalt exhibited lower creep stiffness (s values) and higher creep rates (m values), indicating an increased cracking resistance at low temperatures. In addition, the study showed that 2% GO is the optimum amount to improve the performance of the modified asphalt. Ying et al. [12] found that the addition of GO reduced the amount of polar functional groups in asphalt, effectively blocked the diffusion of small molecules in asphalt, and delayed the chemical reaction during aging. Abbas [13] showed that GO significantly improved the elastic modulus of hot mix asphalt (HMA) at medium and high temperatures. The dynamic creep results showed that the permanent deformation of the asphalt mixture decreased significantly with the increase of GO content. Zhu et al. [14] added different doses of GO to the matrix asphalt and conducted experiments on the penetration, softening point, and ductility. Results showed that the addition of GO significantly reduced the penetration and increased the asphalt softening point, but it had no significant effect on the ductility. Li et al. [15] showed that GO-modified asphalt binder demonstrated better performance at both low and high temperatures, and the fatigue resistance of asphalt was improved. Liu et al. [16] found that by increasing the GO content, the asphalt rutting factor showed an initial increasing trend and it decreased after reaching a maximum value of the factor. GO significantly improved the viscosity, high temperature elasticity, and permanent deformation resistance of unmodified PG 64–22 asphalt binder.
Most of the current studies are based on single or several independent performance indicators of GO-modified asphalt to reflect the modification effect. However, the reflection of the comprehensive evaluation results is not clear enough. In this work, the correlation analysis method is proposed for grey systems. Grey system theory is based on a grey hazy set and a grey model, which is the core of the model system, and the uncorrelated data are transformed into a more regular data column [17]. This theory can avoid the defects encountered in traditional regression analysis, variance analysis, and principal component analysis, such as large sample size and computational effort and the necessity to obey a certain distribution law, or the discrepancy between quantitative results and qualitative results [18,19].
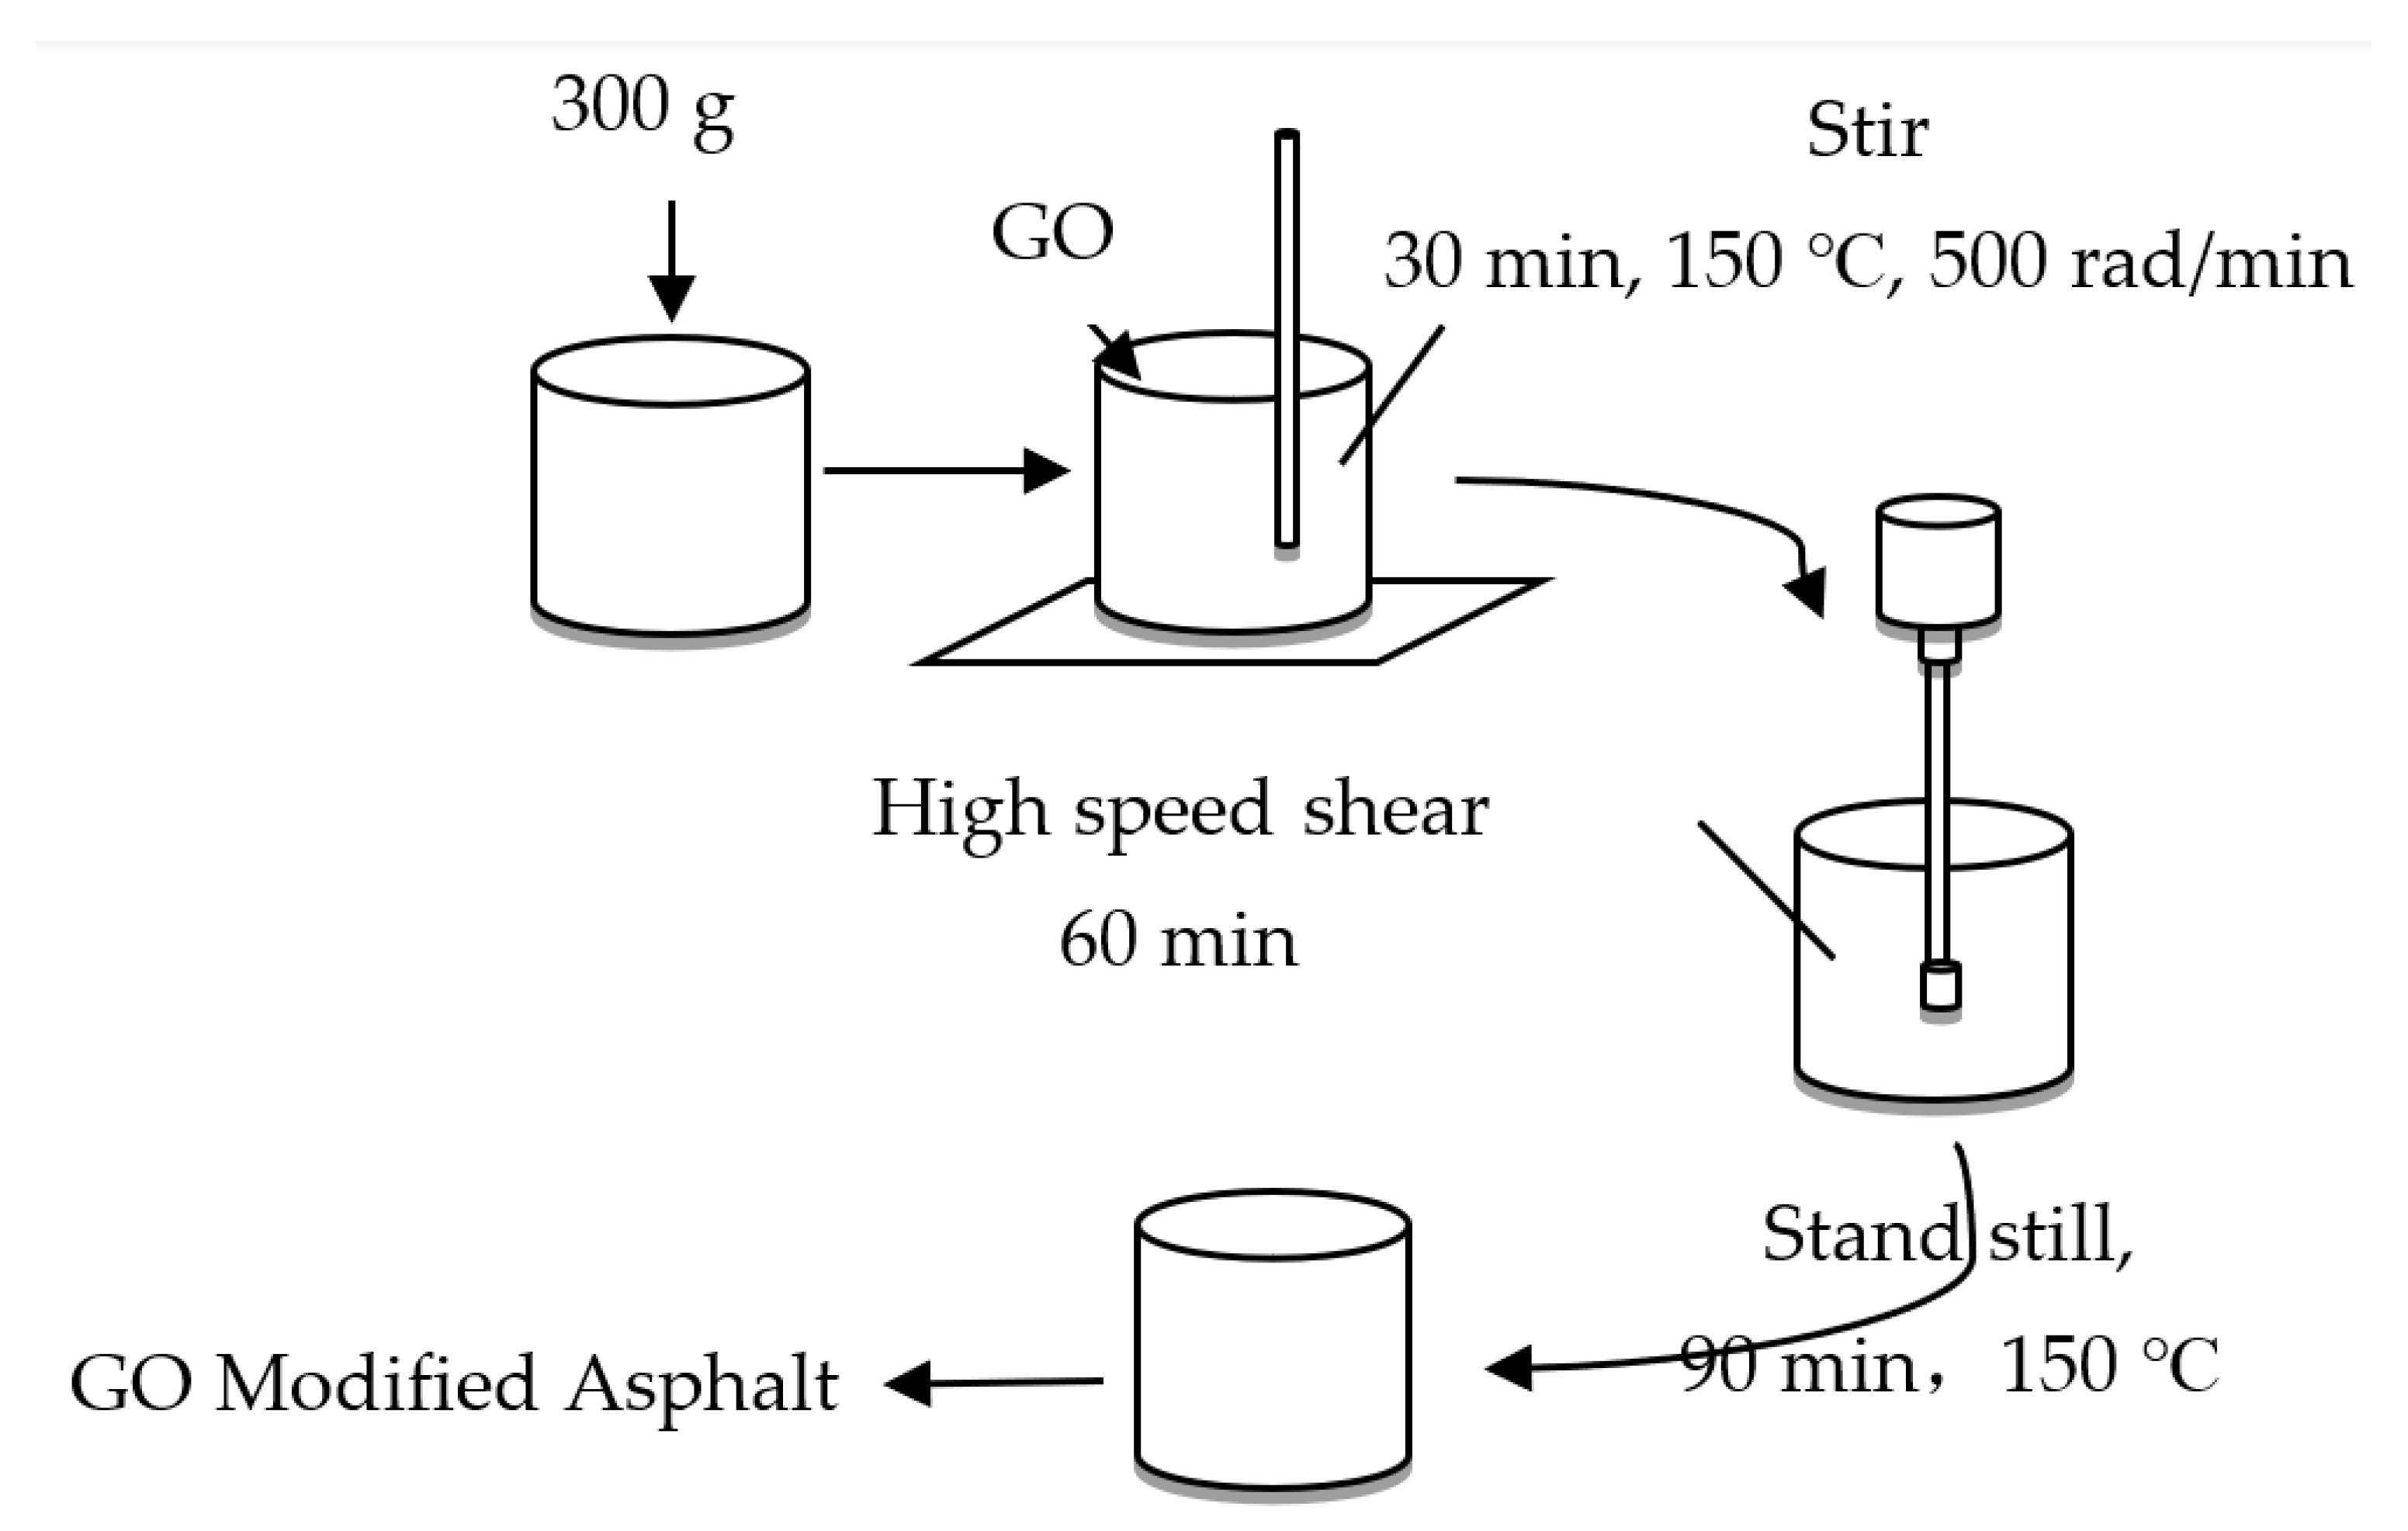
This paper uses a series of indoor experiments to study the performance of GO-modified asphalt with different doping levels. The grey system theory correlation analysis method is applied to calculate and analyze the correlation between the performance evaluation indexes of GO-modified asphalt such as the penetration, softening point, ductility, 135 °C Brookfield viscosity, rutting factor, creep rate, and GO content. The key indexes to control the GO content in GO-modified asphalt are determined and the rationality of using the indexes with high correlation to determine the GO content is estimated. Finally, a basis for the quality control of GO-modified asphalt in the application process is provided.

2. Materials and Methods

2.1. Materials

No. 90 matrix asphalt, originating from Panjin North Asphalt Co., Ltd, Panjin, China, is used as the matrix asphalt and its basic technical specifications are shown in Table 1 (technical specifications are tested according to the Standard Test Method for Asphalt and Asphalt Mixture for Highway Engineering (JTG E20-2011)). Asphalt components analyzed in this study are shown in Table 2. The graphene oxide (GO) is purchased from Qitaihe Baotailong Graphene New Material Co., Qitaihe, China. The basic specifications of graphene oxide (GO) are shown in Table 3.

2.2. Preparation Methods

2.2.1. Asphalt Modification Process

Lam [20] found that the conventional performance indexes are effectively improved by adding a higher GO dose to the matrix asphalt. A correlation analysis is conducted between the GO dose and the conventional asphalt indexes. The recommended suitable dose range of GO in asphalt varies between 0.3% and 1.5%, and the conventional asphalt indexes are improved in this range. Therefore, in this paper, the GO modified asphalt with doping levels of 0.5%, 1.0%, 1 5%, and 2.0% was prepared. The specific preparation process is shown in Figure 1.
(1)
Weigh 300 g of the base asphalt and place it in a stainless-steel cup in an oven at 135 °C and heat it until it melts.
(2)
Take out the stainless-steel cup and place it on the electric heating plate. Based on the mass of matrix asphalt, add different amounts of GO according to the doping levels of 0.5%, 1 0%, 1.5%, and 2.0%. Stir the mixture at 150 °C for 30 min with a speed of 500 rad/min to evenly disperse the GO powder in the asphalt.
(3)
Shear dispersion of the GO-modified asphalt by high-speed shear at 5000 rad/min and 150 °C for 1 h.
(4)
Transfer the prepared mixture to the oven to maintain a constant temperature of 150 °C for 1.5 h to finally obtain the GO-modified asphalt specimens.

2.2.2. Viscosity Test

According to the test method of “Highway Engineering Asphalt and Asphalt Mixture Test Procedure” (JTG E20-2011), the viscosity of each asphalt bond at 120 °C, 135 °C, 150 °C, and 165 °C is measured by Brookfield Viscometer.

2.2.3. Three-Major-Indices Test

According to the test method of “Highway Engineering Asphalt and Asphalt Mixture Test Procedure” (JTG E20-2011), the penetration, softening point, and ductility of different asphalt binder specimens are determined.

2.2.4. Temperature Scan Test

The temperature scan test is conducted using a high-precision MCR 302 instrument (Anton Paar, Graz, Austria) with the aid of a temperature scan program on the Dynamic Shear Rheological (DSR) platform (Anton Paar, Graz, Austria). The test temperatures range between 46 °C and 82 °C with an interval of 6 °C. The test mold size is equal to 25 mm × 1 mm. The controlled strain loading mode with 1% strain control is considered. The loading frequency is set to 10 rad/s. This enables the determination of the asphalt specimens’ complex modulus at different temperatures G*, phase angle δ, and rutting factor G*/sinδ.

2.2.5. Multiple Stress Creep Recovery Test

The Multiple Stress Creep Recovery (MSCR) test is conducted to study the high temperature stability of asphalt samples at 0.1 kPa and 3.2 kPa by using a Dynamic Shear Rheological (DSR, Anton Paar, Graz, Austria) and performing multiple stress creep recovery tests at 64 °C. The test mold size is 25 mm × 1 mm. Each test is repeated 10 times for each stress with 10 s cycles (1 s for the creep phase and 9 s for the recovery phase).

2.2.6. Low Temperature Bending Rheology Test

The low-temperature bending Rheological (BBR, Cannon Instrument Company, State College, PA, USA) is used to evaluate the low-temperature crack resistance of asphalt by conducting small beam bending experiments at −12 °C, −18 °C, and −24 °C. The creep stiffness s and creep rate m of the samples are measured at 60 s.

3. Results and Discussion

3.1. Conventional Performance Test

3.1.1. Viscosity Test Data Analysis

Asphalt is a typical viscoelastic material, and its viscosity properties are closely related to the service temperature [21]. The value of asphalt viscosity depends on the strength of the interaction between the molecules inside the asphalt. The change in the asphalt viscosity directly affects the overall mechanical properties of asphalt. The greater the viscosity, the stronger the asphalt high temperature resistance to deformation and the better the high temperature stability.
The results of the Viscosity tests are shown in Table 4.
It can be seen from Table 4 that all asphalt viscosities decrease with the increase in temperature. The chemical structure of asphalt is a typical colloidal structure. The structure between the colloidal clusters in asphalt will be gradually destroyed with the increase in temperature and as a result, the viscosity will be greatly reduced. At the same time, the GO addition increases the asphalt viscosity, which means that the GO addition weakens the damage between gel clusters in asphalt by higher temperature. Consequently, the GO-modified asphalt has a higher viscosity than base asphalt. Therefore, the high-temperature deformation resistance of asphalt is improved. In addition, the viscosity of the GO-modified asphalt increases and then decreases with the GO dosage increase. The maximal viscosity at each temperature is reached at 1.0% GO dosage. It was observed in previous studies that the viscosity increases with more dispersed phase (GO) content until reaching a maximum. If the GO content continues to increase, the viscosity tends to decrease, since more dispersed phases (GO) collide with each other and re-agglomerate. This leads to a reduction in the system interface and surface energy, resulting in a stable system. However, because of the presence of phase-separation behavior, the viscosity will decrease. The above phenomenon shows that the right amount of GO can improve the high-temperature stability of asphalt, but it is not better to add an excessive amount of GO.
To analyze whether there is a significant difference between the impact of test temperature and GO content on the viscosity value, the experimental data were analyzed by variance. The analysis data are shown in Table 5.
It can be seen from the table above that the significance of both the temperature (0.000) and dosage (0.049) are less than the significance level (0.05), indicating that different levels of temperature and dosage have a significant impact on the observed variables. That is, the impact of test temperature and GO content on viscosity is significantly different. This is consistent with the experimental results.

3.1.2. Three-Major-Indices Data Analysis

The penetration of each asphalt is tested by the asphalt standard penetration test to analyze the GO impact on its viscosity and to evaluate its resistance to permanent deformation.
The softening point of each asphalt sample is measured by the ring and ball method, which may characterize the asphalt temperature stability to a certain extent. It also reflects the viscosity, high-temperature stability, and asphalt temperature sensitivity. The higher the softening point, the higher the asphalt viscosity and the better the high-temperature stability.
The ductility of asphalt is an important index for evaluating asphalt plasticity. The test results of the three indicators are shown in Table 6.
As shown in Table 6, when the GO content was increased, the penetration of GO-modified asphalt decreased at first, and then increased. The penetration reached a minimum value of 6.91 mm for a GO dosage of 1.0%. The addition of the right amount of GO can reduce the penetration of asphalt and increase the viscosity and the resistance to deformation of asphalt. This phenomenon is due to the fact that the GO in the modified bitumen is a small, dispersed phase with relatively few surface defects. The many unpaired atoms, oxygen-containing functional groups, and unsaturated bonds around the surface atoms make it easy to combine with other atoms. Thus, GO can be closely bonded to the bitumen molecules, resulting in an increase in the material mechanical strength [22].
The softening point increases with the GO content and a maximum of 51.2 °C is reached when the dosage of GO is 1.0%. Then, the softening point starts to decrease for higher dosages. This may be explained by the addition of GO flakes, which are rich in surface oxygen functional groups. These functional groups can react chemically or physically with the bitumen to form a network structure in the bitumen, limiting the movement of bitumen molecules at high temperatures, and consequently, improving the high temperature stability of GO modified bitumen [23].
The change in ductility is similar to that of the softening point. The ductility increases with the GO content and reaches a maximum of 405 mm for a GO dosage of 1.0%, which is increased by about 50.6%. The ductility starts to decrease for higher GO dosages. This trend may be due to the formation of an excess GO sliding layer in the matrix asphalt if the GO dosage exceeds a certain limit. The movement of asphalt molecules is enhanced [16], thus making the ductility and softening point fall back. The above results indicate that the GO modifier can improve the high-temperature performance of asphalt binder, but it reduces low-temperature ductility.
In order to determine whether changing the GO content substantially affects penetration, softening point, and ductility, the experimental data were analyzed by variance. The analysis data are shown in Table 7, Table 8 and Table 9.
From the above Table 7, it can be seen that the significance of GO dosage (0.000) is less than the significance level (0.05), which indicates that GO dosage has a significant effect on the penetration.
From the above Table 8, it can be seen that the significance of GO dosage (0.000) is less than the significance level (0.05), which indicates that GO dosage has a significant effect on the softening point.
From the above Table 9, it can be seen that the significance of GO dosage (0.032) is less than the significance level (0.05), which indicates that GO dosage has a significant effect on ductility.

3.1.3. Temperature Scan Test Data Analysis

The dynamic rheological behavior of the GO-modified asphalt with different admixtures is tested by Dynamic Shear Rheological (DSR). The Superpave specification uses the rutting factor as an indicator of the permanent deformation resistance of asphalt materials to characterize the asphalt high-temperature performance [24]. The test results are shown in Figure 2a,b.
The phase angle δ can be used to characterize the asphalt viscoelastic ratio [25]. The higher the δ value, the greater the proportion of viscous components in the asphalt, and the asphalt ability to recover after deformation is reduced [26]. It can be seen from Figure 2a that the phase angle of GO-modified asphalt increases slowly with the temperature. The high temperature decreases the binding force between asphalt molecules. Thus, the asphalt molecules flow more easily, and the viscous component gradually increases [27]. The δ trend decreases with the increase of GO content until reaching a minimum and then it increases. In addition, the phase angle reaches its minimum for a GO dosage of 1.0%. This indicates that the appropriate amount of GO can effectively reduce the asphalt viscosity, inhibit the high-temperature flow of asphalt molecules to a certain extent, slow down the stress–strain hysteresis effect of asphalt, and improve its elasticity [28,29].
The complex shear modulus G* characterizes the ability of asphalt binder to resist repeated shear deformation within the linear viscoelasticity range. Larger values of G* lead to the better shear resistance of asphalt and a stronger ability to resist deformation [30]. The rutting factor G*/sinδ reflects the permanent deformation of the asphalt binder. Higher rutting factors contribute to smaller permanent deformation of the asphalt binder related to energy dissipation and stronger rutting resistance [31]. According to Figure 2a,b, in all the five asphalt specimens, the complex modulus G* and the rutting factor G*/sinδ are correlated to the temperature T, and they decreased with the increase of temperature. At a relatively low temperature, it can be clearly seen that the G* and G*/sinδ of the GO-doped modified asphalt are larger than those of the matrix asphalt. When the test temperature is 64 °C and the GO admixture is 1%, the complex modulus reached 2.512 kPa and the rutting factor increased by 1.63 times compared with that of the matrix asphalt.
This suggests that GO can be effectively merged with the matrix asphalt and can slow down the conversion process of asphalt viscoelastic components. Therefore, the high-temperature stability of the matrix asphalt is improved greatly. However, if an excessive amount of GO is added, GO will be randomly distributed in the molecules. In this case, due to the thermal conductivity and lubricity of GO, heat generated at high temperatures will be rapidly transferred to the asphalt molecules. This results in softening of the asphalt and thus increasing of the asphalt permanent deformation.
The above results show that the GO-modified asphalt has better rutting resistance and good stability under high-temperature conditions to a certain extent.

3.1.4. Multiple Stress Creep Recovery Test Analysis

The MSCR test is a test method developed to solve the problem that the original evaluation system is not applicable to the modified asphalt [32]. Compared with G*/sinδ obtained from the DSR test, the deformation recovery rate R and irrecoverable creep flexibility Jnr measured by MSCR can better reflect the viscoelastic properties and high-temperature rutting resistance of the modified asphalt binder. Such properties are more in line with the actual performance of asphalt pavement [33,34]. In this method, R indicates the elastic component of asphalt. The higher the value of R, the better the asphalt elasticity is. Jnr indicates the unrecoverable creep deformation of asphalt at high temperature, smaller Jnr values mean a stronger ability to resist plastic deformation [35]. The test results are shown in Figure 3.
As shown in Figure 3, under 0.1 and 3.2 kPa stress conditions, the R-value of the modified asphalt with GO is larger than that of the matrix asphalt. On the contrary, the Jnr value is smaller. This implies that the use of GO as a modifier can significantly enhance the elastic recovery performance of the matrix asphalt as well as the high-temperature stability of the asphalt binder. There are several possible reasons for this phenomenon. Firstly, the GO has excellent mechanical properties with a high modulus of elasticity, and the addition of GO to the matrix asphalt enhances its structural strength and toughness. Secondly, the matrix asphalt contains lighter aromatic and saturated components. Under thermal or mechanical stress, the absorption layer of the micelle becomes thinner. The lighter components make the asphalt colloidal structure loose [28]. While the composition of GO is similar to that of asphaltene, the addition of GO can absorb some of the light components and effectively inhibit the destruction of the colloidal structure. Therefore, the intermolecular interaction between asphaltene and GO may form a crosslink of a composite network, thus improving the elasticity of asphalt binders.
Under 0.1 and 3.2 kPa stresses, R increases with the GO content and then tends to smooth out. On the contrary, Jnr decreases and then tends to smooth out. For the same GO content, the R value of the GO-modified asphalt at a low stress level (0.1 kPa) is significantly higher than that at a high stress level (3.2 kPa). This is because the proportion of elasticity in the GO-modified asphalt increases while the viscous component decreases, and thus the high temperature deformation resistance of asphalt is improved.
The two values reach their extremes at 1.0% GO content. This indicates that an adequate amount of GO can inhibit the generation of irrecoverable deformation of the matrix asphalt. These results are in good agreement with the results of G* and G*/sinδ in the DSR test.

3.1.5. Low Temperature Bending Rheology Test Analysis

A bending beam rheometer was used to test the creep performance of the GO-modified asphalt with different doping levels at −12, −18, and −24 °C. The creep stiffness s and creep rate m are evaluated by considering 60.0 s. The creep stiffness s indicates the asphalt ability to resist low temperature deformation. The smaller the s value, the lower the risk of cracking asphalt binder in low-temperature conditions. The creep rate m represents the change speed of stiffness modulus of asphalt with creep time and reflects the stress relaxation capacity of asphalt binder. Higher m values indicate stronger stress relaxation capacity of asphalt and smaller probabilities of damage created by asphalt cracking [36]. The variation of the s value and the m value of the modified asphalt with GO dose are shown in Figure 4.
From Figure 4, it can be seen that different amounts of GO content have a minor impact on the fluctuations in the s and m values when the temperature is equal to −12 °C. This indicates that the effect of GO as a modifier is not significant at this temperature.
It can be seen from Figure 4a that the creep stiffness of both the matrix asphalt and GO modified asphalt increased gradually when the temperature decreased. At −18 °C and −24 °C, compared with that of the matrix asphalt, the s value of the modified asphalt is lower for smaller GO content and its value becomes larger when more GO is added. The minimum s value is obtained when the GO content is 0.5%. This variation trend indicates that a moderate amount of GO reduces the low temperature creep stiffness of the asphalt, while excessive amounts of GO weaken its toughness, increase its stiffness, and the cracking risk of the asphalt.
It can be seen from Figure 4b that the decrease in temperature causes the m-value of the matrix asphalt and GO-modified asphalt to drop. At −18 °C and −24 °C, the m-value of the GO-modified asphalt increases and reaches a maximum for a GO admixture of 0.5%. Note that the m-value at this point is higher than that of the matrix asphalt. The m-value has a decreasing trend for higher GO admixture. In addition, the m-value of the GO modified asphalt becomes lower than that of the matrix asphalt for GO concentration higher than 0.5%. The m-value trend indicates that a moderate GO amount releases the temperature stress inside the asphalt in time and the great risk of asphalt cracking may be avoided. The excessive GO amount may hinder the movement of asphalt molecules, which in turn inhibits the stress relaxation ability of GO-modified asphalt. Therefore, the stress relaxation ability of the GO modified asphalt is suppressed.
In summary, it can be seen by analyzing the s and m values that the low-temperature anti-cracking performance of the composite modified asphalt reaches its optimum when the GO dose is 0.5%.
To determine whether changing the GO content and temperature significantly affects the s and m values, the experimental data were analyzed by variance. The analysis data are shown in Table 10 and Table 11.
From the above table, it can be seen that the significance of experimental temperature (0.000) and GO doping (0.037) are less than the significance level (0.05), indicating that different levels of both experimental temperature and GO dosage have a significant effect on the s-value. That is, there is a significant difference in the s-value for both temperatures and GO dosages.
(0.000) is less than the significance level (0.05), which indicates that different levels of temperature have a significant effect on the m-value. The significance of GO dosage (0.211) is greater than the significance level (0.05), which indicates that different levels of GO dosage do not have a significant effect on the m-value.

3.2. Correlation Analysis between GO Content and Modified Asphalt Performance

3.2.1. Grey Correlation Analysis Method

Bao et al. [37] used the grey system theory correlation analysis method to analyze the data of the penetration, softening point, and ductility of the modified asphalt after compounding it with red mud and manganese slag. This enabled the analysis of the correlation between the amount of compounding admixture and the performance of asphalt.
Liu [38] used grey theory to analyze the influence of different factors on the rutting resistance performance of asphalt mixtures. A model was also developed for predicting the rutting resistance performance of asphalt mixtures as a function of the asphalt dosage, rolling frequency, and grading type. This model provides a basis and acts as a method for the rutting resistance design of asphalt pavements.
Wang [39] used grey entropy theory to quantitatively analyze the correlation between different high-temperature performance evaluation indexes of emulsified asphalt binders. Results showed that there is a good agreement between the DSR and MSCR evaluation systems. Both systems are capable of evaluating the high-temperature performance of the emulsified asphalt binders.
Xie [40] analyzed the grey correlation of various road performance factors with warm-mix recycled semi-flexible materials. It was found that the multiple factors have different degrees of influence on the road performance of warm-mix recycled semi-flexible materials and that these factors constrain each other.
All the studies mentioned above applied the widely used grey correlation analysis method to seek the main factors affecting the target value. In a system with many influencing factors, the correlation between the target value (reference series) and the influencing factors (comparison series) are calculated and sorted. The main influencing factors are then determined and the influences of the target factors on the system are evaluated.
The main steps of the grey relational analysis method are as follows:
(1)
Let the reference number column be X0.
Let X0 = {X0 (1), X0 (2), …, X0 (n)}.
(2)
Let the comparison number column be Xi
Xi = {Xi (1), Xi(2), …, Xi(n) } (i = 1, 2, 3, …, m).
(3)
Series averaging
The above sequences are then processed by removing the average value from each of the sequences respectively, and a new reference sequence Y0 and a new comparison sequence Yi are obtained.
Y0 = {Y0 (1), Y0 (2), …, Y0 (n)}
Yi = {Yi (1), Yi (2), …, Yi (n)} (i = 1, 2, 3, …, m)
In the above formula:
Y 0 n = X 0 n X 0 ¯ ,   X 0 ¯ = 1 n k = 1 n X 0 k ; Y i n = X i n X i ¯ ,   X i ¯ = 1 n k = 1 n X i k .
(4)
Correlation coefficient calculation
The correlation coefficient of the two series at time k is expressed as:
ξ i ( k ) = min i   min k Y 0 ( k ) Y i ( k ) + ζ max i   max k Y 0 k Y i k Y 0 k Y i k + ζ max i   max k Y 0 k Y i k
where k = 1,2,3,…,n, i = 1,2,3,…,m, and ζ represents the resolution factor (its value varies generally between 0 and 1, while in this paper it is considered equal to 0.5). min i   min k Y 0 k Y i k is the minimum difference between the two levels and max i   max k Y 0 k Y i k is the maximum difference between the two levels.
(5)
Correlation degree calculation
The correlation coefficient indicates only the correlation degree between the data at each moment. The correlation coefficient calculated by the entire comparison system has many values, and the information contained is distributed in a relatively scattered manner. Therefore, it is necessary to take the average of the required correlation coefficient and the averaged value is the correlation degree γ i :
γ i = 1 n k = 0 n ξ i k ( i = 1 , 2 , 3 , , m )
In the equation above, γ i in the formula represents the degree of correlation between the curve Xi (Yi) and the reference curve X0 (Y0).
The order of the correlation degree determines the importance of each influencing factor [41].

3.2.2. Grey Correlation Analysis between GO Content and Modified Asphalt Performance

In this paper, the GO content is taken as the reference series while the comparison series is the performance index value of modified asphalt. Six evaluation indexes are considered as the criteria for analyzing the performance of modified asphalt, and in the macro experiment, they are 25 °C penetration, softening point, 5 °C ductility, 135 °C Brookfield viscosity, rutting factor, and creep rate. The performance test results of GO-modified asphalt are shown in Table 12. In Table 13, the homogenized series is listed, and in Table 14 the difference between the two levels is shown. The grey correlation degree between GO content and modified asphalt performance is listed in Table 15. The correlation analysis after dimensionless treatment is listed in Table 16.
It can be seen from Table 16 that the order of the calculated correlation degree of the GO-modified asphalt is: γ2 > γ1 > γ4 > γ6 > γ3 > γ5. This indicates that softening point > penetration > 135 °C Brookfield viscosity > creep rate (−24 °C) > 5 °C ductility > rutting factor (64 °C). The above results show that the GO content has the highest correlation with the asphalt softening point, followed by the penetration, Brookfield viscosity at 135 °C, creep rate, 5 °C ductility, and rutting factor.

3.2.3. Grey Correlation Analysis of GO Content

Since the road performance of different materials cannot be modified by controlling a single variable, various factors should be considered simultaneously by selecting several factors with more significant effects. Therefore, in this study, the highest correlations of 25 °C penetration, softening point, and 135 °C Brookfield viscosity were selected as the control index of the GO content in modified asphalt. Consequently, the GO content in the modified asphalt could be determined by the following equation:
I c = I p γ 2 + I s p γ 1 + I v γ 4
where Ic is the GO content in the modified asphalt, Ip is the GO content determined by the penetration, Isp is the GO content determined by the softening point, and Iv is the GO content determined by the Brookfield viscosity at 135 °C. γ2’, γ1’, and γ4’ are the normalized values of the correlation degree corresponding to the penetration, softening point, and Brookfield viscosity at 135 °C, respectively.
The different correlation degree values are given by: γ i = γ 2 , γ 1 , γ 4 = 0.609 , 0.606 , 0.605 .
By normalizing the correlation degree, the weighting coefficients of the three indicators were determined to be 0.34, 0.33, and 0.33, respectively. Then, Equation (3) can be rewritten as follows:
I c = 0.34 I p + 0.33 I s p + 0.33 I v
To verify the reliability of Formula (4), a verification sample of the GO-modified asphalt with a content of 1.2% was made. The test results of the three indicators are shown in Table 17.
The GO content could be obtained using Formula (4), and it is equal to:
I c = 0.34 I p + 0.33 I s p + 0.33 I v = 0.34 × 1.26 % + 0.33 × 1.37 % + 0.33 × 1.31 % = 1.31 %
It can be seen from the computed results that the GO content is 1.31%. Although there is a certain deviation from the actual GO content of 1.2%, the discrepancy is lower than 1% and the deviation is smaller than the GO content determined by the single indicators of penetration, softening point, and 135 °C Brookfield viscosity. Therefore, by using multiple indicators to determine the GO content, the original loose multiple single-index determination method is transformed into a multi-index comprehensive determination method. The error obtained with the new method may thus be reduced and the analysis results are more in line with reality. These results can be used as a reference for the construction quality control of graphene-oxide-modified asphalt [41].

4. Conclusions

In this study, GO-modified asphalt is the object of the study. Viscosity experiments, three major index experiments, and rheology experiments are conducted for each group of asphalt with different GO admixtures. The correlation between GO content and these performance indexes is then analyzed using the grey correlation analysis method. Three properties with the most significant effects are investigated in depth. Finally, the interpolation method is used to verify the reliability of the newly developed determination method. This method provides useful references for the selection of GO content in GO-modified asphalt for practical applications. The main findings of this study are summarized as follows:
1.
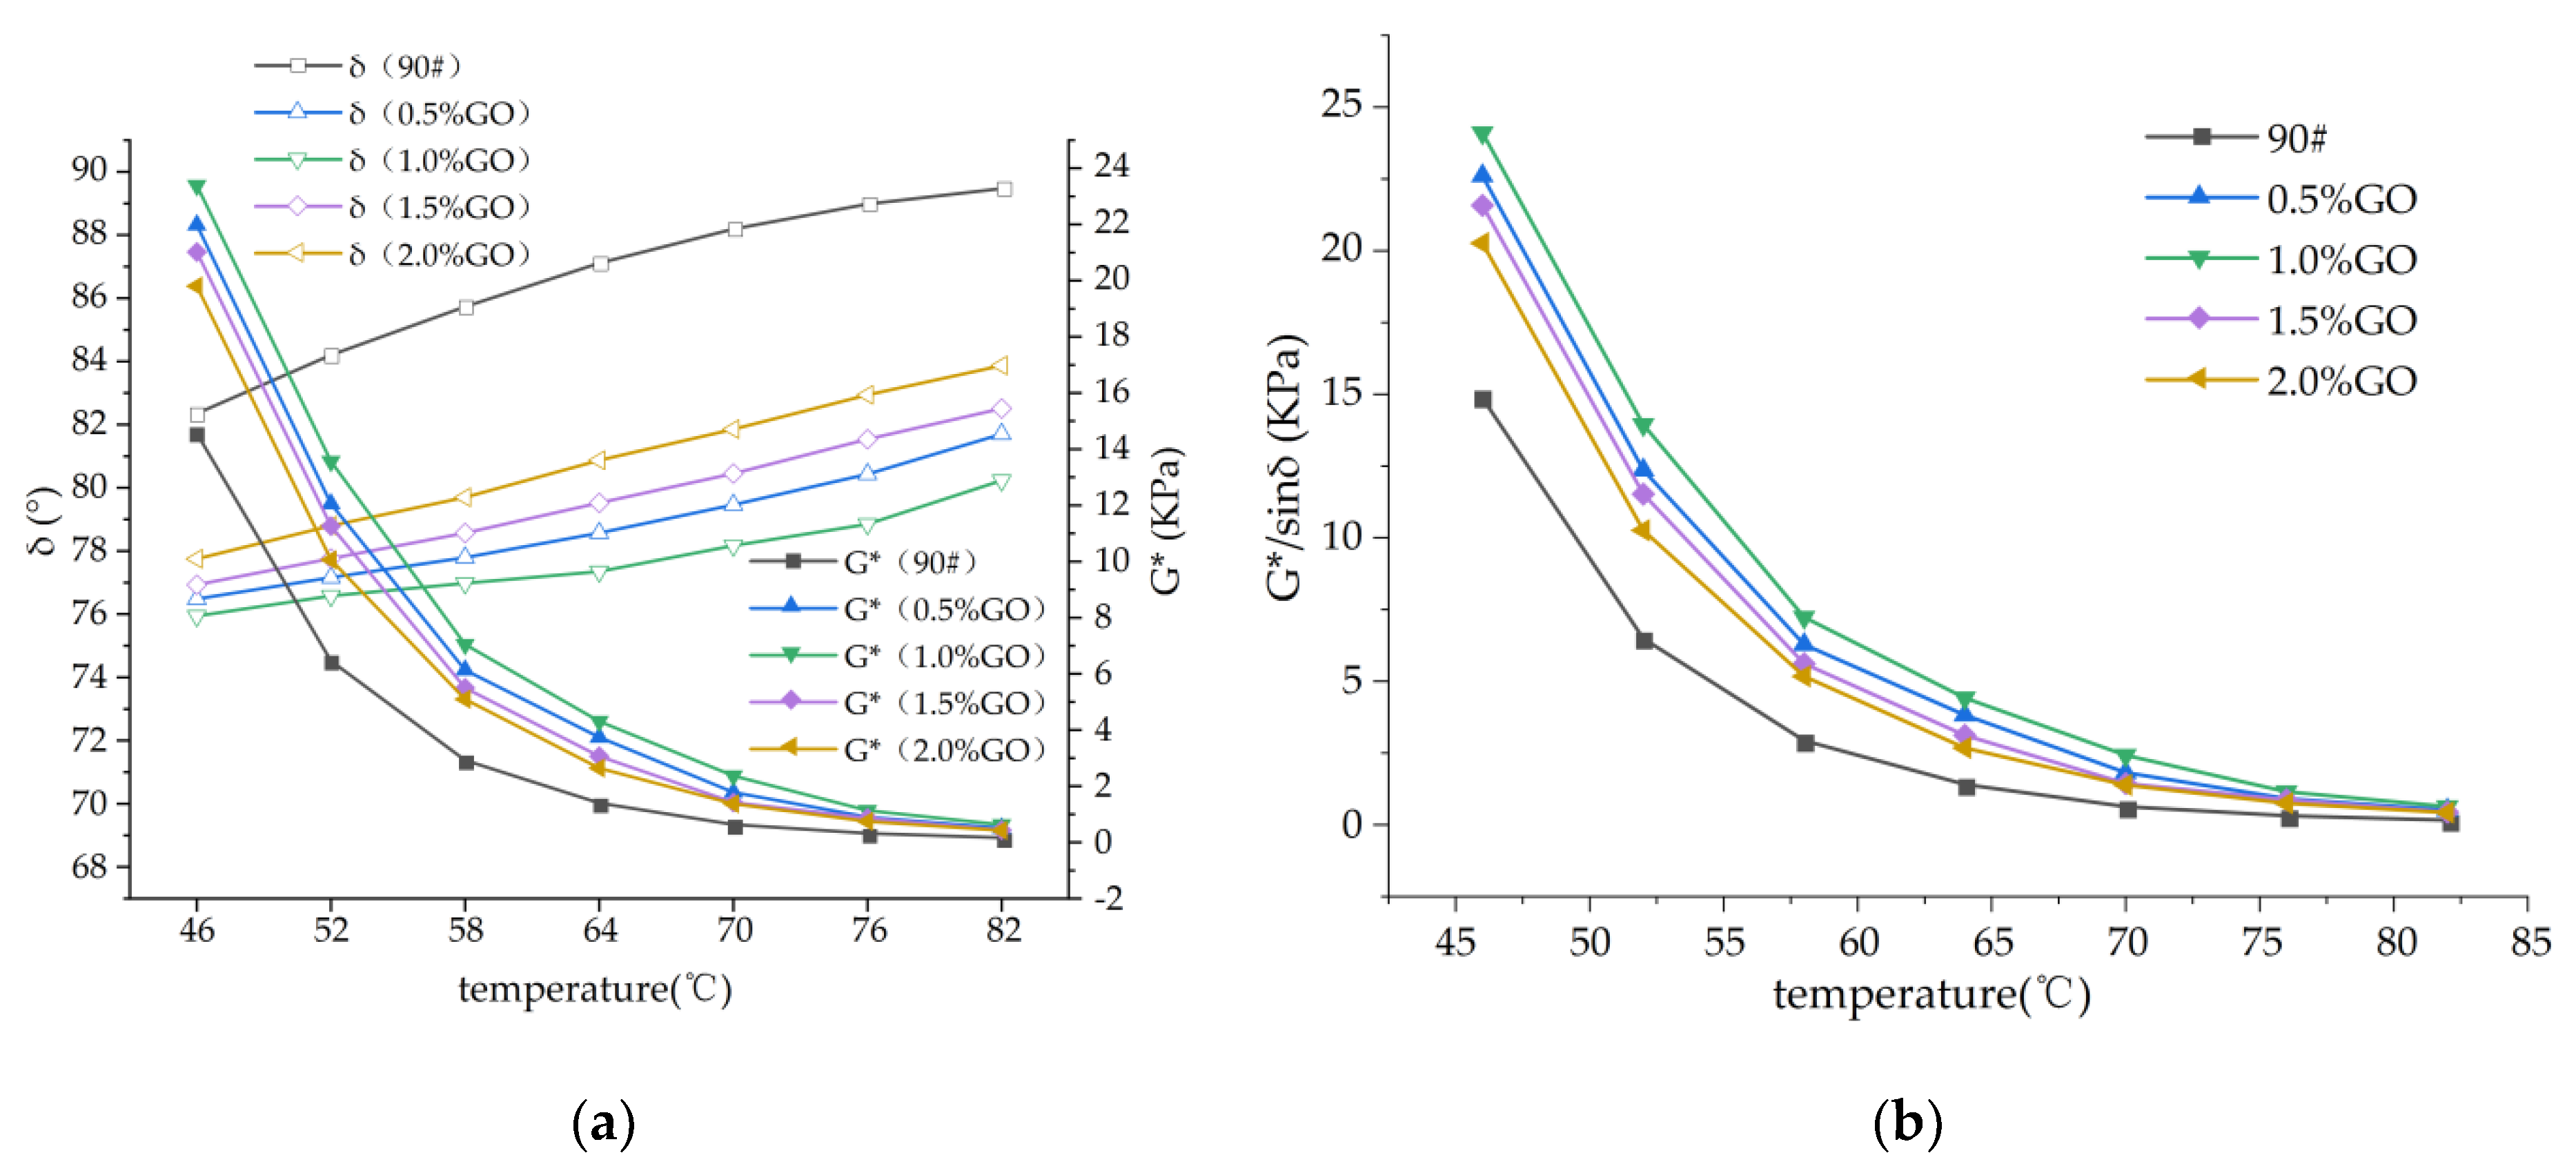
The GO addition can significantly improve the high-temperature stability and rutting resistance of asphalt binder. By comparing the results of the previous studies with the results of this study, it is shown that the best high-temperature performance of the composite modified asphalt can be obtained for a GO content of 1.0%. In addition, at this dose, the increase in the asphalt cost is limited. The high-temperature performance of the composite-modified asphalt may be greatly improved and the high-temperature rutting damage of asphalt pavements in hot areas are reduced. These improvements in the pavement performance may prolong the service life of the composite-modified asphalt which further enables it to be widely used in areas with hot weather.
2.
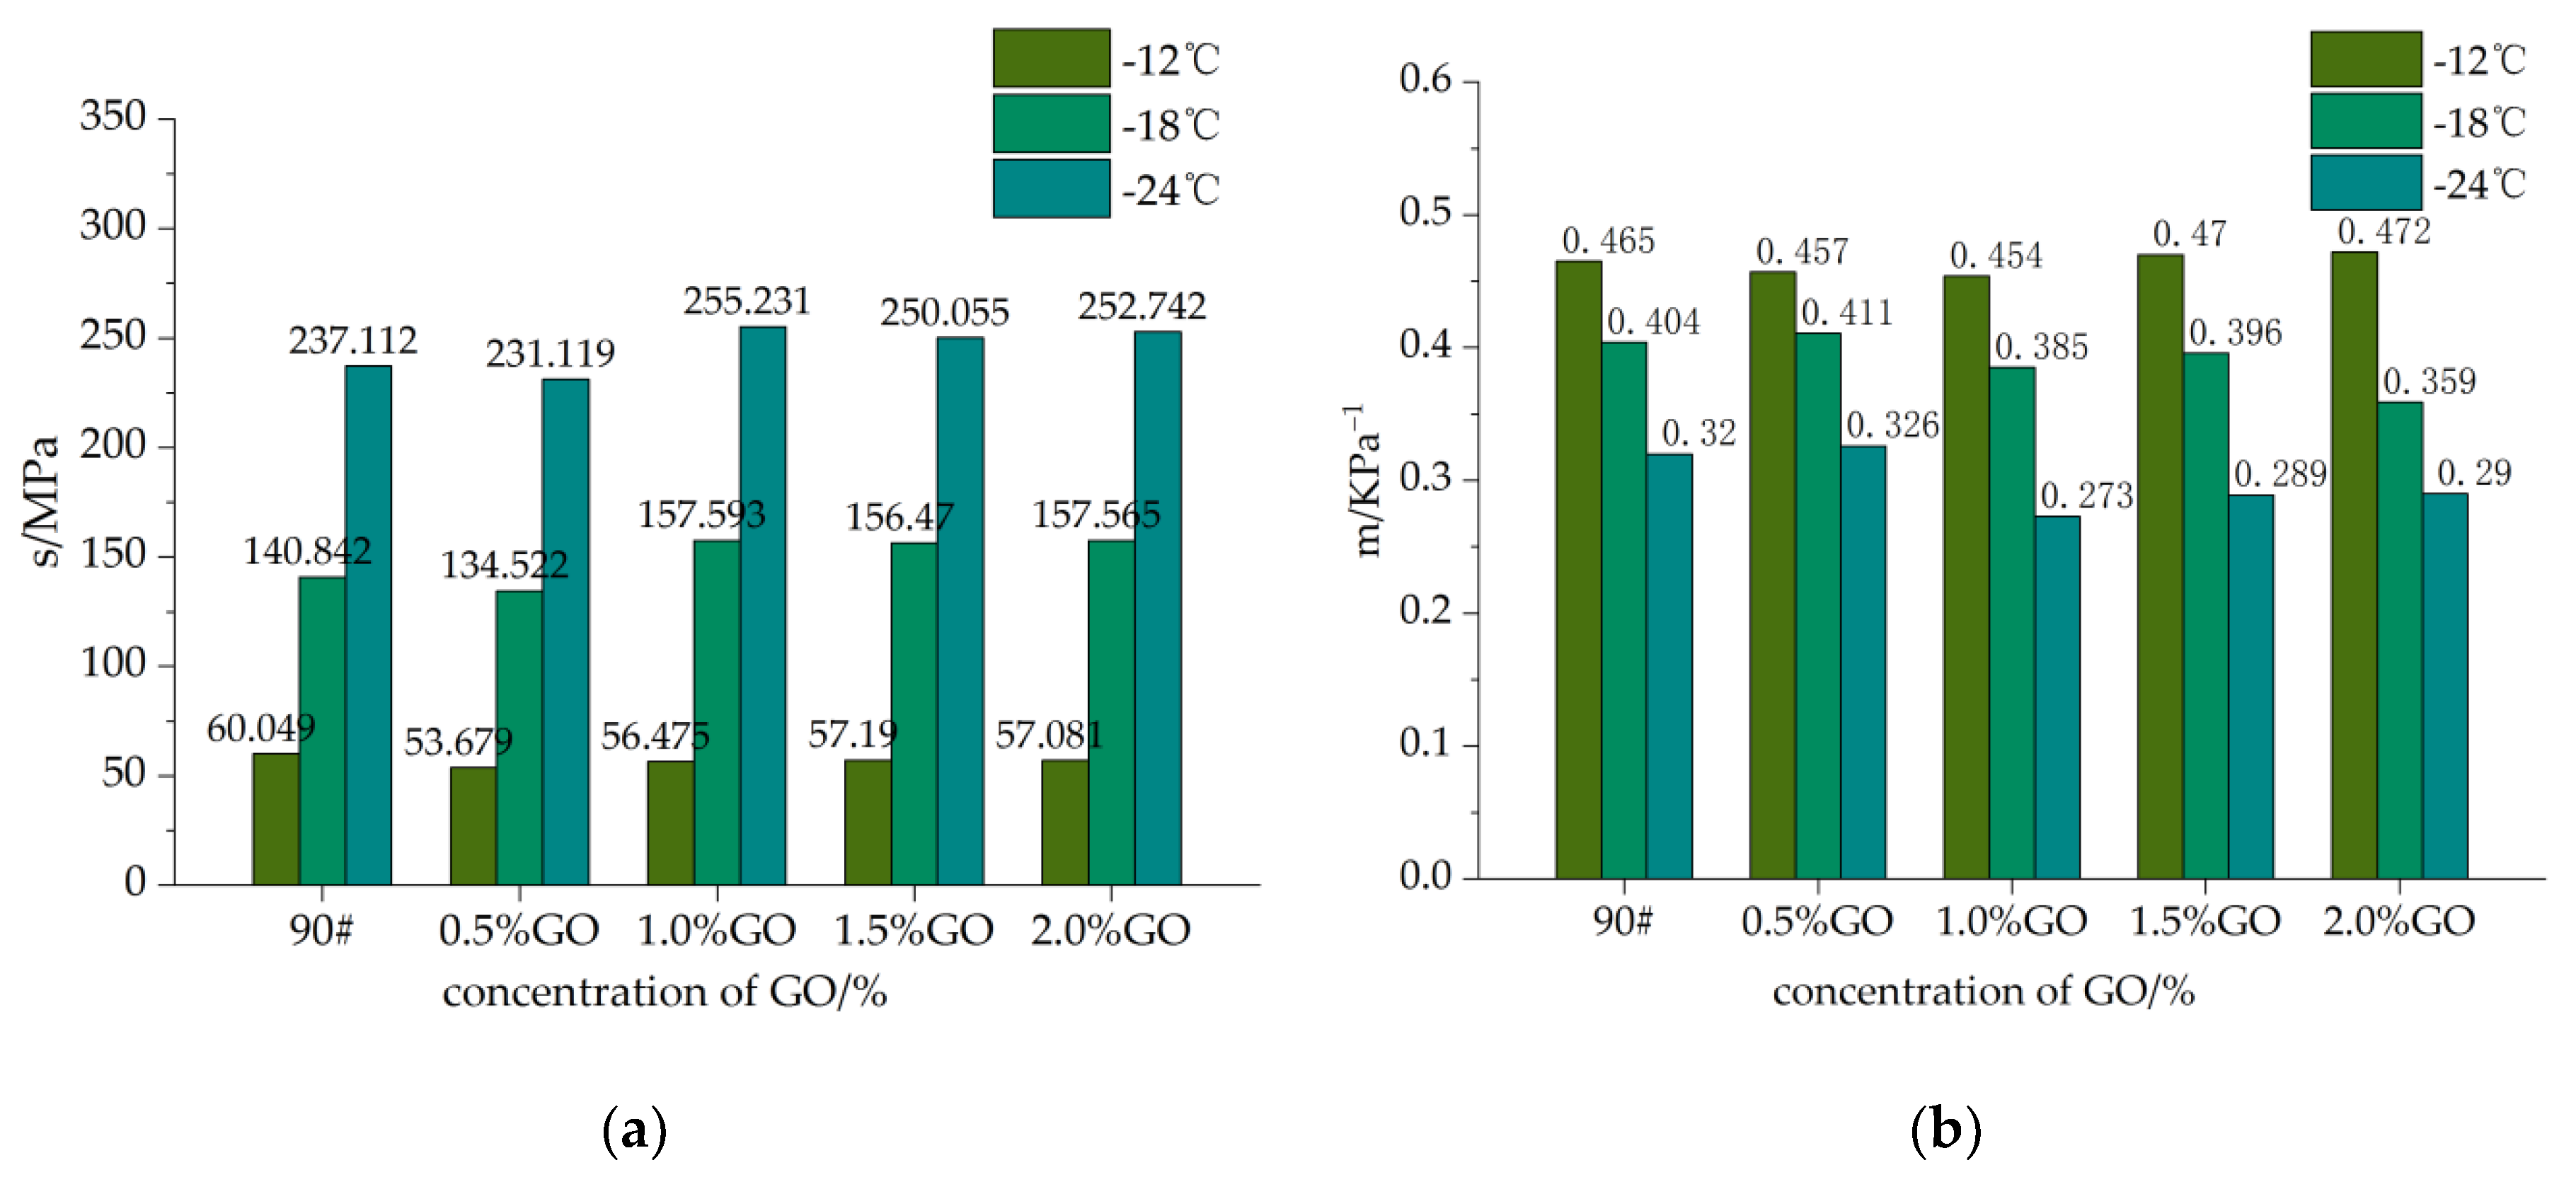
The low-temperature cracking resistance of the GO-modified asphalt is improved compared to that of the base asphalt, but the effect is limited. In practical construction applications, the GO-modified asphalt is recommended to be used at a minimum temperature of −18 °C with a careful selection of the GO content. Future research is necessary to find ways to improve the low-temperature cracking resistance of the GO-modified asphalt without adding other admixtures.
3.
The performance of GO-modified asphalt and the amount of GO content are correlated. Grey correlation analysis shows that the GO content has the highest correlation with the asphalt softening point, followed by the penetration, 135 °C Brookfield viscosity, creep rate, 5 °C ductility, and rutting factor. The method that utilizes the most correlated softening point, penetration, and 135 °C Brookfield viscosity factors, for determining the GO content in the modified asphalt results in a lower error compared to the method where a single factor is used. This indicates that the new determination method is more reasonable, and it also avoids the deviation problems caused by the determination of the GO content by a single index. Hence, the new method may serve as a reference for determining the modifier amount in practical engineering applications.
In this study, a new method is proposed for determining GO content in GO-modified asphalt as compared to the conventional method where the modifier content is determined by the macroscopic performance only. The proposed method combines the road performance test results and grey correlation analysis. A method to determine the GO content in the GO-modified asphalt is established, and it can be used as a reference for road builders’ decision-making. The study mainly analyzes the macroscopic properties of GO-modified asphalt and the correlation between the content and the performance. Future research may also employ infrared spectroscopy, scanning electron microscopy, fluorescence microscopy, and other methods to study the microscopic properties of GO-modified asphalt. Moreover, future studies should perform a grey correlation analysis of the microscopic properties in order to provide more insights into the GO-modified asphalt research area.

Author Contributions

Conceptualization, W.X.; methodology, F.W.; formal analysis, F.W.; investigation, W.X. and F.W.; resources, H.W.; data curation, F.W.; writing—original draft preparation, F.W.; writing—review and editing, F.W.; supervision, F.Z.; project administration, W.X. All authors have read and agreed to the published version of the manuscript.

Funding

This research is funded by the scientific and technological project of the Heilongjiang Provincial Department of Transportation: Research on the road performance of high-performance graphene-modified asphalt mixture in cold regions.

Institutional Review Board Statement

Not applicable.

Informed Consent Statement

Not applicable.

Data Availability Statement

The data used to support the findings of this study are included within the article.

Conflicts of Interest

The authors declare no conflict of interest.

References

  1. Tahmoorian, F.; Samali, B.; Yeaman, J. Modifified asphalt. In Evaluation of Structural and Thermal Properties of Rubber and HDPE for Utilization as Binder Modififier; IntechOpen: London, UK, 2018; pp. 109–130. [Google Scholar]
  2. García-Morales, M.; Partal, P.; Navarro, F.; Martinez-Boza, F.; Gallegos, C.; González, N.; Muñoz, M. Viscous properties and microstructure of recycled eva modifified bitumen. Fuel 2004, 83, 31–38. [Google Scholar] [CrossRef]
  3. Owaid, K.A.; Hamdoon, A.A.; Maty, R.R.; Saleh, M.Y.; Abdelzaher, M.A. Waste Polymer and Lubricating Oil Used as Asphalt Rheological Modifiers. Materials 2022, 15, 3744. [Google Scholar] [CrossRef]
  4. Ferrotti, G.; Graziani, A. Special Issue: Characterization of Innovative Asphalt Materials for Use in Pavement Design and Analysis. Materials 2022, 15, 1883. [Google Scholar] [CrossRef] [PubMed]
  5. He, J.; Hu, W.; Xiao, R.; Wang, Y.; Polaczyk, P.; Huang, B. A review on Graphene/GNPs/GO modified asphalt. Constr. Build. Mater. 2022, 330, 127222. [Google Scholar] [CrossRef]
  6. Huang, Y.; Liang, L.; Tian, Z.; Shen, P. Research and engineering application of graphene modified asphalt. New Ghemical Mater. 2020, 48, 244–248. [Google Scholar]
  7. Hu, K.; Yu, C.; Yang, Q.; Chen, Y.; Chen, G.; Ma, R. Multi–scale enhancement mechanisms of graphene oxide on styrene–butadiene–styrene modifified asphalt: An exploration from molecular dynamics simulations. Mater. Des. 2021, 208, 109901. [Google Scholar] [CrossRef]
  8. Li, S.; Xu, W.; Zhang, F.; Wu, H.; Zhao, P. Effect of Graphene Oxide on the Low-Temperature Crack Resistance of Polyurethane–SBS-Modified Asphalt and Asphalt Mixtures. Polymers 2022, 14, 453. [Google Scholar] [CrossRef]
  9. Zeng, Q.; Liu, Y.; Liu, Q.; Liu, P.; He, Y.; Zeng, Y. Preparation and modification mechanism analysis of graphene oxide modified asphalts. Constr. Build. Mater. 2020, 238, 117706. [Google Scholar] [CrossRef]
  10. Wu, S.; Xu, W.; Zhang, F.; Wu, H. Effect of Polyurethane on High- and Low-Temperature Performance of Graphene Oxide-Modified Asphalt and Analysis of the Mechanism Based on Infrared Spectrum. Coatings 2022, 12, 590. [Google Scholar] [CrossRef]
  11. Adnan, A.M.; Lü, C.; Luo, X.; Wang, J. Impact of Graphene Oxide on Zero Shear Viscosity, Fatigue Life and Low-Temperature Properties of Asphalt Binder. Materials 2021, 14, 3073. [Google Scholar] [CrossRef]
  12. Ying, Z.; Wang, H.; Shen, S.; Ye, M.; Zhang, C. Effect of Graphene Oxide (GO) on the Anti-aging Properties of Asphalt. Henan Sci. 2022, 40, 72–77. [Google Scholar]
  13. Adnan, A.M.; Luo, X.; Lü, C.; Wang, J.; Huang, Z. Improving mechanics behavior of hot mix asphalt using graphene-oxide. Constr. Build. Mater. 2020, 254, 119261. [Google Scholar] [CrossRef]
  14. Zhu, J.; Li, Q.; Liu, K. Properties of Graphene Oxide Modified Asphalt Binder. China Powder Sci. Technol. 2018, 24, 70–76. [Google Scholar]
  15. Li, Y.; Wu, S.; Amirkhanian, S. Investigation of the graphene oxide and asphalt interaction and its effect on asphalt pavement performance. Constr. Build. Mater. 2018, 165, 572–584. [Google Scholar] [CrossRef]
  16. Liu, K.; Zhang, K.; Wu, J.; Muhunthan, B.; Shi, X. Evaluation of mechanical performance and modification mechanism of asphalt modified with graphene oxide and warm mix additives. J. Clean. Prod. 2018, 193, 87–96. [Google Scholar] [CrossRef]
  17. Jin, M.; Zhang, J.; Guo, J.; Du, H. Research on Performance Prediction and Maintenance Decision of Asphalt Pavement Based on Grey System Theory. Highw. Eng. 2019, 44, 221–224. [Google Scholar]
  18. Liu, S. Grey System Theory and Its Application; Science Press: Beijing, China, 2010. [Google Scholar]
  19. Bao, H.; Fu, T.; Duan, X. Grey Correlation Analysis of Red Mud Mass Fraction and Asphalt Performance. J. Henan Univ. Sci. Technol. (Nat. Sci.) 2018, 39, 54–58. [Google Scholar]
  20. Lam, H. Investigation on the Usage of Optimum Content of Graphite Oxide for Bitumen Modification. Master’s Thesis, UTAR, Perak, Malaysia, 2015. [Google Scholar]
  21. Li, B. Rheological Properties of Graphene/Polyethylene Composite Modified Asphalt Binder. Bull. Chin. Ceram. Soc. 2021, 40, 2461–2468. [Google Scholar]
  22. Han, L.; Han, H.; Zheng, M. Vscosity-Temperature Relationship and Low Temperature Toughness of Terminal Blend Crumb Bubber-Nano-SiO2 Modified Asphalt. J. Mater. Sci. Eng. 2017, 35, 902–905. [Google Scholar]
  23. Zhu, J. Study on the Modification Mechanism of Graphene Oxide Modified Asphalt and the Road Performance of Warm Mixed Asphalt Binder and Mixtuer. Master’s Thesis, Central South University of Forestry and Technology, Changsha, China, 2020. [Google Scholar]
  24. Liu, J.; Hao, P.; Jiang, W.; Sun, B. Rheological properties of SBS modifified asphalt incorporated polyvinylpyrrolidone stabilized graphene nanoplatelets. Constr. Build. Mater. 2021, 298, 123850. [Google Scholar] [CrossRef]
  25. Lei, Y.; Wang, H.; Fini, E.H.; You, Z.; Yang, X.; Gao, J. Evaluation of the effect of bio-oil on the high-temperature performance of rubber modified asphalt. Constr. Build. Mater. 2018, 191, 692–701. [Google Scholar] [CrossRef]
  26. Zeng, Q. Preparation and Mechanism Analysis of Graphene Oxide/Asphalt Composites. Master’s Thesis, Changsha University of Science and Technology, Changsha, China, 2019. [Google Scholar]
  27. Liu, K.; Zhang, K.; Shi, X. Performance evaluation and modification mechanism analysis of asphalt binders modified by graphene oxide. Constr. Build. Mater. 2018, 163, 880–889. [Google Scholar] [CrossRef]
  28. Zhou, H.; Zhang, L. Study on Physical and Rheological Properties of Graphene Oxide Compounded SBS Modified Asphalt. J. Highw. Transp. Res. Dev. 2021, 38, 10–18. [Google Scholar]
  29. Li, P. Rheological Property of Graphene Modified Asphalt and Its Burgers Rheological Model. J. Chongqing Jiaotong Univ. (Nat. Sci.) 2020, 39, 72–77. [Google Scholar]
  30. Hou, L. Research on Rheological Properties of Nano-Graphene Modified Asphalt. J. East China Jiaotong Univ. 2018, 35, 133–137. [Google Scholar]
  31. Meng, Y.; Guo, H.; Xu, R.; Zhang, R.; Ma, C.; Wan, C. Rheological and Microscopic Properties of Graphene Rubber Composite Modified Asphal. J. Build. Mater. 2020, 23, 1246–1251. [Google Scholar]
  32. Li, X.; Wang, Y.M.; Wu, Y.L.; Wang, H.R.; Chen, M.; Sun, H.D.; Fan, L. Properties and modifification mechanism of asphalt with graphene as modififier. Constr. Build. Mater. 2021, 272, 121919. [Google Scholar] [CrossRef]
  33. Jiang, W.; Hao, P.; Zhao, Z.; Wu, T.; Li, D. Effect of PVP Modified Graphene on Rheological Properties of SBS Modified Asphalt. J. Build. Mater. 2021, 24, 385–392. [Google Scholar]
  34. Liang, P.; Liang, M.; Fan, W.; Zhang, Y.; Qian, C.; Ren, S. Improving thermo-rheological behavior and compatibility of SBR modified asphalt by addition of polyphosphoric acid (PPA). Constr. Build. Mater. 2017, 139, 183–192. [Google Scholar] [CrossRef]
  35. Guo, S.; Bing, L. Effect of Nanomaterial Combinations on Rheological and Anti-Aging Performance of SBS Modified Asphalt. J. China Foreign Highw. 2019, 39, 251–256. [Google Scholar]
  36. Lin, M.; Wang, Z.L.; Yang, P.W. Micro- structure and rheological properties of graphene oxide rubber asphalt. Nanotechnol. Rev. 2019, 8, 227–235. [Google Scholar] [CrossRef]
  37. Bao, H.; Hu, C. Grey Relational Analysis of Red Mud Compound Manganese Slag Modified Asphalt. HIGHWAY 2019, 64, 183–187. [Google Scholar]
  38. Liu, Z.; Guo, R.; Li, P.; Tang, H.; Niu, L.; Xiao, R.; Zeng, X. Grey Theory Analysis on Anti-rutting Property of Asphalt Mixture. HIGHWAY 2020, 65, 36–42. [Google Scholar]
  39. Wang, Q.; Chang, H.; Wang, D.; Hu, S.; Wang, P.; Zhang, C. Research on High-Temperature Rheological Properties of Emulsified Asphalt Mastics and Their Influencing Factors. Coatings 2022, 12, 635. [Google Scholar] [CrossRef]
  40. Xie, J.; Huang, W.; Hu, B.; Xiao, Z.; Hassan, H.M.Z.; Wu, K. Study on the Road Performance of Foamed Warm-Mixed Reclaimed Semi-Flexible Asphalt Pavement Material. Materials 2021, 14, 5379. [Google Scholar] [CrossRef]
  41. Xu, Z.; Chen, Z.; Hin, J.; Chifeng, C.; Chen, Z. Analysis on Grey Correlation of SBS Content in Modified Asphalt. J. Highw. Transp. Res. Dev. 2015, 32, 7–10. [Google Scholar]
Figure 1. Modification process of base asphalt by GO.
Coatings 12 00770 g001
Figure 2. High-temperature performance test result of asphalt samples. (a) Variation of the rheological parameters as a function of the temperature; (b) variation of the rutting factor as a function of the temperature.
Coatings 12 00770 g002
Figure 3. MSCR test result diagram of the asphalt samples. (a) Effect of the GO concentration (%) on the R value (elastic component); (b) effect of the GO concentration (%) on the Jnr value (unrecoverable creep compliance).
Coatings 12 00770 g003
Figure 4. Low-temperature performance test chart of asphalt samples; (a) effect of the GO concentration (%) on the creep stiffness (s); (b) effect of the GO concentration (%) on the creep rate (m).
Coatings 12 00770 g004
Table 1. Basic technical indicators of the 90-base asphalt used in this study.
Test IndexTest Results
Penetration (25 °C/0.1 mm)75.5
Softening Point/°C47.3
Ductility (5 °C/cm)42.1
Brookfield Viscosity (135 °C/Pa·s)0.352
Table 2. Asphalt components analyzed in this study.
Asphalt SpecimenSaturated FractionAromatic ScoreColloidAsphaltene
90-base asphalt16.5%44.8%24.1%14.6%
Table 3. Technical indicators of the graphene oxide powder used in the test.
Test IndexGraphene Oxide
AppearanceBlack powder
Oxygen Content>40%
Grain Size(μm)15–20
Number of Layers<10 floors
Table 4. Viscosity values (Pa·s) of different asphalt samples at different temperatures.
Temperature °C90#0.5%GO1.0%GO1.5%GO2.0%GO
1200.9352.2722.5742.1811.912
1350.3520.7150.8210.7520.694
1500.2560.4340.4980.4320.413
1600.1530.2770.2940.2630.246
Table 5. Tests of Between-Subjects Effects in Viscosity.
SourceType III Sum of SquaresdfMean SquareFSig.Partial Eta Squared
Corrected Model10.190 a71.45620.6430.0000.923
Intercept13.570113.570192.4270.0000.941
Temperature9.28333.09443.8810.0000.916
Dosage0.90740.2273.2140.0490.517
Error0.846120.071
Total24.60620
Corrected Total11.03619
a: R Squared = 0.923 (Adjusted R Squared = 0.879).
Table 6. Three-Major-Indices of the different asphalt samples.
Types of AsphaltPenetration (25 °C)/0.1 mmSoftening Point/°CDuctility (5 °C)/cm
90#75.547.342.1
0.5%GO70.448.926.9
1.0%GO69.151.240.5
1.5%GO71.749.534.0
2.0%GO73.449.024.0
Table 7. ANOVA of the Penetration.
-Sum of SquaresdfMean SquareFSig.
Between Groups75.420325.14047.8860.000
Within Group4.20080.525--
Total79.62011---
Table 8. ANOVA of the Softening Point.
-Sum of SquaresdfMean SquareFSig.
Between Groups23.10037.70081.0530.000
Within Group0.76080.095--
Total23.86011---
Table 9. ANOVA of the Ductility.
-Sum of SquaresdfMean SquareFSig.
Between Groups521.1223173.7074.8870.032
Within Group284.387835.548--
Total805.50911---
Table 10. Tests of Between-Subjects Effects in s.
SourceType III Sum of SquaresdfMean SquareFSig.
Corrected Model89,350.633 a614,891.772399.3410.000
Intercept339,821.47801339,821.4789112.7200.000
Temperature88,705.250244,352.6251189.3690.000
Dosage645.3834161.3464.3270.037
Error298.327837.291--
Total429,470.43915---
Corrected Total89,648.96014---
a: R Squared = 0.997 (Adjusted R Squared = 0.994).
Table 11. Tests of Between-Subjects Effects in m.
SourceType III Sum of SquaresdfMean SquareFSig.
Corrected Model0.060 a60.01245.4780.000
Intercept2.22012.2208726.4350.000
Temperature0.06820.034132.7160.000
Dosage0.00240.0001.8600.211
Error0.00280.000--
Total2.29215---
Corrected Total0.07114---
a: R Squared = 0.972 (Adjusted R Squared = 0.950).
Table 12. Performance of the GO-modified asphalt with different dosages.
X0Dosage of GO (%)00.51.01.52.0
X125 °C Penetration/(0.1 mm)75.570.469.171.773.4
X2Softening Point/°C47.348.951.249.549.0
X35 °C Ductility/cm42.126.940.534.024.0
X4135 °C Brookfield viscosity/Pa·s0.3520.7150.8210.7520.694
X5G*/sinδ (64 °C)1.4063.8224.4183.1172.677
X6Creep rate
(−24 °C)
0.3200.3260.2730.2890.290
Table 13. List of averaging processing numbers.
The Averaging Process Produces a Series
Y000.511.52
Y11.0480.9780.9590.9961.019
Y20.9620.9941.0411.0070.996
Y31.2570.8031.2091.0150.716
Y40.5281.0721.2311.1271.040
Y50.4551.2381.4311.0090.867
Y61.0671.0870.9100.9630.967
Table 14. Two-level differences.
Y 0 k Y i k
Y 0 k Y 1 k 1.0480.4780.0410.5040.981
Y 0 k Y 2 k 0.9620.4940.0410.4931.004
Y 0 k Y 3 k 1.2570.3030.2090.4851.284
Y 0 k Y 4 k 0.5280.5720.2310.3730.960
Y 0 k Y 5 k 0.4550.7380.4310.4911.133
Y 0 k Y 6 k 1.0670.5870.0900.5371.033
Table 15. Grey correlation of the performance indicators of the GO-modified asphalt with different admixtures.
ProjectsCorrelation Coefficient (ξi)
ξ10.4040.61010.5960.421
ξ20.4260.60110.6020.415
ξ30.3600.7230.8020.6060.354
ξ40.5840.5630.7820.6730.426
ξ50.6230.4950.6370.6030.385
ξ60.3990.5580.9330.5790.407
ξ10.4040.61010.5960.421
Table 16. Correlation degree analysis after dimensionless treatment.
ProjectCorrelation(γi)
25 °C Penetration/(0.1 mm)0.606
Softening Point/°C0.609
5 °C Ductility/cm0.569
135 °C Brookfield viscosity/Pa·s0.605
G*/sinδ (64 °C)0.549
Creep rate
(−24 °C)
0.575
Table 17. Experimental results of the GO-modified asphalt performance.
Dosage of GO(%)0.51.01.51.2Content Determined by Interpolation/%Absolute Error/%
25 °C Penetration/(0.1 mm)70.469.171.773.41.260.06
Softening Point/°C48.951.249.549.01.370.17
135 °C Brookfield viscosity/Pa·s0.7150.8210.7520.6941.310.11
Publisher’s Note: MDPI stays neutral with regard to jurisdictional claims in published maps and institutional affiliations.

