Abstract
Ni-based alloy powder (NiCrBSi) was applied to prepare coatings on Ti6Al4V by laser cladding to improve the wear resistance of the latter under corrosion. The scanning speed was found to be an essential parameter that could adjust the microstructure of the coatings. Changes in the microstructures of the coatings with the scanning speed were highlighted, and the relationships between the microstructures and microhardness, fracture toughness, corrosion, and corrosion wear resistance of the coatings were established. Results indicated that the matrix changes from Ti2Ni + TiNi to primary γ(Ni) + eutectics (γ(Ni) + Ni3Ti) with increasing scanning speed. Moreover, reinforcement phases changed from TiB2 + TiC (5 mm∙s−1) to TiB2 + TiC + Cr7C3 (11 mm∙s−1) to TiB2 + TiC + Cr7C3 + CrB (17 mm∙s−1). The average microhardness of the coatings first increased and then decreased, and the corresponding fracture toughness showed the opposite trend. The optimum combination of these properties was observed in the coating prepared at 11 mm∙s−1. This coating demonstrated excellent wear resistance in 3.5 wt.% NaCl solution, as well as a high corrosion potential, a low corrosion current density, and a low current density when the electrode initially entered a comparatively stable corrosion state. Moreover, compared with coatings prepared at other scanning speeds, this coating revealed a higher critical potential for oxidation film destruction. The results of this research collectively show that regulating the microstructures of laser-clad coatings by applying different scanning speeds is a feasible strategy to optimize the wear resistance of the coatings under corrosion.
1. Introduction
Ti alloys with high specific strength and excellent corrosion resistance have been widely utilized in the biocompatibility [1], aerospace [2], chemical [3], medical [4], and other fields. However, these materials are unsuitable for use in friction components, which must come into contact with other components and undergo relative motion. The alloys are generally known to show low hardness, which endows them with very poor resistance to microcutting and accelerates their failure [5,6]. Thus, surface modification, usually by preparing hard coatings over the alloys, is recommended to improve their wear resistance and expand their applications as friction components. Laser cladding, as a promising surface-modification method [7,8], has sparked great research attention on account of its outstanding features, which include tailorable microstructures and thickness and strong metallurgical binding with the substrate.
The selection of the cladding material is a crucial consideration that is directly responsible for the resultant properties of the coating. The most frequently applied materials mainly consist of Ni-based [9,10], Co-based [11,12], Fe-based [13,14], Ti-based [15,16], and equimolar [17] alloys. Nazari et al. [18] prepared a novel Ti-based coating on Ti6Al4V by laser cladding using low-cost recycled nano-crystalline Ti powder as the cladding material. The in situ synthesized Fe2O3 and Fe2C, along with TiC and TiO2 phases, significantly improved the hardness (620–815 HV) and wear resistance of the resultant coatings. Rahman Rashid et al. [19] fabricated two Ti-based coatings with a wrought Ti grade 5 plate as the substrate by laser cladding Ti6Al4V and Ti6Al4V0.04B powder. The introduction of trace B resulted in improvements in the hardness of the coatings from 390–450 HV to 510–600 HV, which is mainly attributed to the synthesis of very hard TiB precipitates. Xiang et al. [17] successfully synthesized a ternary CoNiTi medium-entropy alloy coating on pure Ti substrates by laser cladding. BCC dendrites and Ti2Ni interdendrites were observed in the coating, and a large number of Ti2Co nanoparticles precipitated inside the dendrites. The coating demonstrated a hardness of 571 ± 46 HV, which is much higher than that of the substrate (114 ± 4 HV).
Commercial Ni-based alloys are particularly favorable in laser cladding because of their outstanding advantages of high hardness, good wear resistance, and excellent corrosion resistance [20,21,22,23]. Ni-based alloys are usually composed of non-metallic elements (e.g., B, C) and metallic elements (e.g., Ni, Cr, Si). Given the good affinity between these two types of elements, some borides and carbides with high hardness can be in situ synthesized as reinforcements during cladding, thus greatly improving the resistance of the resulting Ni-based coatings to microcutting [23,24,25]. Wang et al. [26] employed Ni60 alloy powder with 5 wt.% Ti3SiC2 to modify the surface of Ti6Al4V by laser cladding. The coating obtained mainly contained γ(Ni), TixNiy, and TiC/TiB, which offer strong resistance to microcutting; specifically, the hardness of the coating was approximately 3.2-fold that of the substrate. Friction and wear tests were carried out in air at room temperature, 300 and 600 °C, and the coating demonstrated lower wear rates than the substrate at all temperatures tested (i.e., 35.96 × 10⁻⁵, 25.99 × 10⁻⁵, and 15.18 × 10⁻⁵ mm3∙N−1∙m−1 for the substrate versus 3.07 × 10⁻⁵, 1.47 × 10⁻⁵, and 0.77 × 10⁻⁵ mm3∙N−1∙m−1 for the coating); in addition, the wear rate of the coating was greatly reduced by approximately 91.46%, 94.35%, and 94.93% relative to those of the substrate. Wu et al. [27] prepared laser-clad coatings on Ti6Al4V with 80 wt.% Ni60 alloy, 2 wt.% C, 10 wt.% TiN, and 8 wt.% Mo mixed powders as the cladding material. The γ(Ni), Ni4B3, Ti(C,N), TiC, TiN, Cr2B, and Cr7C3 phases were in situ synthesized in the coatings, and the microhardness of the coating reached 1180 HV0.2, which is over 3.5 times that of the substrate (336.8 HV0.2). The wear volume (4.50 × 10⁻³ mm3∙min−1) of the coating was also reduced by 26.7 times compared with that of the substrate (120.28 × 10⁻³ mm3∙min−1). Gao et al. [28] produced a coating on Ti6Al4V by cladding a 50 wt.% NiCrBSi−20 wt.% TiN−30 wt.% WS2 mixture. The coating mainly included continuous matrix phases of γ(Ni)/TixNiy, reinforcement phases of TiNi and TiW, and a lubricant phase of TiS. The average microhardness of this coating effectively improved to 842 HV0.2 compared with that of the substrate (370.0 HV0.2). Moreover, the coating demonstrated excellent wear resistance because of its lower wear rate (10 mm3∙N−1∙m−1) compared with that of the substrate (22 mm3∙N−1∙m−1). Similar research findings have been reported in the literature [29,30,31], and all of these works confirm the good applicability of Ni-based alloys for laser cladding materials. Other Ni-based coatings, such as NiCoCrAlYSi coatings on GH4169 [32] and NiAlVNbB coatings on SUS304 [33], have also been produced.
However, despite their many benefits, previous investigations are limited by their focus on the selectivity of Ni-based alloys and other directly added ceramic phases, as well as the effect of the content of a given ceramic on the microstructural and mechanical properties of the resulting coatings [34,35]. As mentioned earlier, non-metallic and metallic elements in commercial Ni-based alloys may interact with each other to in situ synthesize high-hardness reinforcements. Although the introduction of ceramics may further improve the hardness of the coating, the cracking susceptibility of the latter may also be enhanced [36,37]. Moreover, the interface between the introduced ceramics and matrix may be contaminated and show poor compatibility, thus further aggravating the cracking susceptibility of the coating. Wear performance, as a comprehensive mechanical property, is well known to be closely associated with the resistance to microcutting and brittle debonding. The former depends on the hardness of the material, and the latter is related to the material’s cracking susceptibility. Improvements in hardness may improve the resistance to microcutting and reduce the resistance to brittle debonding resulting from high cracking susceptibility. These combined effects may cause a reduction in wear resistance, especially when the material has been in service for a long period of time [38,39,40]. Moreover, previous investigations on the wear resistance of Ni-based laser-clad coatings were performed in air [41,42], which cannot represent the service performance under more extreme circumstances, such as corrosion conditions. Therefore, research on the changes in the microstructural and mechanical properties of pure Ni-based alloy powder without directly adding ceramics by modifying the process parameters (e.g., scanning speed) is necessary. Then, an optimum combination of hardness and fracture toughness is sought, in which the outstanding wear resistance is endowed.
The present investigation aimed to fabricate coatings on Ti6Al4V via direct laser cladding of pure commercial Ni-based alloy powder (NiCrBSi) without adding any ceramic phase. Ceramic phases were synthesized in situ by the reactions occurring between non-metallic and metallic elements in NiCrBSi and Ti6Al4V to avoid the shortcomings encountered in previous investigations. The microstructure of the coatings was also flexibly regulated by modulating the scanning speed. The relationships between the microstructures and properties (e.g., hardness, fracture toughness, corrosion, and wear performance in NaCl solution) of the coatings obtained at different scanning speeds were established. Finally, the scanning speed resulting in a coating demonstrated optimal corrosion wear resistance was confirmed.
2. Materials and Methods
2.1. Preparation of the Coatings
A Ti6Al4V alloy rod measuring 50 mm diameter and 50 cm in length was used to prepare the substrate. The rod was subjected to annealing and contained a large amount of α phases and traces of β phases. The hardness of the rod was measured to be approximately 360 HV. The rod was cut into several plates measuring 50 mm in diameter and 10 mm in thickness by using a wire-cut EDM machine, and these plates were employed as substrates. The substrates were polished using 180# SiC sandpaper and then cleaned in acetone for 20 min by using an ultrasonic cleaner. The selected cladding powder (Shanghai Smick Welding Materials Co., Ltd., Shanghai, China) was a pure Ni-based alloy (F102 type: NiCrBSi) with particle sizes of 50–100 µm and chemical composition (wt.%) of 16 Cr, 4 B, 4 Si, and balance Ni. The surfaces of the substrates were coated with a thin layer of adhesive (4% polyvinyl alcohol), after which the plates were placed in a circular mold measuring 50.3 mm in inner diameter and 11.0 mm in height. The powder was filled into the voids on the substrates with approximately 50 mm in diameter and 1.0 mm in height and then compressed for 120 s under a load of 30 MPa on a BJ−30 tablet press. The complete preparation process is shown in Figure 1. Finally, a YSL−5000 fiber laser system (IPG Photonics Corporation, Oxford, MS, USA) was utilized to obtain the coatings under a power of 3 kW, spot diameter of 6 mm, and different scanning speeds (Coating 1: 5 mm∙s−1; Coating 2: 11 mm∙s−1; Coating 3: 17 mm∙s−1).
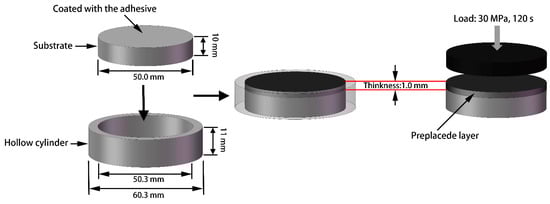
Figure 1.
The schematic drawing of the complete preparation process of the preplaced layer.
2.2. Microstructural Characterization
The phase components of the coatings were examined using a Panalytical X’ Pert Pro X-ray diffractometer (XRD) (Malvern Panalytical Co., Ltd., Shanghai, China) with Cu Kα radiation (λ = 0.1540560 nm). Morphological observation and chemical analyses were carried out on a Hitachi S−3400 scanning electron microscope (SEM) (Hitachi, Tokyo, Japan) equipped with a GENESIS EDAX energy-dispersive spectrometer (EDS) (EDAX Inc., Philadelphia, PA, USA). The high-vacuum model (no less than 0.1 MPa) was applied, and two types of detectors, namely, a secondary electron detector (≤3.0 nm at 30 kV) and a backscattered electron detector (≤4.0 nm at 30 kV), were utilized. The specimens were observed under magnifications of 500× and 2000×. Samples for metallographic observation were polished with 180−2000# sandpaper and 1.0 µm diamond paste and then etched for 35 s with a mixture containing 4 ml of deionized H2O, 6 mL of HNO3, and 0.4 mL of HF.
2.3. Mechanical Properties Tests
2.3.1. Microhardness Tests
The microhardness of polished surfaces of metallographic samples was determined with an XHD−1000TMSC/LCD Vickers hardness tester (Shanghai Taiming Optical Instrument Co., Ltd., Shanghai, China) under a load of 200 gf and a time of 15 s. The microhardness was obtained in several areas throughout the cross-section of the samples at 0.1 mm intervals. Three measurements were collected from each area, and the average of these measurements was regarded as the final result to reduce errors. A small load of 10 gf was also used to determine the microhardness of the given reinforcement.
2.3.2. Fracture Toughness Tests
The fracture toughness of the coatings was measured via the Vickers indentation method to evaluate their cracking susceptibility. First, Vickers indentations were prepared on the cross-sections of the coatings under an applied load of 3 kgf for 15 s by a HV−120 Vickers microhardness testing machine (Shanghai Material testing Machine Factory, Shanghai, China). Then, the indentations and cracks around these indentations were observed by an XTL−18A optical microscope (OM) (Shanghai Dilun Optical Instrument Co., Ltd., Shanghai, China) under a magnification of 200× to obtain the lengths of the indentation diagonal lines and cracks (Figure 2). The fracture toughness was calculated according to the following formula [43]:
where KIC denotes the fracture toughness (MPa·m1/2) of the samples, P represents the applied load (N), a is the half length of the indentation diagonal line (m), and c signifies the half length of the crack (m).
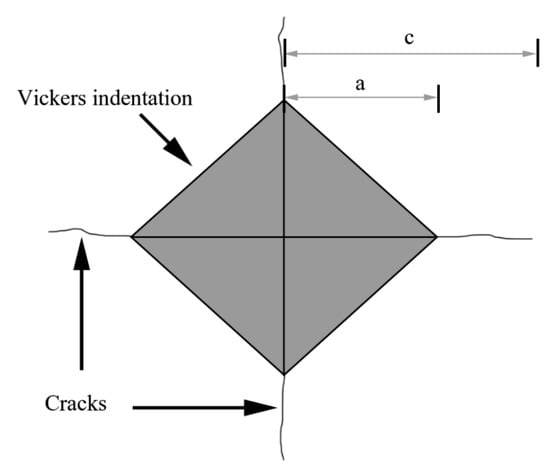
Figure 2.
Schematic diagram of the indentation.
2.3.3. Wear Tests
The wear resistance of the coatings was evaluated by a CFT-I functional friction tester in reciprocating mode with a load of 10 N, sliding time of 300 min, rotating speed of 600 rpm, and reciprocating distance of 3 mm. High-hardness Si3N4 ceramic balls with a diameter of 5 mm were chosen as the counterpart. The tests were performed in 3.5 wt.% NaCl solution. After the tests, a surface profiler (MT−500) as a kind of two-dimensional probe contact profiler with a high resolution of 0.02 μm was used to measure the wear profiles. The probe of the profiler was initially placed on a surface that was not subject to wearing, moved along the direction perpendicular to the wear tracks, and then passed through the wear tracks. The wear profiles were clearly presented on a computer monitor, and the wear volumes of the samples were automatically calculated. The whole track was divided into three equal parts, and the wear profiles of each zone was measured to reduce errors. That is to say, three wear profiles (i.e., three wear volumes) were obtained for a specific wear track. The average value was calculated as the final value of the wear track. Wear morphologies were analyzed using SEM coupled with EDS under conditions similar to those employed for microstructural observations, except that only the backscattered electron detector (≤4.0 nm at 30 kV) was utilized. Observations were conducted under magnifications of 200× and 500×. The wear rate (K) of the coatings and substrate was calculated using the following formula [44]:
where V is the wear volume (mm3), N is the applied load (N), and d is the sliding distance (m).
2.4. Electrochemical Performance Tests
The electrochemical performance of the samples was tested in the 3.5 wt.% NaCl solution at room temperature on a CHI 760E electrochemical workstation (Shanghai Chenhua Instrument Co., Ltd., Shanghai, China). The traditional three-electrode system was adopted, including the samples as the working electrode (diameter, 0.25 cm), a Pt plate as the auxiliary electrode, and a saturated calomel electrode as the reference electrode. Prior to the tests, the samples were immersed in the solution for 30 min, and the open circuit potential was measured for 400 s to obtain a stable value. Potentiodynamic polarization curves were plotted under a potential window of −0.8 to 1.0 V with a scanning speed of 1 mV∙s−1. The resultant surfaces of the samples were detected to analyze chemical valences and the contents of metallic elements in the oxidation films by using an ESCALAB 250XI X-ray photoelectron spectroscope (XPS) (Thermo Fisher Scientific, Waltham, MA, USA).
3. Results and Discussion
3.1. Microstructural Characterization
Figure 3 presents the XRD diffraction patterns of the coatings fabricated at different scanning speeds. The main peaks of Coating 1 could clearly be observed at 2θ = 36.123°, 2θ = 39.087°, 2θ = 41.560°, 2θ = 42.460°, 2θ = 44.482°, 2θ = 61.141°, and 2θ = 77.745°. Comparison of the d values of these peaks with those in the corresponding JCPDS cards confirmed that TiNi and Ti2Ni were formed as the matrix phase, while TiC and TiB2 were formed as the reinforcement phase during laser cladding. The four compounds are rich in Ti, which indicates that this element plays a dominant role in the resultant phases of the coating. The coating obtained at a scanning speed of 11 mm∙s−1 revealed an XRD diffraction pattern showing significant changes compared with that obtained for Coating 1; this finding implies that the phase constituents of these coatings have obvious differences. The indexed result shows that the matrix phases of Coating 2 are γ(Ni) and Ni3Ti, which are significantly different from those formed in Coating 1. TiB2 and TiC were still observed, along with four new peaks related to Cr7C3 at 2θ = 41.886°, 2θ = 44.242°, 2θ = 49.872°, and 2θ = 81.099°. Ni and Cr as the main elements in Coating 2 greatly influenced the phase constituents of the coating ad weakened the role of Ti. When the scanning speed was increased to 17 mm∙s−1, the XRD diffraction pattern obtained demonstrated slight changes relative to that of Coating 2. Specifically, an increase in the intensity of the main peaks associated with γ(Ni) and Cr7C3 and the appearance of some new peaks associated with CrB were found. This result implies that the cladding material plays a significant role in the phase constituents of the coating at high scanning speeds. The changes observed in the XRD patterns may be mainly attributed to increases in scanning speed, which causes great reductions in the dilution ratio (D) of the coatings. The D of all coatings could be calculated by the following formula:
where refers to the penetration depth of the melt pool below the substrate and represents the thickness of the melt pool above the original substrate level.
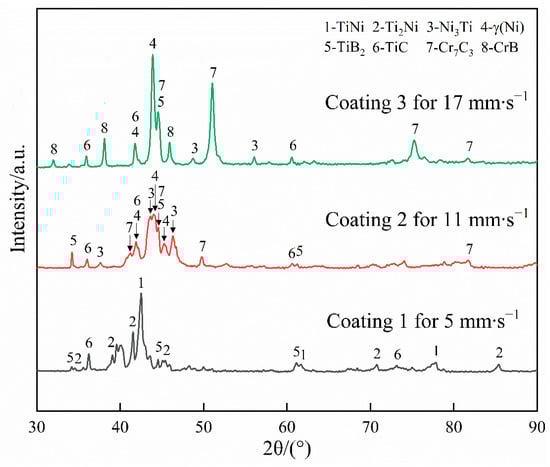
Figure 3.
X-ray diffraction patterns of the coatings.
The calculated D values show a downward trend with increasing scanning speed (Coating 1, 64.7%; Coating 2, 53.9%; Coating 3, 37.3%). Rahman Rashid et al. [45] investigated the effects of specific energy (specific energy = laser power/(scanning speed × beam diameter)) on D. The results indicated that the D of the laser-clad coatings is closely related to the specific energy; specifically, the average D of the coatings gradually increased with decreasing specific energy. This finding is contrary to the results obtained in the present research. This difference in results may be attributed to differences in the powder feeding method between the two studies. In the present study, powder layers with a constant thickness were placed on Ti6Al4V prior to laser cladding, which means the amount of molten powder was constant in all zones during laser cladding. That is to say, the specific energy could be regarded as the only essential factor responsible for D. However, the study reported in [46] delivered the powder by a coaxial nozzle during laser cladding, which means the amount of molten powder may vary at different specific energies. In addition to the specific energy, the molten powder is another factor strongly affecting D. Under the given feeding rate, beam diameter, and laser power, increases in scanning speed cause a reduction in specific energy and, in turn, a reduction in D because of the reduction in . However, the amount of molten powder correspondingly decreased, thereby causing an increase in D owing to the reduction in . When the role of the latter suppresses that of the former, D may present an upward tendency with increasing scanning speed, as reported in Ref. [46], which contradicts the findings in the present study.
The volume fractions of different phases in the three coatings were quantitatively analyzed by Highscore Plus software (Table 1). The change in phase constituents of the coatings with the scanning speed may be expected to result in the corresponding changes in mechanical properties and corrosion resistance, as discussed below.

Table 1.
The volume fractions of different phases in the coatings (vol.%).
The microstructures of the three coatings were observed under low magnification (Figure 4). As depicted in Figure 4a, some coarse black blocky particles with an average size of approximately 8 μm × 10 μm are uniformly distributed in the gray matrix of Coating 1. The gray matrix is composed of two distinct phases. Clear inspection reveals that a small number of fine dendrites adhere to the surfaces of blocky particles. As the scanning speed increased to 11 mm∙s−1, the microstructure of Coating 2 (Figure 4b) presented a slight change relative to that of Coating 1; here, a large number of light-gray honeycomb-like structures, as well as some separated dark-gray phases, were observed. The microstructure of Coating 3 (Figure 4c) demonstrated significant differences compared with the first two coatings with further increases in the scanning speed. In this case, the blocky particles presented a downward trend in number as well as the synthesis of strip-like particles.
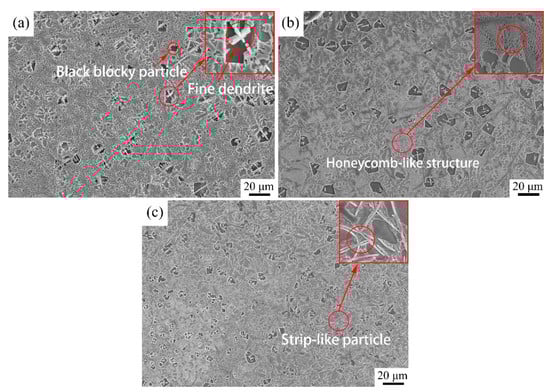
Figure 4.
Microstructure of the coatings: (a) Coating 1 for 5 mm∙s−1; (b) Coating 2 for 11 mm∙s−1; (c) Coating 3 for 17 mm∙s−1.
High-magnification SEM images and the corresponding EDS analyses were obtained to identify the categories and morphologies of the different phases of the coatings (Figure 5, Table 2). Coating 1 shows four phases (Figure 5(a1,a2)), which correspond to the protrusion phase (marked A), the depression phase (marked B), coarse black blocky particles (marked C), and fine dendrites (marked D). The EDS analysis results indicate that Zones A and B are rich in Ti and Ni; small amounts of Al, Si, and Cr could also be detected. Combining these findings with the XRD results, the two phases may be concluded to be two secondary solid solutions with Ti-N compounds as the solvent and Al, Si, and Cr as the solute. Cr and Al are closer to Ti and Si is closer to Ni in terms of atomic radius and electronegativity (atomic radius: 1.85, 1.82, and 2.00 Å for Cr, Al, and Ti, respectively; 1.46 and 1.62 Å for Si and Ni, respectively; electronegativity: 1.66, 1.61, and 1.54 for Cr, Al, and Ti, respectively; 1.90 and 1.92 for Si and Ni, respectively). Therefore, Cr and Al atoms could substitute Ti atoms, while Si atoms could displace Ni atoms in the lattices of the Ti-N compounds. The calculation results demonstrate that the atomic ratios of Ti + Cr + Al and Ni + Si in Zones A and B are 2.1:1 and 0.9:1, respectively. The two phases could be identified as Ti2Ni and TiNi secondary solid solutions. Zone C is rich in Ti and B, and Zone D mainly consists of Ti and C. The black blocky phase and fine dendrites are likely TiB2 and TiC. These results correspond well with those obtained from the XRD analyses. In addition to blocky TiB2 particles and fine TiC dendrites, a new coarse strip-like phase (marked G) was synthesized in Coating 2 (Figure 5(b1,b2)). The reinforcement is rich in C and Cr and was determined to be Cr7C3 via the XRD results. In addition to the equiaxed phase (marked E), a honeycomb-like structure (marked F) was also synthesized in the matrix; this structure was not observed in Coating 1. A magnified backscattered electron (BSE) image of Zone F indicates that the honeycomb-like structure is mainly composed of light-gray reticular phases, among which a small number of dark-gray phases are located. The dark-gray and equiaxed phases have approximately the same atomic number contrast, which implies that they belong to a single phase. Zone E contains a large amount of Ni of approximately 60 at.%, which is slightly higher than that in the honeycomb-like structure (approximately 54 at.%). Combining the XRD results with the Ti-Ni binary phase diagram, the equiaxed phase may be concluded to be primary γ(Ni), and the honeycomb-like structure can be identified as the eutecticum of γ(Ni) + Ni3Ti. When the scanning speed is increased to 17 mm∙s−1, the volume fraction of γ(Ni) gradually increases, and the volume fraction of the eutecticum correspondingly decreases. This change may be mainly associated with the increase in Ni content in the coatings due to weaker dilution at higher scanning speeds. Other fine strip-like particles (marked H) rich in Cr and B appeared to be in situ synthesized in Coating 3 (Figure 5(c1,c2)); these particles were identified as CrB by XRD. The area fractions of these phases are shown in Table 3. It can be seen that the results are approximately similar to those shown in Table 1. The slight changes should be attributed to the differences in the used unit; namely, the used units in Table 1 and Table 3 are the volume fraction and the area fraction, respectively.
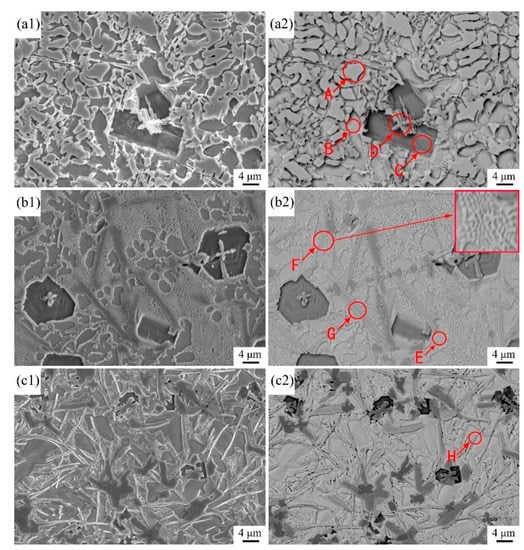
Figure 5.
SEM and BSE image of cross-sectional microstructure of the coatings: (a1,a2) Coating 1 for 5 mm∙s−1; (b1,b2) Coating 2 for 11 mm∙s−1; (c1,c2) Coating 3 for 17 mm∙s−1.
Table 2.
EDS results of different zones in the coatings in Figure 5 (at.%).
Table 3.
The area fraction of different phases in the coatings (ar.%).
3.2. Mechanical Properties
3.2.1. Microhardness Distribution along the Depth Direction of the Coatings
The microhardness distribution along the cross-sections of the coatings is indicated in Figure 6. The cross-sections are classified into three zones on the basis of the observed changes in microhardness, namely the coating, the transition zone, and the substrate. The average microhardness of the coatings is between 877.3 and 1030.5 HV0.2, which is enhanced by approximately 144%–186% compared with that of the substrate (≈360 HV0.2). This significant improvement in microhardness is mainly attributed to the dispersive strengthening provided by a large number of in situ synthesized reinforcements, supersaturated solid solution, and fine-grain strengthening from the rapid heating and cooling of the laser cladding. This result also means that the soft substrate may be endowed with excellent resistance to microcutting during wear via the laser cladding of a hard coating. The microhardness of the coatings shows slight fluctuations, thus implying that the microstructures are comparatively uniform throughout the whole zone. Close observation reveals that the thickness of the coatings presents a downward trend with increasing scanning speed from 2.290 to 1.700 mm and then to 1.120 mm. However, the average microhardness first increases and then decreases. The average microhardness is approximately 877.3 HV0.2 for Coating 1, increases to 1030.5 HV0.2 for Coating 2, and then decreases to 975.2 HV0.2 for Coatings 3. The phenomenon is closely associated with the change in volume fraction and category of the reinforcements with increasing scanning speed. As the scanning speed increases, the change in phase constituents of the coatings may be described as follows: Ti2Ni (56.50 ar.%) + TiNi (30.00 ar.%) + TiB2 (6.56 ar.%) + TiC (6.94 ar.%) for Coating 1 → Ni3Ti (21.92 ar.%) + γ(Ni) (58.57 ar.%) + TiB2 (10.64 ar.%) + TiC (5.34 ar.%) + Cr7C3 (3.53 ar.%) for Coating 2 → Ni3Ti (10.84 ar.%) + γ(Ni) (69.38 ar.%) + TiB2 (6.96 ar.%) + TiC (5.01 ar.%) + Cr7C3/CrB (7.81 ar.%) for Coating 3. The microhardness of Ti2Ni, TiNi, TiB2, TiC, TiNi3, γ(Ni), Cr7C3, and CrB in the coatings was tested by applying a small load of 10 gf and was found to be 616.9, 387.5, 2208.0, 1713.7, 831.2, 617.1, 1238.5, and 1409.0 HV0.01, respectively. Coating 1 reveals the highest area fraction of matrix phases, the microhardness of which is fairly low. Thus, the microhardness of this coating is also low. When the scanning speed is increased to 11 mm∙s−1, the matrix phases are transformed into γ(Ni) and Ni3Ti, which have higher microhardness, and more TiB2 with excellent microhardness is synthesized in Coating 2; thus, the average microhardness of this coating dramatically increases to 1030.5 HV0.2. The ratio of the area fractions of the matrix phases and reinforcements is nearly unchanged between Coating 2 and Coating 3; however, the area fraction of γ(Ni), with a low microhardness, increases, whereas that of TiB2 decreases in Coating 3. Hence, the average microhardness of Coating 3 is reduced to a certain extent compared with that of Coating 2.
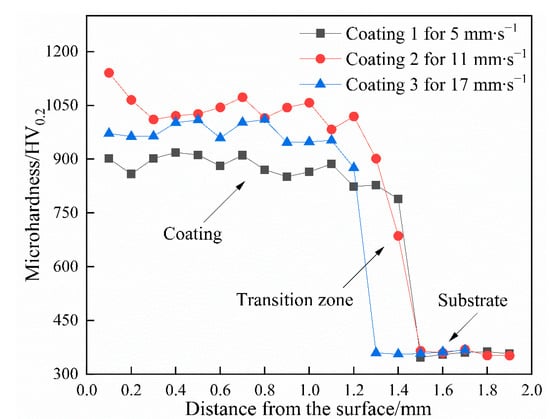
Figure 6.
The microhardness distribution along the cross-sections of the coatings.
3.2.2. Fracture Toughness of the Coatings
Figure 7 indicates the morphologies of indentations prepared on the cross-sections of the coatings. Some cracks could clearly be observed around the angles of the indentations because the strong stress concentration generated at these angles cannot be sufficiently released by plastic deformation. According to Equation (1), the fracture toughness of the coatings could be calculated as shown in Table 4. The average fracture toughness values of Coatings 1, 2, and 3 are 4.813, 4.428, and 5.448 MPa·m1/2, respectively, thereby indicating that the cracking susceptibility of the coatings first decreases and then increases with increasing scanning speed. This change trend contradicts the change trend of microhardness.
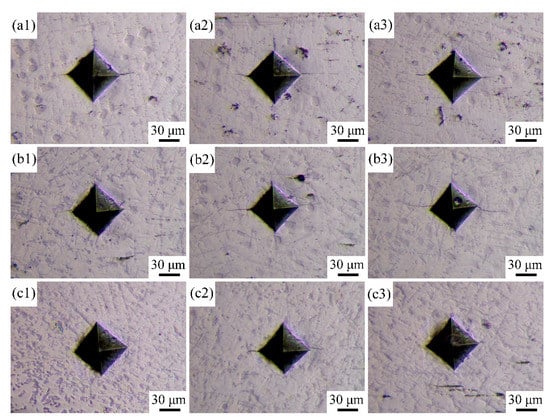
Figure 7.
OM images of the indentations of the coatings: (a1–a3) Coating 1 for 5 mm∙s−1; (b1–b3) Coating 2 for 11 mm∙s−1; (c1–c3) Coating 3 for 17 mm∙s−1.
Table 4.
The fracture toughness of the coatings.
3.2.3. Corrosion Wear Resistance
Figure 8 illustrates the friction coefficient of the coatings and substrate as a function of sliding time in 3.5 wt.% NaCl solution. Compared with that of the coatings, the friction coefficient of the substrate changes more obviously with prolonging the sliding time. The average friction coefficient of the substrate, at approximately 0.729, is also much higher than those of the coatings. The average friction coefficients of Coatings 1 and 2 are 0.511 and 0.537, respectively. When the scanning speed is increased to 17 mm∙s−1, the average friction coefficient of Coating 3 is reduced to 0.338. This change may be related to the increase in area fraction of γ(Ni) with increasing scanning speed. These results imply that the coatings produced on Ti6Al4V may show antifriction effects to a certain extent. The representative wear profiles of those samples are shown in Figure 9. The test results indicate that the average wear volumes of the substrate and coatings are 8.3017 (Substrate), 0.2417 (Coating 1), 0.1163 (Coating 2), and 0.1364 mm3 (Coating 3); the corresponding wear rates are 7.69 × 10⁻⁴ (Substrate), 2.24 × 10⁻⁵ (Coating 1), 1.08 × 10⁻⁵ (Coating 2), and 1.26 × 10⁻⁵ mm3∙N−1∙m−1 (Coating 3). The average wear rate of the coating (approximately 1.53 × 10⁻⁵ mm3∙N−1∙m−1) is significantly reduced by 98.01% when compared with that of the substrate, thereby demonstrating that the coatings possess outstanding wear resistance. The wear volume of the coatings first decreased and then increased with increasing scanning speed because of the synergistic effects of microhardness and fracture toughness on wear resistance. Improvements in microhardness could endow the samples with better resistance to microcutting and reduce their wear volume. In addition, the resistance to brittle debonding decreases because of the reduction in fracture toughness, which results in an increase in wear volume. Therefore, a sample with a suitable combination of microhardness and fracture toughness may reasonably be expected to produce optimal wear resistance. The wear loss of Coating 1 mainly originates from microcutting because of its low microhardness. The stress concentration generated in the coating during sliding can be effectively released by plastic deformation, which means that the wear loss from brittle debonding may be negligible. When the scanning speed is enhanced to 11 mm∙s−1, the microhardness increases from 877.3 to 1030.5 HV0.2 and the fracture toughness decreases from 5.448 to 4.428. The former reduces the wear volume because of improvements in resistance to microcutting; however, the latter produces the exact opposite effect because of the reduction in resistance to brittle debonding. Overall, the wear volume is still reduced because the former plays the dominant role in wear resistance. However, the wear loss resulting from brittle debonding is not negligible. Coating 3, which presents a lower microhardness compared with Coating 2, demonstrates a higher wear volume, which indicates that the increase in wear loss due to reductions in the coating’s resistance to microcutting cannot be sufficiently compensated by decreases in wear loss from resistance to brittle debonding.
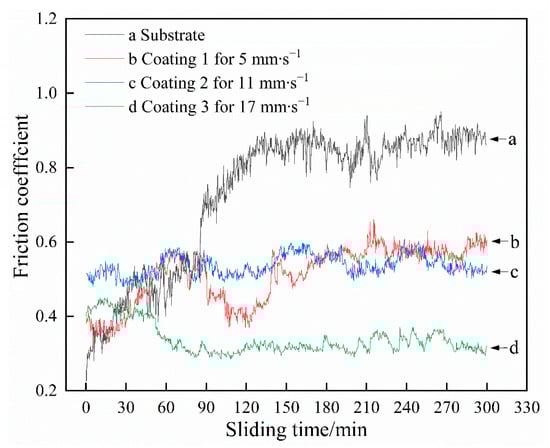
Figure 8.
Variation of friction coefficient of the samples with sliding time in the 3.5 wt.% NaCl solution.
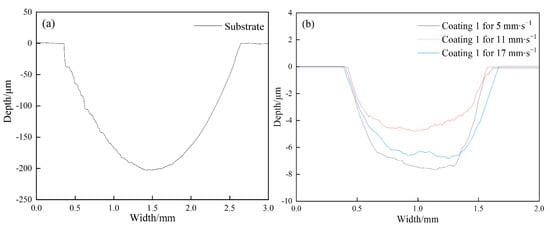
Figure 9.
Representative wear profiles of substrate (a) and the coatings (b).
Figure 10 illustrates the wear morphologies of the samples. As shown in Figure 10(a1,a2), a large number of furrows with different widths are distributed parallel to the sliding direction on the worn surface of the substrate. Some of these furrows may originate from microcutting due to the sharp protrusions of the counterpart (Si3N4), while others may be attributed to the plastic deformation of the substrate from the blunt protrusions of Si3N4. Several blocky dark-gray substances, which are mainly composed of Ti and O according to the EDS results, also adhere to the substrate surface. These substances reflect the debris decoupled from the substrate surface. Some debris particles cluster together and form loose films (Zone A), while others are rolled into dense films under the applied load (Zone B). According to the morphological analyses, the wear mechanism of the substrate can be identified as the combination of microcutting and oxidation.
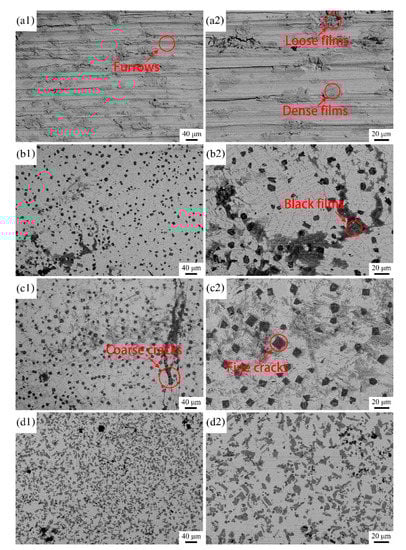
Figure 10.
BSE images of the worn morphologies of the samples: (a1,a2) substrate; (b1,b2) Coating 1 for 5 mm·s−1; (c1,c2) Coating 2 for 11 mm·s−1; (d1,d2) Coating 3 for 17 mm·s−1.
The worn surfaces of the coatings are considerably smoother compared with that of the substrate, which means that the coatings experience slight loss during sliding. Figure 10(b1,b2) show that partial zones of the worn surface of Coating 1 are covered with black films. These films are rich in O (64.54 at.%), as well as elements from the coating, thereby indicating that they also originate from the debris falling off the coating surface. Clear inspection reveals that a portion of the films is exfoliated from the worn surface, leaving chipping pits with rough surfaces and clear edges. Thus, the films left on the worn surface of Coating 1 are much less than those on the worn surface of the substrate. Such a phenomenon is mainly associated with significant differences in mechanical properties between the coating and the substrate. The coating has higher microhardness and lower plasticity than the substrate, which means that debris is more likely to be embedded into the substrate surface and rolled into denser films with stronger bonding ability to the substrate. The brittle films composed of the coating debris tend to break into fragments and debond from the worn surface. In addition to adherent films and chipping pits, a small number of fine furrows can be observed on the worn surface of the coating. Therefore, the wear mechanism of this coating involves the combination of slight microcutting, oxidation, and brittle debonding. Compared with that of Coating 1, the worn surface of Coating 1 presents remarkable differences (Figure 10(c1,c2)). Intact and thick films are difficult to form on the worn surface because of the high microhardness and low fracture toughness of Coating 2. Furrows could barely be observed, which means that this coating is strongly resistant to microcutting. Some coarse cracks are initiated and propagate along the worn surface, and many fine cracks are observed in the inner regions of the blocky TiB particles, which is likely due to the high cracking susceptibility of Coating 2. Sliding produces high levels of stress concentration in TiB2 particles, and this stress cannot easily be released by the plastic deformation of the matrix because of its low plasticity. Consequently, cracks are initiated and propagate in the inner region of TiB2 particles and the interface between TiB2 and the matrix, which may cause brittle debonding of the coating. Therefore, the wear mechanism of Coating 2 involves the combination of minimal microcutting, oxidation, and moderate brittle debonding. The surface wear morphology of Coating 3 (Figure 10(d1,d2)) is very similar to that of Coating 1, thereby implying that the wear loss in Coating 3 mainly originates from slight microcutting and oxidation owing to its relatively low microhardness. Thus, considering that the results of corrosion wear are concerning, 11 mm∙s−1 is the optimal scanning speed to prepare Ni-based coatings on Ti6Al4V by laser cladding.
3.3. Corrosion Performance
Figure 11 shows the potentiodynamic polarization curves of the coatings and substrate in 3.5 wt.% NaCl solution. Some parameters (Table 5), such as corrosion potential (Ecorr), corrosion current density (icorr), and current density (is) in the active and comparatively stable corrosion state can be acquired from Figure 11.
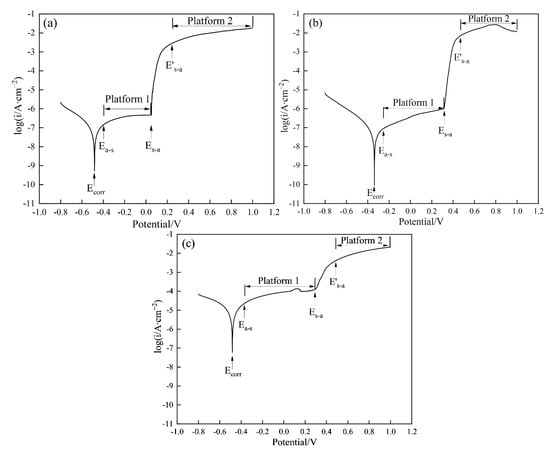
Figure 11.
Potentiodynamic polarization curves of the Coatings in the 3.5 wt.% NaCl solution ((a) Coating 1 for 5 mm∙s−1; (b) Coating 2 for 11 mm∙s−1; (c) Coating 3 for 17 mm∙s−1).
Table 5.
Electrochemical parameters obtained from Figure 11.
Among the coatings obtained, Coating 2 possesses the most positive Ecorr. Ecorr refers to the potential at which the material reaches a stable corrosion state; this parameter can be applied to characterize the tendency of a material to corrode in a corrosion system. A material with low Ecorr is more inclined to act as a cathode in a galvanic cell without an applied voltage and suffer from serious corrosion by losing electrons when compared with that with a high Ecorr. Therefore, in terms of Ecorr, Coating 2 demonstrates the best corrosion resistance among the three coatings. Coating 2 also demonstrates the lowest icorr among the three coatings. icorr, which refers to the corrosion current density at Ecorr, is used to characterize the corrosion rate of a material. Therefore, in terms of icorr, the corrosion resistance of Coating 2 is also superior to those of Coatings 1 and 3. Changes in Ecorr and icorr may be attributed to differences in the composition and phases of the samples. When the applied potential exceeds Ecorr, the electrode surface enters the active state because is rapidly increases as the potential increases. These phenomena promote oxidation reactions on the electrode surface, which releases metals in their ionic form to the electrolyte. As the potential further increases, is increases slowly and finally reaches a comparatively stable value, thus indicating that the electrode enters a comparatively stable corrosion state. The transformation from active state to comparatively stable corrosion state is closely related to the formation of a thin and dense oxidation film formed on the electrode surface, which isolates the material from the electrode and greatly retards the release rate of metal ions. The formation preference of the passive film can be evaluated by assessing differences between Ecorr and the critical potential (Ea-s) as the electrode transforms from the active state to the comparatively stable corrosion state. As shown in Table 5, the Ea-s − Ecorr values of the coatings show the trend Coating 3 > Coating 1 > Coating 2, thus indicating that the oxidation film is more easily formed on the surface of Coating 2 than on the surfaces of the two other coatings. The corrosion rate in the comparatively stable corrosion state can be described by is, which is the average value of all current densities obtained in Platform 1, as shown in Figure 11. The results of is demonstrated the following order: Coating 2 (3.664 × 10⁻⁷ A∙cm−2) ≈ Coating 1 (3.500 × 10⁻⁷ A∙cm−2) < Coating 3 (7.345 × 10⁻⁵ A∙cm−2). These results indicate that Coating 2 possesses the lowest corrosion rate in the comparatively stable corrosion state. When the potential exceeds another critical potential (Es-a), is is sharply enhanced with increasing potential, thereby indicating that the electrode enters the active state once more because a portion of the oxidation film suffers from destruction. Coating 2 clearly demonstrates a higher Es-a (0.313 V) compared with those of Coating 1 (0.050 V) and Coating 3 (0.290 V), which means that the oxidation film formed on Coating 2 is more stable than those formed on the other coatings. Further increases in potential clearly identify a third critical potential (E’s-a), beyond which the electrode enters a second comparatively stable corrosion state because of the repair of the damaged oxidation film. The is of the three coatings in this state is similar (approximately 1.093 × 10⁻² A∙cm−2), which corresponds to the average value in Platform 2. Thus, according to the above analyses, Coating 2 exhibits greater corrosion resistance than Coating 1 or Coating 3.
XPS was applied to detect the elemental composition and corresponding valences of the oxidation film formed on Coating 2 to reveal the passive mechanism of the electrode, as shown in Figure 12. Figure 12a shows the XPS survey spectrum of the oxidation film formed on Coating 2. The oxidation film is composed of Ni, Al, Ti, Cr, Si, and O. Then, the high-resolution narrow spectra of these metal elements were obtained to detect their valence states. Four strong peaks at 855.57, 873.21, 861.09, and 879.72 eV were clearly detected in the Ni2p spectrum (Figure 12b), which fit the standard peaks of Ni in NiO well. The strong peak at 74.49 eV in the Al2p spectrum (Figure 12c) confirms the existence of Al2O3. Two strong peaks at 458.43 eV and 464.63 eV in the Ti2p spectrum (Figure 12d) prove the presence of TiO2 in the oxidation film. Two obvious peaks at 576.57 and 585.93 eV, which are highly consistent with the binding energies of Cr in Cr2O3, could be detected in the Cr2p spectrum (Figure 12e). The clear peak with a binding energy of 101.95 eV in Figure 12f confirms the existence of SiO2. According to the above analyses, the oxidation film may be concluded to be mainly composed of NiO, Al2O3, TiO2, Cr2O3, and SiO2. The molar fraction of oxides in the coatings can be calculated from the XPS results (Table 6). As the scanning speed increased, the contents of TiO2 and Al2O3 demonstrated a gradual downward trend, whereas the contents of NiO, Cr2O3, and SiO2 revealed an upward trend due to reductions in the dilution rate of the coatings.

Figure 12.
XPS spectra of the oxide film formed on the surface of Coating 2 for 11 mm∙s−1: (a) Survey; (b) Ni2p; (c) Al2p; (d) Ti2p; (e) Cr2p; (f) Si2p.
Table 6.
Oxides contents in the oxidation film formed on the coatings (at.%).
Differences in the formation preference of the oxidation film among the samples may be reasonably explained by thermodynamic calculations. According to the XPS results, the following reactions occur during oxidation:
Ti + O2 = TiO2
4Al + 3O2 = 2Al2O3
2Ni + O2 = 2NiO
4Cr + 3O2 = 2Cr2O3
Si + O2 = SiO2.
The change in the standard Gibbs free energy (ΔGθ) at room temperature (approximately 298 K) can be calculated as −889.53 KJ∙mol−1 for Reaction (4), −3163.88 KJ∙mol−1 for Reaction (5), −424.90 KJ∙mol−1 for Reaction (6), −2096.35 KJ∙mol−1 for Reaction (7), and −856.50 KJ∙mol−1 for Reaction (8). As the ΔGθ of all reactions is negative, these reactions spontaneously occur. The reaction order in terms of thermodynamics is Reaction (5) > Reaction (7) > Reaction (4) > Reaction (8) > Reaction (6). Given the calculated results of ΔGθ, determining which sample the oxidation film preferentially forms on is very difficult.
The compactness of the formed oxidation film is also responsible for the formation preference of the oxidation film, which can be characterized via the Pilling–Bedworth ratio (PBR). The PBR reflects the change in volume of a given metal element (X) subject to oxidation (AX + BO2 = CXmOn) and could be calculated by the following formula [45]:
where A and C refer to the molar numbers of the reactant (X) and product (XmOn), respectively, and signify the atomic weight of the reactant (X) and the molecular weight of the product (XmOn), respectively, and and represent the density of the reactant (X) and product (XmOn), respectively.
The PBR of the above reactions could be calculated as 1.77 for Reaction (4), 1.46 for Reaction (5), 1.66 for Reaction (6), 2.02 for Reaction (7), and 2.27 for Reaction (8). The PBRs of the above reactions are all greater than 1, which indicates that the metal subject to oxidation undergoes volume expansion, which could improve the compactness of the oxidation film and result in better blocking effects between the sample and electrolyte. However, when the PBR is higher than 2, high levels of stress may be produced and cause cracking of the oxidation film. The electrolyte may still be in contact with the sample via the fracture areas and cause the active dissolution of these areas, thus retarding the change process from the active state to the comparatively stable corrosion state. Coatings 1 and 2 can enter into the comparatively stable corrosion state more rapidly than Coating 3 because of their low Ea-s − Ecorr values, which could be attributed to their suitable contents of Cr and Si with a high PBR. As the contents of Cr and Si are further enhanced in Coating 3, some cracks may be generated and delay the change process from the active state to the comparatively stable corrosion state.
4. Conclusions
(1) Adjusting the scanning speed may be an effective strategy to regulate the microstructure of laser-clad coatings prepared on Ti6Al4V with NiCrBSi powder as the cladding material. The microstructure of the coating was transformed from Ti2Ni + TiNi + TiB2 + TiC at 5 mm∙s−1 into primary γ(Ni) + eutectics of (γ(Ni) + Ni3Ti) + TiB2 + TiC + Cr7C3 at 11 mm∙s−1 and then into primary γ(Ni)+eutectics of (γ(Ni)+Ni3Ti) + TiB2 + TiC + Cr7C3 + CrB at 17 mm∙s−1.
(2) As the scanning speed increased, the average microhardness of the coatings first increased and then decreased (877.3 HV0.2 at 5 mm∙s−1, 1030.5 HV0.2 at 11 mm∙s−1, and 975.2 HV0.2 at 17 mm∙s−1). The opposite trend was noted for fracture toughness (4.813 MPa·m1/2 at 5 mm∙s−1, 4.428 MPa·m1/2 at 11 mm∙s−1, and 5.448 MPa·m1/2 at 17 mm∙s−1).
(3) The optimum combination of microhardness and wear resistance was acquired in the coating prepared at 11 mm∙s−1. This coating showed outstanding wear resistance in 3.5 wt.% NaCl solution (wear rate, 1.08 × 10⁻⁵ mm3∙N−1∙m−1) compared with the other coatings (Coating 1, 2.24 × 10⁻⁵ mm3∙N−1∙m−1; Coating 3, 1.26 × 10⁻⁵ mm3∙N−1∙m−1).
(4) Coating 2 demonstrated the best corrosion resistance among the coatings synthesized. Specifically, this sample showed the highest Ecorr (−0.338 V), lowest icorr (6.715 × 10⁻⁸ A∙cm−2), and low is (3.664 × 10⁻⁷ A∙cm−2) when the electrode initially entered a comparatively stable corrosion state. This coating also showed a higher critical potential of the oxidation film destruction (0.313 V) compared with Coating 1 (0.050 V) and Coating 3 (0.290 V).
Author Contributions
W.L.: Investigation, Experiment, Formal analysis, Writing—original draft. J.L.: Resources, Supervision, Methodology. Y.X.: Experiment, Formal analysis, Validation. All authors have read and agreed to the published version of the manuscript.
Funding
This research was funded by the National Natural Science Foundation of China, Grant No. 51471105, and Natural Science Foundation of Shanghai, Grant No. 20ZR1422200.
Institutional Review Board Statement
Not applicable.
Informed Consent Statement
Not applicable.
Data Availability Statement
Not applicable.
Acknowledgments
This work was financially supported by the National Natural Science Foun-dation of China (51471105) and Natural Science Foundation of Shanghai (20ZR1422200).
Conflicts of Interest
We declare that we do not have any commercial or associative interest that represents a conflict of interest in connection with the work submitted.
References
- Fu, S.; Yang, L.; Wang, P.; Wang, S.; Li, Z. Comparison of the microstructure evolution and wear resistance of Ti6Al4V composite coatings reinforced by hard pure or Ni-plated cubic boron nitride particles prepared with laser cladding on a Ti6Al4V substrate. Coatings 2020, 10, 702. [Google Scholar] [CrossRef]
- Xue, W.; Gao, S.; Duan, D.; Zhang, J.; Liu, Y.; Li, S. Effects of blade material characteristics on the high-speed rubbing be-havior between Al-hBN abradable seal coatings and blades. Wear 2018, 410, 25–33. [Google Scholar] [CrossRef]
- Zhang, L.; Zhao, Z.; Bai, P.; Du, W.; Li, Y.; Yang, X.; Wang, Q. In-situ synthesis of TiC/graphene/Ti6Al4V composite coating by laser cladding. Mater. Lett. 2020, 270, 127711. [Google Scholar] [CrossRef]
- Shi, C.; Lu, N.; Qin, Y.; Liu, M.; Li, H.; Li, H. Study on mechanical properties and permeability of elliptical porous scaffold based on the SLM manufactured medical Ti6Al4V. PLoS ONE 2021, 16, e0247764. [Google Scholar] [CrossRef]
- Zhou, Z.Y.; Liu, X.B.; Zhuang, S.G.; Yang, X.H.; Wang, M.; Sun, C.F. Preparation and high temperature tribological proper-ties of laser in-situ synthesized self-lubricating composite coatings containing metal sulfides on Ti6Al4V alloy. Appl. Surf. Sci. 2019, 481, 209–218. [Google Scholar] [CrossRef]
- Philip, J.T.; Mathew, J.; Kuriachen, B. Tribology of Ti6Al4V: A review. Friction 2019, 7, 497–536. [Google Scholar] [CrossRef] [Green Version]
- Feng, Y.; Feng, K.; Yao, C.; Li, Z.; Sun, J. Microstructure and properties of in-situ synthesized (Ti3Al + TiB)/Ti composites by laser cladding. Mater. Des. 2018, 157, 258–272. [Google Scholar] [CrossRef]
- Chen, S.; Li, L.; Chen, Y.; Huang, J. Joining mechanism of Ti/Al dissimilar alloys during laser welding-brazing process. J. Alloy. Compd. 2011, 509, 891–898. [Google Scholar] [CrossRef]
- Lu, X.L.; Liu, X.B.; Yu, P.C.; Qiao, S.J.; Zhai, Y.J.; Wang, M.D.; Chen, Y.; Xu, D. Synthesis and characterization of Ni60-hBN high temperature self-lubricating anti-wear composite coatings on Ti6Al4V alloy by laser cladding. Opt. Laser Technol. 2016, 78, 87–94. [Google Scholar] [CrossRef]
- Liu, Y.; Li, J.; Xuan, F.Z. Fabrication of TiC reinforced Ni based coating by laser cladding. Surf. Eng. 2012, 28, 560–563. [Google Scholar] [CrossRef]
- Miao, X.; Wu, M.; Cui, C.; Wang, H. Effect of graphene oxide on the performance of Co-based coatings on Ti6Al4V alloys by laser cladding. Coatings 2020, 10, 1048. [Google Scholar] [CrossRef]
- Weng, F.; Yu, H.; Chen, C.; Liu, J.; Zhao, L.; Dai, J. Fabrication of Co-based coatings on titanium alloy by laser cladding with CeO2 addition. Mater. Manuf. Process. 2016, 31, 1461–1467. [Google Scholar] [CrossRef]
- Chen, J.M.; Guo, C.; Zhou, J.S. Microstructure and tribological properties of laser cladding Fe-based coating on pure Ti substrate. Trans. Nonferrous Met. Soc. China 2012, 22, 2171–2178. [Google Scholar] [CrossRef]
- Gao, W.; Zhang, Z.; Zhao, S.; Wang, Y.; Chen, H.; Lin, X. Effect of a small addition of Ti on the Fe-based coating by laser cladding. Surf. Coat. Technol. 2016, 291, 423–429. [Google Scholar] [CrossRef]
- Wang, H.; Chen, T.; Cong, W.; Liu, D. Laser cladding of ti-based ceramic coatings on ti6al4v alloy: Effects of CeO2 nanoparticles additive on wear performance. Coatings 2019, 9, 109. [Google Scholar] [CrossRef] [Green Version]
- Li, Y.; Su, K.; Bai, P.; Wu, L. Microstructure and property characterization of Ti/TiBCN reinforced Ti based composite coatings fabricated by laser cladding with different scanning speed. Mater. Charact. 2019, 159, 110023. [Google Scholar] [CrossRef]
- Xiang, K.; Chai, L.; Wang, Y.; Wang, H.; Guo, N.; Ma, Y.; Murty, K.L. Microstructural characteristics and hardness of Co-NiTi medium-entropy alloy coating on pure Ti substrate prepared by pulsed laser cladding. J. Alloy. Compd. 2020, 849, 156704. [Google Scholar] [CrossRef]
- Nazari, K.A.; Rashid, R.R.; Palanisamy, S.; Xia, K.; Dargusch, M. A novel Ti-Fe composite coating deposited using laser cladding of low cost recycled nano-crystalline titanium powder. Mater. Lett. 2018, 229, 301–304. [Google Scholar] [CrossRef]
- Rashid, R.A.R.; Palanisamy, S.; Attar, H.; Bermingham, M.; Dargusch, M.S. Metallurgical features of direct la-ser-deposited Ti6Al4V with trace boron. J. Manuf. Process. 2018, 35, 651–656. [Google Scholar] [CrossRef]
- Xuan, H.F.; Wang, Q.Y.; Bai, S.L.; Liu, Z.D.; Sun, H.G.; Yan, P.C. A study on microstructure and flame erosion mechanism of a graded Ni–Cr–B–Si coating prepared by laser cladding. Surf. Coat. Technol. 2014, 244, 203–209. [Google Scholar] [CrossRef]
- Hemmati, I.; Ocelík, V.; de Hosson, J.T.M. Dilution effects in laser cladding of Ni–Cr–B–Si–C hardfacing alloys. Mater. Lett. 2012, 84, 69–72. [Google Scholar] [CrossRef]
- Chen, J.; Li, J.; Song, R.; Bai, L.; Shao, J.; Qu, C. Effect of the scanning speed on microstructural evolution and wear behaviors of laser cladding NiCrBSi composite coatings. Opt. Laser Technol. 2015, 72, 86–99. [Google Scholar] [CrossRef]
- Li, J.; Zhang, X.J.; Wang, H.P.; Li, M.P. Microstructure and mechanical properties of Ni-based composite coatings rein-forced by in situ synthesized TiB2 + TiC by laser cladding. Int. J. Min. Met. Mater. 2013, 20, 57–64. [Google Scholar] [CrossRef]
- Li, C.; Zhang, Q.; Wang, F.; Deng, P.; Lu, Q.; Zhang, Y.; Li, S.; Ma, P.; Li, W.; Wang, Y. Microstructure and wear behaviors of WC-Ni coatings fabricated by laser cladding under high frequency micro-vibration. Appl. Surf. Sci. 2019, 485, 513–519. [Google Scholar] [CrossRef]
- Qu, C.; Li, J.; Bai, L.; Shao, J.; Song, R.; Chen, J. Effects of the thickness of the pre-placed layer on microstructural evolution and mechanical properties of the laser-clad coatings. J. Alloy. Compd. 2015, 644, 450–463. [Google Scholar] [CrossRef]
- Wang, Y.; Liu, X.B.; Liu, Y.F.; Luo, Y.S.; Meng, Y. Microstructure and tribological performance of Ni60-based composite coatings on Ti6Al4V alloy with different Ti3SiC2 ceramic additions by laser cladding. Ceram. Int. 2020, 46, 28996–29010. [Google Scholar] [CrossRef]
- Wu, F.; Chen, T.; Wang, H.; Liu, D. Effect of Mo on microstructures and wear properties of in situ synthesized Ti(C,N)/Ni-based composite coatings by laser cladding. Materials 2017, 10, 1047. [Google Scholar] [CrossRef] [Green Version]
- Gao, Q.; Yan, H.; Qin, Y.; Zhang, P.; Guo, J.; Chen, Z.; Yu, Z. Laser cladding Ti-Ni/TiN/TiW+TiS/WS2 self-lubricating wear resistant composite coating on Ti6Al4V alloy. Opt. Laser. Technol. 2019, 113, 182–191. [Google Scholar] [CrossRef]
- Sun, Y.; Hao, M. Statistical analysis and optimization of process parameters in Ti6Al4V laser cladding using Nd:YAG laser. Opt. Laser. Eng. 2012, 50, 985–995. [Google Scholar] [CrossRef]
- Ochonogor, O.F.; Meacock, C.; Abdulwahab, M.; Pityana, S.; Popoola, A.P.I. Effects of Ti and TiC ceramic powder on laser-cladded Ti–6Al–4V in situ intermetallic composite. Appl. Surf. Sci. 2012, 263, 591–596. [Google Scholar] [CrossRef]
- Lv, Y.H.; Li, J.; Tao, Y.F.; Hu, L.F. High-temperature wear and oxidation behaviors of TiNi/Ti2Ni matrix composite coat-ings with TaC addition prepared on Ti6Al4V by laser cladding. Appl. Surf. Sci. 2017, 402, 478–494. [Google Scholar] [CrossRef]
- Cai, J.; Yao, Y.; Gao, C.; Lyu, P.; Meng, X.; Guan, Q.; Li, Y.; Han, Z. Comparison of microstructure and oxidation behavior of NiCoCrAlYSi laser cladding coating before and after high-current pulsed electron beam modification. J. Alloy. Compd. 2021, 881, 160651. [Google Scholar] [CrossRef]
- Okuno, T.; Kaneno, Y.; Yamaguchi, T.; Semboshi, S.; Hagino, H.; Takasugi, T. Microstructures and hardness properties of laser clad Ni base two-phase intermetallic alloy coating. J. Mater. Res. 2017, 32, 4531–4540. [Google Scholar] [CrossRef]
- Li, N.; Xiong, Y.; Xiong, H.; Shi, G.; Blackburn, J.; Liu, W.; Qin, R. Microstructure, formation mechanism and property char-acterization of Ti + SiC laser cladded coatings on Ti6Al4V alloy. Mater. Charact. 2019, 148, 43–51. [Google Scholar] [CrossRef]
- Zhang, Z.; Yang, F.; Zhang, H.; Zhang, T.; Wang, H. Microstructure and element distribution of laser cladding TiC -reinforced CrTi4-based composite coating with CeO2/Ce2O3. Mater. Lett. 2021, 283, 128772. [Google Scholar] [CrossRef]
- Bai, L.; Li, J.; Chen, J.; Song, R.; Shao, J.; Qu, C. Effect of the content of B4C on microstructural evolution and wear behaviors of the laser-clad coatings fabricated on Ti6Al4V. Opt. Laser Technol. 2016, 76, 33–45. [Google Scholar] [CrossRef]
- Obadele, B.; Andrews, A.; Olubambi, P.; Mathew, M.; Pityana, S. Effect of ZrO2 addition on the dry sliding wear behavior of laser clad Ti6Al4V alloy. Wear 2015, 328–329, 295–300. [Google Scholar] [CrossRef]
- Li, J.; Yu, Z.; Wang, H. Wear behaviors of an (TiB + TiC)/Ti composite coating fabricated on Ti6Al4V by laser cladding. Thin Solid Films 2011, 519, 4804–4808. [Google Scholar] [CrossRef]
- Yu, P.C.; Liu, X.B.; Lu, X.L.; Qiao, S.J.; Zhai, Y.J.; Zhu, G.X.; Wang, Y.G.; Chen, Y. Tribology and high-temperature oxidation behaviors of NiCrBSiFe composite coatings on Ti6Al4V alloy by laser cladding. RSC Adv. 2015, 5, 76516–76525. [Google Scholar] [CrossRef]
- Kumar, S.; Mandal, A.; Das, A.K.; Dixit, A.R. Parametric study and characterization of AlN-Ni-Ti6Al4V composite clad-ding on titanium alloy. Surf. Coat. Technol. 2018, 349, 37–49. [Google Scholar] [CrossRef]
- Adesina, O.S.; Farotade, G.A.; Popoola, P. Synthesis, parametric and tribological study of laser clad Co–Ni binary coatings on titanium alloy. Mater. Res. Express 2019, 6, 056512. [Google Scholar] [CrossRef]
- Liu, H.; Zhang, X.; Jiang, Y.; Zhou, R. Microstructure and high temperature oxidation resistance of in-situ synthesized TiN/Ti3Al intermetallic composite coatings on Ti6Al4V alloy by laser cladding process. J. Alloy. Compd. 2016, 670, 268–274. [Google Scholar] [CrossRef]
- Masanta, M.; Shariff, S.; Choudhury, A.R. Evaluation of modulus of elasticity, nano-hardness and fracture toughness of TiB2–TiC–Al2O3 composite coating developed by SHS and laser cladding. Mater. Sci. Eng. A 2011, 528, 5327–5335. [Google Scholar] [CrossRef]
- Zhao, P.; Li, J.; Zhang, Y.; Li, X.; Xia, M.; Yuan, B. Wear and high-temperature oxidation resistances of AlNbTaZrx high-entropy alloys coatings fabricated on Ti6Al4V by laser cladding. J. Alloy. Compd. 2021, 862, 158405. [Google Scholar] [CrossRef]
- Rashid, R.A.R.; Abaspour, S.; Palanisamy, S.; Matthews, N.; Dargusch, M.S. Metallurgical and geometrical charac-terisation of the 316L stainless steel clad deposited on a mild steel substrate. Surf. Coat. Technol. 2017, 327, 174–184. [Google Scholar] [CrossRef]
- Xu, C.; Gao, W. Pilling-Bedworth ratio for oxidation of alloys. Mater. Res. Innov. 2000, 3, 231–235. [Google Scholar] [CrossRef]
Publisher’s Note: MDPI stays neutral with regard to jurisdictional claims in published maps and institutional affiliations. |
© 2021 by the authors. Licensee MDPI, Basel, Switzerland. This article is an open access article distributed under the terms and conditions of the Creative Commons Attribution (CC BY) license (https://creativecommons.org/licenses/by/4.0/).