Abstract
This paper proposes a measuring apparatus and method for simultaneous determination of the thermal expansion coefficient and biaxial Young’s modulus of indium tin oxide (ITO) thin films. ITO thin films simultaneously coated on N-BK7 and S-TIM35 glass substrates were prepared by direct current (DC) magnetron sputtering deposition. The thermo-mechanical parameters of ITO thin films were investigated experimentally. Thermal stress in sputtered ITO films was evaluated by an improved Twyman–Green interferometer associated with wavelet transform at different temperatures. When the heating temperature increased from 30 °C to 100 °C, the tensile thermal stress of ITO thin films increased. The increase in substrate temperature led to the decrease of total residual stress deposited on two glass substrates. A linear relationship between the thermal stress and substrate heating temperature was found. The thermal expansion coefficient and biaxial Young’s modulus of the films were measured by the double substrate method. The results show that the out of plane thermal expansion coefficient and biaxial Young’s modulus of the ITO film were 5.81 × 10⁻⁶ °C−1 and 475 GPa.
1. Introduction
It is well known that indium tin oxide (ITO) thin films have important properties such as low resistivity and high transmittance. They are widely used in the manufacture of display panels and optoelectronic components. It is common knowledge that almost all thin films have different internal stresses in the coating processes. Residual stresses can lead to undesirable problems such as film cracking or spalling and substrate bending. Thus, it is important to have a comprehensive understanding of residual stresses in thin films. The residual stress of thin films is generally composed of thermal stress and internal stress. The thermal stress observed in thin films is usually caused by the different coefficient of thermal expansion (CTE) of the film/substrate system, and may also be caused by non-uniform heat conduction. The internal stress is usually caused by the combination of grain boundaries, the annihilation of excess vacancies, and the insertion of excess atoms, etc. Thin film deposition can generate residual stress, which leads to substrate deformation or film buckling. In light of this, the evaluation of residual stress is a very important process because any bending or deformation of the substrate caused by residual stress will affect the performance of thin film devices. In addition, multilayer coatings have been widely used in various technical fields including micro-electromechanical systems (MEMS), semiconductor, and integrated optoelectronics. If the difference of the thermal expansion coefficients in the multilayer coatings is too large, it will lead to thermal stress and anisotropic deformation [1]. The manufacturing of these devices involves a number of processing steps that may cause stress in the structure, which is critical to the reliability of the product. Therefore, the ability to analyze and control the internal stress of the multilayer thin films becomes a necessary condition to ensure the good performance of the multilayer devices.
The CTE and biaxial Young’s modulus are the two main thermomechanical parameters of thin film devices. These parameters have a high-sensitive effect on the response of the optical filters to ambient temperature change. The CTE data and biaxial modulus of the coating materials will have additional value in thin film devices. Since ITO is one of the most popular transparent conductor oxides (TCO), it has been widely used as a TCO material because of its excellent electrical and optical properties. In general, the electrical resistivity of TCO thin films can be determined by the four-point probe method. However, thermal expansion or temperature distribution causes a major impact of thermal stability in some photoelectronic devices such as bifacial solar cells, thermos-optic switches, and arrayed waveguide gratings. Therefore, the accurate evaluation of thin film thermomechanical properties such as biaxial Young’s modulus and CTEs is highly desirable for the design and fabrication of various photoelectronic devices. Many techniques have been developed to measure the CTE and biaxial modulus of thin films such as the interference fringe method [2,3,4,5,6,7], bending beam method [8], wafer curvature measurement [9,10,11], and x-ray diffraction technique [12,13].
The coefficient of the thermal expansion of materials can be directly measured by a commercial thermomechanical analyzer. The CTE data can be obtained for some bulk materials. However, there are few methods to measure the out of plane (or thickness direction) thermal expansion coefficient of thin films. It is difficult to measure the CTE of thin films because the film thickness changes little with temperature. Furthermore, much of the work on evaluation has focused on the optical, electrical, and surface properties of ITO films, and less attention has been paid to report the CTE and biaxial modulus of ITO thin films in the literature. In this study, we present an effective approach to measure the out of plane CTE and biaxial Young’s modulus of ITO films. The advantage of the proposed technique is non-contact, accurate, reproducible, and easy operation. In addition, the proposed measurement apparatus can facilitate the development of coating processes that produce more uniform thin films.
2. Method
An optical interferometric technique [4,5,6] has been used to evaluate both the thermal expansion coefficient and the biaxial modulus of thin film, but processing the interference fringes may lead to significant errors. Hence, we propose a Twyman-Green interferometer associated with wavelet transform (WT) technique to improve the accuracy.
The wavelet transform can be used to analyze the local information of the interference fringe signal [14,15]. Generally, the one-dimensional wavelet ψ(x) is assumed to be a function of finite energy, and its average value is zero:
The wavelet is expanded by the scale parameters and translated by the position parameter ξ to produce a series of sub-wavelets, which can be expressed as:
A one-dimensional continuous wavelet (Wf) can be written as:
where x represents a spatial variable, and * represents a conjugate complex number. The proportional parameter s is related to the concept of frequency. When the value of s is small, the analyzed wavelet has the characteristics of rapid oscillation, which is very suitable for the selection of high frequency components of the signal; while the value of s is large, the opposite is true, which can separate low frequency signals. For the interference fringes distributed in the x direction, the one-dimensional continuous wavelet Wx can be rewritten as:
Among them, I0(x,y), V(x,y), and ϕ(x,y) are the average intensity of interference fringes, fringe contrast, and phase difference, respectively.
In Equation (4), there is a local maximum in the number corresponding to each pixel. The absolute value of this value is called the ridge, which can be used to detect frequency changes. These points, with significant frequency changes, correspond to the phase difference, and ignore the influence of noise with small frequency changes. Using this feature, the ridge function can be easily converted into a phase function.
where Re[] and Im[] are the real and imaginary parts of Wx, respectively. By repeating this process in the y direction, the wrapped phase ϕ(x,y) can be obtained, and phase expansion is required to obtain the complete phase function. The wavelet transform method uses only one interferogram for analysis, so the phase can be quickly restored. Equation (5) is the wrapped phase image.
The procedure of phase extraction is shown below. First, the optical Twyman-Green interferometer is used to capture the interference fringes of equal thickness of the sample, and then the Morlet wavelet transform method is used for ridge detection and to find the maximum value. The maximum value of the local intensity in the interference fringe, and the wavelet position parameter ξ is obtained. In the Twyman-Green interferometer system, if the sample is a transparent glass substrate, both sides of the glass plate can reflect and interfere with the reference beam. The image pattern contains interference fringes formed by more than two reflective beams. If the front surface is not completely parallel to the back surface, the position parameters will not be exactly the same. Therefore, the ridge function can be extracted from the two surfaces through different position parameters. The scale parameter s is related to the carrier frequency. The best parameters can usually be obtained by adjusting the carrier frequency. However, if the carrier frequency of the two surfaces is too low, it will be difficult to obtain the ridge function of the two surfaces due to the similar frequencies. In the case of multiple interference patterns, it is easy to misjudge the local amplitude, and the wrong ridge function is extracted.
In order to obtain the information of the thin film surface topography, the phase unwrapping must be performed by adding or subtracting 2π. The discontinuity of the phase function needs to be dealt with. The phase unwrapping method used in this study is based on Macy’s algorithm [16]. After phase unwrapping, the height h(x,y) of the tested surface can be calculated by:
where λ is the wavelength of the laser light source, and n is the refractive index of air. In order to eliminate the influence of the tilt error caused by the carrier fringe, Zernike polynomials are used to fit the surface profile and obtain the tilt aberration. After removing the tilt term, the real surface profile can be reconstructed. Finally, curve fitting is used to calculate the radius of curvature of the object surface.
By subtracting the surface profile before and after deposition, the surface deformation of the film can be obtained. In general, the residual stress in ITO thin films can be expressed in terms of Stoney’s equation [17,18]:
where σ is the residual stress in thin films, σi is intrinsic stress, and σth is thermal stress; Es is the Young’s modulus of the substrate and vs. is Poisson ratio of the substrate; ts is the thicknesses of the substrate and tf is the thicknesses of thin film; R1 is the radius of curvature before coating and R2 is the radius of curvature after coating. Table 1 lists the material properties of the different glass substrates. The following equation can be used to calculate the thermal stress.
where αs is the CTE of the substrate; αf is the CTE of the thin film; represents the biaxial Young’s modulus of thin film; T1 is the temperatures before heating; and T2 is the temperatures after heating.

Table 1.
Material properties of the different glass substrates.
In this study, the coefficient of thermal expansion was calculated by the linear correlation between thermal stress and heating temperature. Taking the derivative of Equation (8), it is easy to show that the slope of the stress-temperature curve is equal to:
where represents the slope of the stress-temperature curve. The CTE and biaxial Young’s modulus of thin films can be derived from the slope of the stress-temperature plot using at least two sorts of substrates, with known thermal expansion coefficients and Young’s moduli. Thin films coated on different glass substrates have large differences in thermal stress. This is due to the large difference in the coefficient of thermal expansion (CTE) between the film and the substrate when the heating temperature rises from room temperature to 100 °C.
3. Results
For optoelectronic applications, the physical parameters of both CTE and biaxial Young’s modulus are very important for thin film devices. The optical material properties have a crucial influence on the response of optical devices to temperature changes. The ITO thin films were prepared by DC magnetron sputtering deposition and coated on N-BK7 and STIM-35 glass substrates. Before thin film deposition, the substrates must be cleaned to remove the surface contamination. An ultrasonic cleaner was used to clean different substrates. We used deionized water, ethanol, acetone, and isopropanol to ultrasonically clean the substrates.
The dual substrate method was used to evaluate the thermomechanical properties of ITO thin films. There are two different glass substrates with known mechanical properties used for ITO coatings. The thermal stress of ITO thin films deposited on two different substrates was measured by a modified Twyman-Green interferometer under different heating temperatures, as indicated in Figure 1. The thickness of the thin films was determined by the alpha-step stylus profilometer. The ITO thin films had the deposition thickness of 140 nm in this study. We used an improved Twyman-Green interferometer to measure the deformation of the fringes of a coated substrate at temperatures from 30 to 100 °C. A He-Ne laser was used as a light source. The heating temperature in all the experiments was determined to a tenth of a degree Celsius. Temperature was measured by means of a thermometer whose sensor was in contact with a substrate adjacent to the thin film. The temperature distribution of the film/substrate system was recorded by an infrared image camera. The glass substrates were placed on a hot stage linked with an electric temperature controller. A thermocouple sensed any temperature variations in the film surface. Interference fringes of reflected light between the reference plate and the substrate were detected with a digital CCD camera. The interference fringe patterns were recorded by the CCD camera, and the residual stress of thin films at different heating temperatures was measured by the Twyman-Green interferometer combined with wavelet transform method. We also developed a MATLAB algorithm based on the wavelet transform to reconstruct the 3-D surface profile and to calculate the curvature of the film/substrate surface. The residual stress was obtained by the modified Stoney equation. For the measurement of the CTE and biaxial Young’s modulus of ITO thin films, the dual-substrate method of N-BK7 and S-TIM35 glass substrates was used in this work.
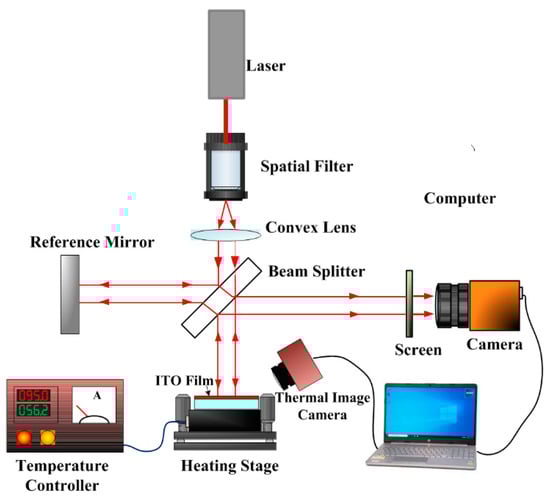
Figure 1.
A home-made thin film thermal stress measurement system based on the Twyman-Green interferometer.
Figure 2 shows the schematic diagram of heat conduction between the thin film and substrate. The thermal stress measurement experiments were performed in an open environment, the coating substrate was placed on a heating stage and the bottom surface of the substrate was heated, and then the thermal energy at the higher temperature was conducted to the lower temperature. If the thin films are heated from the bottom surface of the substrate, as shown in Figure 2, rather than being located in a closed space capable of maintaining uniform temperature and the uniform heating from all surfaces. The cooling effect due to natural heat convection will occur on the upper surface of the thin film and the side surface of samples. Therefore, a temperature gradient along the thickness of the sample will be introduced even in the condition of steady-state heating condition and result in an extra thermal deformation due to non-uniform temperature distribution along the thickness. In order to accurately evaluate the thermal expansion coefficient and biaxial modulus of the ITO thin films, the temperatures at both the upper surface of thin film and the bottom surface of the substrate are simultaneously measured by an infrared thermal imaging camera. The temperature distribution of ITO thin films was measured by a thermal imaging camera. In Figure 3, A indicates the background (in air), B stands for the film/substrate (to be measured), and C is an insulated material attached on the side surface of the heating stage. The temperature of the upper surface of ITO thin film was 92.9 °C for N-BK7 glass and 95.4 °C for the S-TIM35 glass substrate, as shown in Figure 3. According to the temperature distribution map measured by the infrared thermal imaging camera, it can be found that the surface temperature of the ITO thin film was lower than the temperature at the bottom of the substrate (as shown in Figure 3). This is because of the heat conduction effect, which causes a temperature gradient distribution along the thickness of the substrate. Moreover, the temperature gradient distribution of the substrate will become more significant as the thickness of the substrate increases.
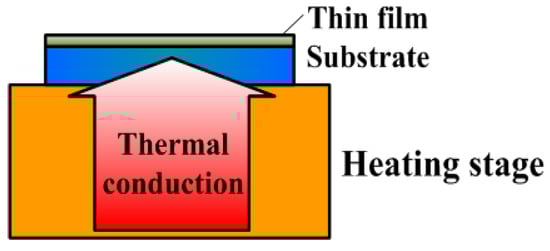
Figure 2.
Schematic diagram of thermal conduction between the thin film and substrate.
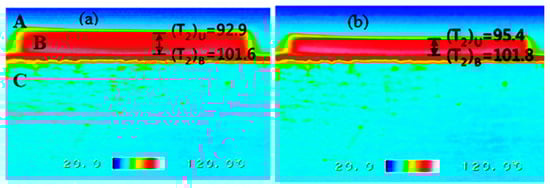
Figure 3.
Temperature distribution of the indium tin oxide (ITO) thin film coated on the (a) N-BK7; (b) S-TIM35 glass substrates.
The following thermal stress formula is based on the assumption that the substrate is placed in an open environment. The heating stage starts to heat the bottom of the substrate, and then considers the temperature difference between the top and bottom surfaces of the coated substrate caused by heat conduction. The modified thermal stress formula is expressed as [19]:
where σth is the total thermal stress of the thin films. (σth)non is the thermal stress as the substrate temperature distribution is non-uniform. (σth)uni is the thermal stress when the substrate temperature distribution is uniform. (T2)U is the temperature at the upper surface of thin film and (T2)B is the temperature at the bottom surface of the substrate.
It can be seen from Equation (10) that the uniform thermal stress value of the substrate is subtracted from the total thermal stress value of the film (σth), when the substrate temperature distribution is not uniform. The uniform thermal stress has a linear relationship with the temperature rise, which can be used to evaluate the thermomechanical properties of the films. If the substrate temperature distribution is uniform, the thermal stress value of (σth)uni can be obtained by subtracting the non-uniform term from the total thermal stress. In other words, if σth in Equation (9) is replaced by (σth)uni, the equation can be modified as follows.
Furthermore, two gradient values of (σth)uni/dT in stress-temperature curves are obtained by substituting the factors of the non-uniform temperature distribution of the substrate. Using the double substrate method, accurate CTE and biaxial Young’s modulus of the thin films were calculated by Equation (13).
The thermal stress and thermomechanical properties of ITO films were studied by experiments. The thermal stress variation for an ITO/S-TIM35 sample was larger than that for an ITO/N-BK7 sample. The experimental results revealed that the ITO films deposited on different glass substrates exhibited a similar behavior with the increase in heating temperature. When the heating temperature increased from room temperature to 100 °C, the thermal stress of the ITO thin film deposited on different substrates was due to the CTE between thin film and substrates. With the increase in substrate temperature, the ITO film deposited on the S-TIM35 glass substrate changed obviously. The thermal stress in ITO/S-TIM35 samples is attributed to the fact that the CTE of ITO film is higher than that of the substrate, which makes the substrate bend to form a concave surface (namely tensile state).
The temperature stability of optical coating devices has become more and more important. The thin film’s CTE information is useful and can be used to evaluate temperature stability when designing and manufacturing thin film devices. Figure 4a shows the two-dimensional surface profile changes of the ITO film deposited on the S-TIM35 substrate (i.e., ITO/S-TIM35 sample) at different temperatures. The experimental results showed that when the heating temperature increased from room temperature to 60 °C, the surface profile of the ITO/S-TIM35 sample did not change significantly. However, as the heating temperature increased to 90 °C, the film morphology became more curved, as shown in Figure 4b. When the substrate temperature increased, the curvature in the x-axis direction decreased, and the curvature in the y-axis direction increased accordingly. In contrast, when the substrate temperature increased, the two-dimensional surface profile of the ITO/N-BK7 sample changed less, as shown in Figure 5a. For the three-dimensional surface topography, it can be seen that the surface shape of the film was concave. The curvature of the films increased along the x-axis and y-axis directions. The curvature changed on the x-axis and y-axis of the film increased. The surface profile tends to bend inward gradually, as shown in Figure 5b. It was observed that the thermal stress of the ITO film was anisotropic, and its biaxial stress values were not equal. According to the stress measurements, the ITO films deposited on two different substrates all presented a state of tensile thermal stress. As shown in Table 1, the coefficient of thermal expansion and Young’s modulus of the S-TIM35 glass substrate were slightly larger than that of the N-BK7 glass substrate. The ITO thin film was deposited on two kinds of glass substrate at the same time. The results showed that the surface deformation of ITO films deposited on S-TIM35 glass substrate was non-uniform as the temperature increased.
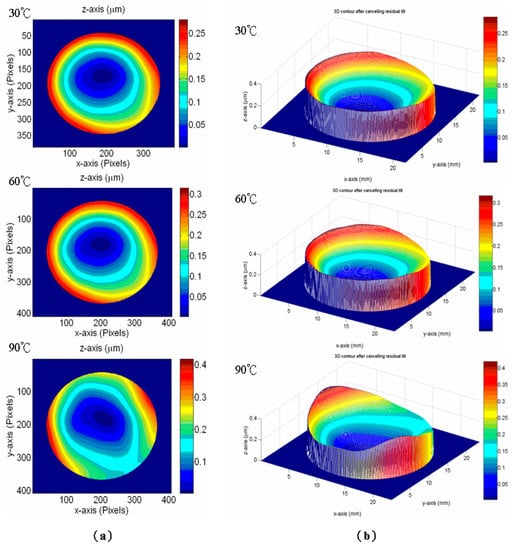
Figure 4.
Surface profile changes of the ITO film deposited on the S-TIM35 glass substrate in the heating temperature range of 30–90 °C. (a) Two-dimensional profile. (b) Three-dimensional surface topography.
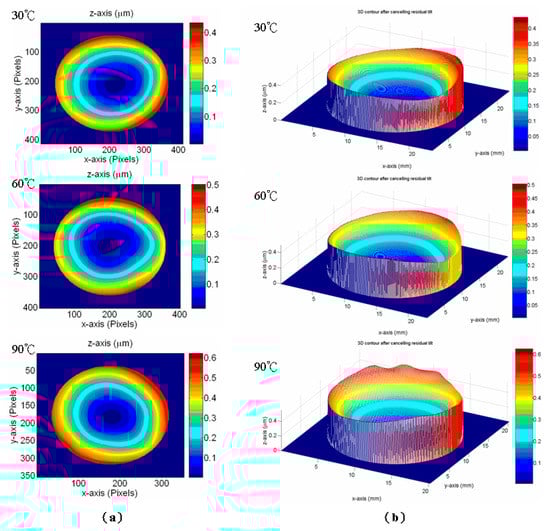
Figure 5.
Surface profile changes of the ITO film deposited on the N-BK7 glass substrate in the heating temperature range of 30–90 °C. (a) Two-dimensional profile. (b) Three-dimensional surface topography.
Figure 6 demonstrates that the tensile stress in the ITO/N-BK7 sample increased with an increase in the heating temperature from 30 to 90 °C. When the temperature increased, the residual stress changed from 37.9 MPa to 74.4 MPa. The stress–temperature plot of the ITO film deposited on the N-BK7 glass substrate was close to a linear relationship during the heating process. The error bars represent one standard deviation obtained from ten measurements. The slope value of the stress-temperature plot was 0.62 MPa/°C by the curve fitting method, as shown in Figure 6. Similarly, the thermal stress in the ITO/S-TIM35 sample varied from 44.2 to 91.1 MPa, while the temperature rose to 100 °C. The slope value of the stress-temperature curve was 0.81 MPa/°C, as shown in Figure 7. The CTE and biaxial Young’s modulus of the ITO thin films can be obtained by the thermal stress vs. temperature relationship based on the double substrate method. From the thermal stress-temperature measurements, the average thermal expansion coefficient of 5.81 × 10⁻⁶ °C−1 and biaxial Young’s modulus of 475 GPa for the ITO thin film were obtained. Furthermore, the plot of thermal stress of the ITO films versus temperature in different axial directions was measured. The results show that thermal stress in the x-axis direction for both ITO/glass samples were smaller than that in the y-axis direction. The CTE and biaxial Young’s modulus of the ITO thin film were calculated to be 5.24 × 10⁻⁶ °C−1 and 321 GPa in the x-axis direction as well as 5.98 × 10⁻⁶ °C−1 and 592 GPa in the y-axis direction, respectively. From the measurement data, it can be known that as the heating temperature increases, the anisotropic residual stress behavior of the ITO film gradually changes. These results suggest that the anisotropic thermal stress is caused by large temperature changes and CTE mismatch. It is well known that a material’s physical thin film properties are very different from its bulk properties. Obtaining the CTE data of thin films can be very useful in understanding how this property will affect the study of the bulk material in the form of thin film as most microelectronic devices and sensors are fabricated by using thin film deposition. In thin film devices, the CTE data for the multilayer coating process will be extremely valuable information. In addition, the conductivity measurement of the ITO thin film is also important. In this work, the electrical resistivity was determined by the four-point probe method. The electrical resistivity of sputtered ITO thin film increased from 5.20 × 10⁻⁴ to 5.53 × 10⁻⁴ ohm-cm for a heating temperature range of 30 to 90 °C, since the conductivity of ITO films is related to oxygen vacancies. The increase in oxygen content in the film reduces the oxygen vacancy, which reduces the conductivity of ITO film. The resistivity of the ITO film increases slightly when the temperature is increased, which may be due to the slight increase in oxygen content in the material. This result is consistent with the literature [20,21].
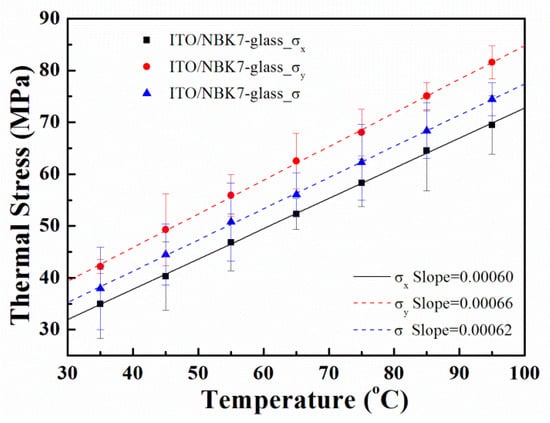
Figure 6.
Thermal stress vs. temperature plot of ITO coated on the N-BK7 substrate.
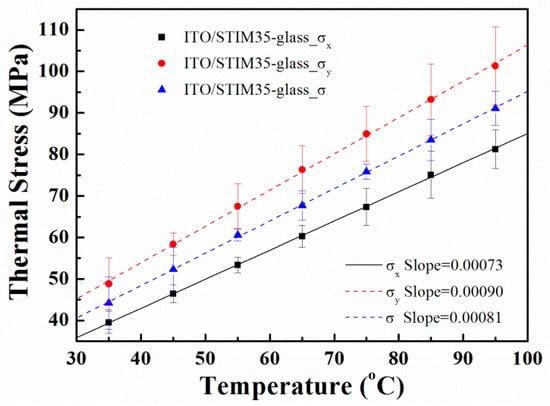
Figure 7.
Thermal stress vs. temperature plot of ITO coated on the S-TIM35 substrate.
4. Conclusions
In this paper, an apparatus and method for the simultaneous determination of CTE and biaxial Young’s modulus of ITO films is presented. The measurement apparatus consisted of a modified Twyman-Green interferometer combined with an infrared thermal imaging camera, a heating stage, and wavelet transform analysis program. The wavelet transform method was used to analyze the interference fringe pattern and then the phase information in the interferogram was obtained. We developed a feasible and accurate method to measure the curvature changes and to evaluate residual stress in thin films at different heating temperatures. This method is not only to simultaneously measure the CTE and biaxial Young’s modulus of thin films, but it can also determine the anisotropic thermal expansion coefficients and biaxial moduli. In this work, the average CTE and biaxial modulus of sputtered ITO thin films were 5.81 × 10⁻⁶ °C−1 and 475 GPa. These results show that the measured data is in good agreement with the CTE data of 5.0 × 10⁻⁶ °C−1 in the literature [22]. It was also found that the residual stress in ITO films was affected by the larger temperature change and the CTE mismatch of the film/substrate, which led to different surface deformations of the thin films.
Author Contributions
C.-L.T. designed the experiments, methodology, and drafted the manuscript; T.-W.L. conducted the thin film coatings and measurements. All authors have read and agreed to the published version of the manuscript.
Funding
This research was funded by the Ministry of Education of Taiwan (20M22026), and the Ministry of Science and Technology of Taiwan under contract number MOST 109-2221-E-035-022.
Institutional Review Board Statement
Not applicable.
Informed Consent Statement
Not applicable.
Data Availability Statement
Data sharing not applicable.
Acknowledgments
The authors are grateful for the Precision Instrument Support Center of Feng Chia University in providing the SEM analytical facilities.
Conflicts of Interest
The authors declare no conflict of interest.
References
- Hsueh, C.H.; Becher, P.F. Thermal stresses due to thermal expansion anisotropy in materials with preferred orientation. J. Mater. Sci. Lett. 1991, 10, 1165–1167. [Google Scholar] [CrossRef]
- Beadie, G.; Rosenberg, A.; Shirk, J.S. Determining the out-of-plane thermal expansion coefficient by analyzing the temperature dependence of thin-film interference fringes. Opt. Mater. Express 2019, 9, 1430–1440. [Google Scholar] [CrossRef]
- Ando, S.; Sekiguchi, K.; Mizoroki, M.; Okada, T.; Ishige, R. Anisotropic linear and volumetric thermal-expansion behaviors of self-standing polyimide films analyzed by thermomechanical analysis (tma) and optical interferometry. Macromol. Chem. Phys. 2017, 219, 1700354. [Google Scholar] [CrossRef]
- Tien, C.L.; Lee, C.C.; Tsai, Y.L.; Sun, W.S. Determination of the mechanical properties of thin films by digital phase shifting interferometry. Opt. Commun. 2001, 198, 325–331. [Google Scholar] [CrossRef]
- Lee, C.C.; Tien, C.L.; Sheu, W.S.; Jaing, C.C. An apparatus for the measurement of internal stress and thermal expansion coefficient of metal oxide films. Rev. Sci. Instrum. 2001, 72, 2128–2133. [Google Scholar] [CrossRef]
- Tien, C.L.; Lin, T.W. Thermal expansion coefficient and thermo-mechanical properties of SiNx thin films prepared by plasma-enhanced chemical vapor deposition. Appl. Opt. 2012, 51, 7229–7235. [Google Scholar] [CrossRef]
- Fang, W.; Tsai, H.C.; Lo, C.Y. Determining thermal expansion coefficients of thin films using micromachined cantilevers. Sens. Actuators 1999, 77, 21–27. [Google Scholar] [CrossRef]
- Zhao, J.H.; Ryan, T.; Ho, P.S.; McKerrow, A.J.; Shih, W.Y. Measurement of elastic modulus, Poisson ratio, and coefficient of thermal expansion of on-wafer submicron films. J. Appl. Phys. 1999, 85, 6421–6424. [Google Scholar] [CrossRef]
- Toivola, Y.; Thurn, J.; Cook, R.F.; Cibuzar, G.; Roberts, K. Influence of deposition conditions on mechanical properties of low-pressure chemical vapor deposited low-stress silicon nitride films. J. Appl. Phys. 2003, 94, 6915–6922. [Google Scholar] [CrossRef]
- de Lima, M.M., Jr.; Lacerda, R.G.; Vilcarromero, J.; Marques, F.C. Coefficient of thermal expansion and elastic modulus of thin films. J. Appl. Phys. 1999, 86, 4936–4942. [Google Scholar]
- Habermehl, S. Coefficient of thermal expansion and biaxial Young’s modulus in Si-rich silicon nitride thin films. J. Vac. Sci. Technol. A 2018, 36, 021517. [Google Scholar] [CrossRef]
- Okada, Y.; Tokumura, Y. Precise determination of lattice parameter and thermal expansion coefficient of silicon 300 K–1500 K. J. Appl. Phys. 1984, 56, 314–320. [Google Scholar]
- Neerinck, D.; Vink, T. Depth profiling of thin ITO films by grazing incidence X-ray diffraction. Thin Solid Films 1996, 278, 12–17. [Google Scholar] [CrossRef]
- Torrence, C.; Compo, G.P. A practical guide to wavelet analysis. Bull. Am. Meteorol. Soc. 2013, 79, 61–78. [Google Scholar] [CrossRef]
- Bahich, M.; Bailich, M.; Imloul, A.; Afifi, M.; Barj, E. A comparative study of one and two-dimensional wavelet-based techniques for noisy fringe patterns analysis. Opt. Commun. 2013, 290, 43–48. [Google Scholar]
- Macy, W.W., Jr. Two-dimensional fringe-pattern analysis. Appl. Opt. 1983, 22, 3898–3901. [Google Scholar] [CrossRef]
- Stoney, G.G. The tension of metallic films deposited by electrolysis. Proc. R. Soc. Lond. Ser. A 1909, 82, 172–175. [Google Scholar]
- Tien, C.L.; Zeng, H.D. Measuring residual stress of anisotropic thin film by transform. Opt. Express 2010, 18, 16594–16600. [Google Scholar]
- Chen, T.C.; Lin, W.J.; Chen, D.L. Effect of temperature gradient on simultaneously experimental determination of thermal expansion coefficients and elastic modulus of thin film materials. J. Appl. Phys. 2004, 96, 3800–3806. [Google Scholar] [CrossRef]
- Hamasha, M.M.; Dhakal, T.; Alzoubi, K.; Albahri, S.; Qasaimeh, A.; Lu, S.; Westgate, C.R. Stability of ITO thin film on flexible substrate under thermal aging and thermal cycling conditions. IEEE J. Disp. Technol. 2012, 8, 385–390. [Google Scholar] [CrossRef]
- Li, H.; Guo, L.; Liu, X.; Sun, T.; Li, Q.; Zhang, F.; Xiao, G.; Fu, T.; Chen, Y. High temperature conductive stability of indium tin oxide films. Front. Mater. 2020, 7, 113. [Google Scholar] [CrossRef]
- Nomura, H.; Shimizu, K. Stress in tin-doped indium oxide thin films formed on substrates by sputtering. Jpn. J. Appl. Phys. 2010, 49, 025501. [Google Scholar] [CrossRef]
Publisher’s Note: MDPI stays neutral with regard to jurisdictional claims in published maps and institutional affiliations. |
© 2021 by the authors. Licensee MDPI, Basel, Switzerland. This article is an open access article distributed under the terms and conditions of the Creative Commons Attribution (CC BY) license (http://creativecommons.org/licenses/by/4.0/).