1. Introduction
Titanium alloys, especially Ti6Al4V, are frequently used materials for bone and dental implants because of their high tensile strength, high corrosion resistance, inertness to body fluids, and biocompatibility [
1]. The surface of titanium-based implants is very reactive to oxygen, which leads to the spontaneous formation of a protective film of titanium oxides (TiO
2, TiO
3, or TiO), which is constantly renewed and is thermodynamically stable. The oxide layer is well-adhesive for the calcium and phosphate ions necessary for the mineralization of newly formed bone tissue [
2]. Another important effect of the oxide layer is that it limits the leakage of metal compounds from the implant into the surrounding bone tissue. However, it does not completely prevent leakage, as there is slow passive diffusion of these compounds through the oxide layer [
3]. Last but not least, titanium oxides, especially TiO
2, are known to increase the wettability of the material, to promote the adsorption of cell adhesion-mediating molecules in a physiological geometrical conformation, and to enhance the adhesion of bone cells [
4].
Osteoconduction, i.e., the process of adhesion and growth of osteoblasts and progenitor cells on the implant surface, is crucial for achieving osseointegration of the implant. Osseointegration is defined as the ability of an implant to anchor directly into the surrounding bone tissue without forming an interlayer of fibrous tissue [
5]. Biocompatibility is closely related to the surface characteristics of the implant, namely its roughness, wettability, chemical composition, surface topography, electrical charge, and electrical conductivity [
6]. Various treatment methods have been developed to improve the surface properties of titanium-based materials for colonization with bone cells. Generally, they can be divided into physical, mechanical, chemical, biological, and combined methods. An important aim of all these methods is to roughen the surface of the implant [
7]. This is believed to increase the adhesion, growth, and metabolic activity of bone cells [
8], resulting in improved bone-implant attachment, increased mechanical resistance of the bone-implant contact, and long-term stability of the implant [
9]. However, the optimal properties of a titanium surface, especially its roughness, have not yet been fully defined [
10] (for a detailed review of currently used titanium surface treatments, see [
2]).
Tissue engineering is an interdisciplinary field combining the principles of materials and cell transplantation to develop the optimal substitute for the desired tissue and/or to promote endogenous tissue regeneration [
11]. In accordance with this idea, the biocompatibility and the osseointegration of titanium implants can be improved not only by various physical, chemical, and other conventionally used treatments of the implant surface, but also by recruiting stem cells on to the implant surface, and pre-differentiating them toward osteoblasts already before implantation. In this spirit, several experiments have been performed using a combined in vitro and in vivo approach. For example, in a study by Bollman et al. [
12], the osseointegration of 3D-printed titanium implants with interconnected tubular structures, loaded with stromal cell-derived factor-I alpha, was markedly improved when these implants were pre-colonized with human bone marrow mesenchymal stem cells (MSCs) before they were implanted into the skull bone of rabbits [
12]. Yu et al. [
13] developed a complex of a titanium implant and a sheet of MSCs, where the anodized implant was enwrapped with a pre-cultivated cell sheet and was implanted into the rat tibia. In comparison with the traditional cell-free titanium implant, microCT analysis showed that the bone volume ratio and the trabecular thickness increased, while the trabecular separation decreased, in the group with the MSC-titanium complex. In accordance with these results, a histological examination revealed a greater amount of new bone tissue around the MSC-implant complexes and greater bone-implant contact [
13]. An in vitro study by Sushmita et al. [
14] further confirmed that it is advantageous to construct a cell-modified implant in order to achieve improved osseointegration. Specifically, dental pulp stem cell sheets were wrapped around smooth Ti implants and sandblasted large-grit acid-etched (SLA) Ti implants [
14]. Both types of surfaces supported cell colonization, but the smooth surface showed greater cell growth and extracellular matrix formation than the SLA surface [
14]. In another in vitro study, a comparison of the behavior of human MSCs on anodized titanium samples with nanopores of various sizes revealed that pores about 30–50 nm in diameter promoted early osteoblastic gene expression even without osteogenic supplements in the culture medium [
15].
It is therefore evident that the behavior of stem cells pre-seeded on the implant surface can be controlled by appropriate surface modifications to the material. Thorough development and tests on materials with these modifications with stem cells in vitro should precede tests on animal models in vivo, in accordance with the 3R principle of ethical use of animals in testing (i.e., replacement, reduction, refinement). In addition, not only the adhesion and growth, but also the osteogenic differentiation of stem cells should be induced by modifications to the material surface. Knowledge about the promotion of implant osseointegration by stem cells is rather sporadic, but it has been revealed that the insertion of undifferentiated dental pulp stem cells between a titanium-based implant and rat tail vertebrae delayed the osseointegration of the implant [
16]. Conversely, if these cells were pre-differentiated toward osteoblasts, the osseointegration process was accelerated [
16].
Based on the knowledge that we have gathered, we decided to compare the adhesion, growth, and osteogenic differentiation of rat adipose-derived mesenchymal stem cells on Ti6Al4V samples modified by methods widely used for preparing clinically used titanium-based implants, namely polishing, coating with diamond-like carbon, brushing, anodizing, and blasting. The behavior of cells in cultures on these surfaces was correlated with the surface roughness and the wettability of the material. We found that the cell behavior was governed preferentially by the surface roughness, which reached optimal values on brushed (BR) and anodized (AND) surfaces. On these surfaces, the Ra and Rq parameters, i.e., the most widely used parameters of material surface roughness, were within the range of several tens (i.e., 6–9 tens) of nanometers. On these surfaces, the cells reached the highest level of osteogenic cell differentiation and, at the same time, they maintained the good proliferation activity that is necessary for creating sufficient bone mass for proper implant osseointegration.
2. Materials and Methods
2.1. Ti6Al4V Samples and Their Modification, Characterization, and Cleaning
The substrates were custom-made of Ti6Al4V, grade 5 ELI, by Prospon s.r.o. company (Kladno, Czech Republic). Surface treatment was applied, namely polishing (PL), coating with diamond-like carbon (DLC), brushing (BR), anodizing (AND), and blasting (BL). The parameters of all surface treatments are listed in
Table 1. The substrates were disc-shaped, 15 mm in diameter and 1 mm in thickness. Microscopic glass coverslips (GL) were used as a reference material.
The morphology of the material surface was characterized using the contact mode of atomic force microscopy (NanoWizard
® 3 NanoOptics AFM System, JPK BioAFM Business, Berlin, Germany). The roughness of the substrates was analyzed by MountainsSPIP® software (version 6.7.9, Image Metrology A/S, Lyngby, Denmark); three samples for each treatment were analyzed (
Figure 1). The wetting properties of the samples were evaluated using sessile drop contact angle measurements, two liquids were used, i.e., deionized water and Ringer’s solution. Three samples for each treatment were analyzed and ten measurements were performed on each sample. Microscopic images were captured by a Dino-Lite system (AM4115TF, AnMo Electronics, New Taipei City, Taiwan), and the water drop contact angles were analyzed by ImageJ software, plugin Dropsnake (
Figure 2), from three samples of each treatment. Microscopic glass coverslips, which are regarded as standard cultivation substrates (similarly as tissue culture polystyrene), were used as control samples for comparing the cell behavior on the tested samples. The elemental composition of the materials was analyzed by a Vanta Energy-dispersive X-ray fluorescence (ED-XRF) spectrometer (Olympus, Hamburg, Germany).
In order to remove chemical residues generated during the production of the samples, and to ensure biocompatibility of the samples, all titanium substrates and glass coverslips were cleaned in 2% (w/v) NaOH (75 °C, 30 min), washed in ultrapure water (15 min) in a sonic bath, again cleaned in 2% (v/v) HNO3 (75 °C, 30 min), and finally washed in ultrapure water in a sonic bath (15 min). Next, all substrates were dried out in an N2 atmosphere at 60 °C for 20 min. Finally, the samples were sterilized in an autoclave (Tuttnauer, City of New York NY, USA) at 121 °C, pressure 101.3 kPa, time of the sterilization process 10 min.
2.2. Isolation and Cultivation of Rat Adipose-Derived Stem Cells
Rat adipose tissue-derived stem cells (ASCs) were used for an investigation of the adhesion, growth, and osteogenic differentiation of stem cells on the tested samples. The adipose tissue was excised from the abdominal area of male rats (Lewis, 500 g), sacrificed by an overdose of sodium thiopental anesthesia. The tissue was minced with a sterile scalpel and was digested with 0.1% collagenase type I (Gibco, Thermo Fisher Scientific, Waltham, MA, USA) for 1 h. The resulting suspension of cells was centrifuged (300 g, 5 min) five times, and after each centrifugation, the cells were washed with a sterile phosphate-buffered saline (PBS). The isolated stem cells were cultured in a growth medium consisting of a 1:1 mixture of low glucose (1 g/L) Dulbecco’s modified Eagle medium and Ham’s F-12 medium (DMEM/F12), both purchased from Sigma-Aldrich, St. Louis, MO, USA. The medium was supplemented with 10% of fetal bovine serum, 10 ng/mL of FGF2, and 1% of ABAM antibiotics (100 IU/mL of penicillin, 100 µg/mL of streptomycin, and 0.25 µg/mL of Gibco Amphotericin B; Sigma-Aldrich, MO, USA). The cells were seeded into 75 cm2 culture flasks (TPP, CH); 400,000 cells in 12 mL of culture medium), and were cultivated at 37 °C in an air atmosphere with 5% CO2 in a humidified incubator. The culture medium was changed every three days. Cell passaging was performed when the cells reached 80% confluence, using a 1mM EDTA solution and a 0.05% trypsin/0.5 mM EDTA solution in PBS.
For the experiments, the cells were seeded on to sterile Ti6Al4V samples and control glass coverslips inserted into 24-well culture plates (TPP, CH). The cells were seeded in a density of approx. 10,000 cells/cm2; cells in the third passage were used. Differentiation of ASCs toward osteoblasts was induced using an osteogenic culture medium consisting of DMEM supplemented with 10% of fetal bovine serum, 1% ABAM, 50 μg/mL of ascorbic acid, 100 nM of dexamethasone, and 10 mM of β-glycerol phosphate.
2.3. Number, Morphology, and Osteogenic Differentiation of ASCs on Ti6Al4V Samples
Immunofluorescence staining of cells and tests of cell metabolic activity, of the calcium consumption from the culture medium and of the activity of alkaline phosphatase were carried out for an evaluation of the adhesion, proliferation, and osteogenic differentiation of ASCs.
2.3.1. Immunofluorescence Staining, Staining the Nuclei and the F-actin in Cells
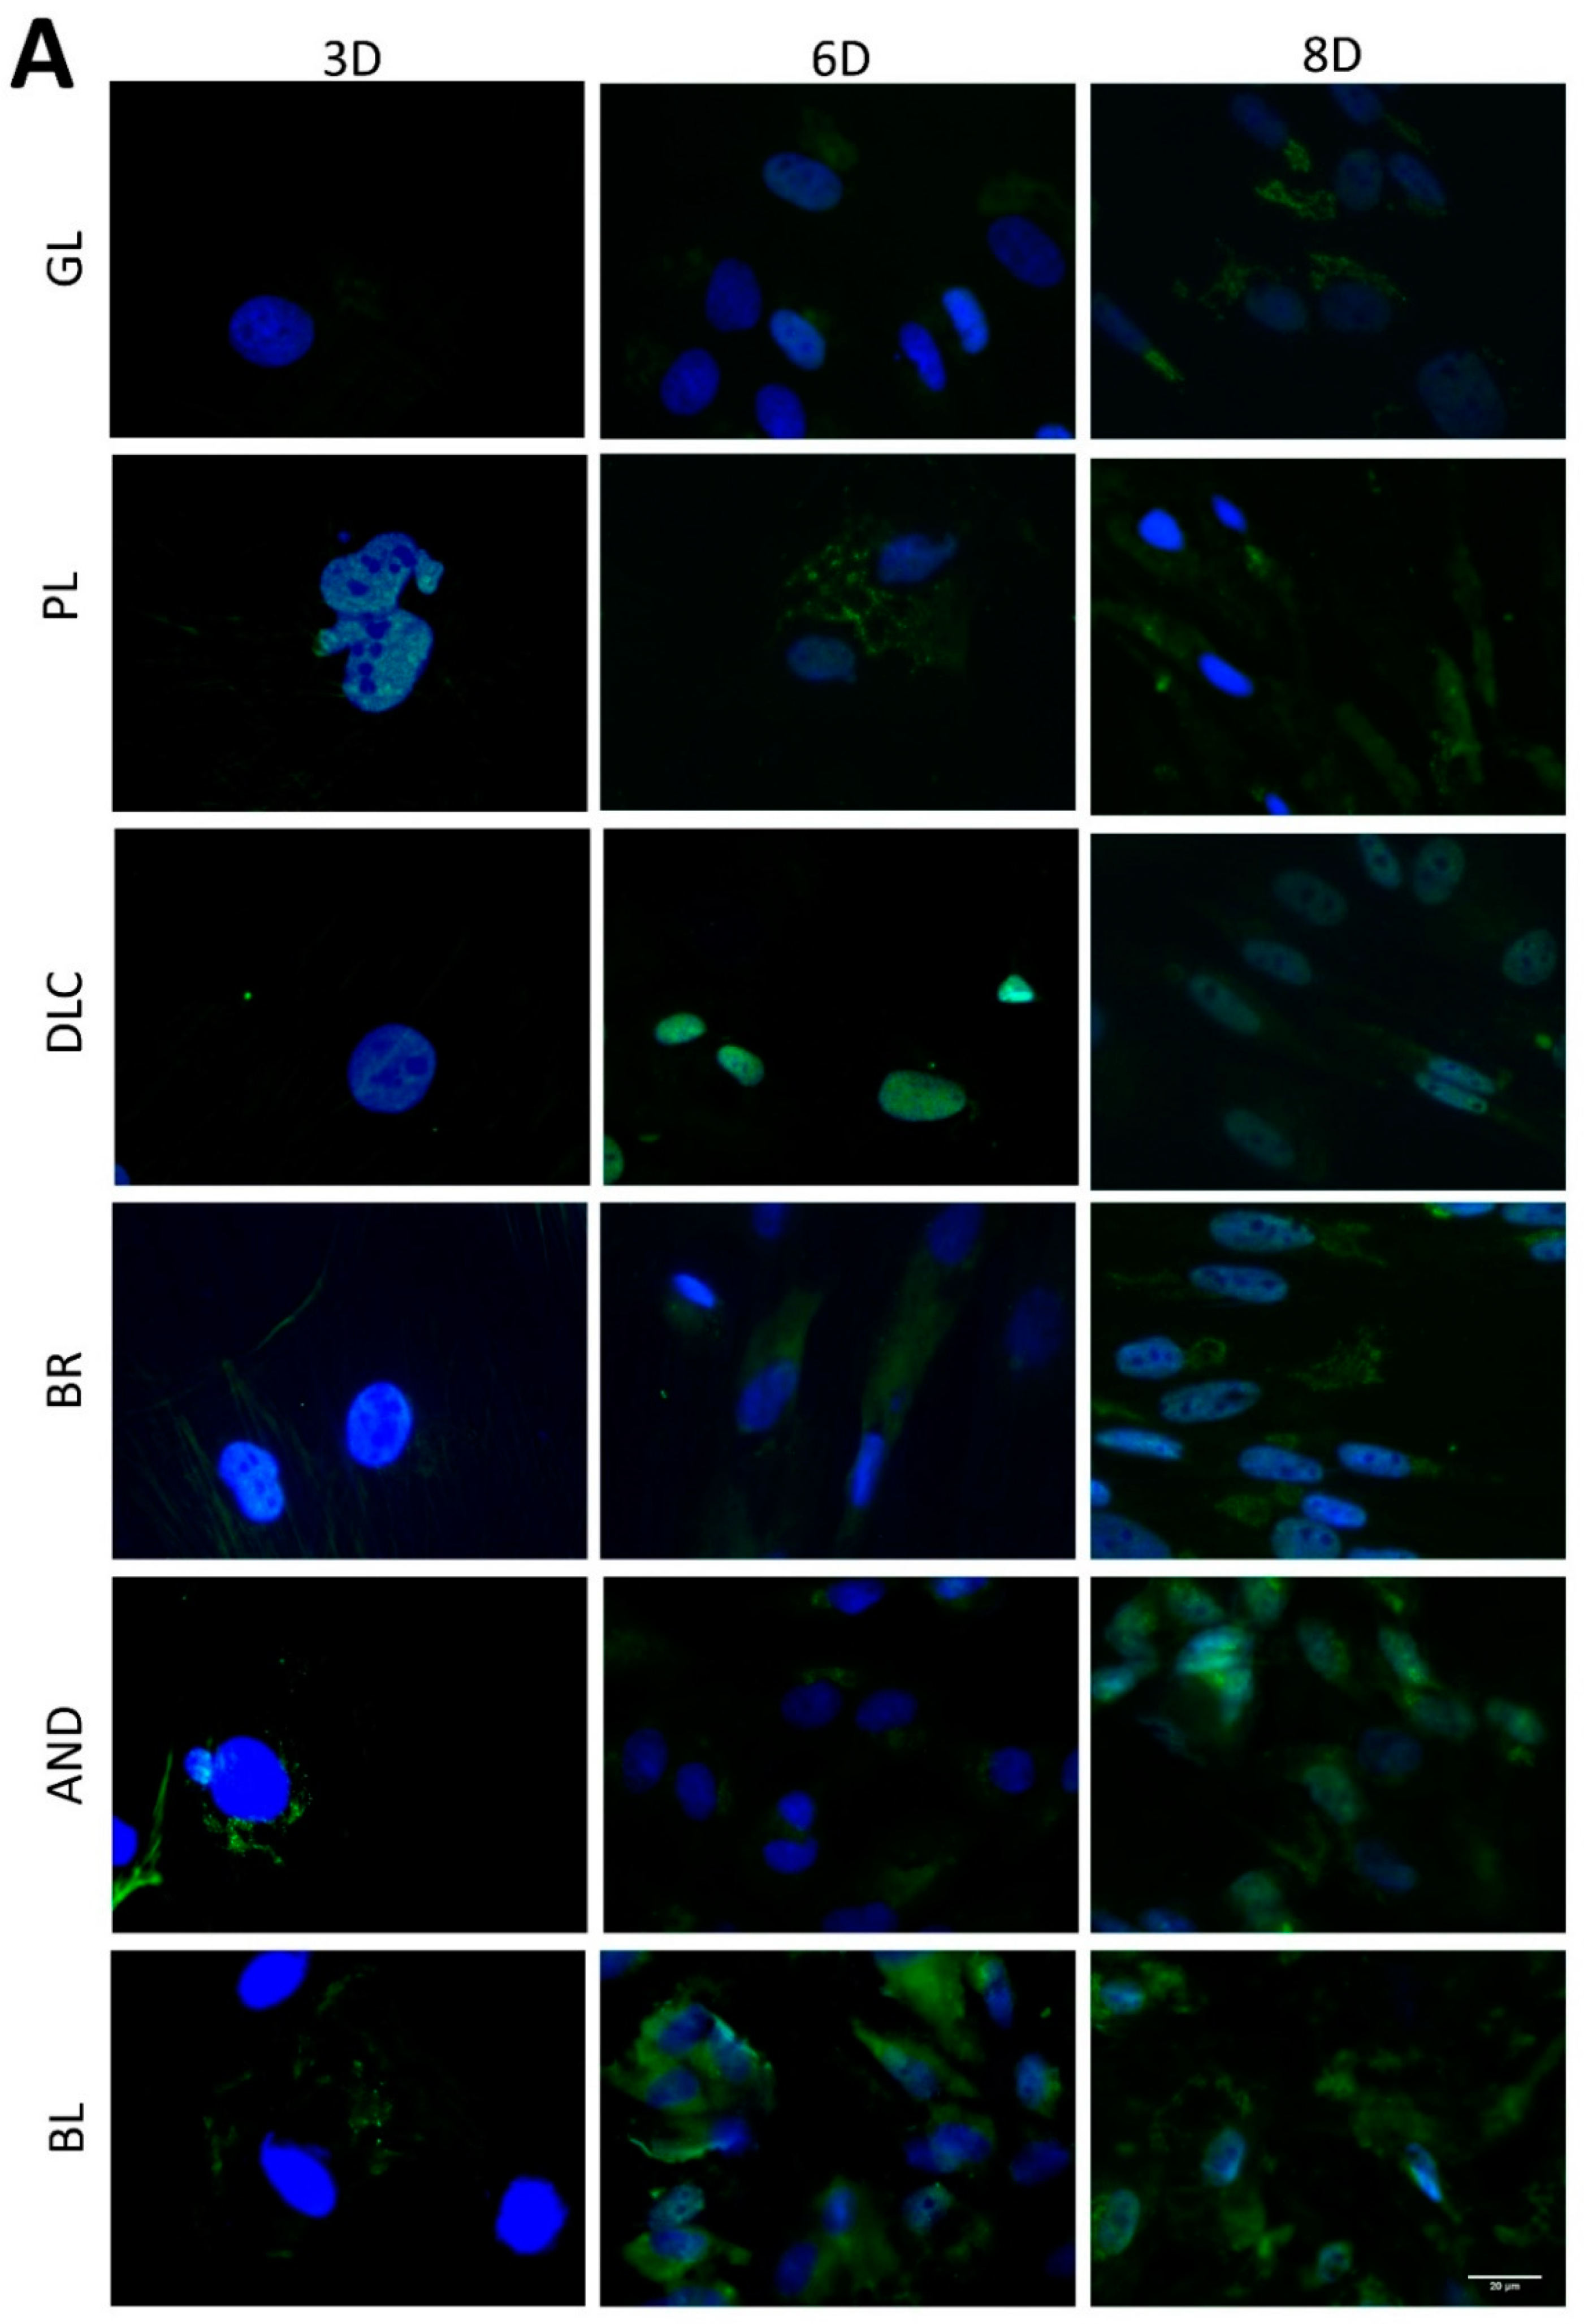
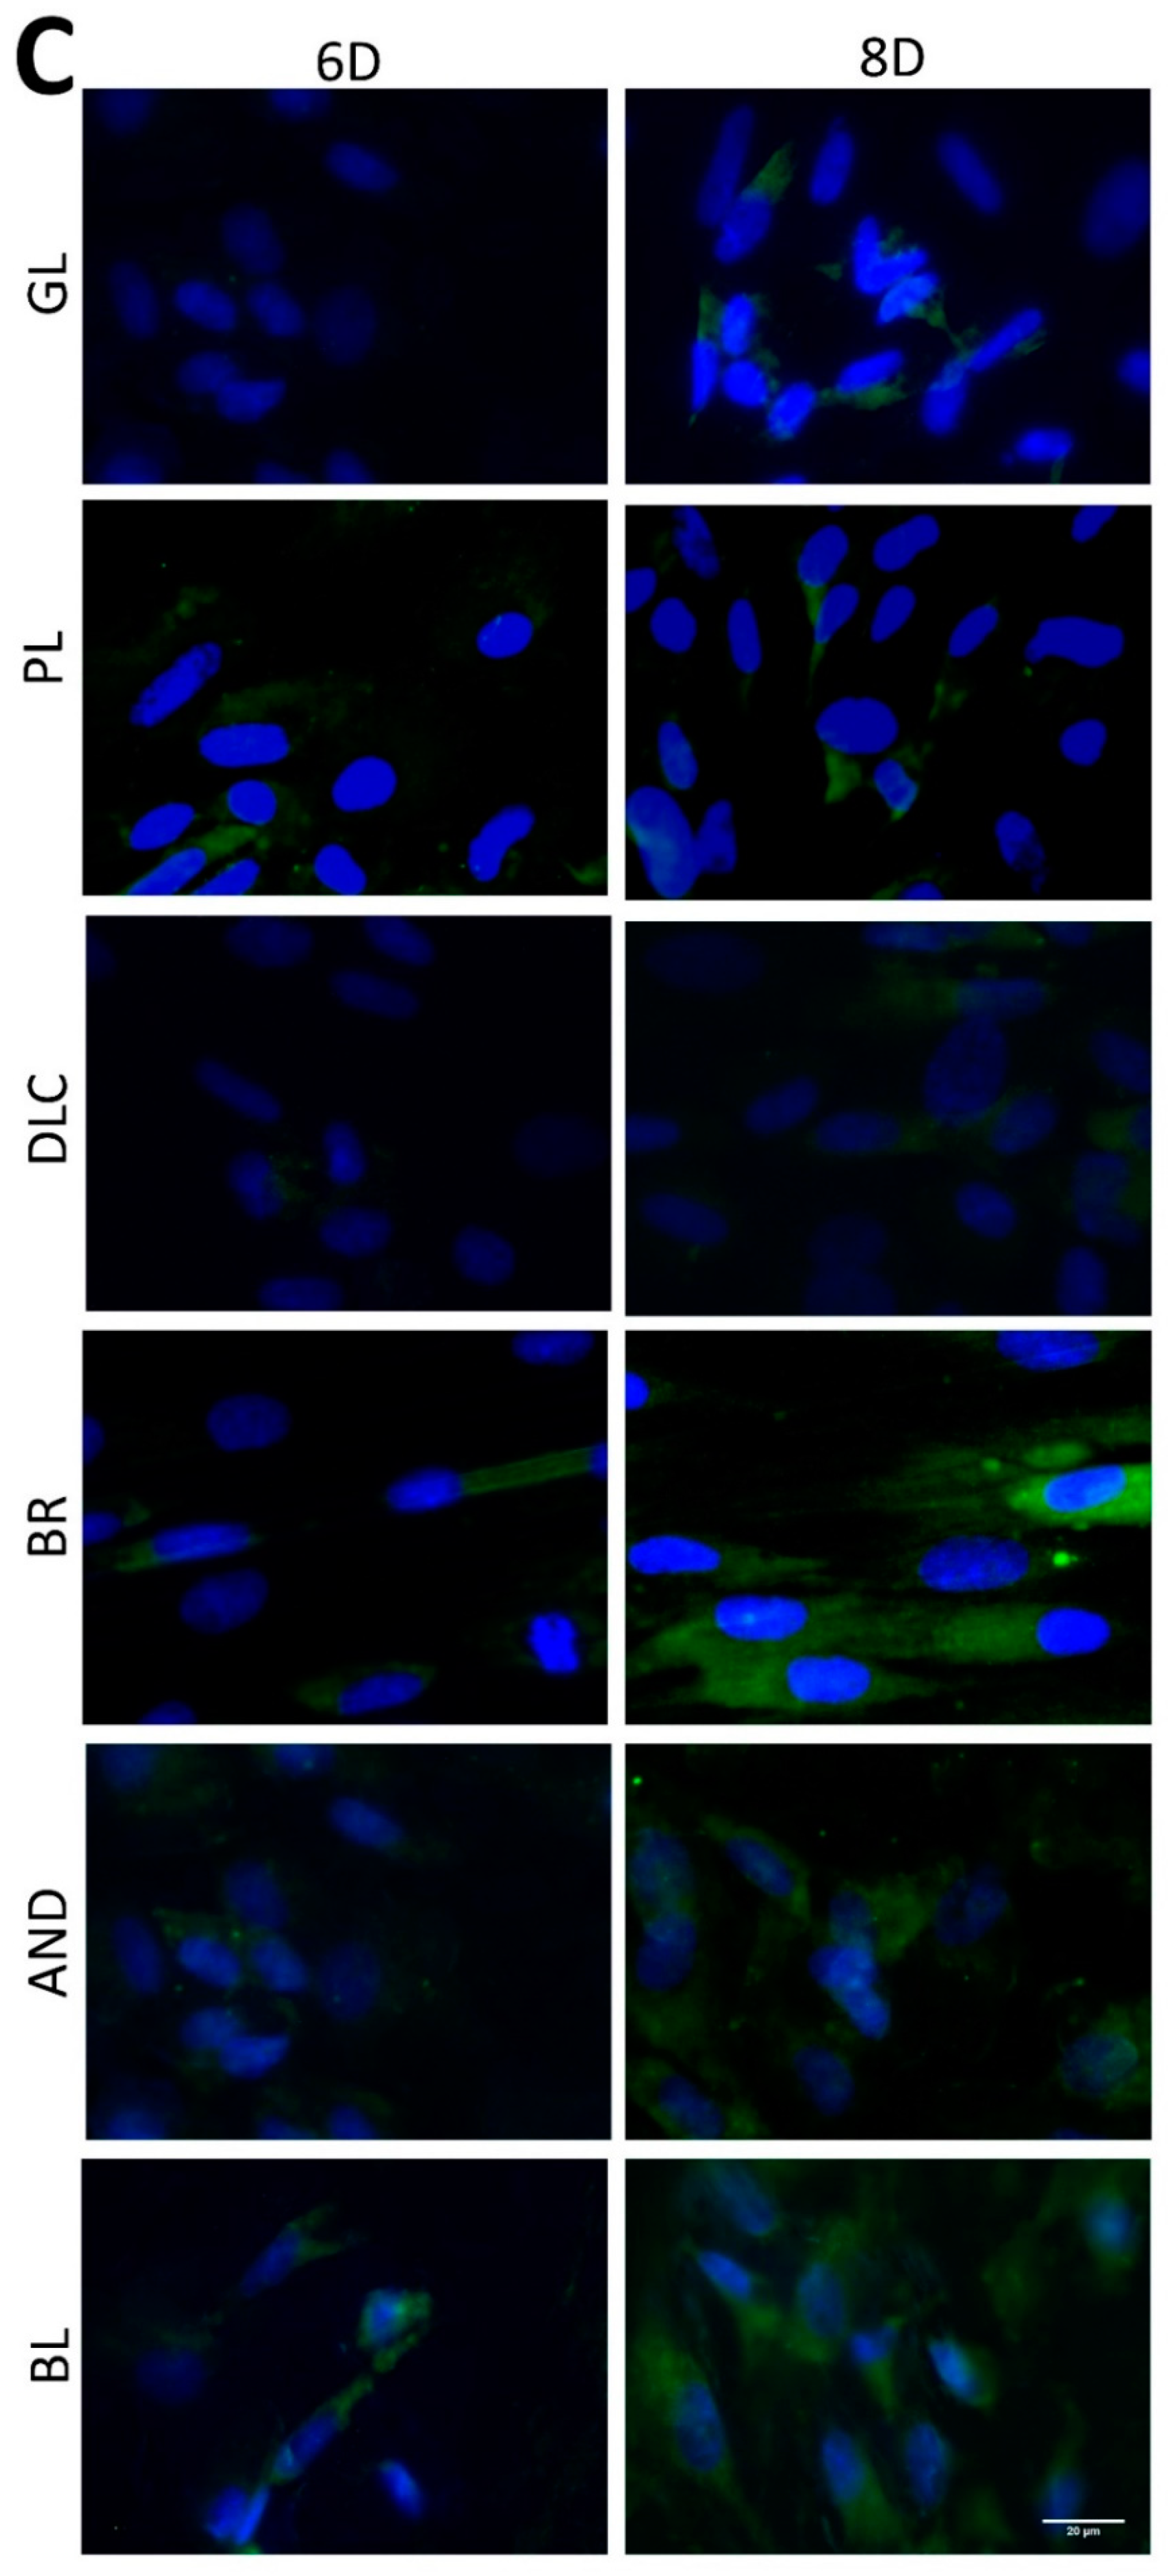
Immunofluorescence staining of the cells was performed in order to visualize markers of early and intermediate osteogenic cell differentiation. The early markers included Runt-related transcription factor 2 (RUNX2), a protein responsible for inducing the differentiation of mesenchymal stem cells into immature osteoblasts, and type I collagen, an important protein of bone ECM, the expression of which is stimulated by RUNX2. Intermediate osteogenic markers were represented by osteopontin (OPN), also referred to as bone sialoprotein 1, i.e., an acidic and negatively charged ECM phosphoglycoprotein, which is deposited into non-mineralized matrix prior to calcification [
17].
The immunostaining of all osteogenic markers was carried out in cells after 3, 6, and 8 days of cultivation. Cells were fixed using 4% paraformaldehyde (Sigma-Aldrich, St. Louis, MO, USA) for 20 min at room temperature (RT). The cell membranes were then permeabilized using 0.1% Triton X-100 in PBS for 15 min at RT. In order to block non-specific binding sites for antibodies, the samples were treated for 1 h at RT with PBS containing 0.1% of Tween 20 (PBST), 1% bovine serum albumin (BSA), and 22.52 mg/mL of glycine. The cells were then exposed to primary mouse monoclonal antibodies, namely RUNX2 antibody (sc-101145, 0.4 µg/mL), COL1A1 antibody (sc-293182, 0.4 µg/mL), and OPN antibody (sc-21742, 0.8 µg/mL); all purchased from Santa Cruz Biotechnology, TX, USA. The primary antibodies were applied at RT overnight in humidified chambers. Together with the primary antibodies, tetramethylrhodamine (TRITC)-conjugated phalloidin, which stains the filamentous actin (F-actin) in the cell cytoskeleton, was also applied (Sigma-Aldrich, Cat. No. P1951, 2 µg/mL). As the secondary antibody, Alexa Fluor 488®-conjugated F(ab‘) fragment of goat anti-mouse IgG (H1L, Cat. No. A11017; diluted in PBS + 1% BSA, 1 µg/mL) was applied at RT for 180 min in humidified chambers. The samples that served as negative controls for staining were processed in the same way, but without the secondary antibody. Finally, the samples were mounted on thin glass coverslips using a mounting medium with DAPI, i.e., a nucleic acid stain (F6057, Sigma-Aldrich, MO, USA). The cells were then evaluated in an inverted fluorescence microscope (Leica DMi8, Wetzlar, DE), and images of randomly selected microscopic fields were taken. For each osteogenic marker, the same exposure and light excitation setting were used for all groups of tested samples.
In order to estimate the amount of differentiation markers in the cells, the intensity of the fluorescence of these markers in the cell images was analyzed using our custom-made LabVIEW software. The same threshold for each image of a given marker was set in order to remove the background from the image data. Then, the cumulative sum of all pixel intensities was evaluated, and the background intensity of the negative staining control was subtracted. The total immunofluorescence intensity values of each marker were normalized to the number of cells in the microscopic field. The intensity of the fluorescence of the cells on the reference glass samples was set to 1.
2.3.2. Evaluating the Number, the Metabolic Activity, and the Morphology of the Cells
The immunofluorescence pictures of cells with DAPI-counterstained cell nuclei were further utilized for evaluating the cell numbers. The cell number was assessed after 3, 6, and 8 days of cultivation, when the intensity of the fluorescence of DAPI in the cell images was measured and was compared with the values obtained on the control glass coverslips on day 3. Using this technique, the cell number was estimated in 15 microscopic fields on three samples for each experimental group and time interval, and then the cell population densities per cm2 were calculated and the growth dynamics were evaluated.
In addition to the cell number, the cell metabolic activity (i.e., the activity of mitochondrial enzymes in the cells) was evaluated using a resazurin assay. After 3, 6, and 8 days of cell cultivation, the cells on the tested samples were incubated with 10% resazurin (R7017, Sigma-Aldrich, St. Louis, MO, USA), diluted in a phenol red-free medium for 2 h at 37 °C according to the manufacturer’s instructions. For spectroscopic determination, the medium taken from the wells with the tested samples was pipetted into microcuvettes, and the absorbance (wavelength 570 nm) was measured by a spectrophotometer (WPA Lightwave II, Biochrom Ltd., Cambridge, UK). The experiments were performed in a series of four samples per experimental group and time interval. The absorbance values were normalized to the cell counts on the tested samples (i.e., they were calculated per cell), and the value on the glass control on day 3 was set as 100% of the metabolic activity.
The immunofluorescence images of cells with F-actin cytoskeleton counterstained with TRITC-conjugated phalloidin were further utilized for an evaluation of the spreading, the shape and the orientation of the cells after 3, 6, and 8 days of cultivation on the tested surfaces.
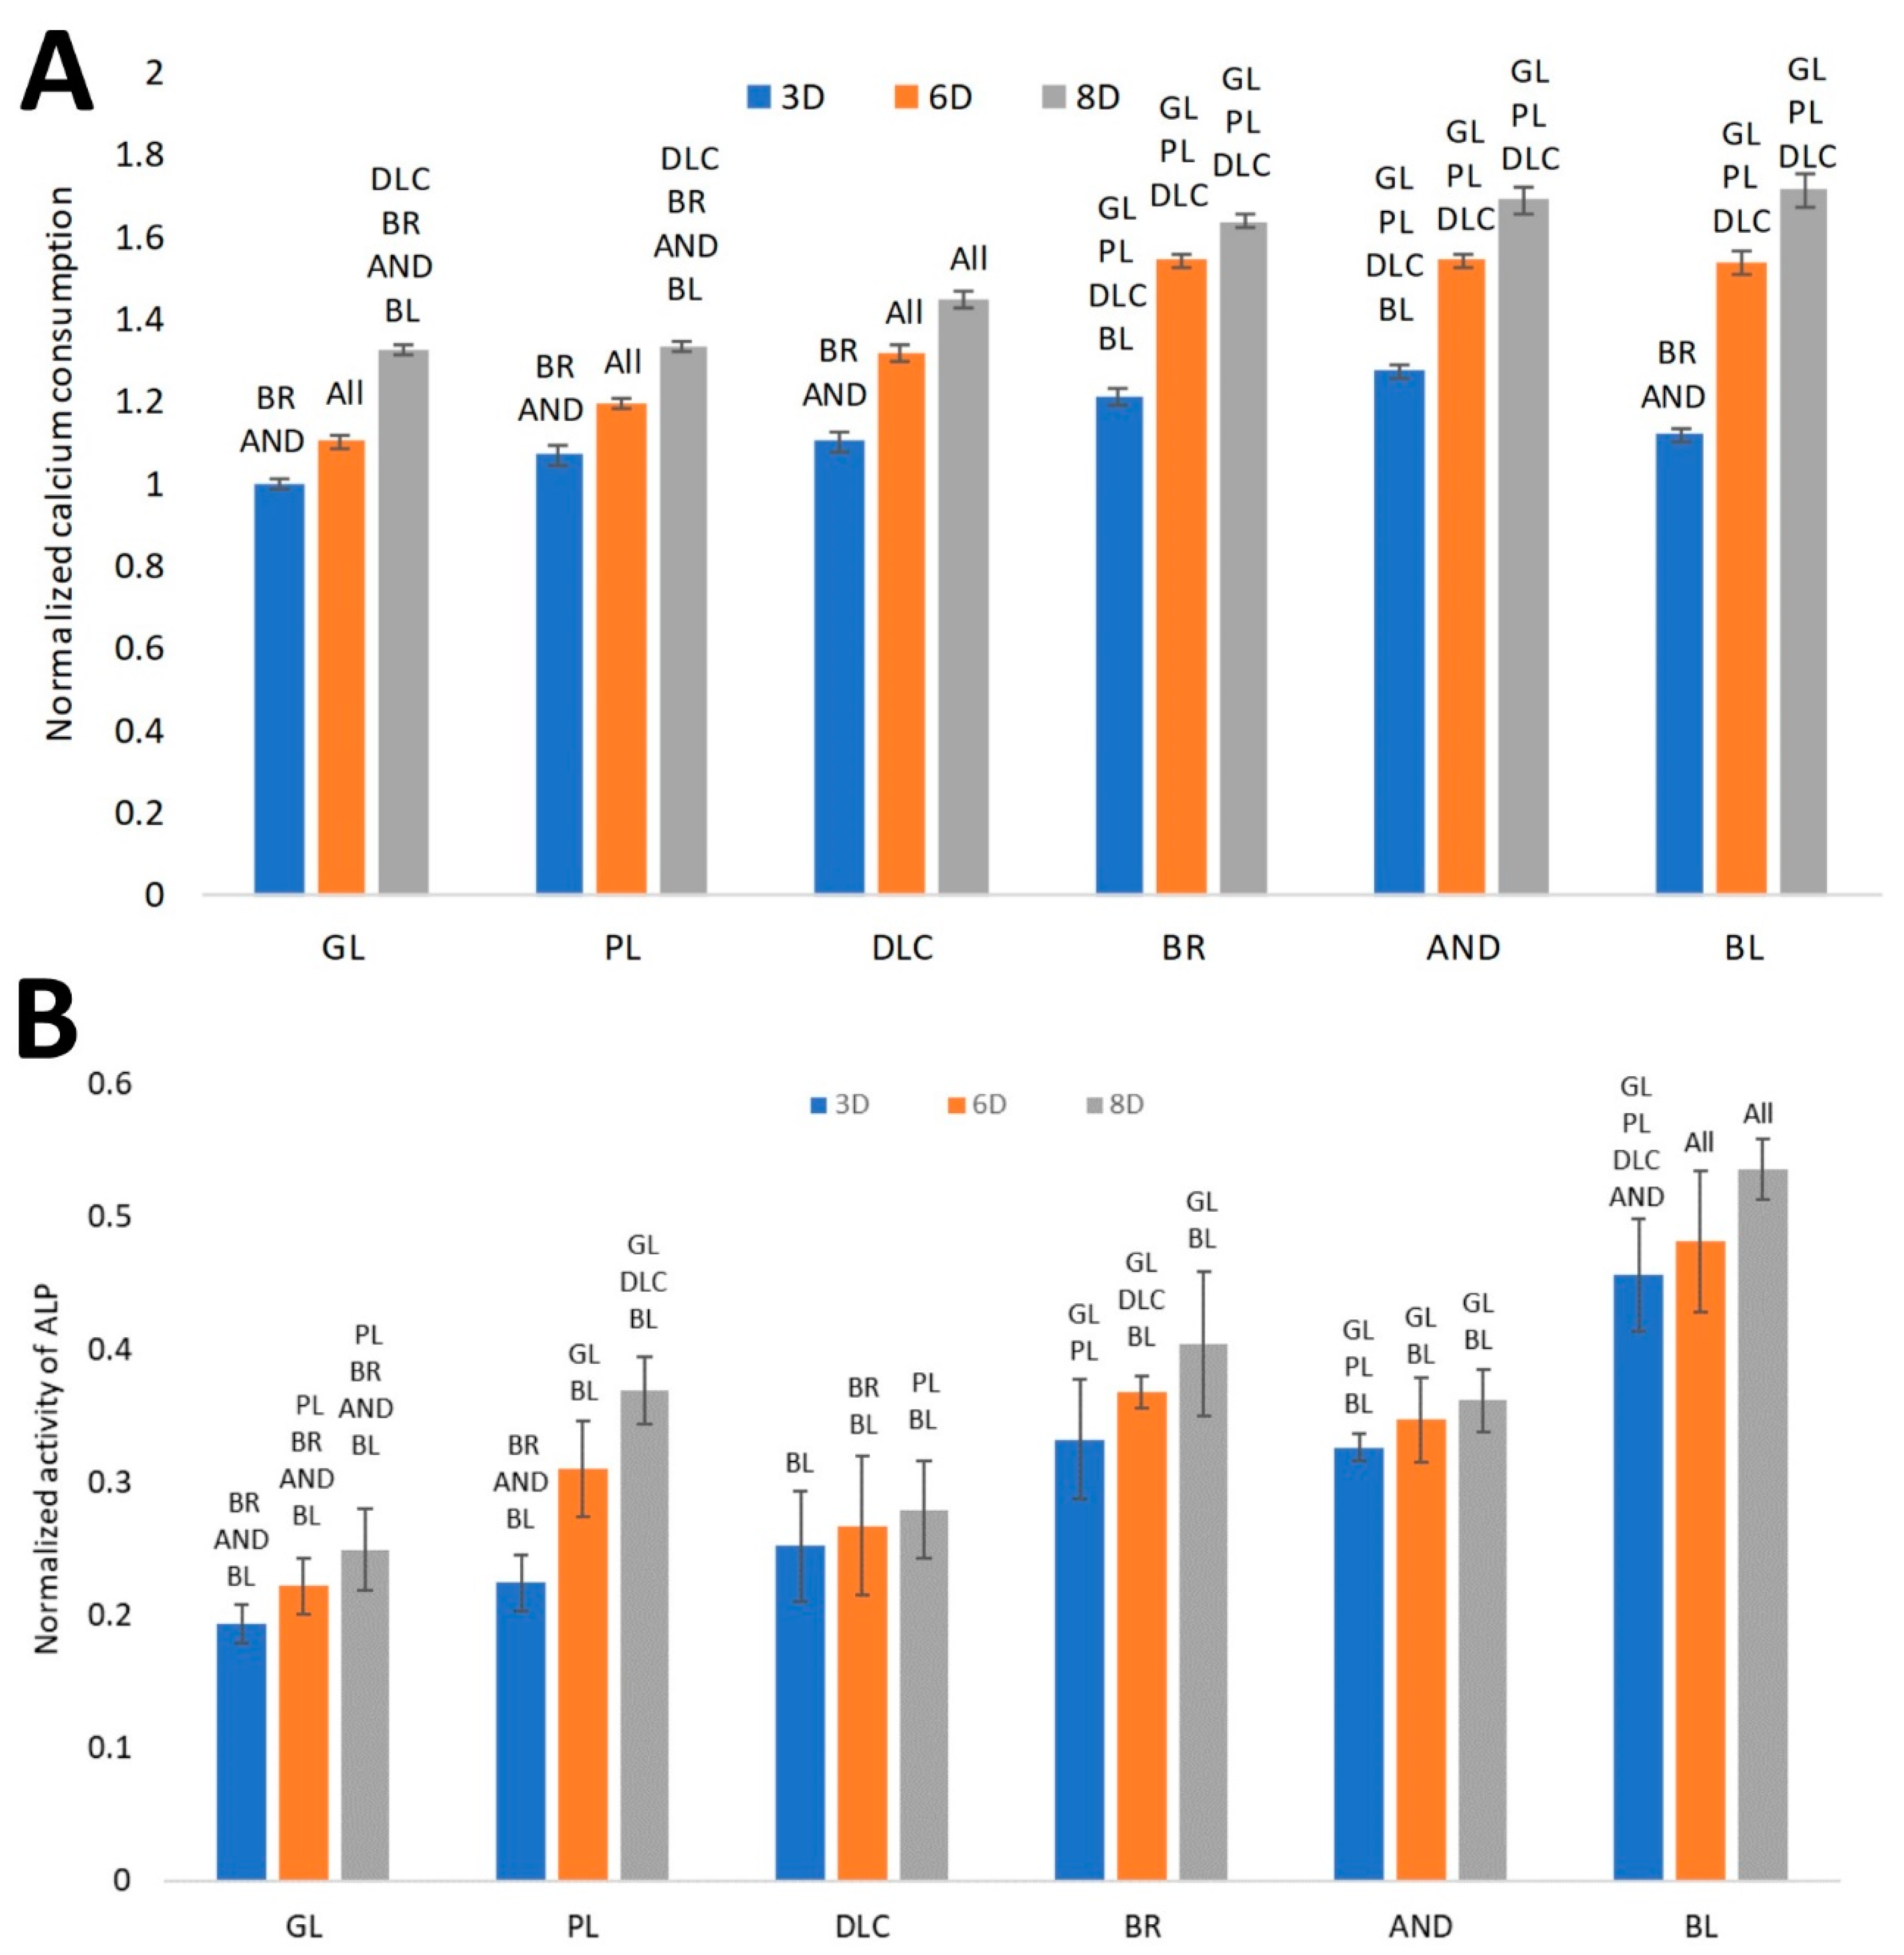
2.3.3. Evaluating the Calcium Concentration in the Culture Medium
On days 3, 6, and 8 of cultivation, the culture medium was taken from the wells with the tested samples and was analyzed for the concentration of calcium, using a calcium colorimetric assay (MAK022, Sigma Aldrich, St. Louis, MO, USA). The calcium concentration in the culture medium is a cell-nondestructive marker of osteogenesis, suitable for evaluating the osteogenic potential of tissue-engineered bone grafts before they are implanted [
18]. It is known that the depletion of calcium from the culture medium reflects its capture by cells, its deposition into the ECM, and the formation of mineralized bone matrix [
18]. For the analysis, the cells on the samples were cultivated in a relatively large amount of culture medium (2 mL per well in 24-well plates). The culture medium was not changed, so that the cumulative change in the calcium concentration throughout the entire cell cultivation period could be measured. The calcium concentration in the medium was measured according the manufacturer’s protocol. Briefly, the culture medium was diluted with deionized water (1:9) to a final volume of 50 μL. Then 90 μL of the chromogenic reagent and 60 μL of the calcium assay buffer were added, and the solution was gently mixed. After 10 min at RT in darkness, the absorbance of the solutions was measured at 575 nm. The results were expressed as the calcium consumption by the cells, i.e., an inverse value (1/c) of the calcium concentration in the culture medium was calculated. All results were standardized to the reference values obtained from the glass samples.
2.3.4. Evaluating the Activity of Alkaline Phosphatase in the Cells
The activity of alkaline phosphatase (ALP), i.e., an enzyme participating in bone matrix mineralization, was evaluated in cells on the tested samples as another important marker of osteogenic cell differentiation. For this analysis, lysates were prepared from cells after 3, 6, and 8 days of cultivation. First, the culture medium was removed from the wells, and the cells on the tested samples were washed twice with ice-cold PBS. Then an RIPA lysis buffer with a protease inhibitor in a concentration of 1:100 (HALT protease inhibitor, Thermo Fisher Scientific, Waltham, MA, USA) was applied, and the cells were scraped from the samples using a cell scraper to prepare the cell lysates. The lysates were centrifuged (15 min, 14,000× g, 4 °C) and the supernatants were stored at −20 °C. The ALP activity in the cell lysates was measured 3, 6, and 8 days after cell seeding, using an enzyme-linked immunosorbent assay (ELISA) with the alkaline phosphatase yellow (pNPP) liquid substrate system (P7998, Sigma-Aldrich, MO, USA). The reaction was stopped after 60 min from its start by an equal amount of 5M NaOH. The absorbance was measured at 405 nm by a TECAN reader (Infinite 200 PRO, Tecan, Männedorf, Switzerland).
2.4. Statistical Analysis
The results are presented as the arithmetical averages ± standard deviation (SD) from three experiments performed in duplicate or in triplicate. For each experiment, cells isolated from one animal were used. The statistical significance was evaluated using parametric one-way analysis of variance ranks and ANOVA to compare the results obtained from several groups of samples. The differences among the experimental groups were considered significant at p ≤ 0.05.
4. Discussion
In this study, we have demonstrated the influence of the surface properties of Ti6Al4V samples with various surface treatments on the adhesion, proliferation, and osteogenic differentiation of adipose-derived mesenchymal stem cells (ASCs). These treatments are currently used for clinically applied bone implants, and include polishing (PL), brushing (BR), blasting (BL), anodizing (AND), and coating with diamond-like carbon (DLC). The motivation for our study was to verify whether these commercially produced treatments are able to support desired functions in adult mesenchymal stem cells, which could be implanted together with surface-modified implants into the bone tissue of patients in order to improve the osseointegration of the implant. It has been reported that the implantation of titanium-based materials pre-seeded with mesenchymal stem cells improved the osseointegration of these implants in rabbit [
12] and rat [
13] models in vivo, especially when the cells were pre-differentiated toward osteoblasts [
16]. Another motivation was a common aim of tissue engineering, i.e., to test the biocompatibility and other behavior of artificial materials in biological environments according to the 3R principle, i.e., first by their interaction with cells in vitro, and then by implanting the most promising samples in vivo, and in this way to reduce the use of experimental animals. For our experiments, we used adipose tissue-derived mesenchymal stem cells (ASCs) from rats. ASCs are not typically used for osteogenic differentiation, but several studies have confirmed that these cells have considerable osteogenic and chondrogenic potential [
19,
20]; for a review, see [
21]. On the one hand, the osteogenic potential of ASCs is lower than the osteogenic potential of bone marrow mesenchymal stem cells (bmMSCs), as revealed by our earlier study [
22]. However, ASCs can be isolated in large amounts from fat tissue, which is localized subcutaneously. It is therefore relatively easily accessible by a less-invasive approach, i.e., by liposuction, whereas harvesting a large volume of bone marrow is painful and increases the risk of morbidity of the donors [
23].
There have only been a limited number of studies demonstrating the adhesion, growth, and osteogenic differentiation of stem cells on titanium-based materials, and very few studies have investigated the implantation of these materials pre-colonized with stem cells pre-differentiated toward osteoblasts. Our study presented here can be regarded as pioneering work on the development of a novel modification of conventionally used metallic bone implants beyond the current state-of-the-art. The interaction between titanium-based implants and cells has been studied mainly on osteoblasts, including various lines of osteoblast-like cells often derived from bone tumors [
4,
8,
10]; for a review, see [
2,
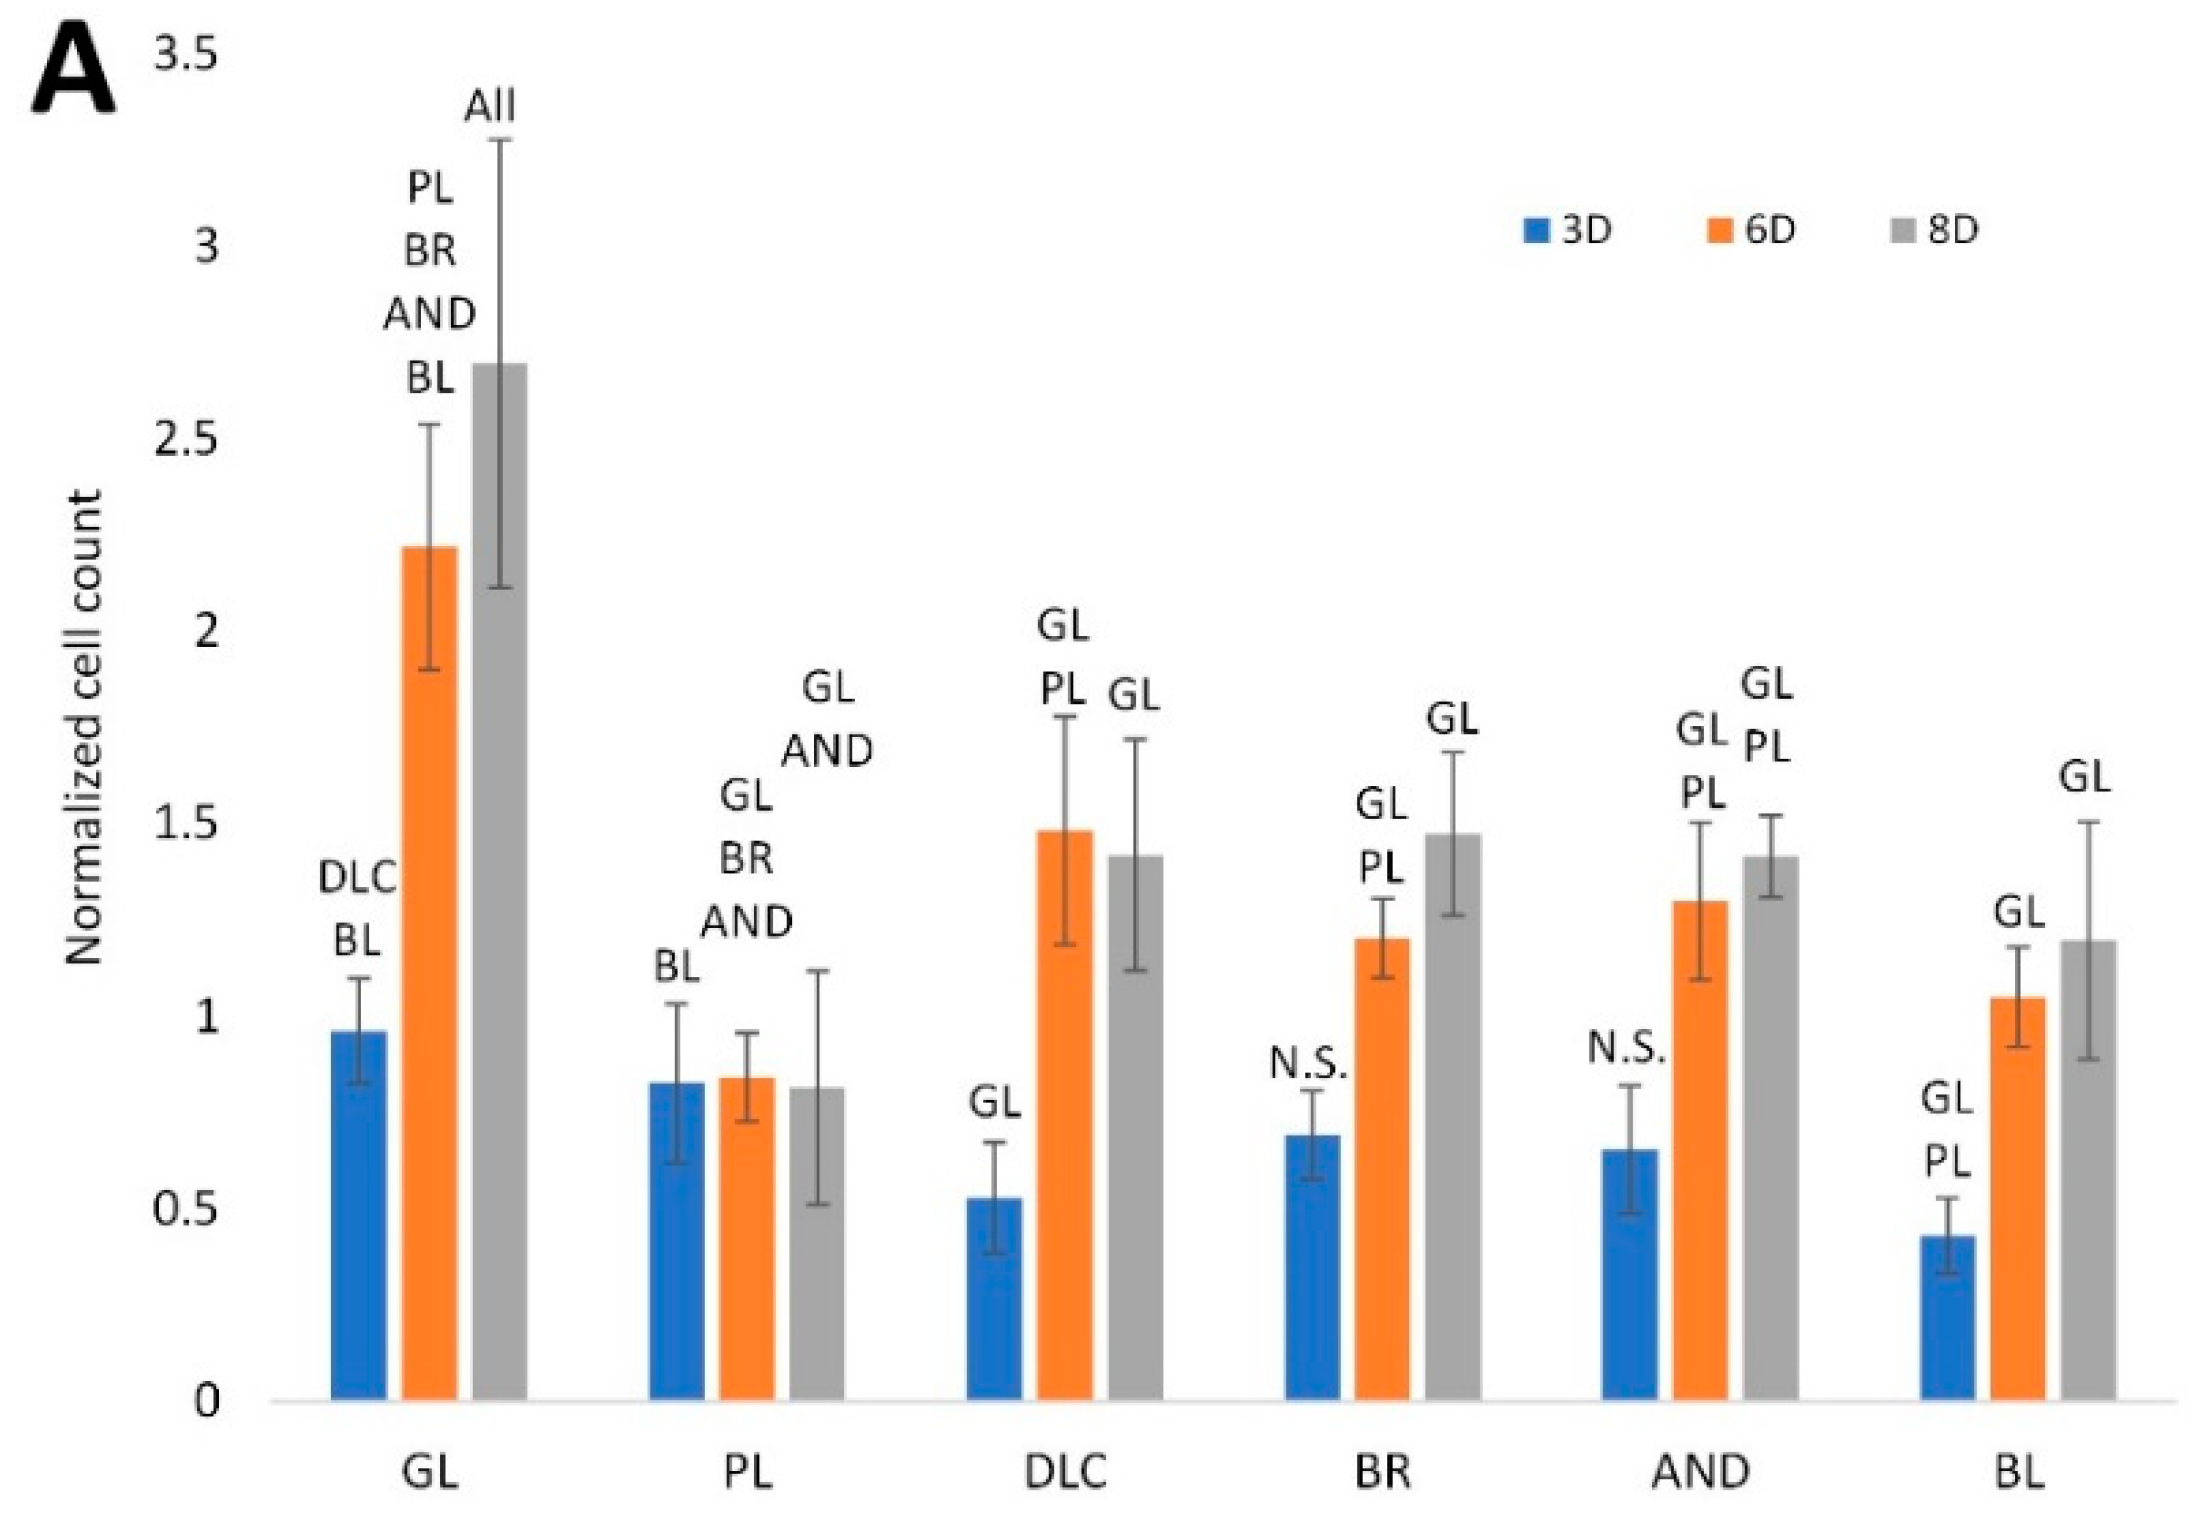
6]. The cellular response in these studies was governed by various physical and chemical surface properties of Ti-based materials, particularly by surface roughness and wettability, and also by the crystallographic orientation of the metallic materials, or by the surface charge density. According to these findings, the material surface roughness also had a pronounced effect on the behavior of ASCs in our study. Based on cell counts, flat surfaces with the Ra parameter from 0.3 to approx. 20 nm were optimal for cell adhesion and growth, which was documented by the highest cell counts achieved on glass and DLC surfaces. Interestingly, the cell counts on another flat surface, i.e., on a polished (PL) Ti6Al4V surface, showed no increasing tendency from day 3 to 8 of cultivation. This effect could be explained by the tendency of the cells to peel off from smooth surfaces, probably because of the weak adherence of cells to these surfaces (
Figure 5). In addition to PL samples, this effect was also apparent on DLC surfaces and on some control glass samples, especially when well plates with the samples were handled. In this context, surface roughness of the material of several tens of nanometers (Ra approx. 60–70 nm) appeared to be more suitable for firm cell adhesion without any peeling and for subsequent cell growth, although the cell counts on the BR, AND, and BL samples were comparable to the cell counts on the DLC samples. On the BR, AND, and BL samples, the increase in the cell counts was apparent mainly between days 3 and 6, and it continued, though slowly, in the BR and AND samples up to day 8. In the DLC samples, however, the cell number showed a tendency to decrease. On the BL samples, i.e., on substrates with submicron-scale surface roughness, the cell counts were slightly lower than on the substrates with roughness in tens of nanometers. These results are in accordance with other studies, where material surface roughness in tens of nanometers is considered to be most similar to the structure of the natural bone tissue. For example, nanocrystalline diamond films with root mean square (RMS) roughness of 20 nm were more suitable for the adhesion and osteogenic differentiation of human osteoblast-like Saos-2 cells than films with RMS roughness of 270 or 500 nm, or flat polystyrene surfaces. This was explained by the greatest similarity of films with RMS 20 nm to the real bone surface [
24].
The beneficial effect of nanostructured surfaces on the adhesion and growth of osteoblasts has been further attributed to the preferential adsorption of vitronectin on these surfaces, due to its relatively small and linear molecule. Vitronectin is then preferentially recognized by osteoblasts rather than by other cell types, because osteoblasts bind specifically the Lys-Arg-Ser-Arg (KRSR) sequence in the vitronectin molecule [
25]. Micro-scale surface roughness (irregularities > 1 μm), originating from mechanical machining and blasting the material surface with relatively large particles, can hamper cell adhesion, spreading and proliferation. This is due to the inappropriate size, shape, and spacing of the irregularities on the material surface relative to the cells [
25].
Another important factor influencing the cell-material interaction is the wettability of the material surface. This factor is closely related to the surface roughness of the material, although there are several other factors that can influence the hydrophilicity of the surface of a material, e.g., the chemical composition of the surface. In accordance with this, the water drop contact angle of the Ti-based surfaces in our study was in the range of approx. 60° to 75°, but in case of DLC, the angle was only 38°. In numerous studies, the hydrophilicity (i.e., a lower water drop contact angle) of a material has been described as a factor increasing the adhesion and proliferation of cells. This positive effect has been explained by the adsorption of cell adhesion-mediating proteins, e.g., vitronectin and fibronectin, from the serum supplement of the culture medium in a physiological, flexible geometrical conformation, which can be well-recognized by the cell adhesion receptors and can be remodeled by the cells. Conversely, on hydrophobic surfaces, the cell adhesion-mediating proteins are adsorbed in a rigid, denatured form, which limits the binding of cell adhesion receptors [
26,
27]. However, our results showed that a decreased water drop contact angle, i.e., increased wettability of the DLC samples, had a rather negative effect on the adhesion, the proliferation, and especially the osteogenic differentiation of ASCs in cultures on these samples. Similar results have also been obtained in other studies focused on cell attachment to biomaterials with various levels of wettability. For example, in a study performed on plasma-treated hexamethyldisiloxane, samples with the water drop contact angle ranging from 0° to 100°, the attachment of mouse MC3T3-E1 pre-osteoblasts was highest on samples with contact angles from 60° to 80° [
28], i.e., on slightly hydrophilic or even hydrophobic substrates. According to a study by Vogler et al. [
29], surfaces with a water drop contact angle lower than 65°, defined as hydrophilic, exhibited short-range repulsive forces between opposing surfaces immersed in water, while surfaces with the contact angle greater than 65°, defined as hydrophobic, exhibited long-range attractive forces between the opposing surfaces [
29]. Accordingly, hydrophilic surfaces were less efficient in adsorbing proteins contained in the fetal bovine serum, which is commonly used as a supplement for the standard culture media [
29]. It is known that the strength and the stability of the adsorption of cell adhesion-mediating proteins from the serum in the culture medium decrease with increasing wettability of a material (for a review, see [
22]). The cell adhesion is therefore optimal on moderately wettable materials, while highly hydrophilic surfaces can behave as repulsive for cells. In accordance with this, the cells on DLC samples with the lowest contact angle of 38° were prone to peel off from the surface of the material. However, cell peeling was also apparent on the PL samples and on the control glass samples, i.e., on samples with contact angles of approx. 60–65°, i.e., close to the optimal values. The peeling could therefore be attributed to low surface roughness rather than to high surface wettability. Similarly, in a study by Pivodova et al. [
8], various physical treatments of titanium samples that affected the surface roughness of the material played a more important role than chemical modifications affecting the material surface wettability in the behavior of human osteoblast-like Saos-2 cells in cultures on these samples [
8].
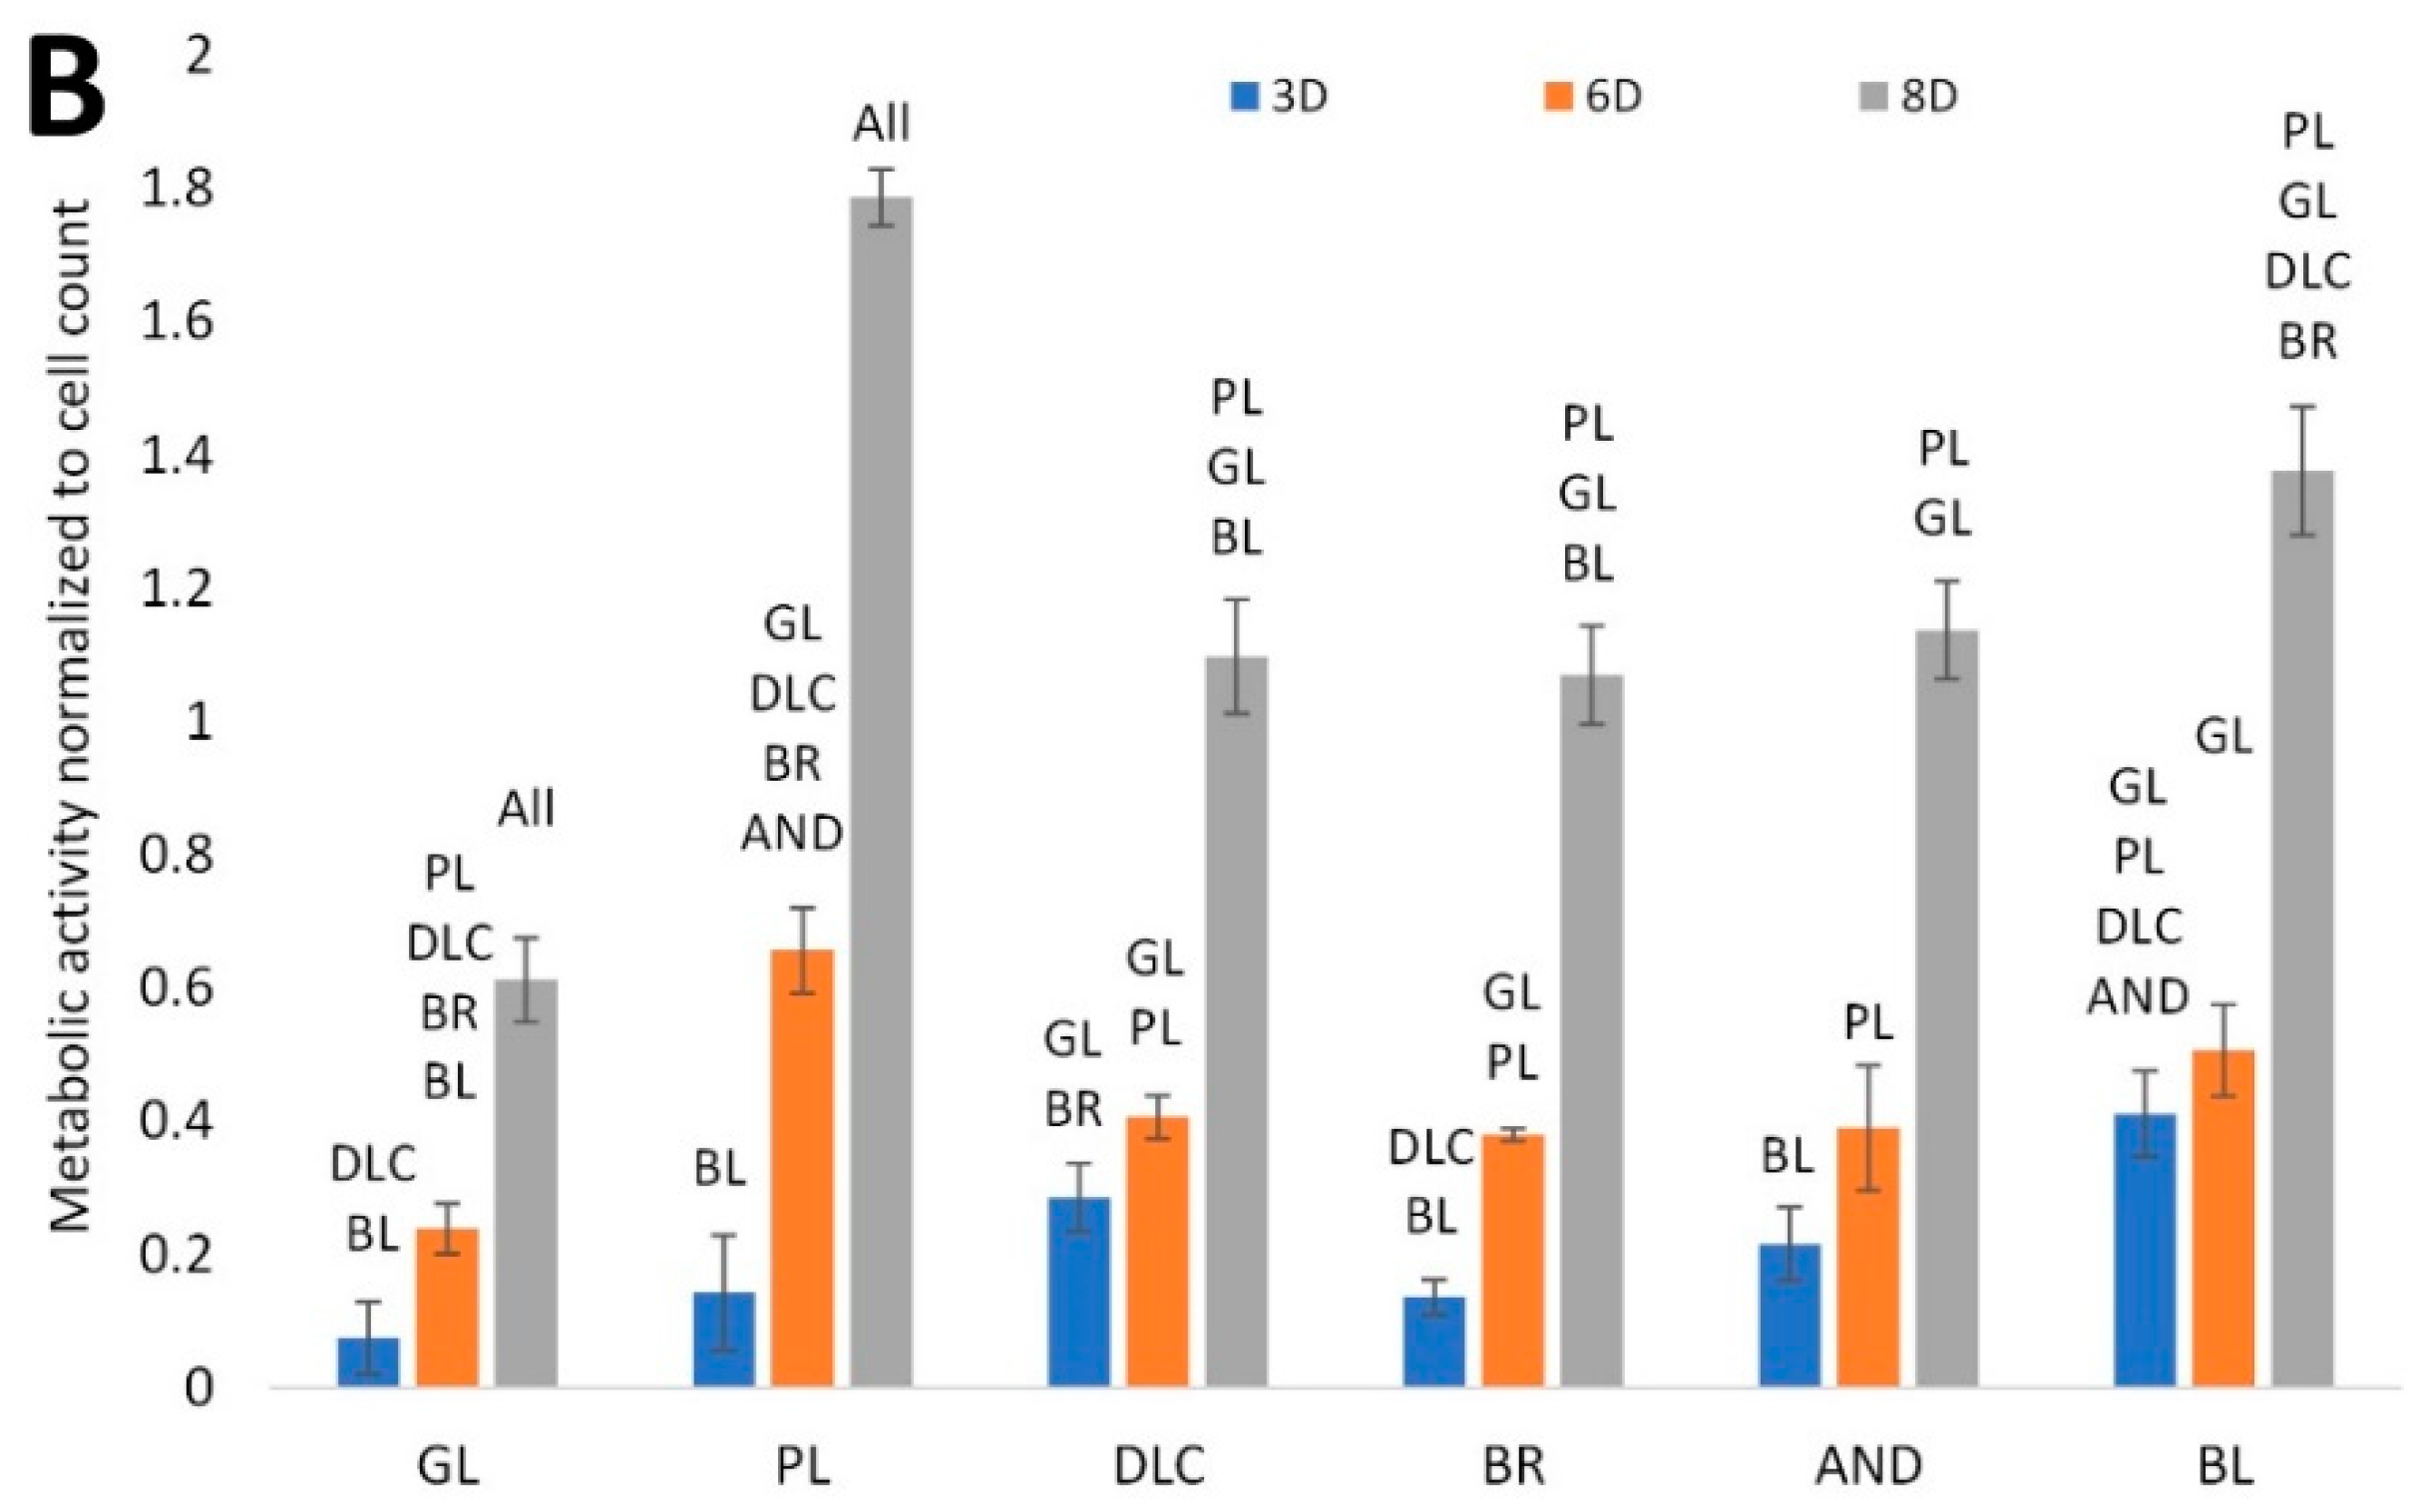
When the influence of the roughness and the wettability of the surface of the material on cell metabolic activity was assessed, the results differed markedly from the cell counts. This was because the cell metabolic activity was calculated per cell in our study. Despite high cell counts, the metabolic activity of an individual cell on the control glass coverslips was very low in comparison with the other samples. Conversely, the highest metabolic activity was observed in cells on polished samples, where the cell counts were relatively low and were stagnating. However, this result is probably distorted by the relatively low cell count measured on the PL surface, which was caused by the cells peeling off when the sample was handled. There may be more peeling during the relatively complicated immunofluorescence staining procedure, which includes more steps and more extensive washing than the measurement of cell metabolic activity. The highest metabolic activity per cell found on the PL samples therefore seems to be a false and unreal result. Another reason for the relatively low cell counts on DLC-coated samples could be the presence of chromium in these samples, which was used for improving the adhesion of tungsten-doped DLC layer to the Ti-based substrate, and which are potentially cytotoxic. However, an earlier study performed on Cr-doped DLC films revealed that the presence of chromium did not have a considerable negative effect on the adhesion, proliferation, and viability of human osteoblast-like Saos-2 cells in cultures on these films [
30]. Similarly, the DLC films enhanced with tungsten showed no considerable cytotoxicity in vitro [
31].
On the DLC, BR, AND, and BL samples, both parameters, i.e., the cell counts and the cell metabolic activity, reached a similar intermediate level. However, from day 6 to 8, when the cell counts on these samples were stagnating, the metabolic activity per cell increased markedly. In this case, however, this activity probably correlated with the level of osteogenic cell differentiation. This is suggested particularly by the intensity of the fluorescence of osteopontin, an intermediate marker of osteogenic cell differentiation, which also increased markedly between days 6 and 8, reaching the highest values on the BR samples. Other markers of differentiation, such as RUNX2, calcium deposition (measured by the calcium depletion from the culture medium), and the activity of alkaline phosphatase increased more homogeneously from day 3 to 8. However, these markers were clearly positively correlated with the surface roughness of the material. The highest values of the markers were usually obtained in cells on BR, AND, and BL samples, i.e., samples with the highest surface roughness, while the values were lower in cells on the flatter PL and DLC samples, and particularly on the control glass coverslips. This is in line with the results obtained by other authors, who have reported that relatively high material surface roughness, particularly submicron- and micron-scale roughness, is associated with a high level of cell osteogenic differentiation, but with reduced cell proliferation [
32,
33,
34]. The decrease in cell proliferation is sometimes so great that it cannot ensure the formation of enough bone mass around the implants for the needs of osseointegration [
32]. Because of the irregularities on the material surface, the cells lose their mutual contacts, which are necessary for cell proliferation [
32]. However, it seems that this did not occur in our study, because the cells remained in contact even on the roughest surfaces, and were able to reach confluence, as is evident from the cell morphology images (
Figure 6). It should be mentioned here that the cell proliferation was evaluated in a medium supporting cell differentiation, where the cell proliferation activity is generally lower than in a standard growth medium.
In summary, all surface treatments applied to the Ti6Al4V samples were non-cytotoxic, supporting the adhesion, growth, and osteogenic differentiation of ASCs. Cell proliferation was most efficiently supported by relatively flat surfaces with roughness described by an Ra parameter from tenths of a nanometer to 1–2 tens of nanometers, i.e., by the glass, PL and DLC surfaces. However, this supportive effect was compromised by peeling of the cells from the samples during handling, probably because of weak cell adhesion to these smooth surfaces; the final cell counts were therefore often low. The final cell counts were also relatively low on BL surfaces with roughness (Ra) in hundreds of nanometers, i.e., on surfaces with submicron scale roughness. Satisfactory cell counts were achieved on surfaces with roughness (Ra) in 6–7 tens of nanometers, i.e., on the BR and AND surfaces. At the same time, the cells on these surfaces achieved a relatively high level of osteogenic differentiation, manifested particularly by the highest production of osteopontin. Ti6Al4V implants modified by brushing and anodizing therefore seem to be the most suitable of the samples tested here for colonizing with pre-differentiated ASCs before they are implanted into the bone tissue.
Some limitations of our study should be pointed out. The experiments were carried out only for 8 days. This is sufficient for investigating only the early stage of osteogenic cell differentiation, but not the late stage, which is characterized by osteocalcin production [
33]. For late osteogenic differentiation, the cells should be cultivated for a much longer period of time, usually for three or more weeks. This type of long-term cultivation is hardly possible in a conventional static two-dimensional culture system, where the cells, especially stem cells, proliferate rapidly, and reach confluence relatively soon. They then enter the stationary phase, associated with apoptosis and cell detachment. The cell performance can be improved by using a more physiological cultivation system, including three-dimensional scaffolds, which better simulate the architecture of the tissues in vivo, and by using dynamic cultivation, which applies mechanical loading to cells similarly as in vivo. Together with biochemical signals from the culture medium, this loading directs the cell differentiation toward a desired phenotype.
5. Conclusions
This study has investigated the influence of surface properties of Ti6Al4V with various commercially used surface modifications on the growth and the osteogenic differentiation of adipose tissue-derived mesenchymal stem cells (ASCs). The aim was to select the most appropriate surface modification(s) for pre-colonizing Ti6Al4V implants with stem cells in order to improve their osseointegration. The Ti6Al4V samples were treated by polishing (PL), by brushing (BR), by anodizing (AND), by blasting (BL), or by diamond-like carbon (DLC) coating. A glass coverslip (GL) was used as a reference material. The basic surface properties of the materials, i.e., their roughness and their wettability, were evaluated and were correlated with the behavior of ASCs cultivated on the materials for 3, 6, and 8 days in a culture medium promoting osteogenic differentiation. On materials with low surface roughness (Ra from tenths of a nanometer to 1–2 tens of nanometers), i.e., on GL, PL, and DLC, the cells adhered and proliferated very well. However, because of the smoothness of these surfaces, the cells were prone to peel off. Materials with greater surface roughness (Ra 60–70 nm), i.e., the BR and AND samples, still supported a good level of cell proliferation and, at the same time, they achieved a markedly higher level of osteogenic cell differentiation than the previous group. On surfaces with submicron-scale roughness, i.e., on the BL samples, the level of osteogenic differentiation was also relatively high, but these samples showed the lowest cell proliferation activity. All tested samples showed moderate wettability, characterized by a water drop contact angle in the optimum range of 60–80°. The only exception was the DLC samples, which were more hydrophilic (contact angle 38°). However, the differences in surface wettability did not have any significant effect on the cell behavior, which seemed to be primarily governed by the surface roughness of the material. It can therefore be concluded that TiAl4V samples treated with brushing and anodizing are the most appropriate for pre-colonizing with stem cells pre-differentiated toward osteoblast before they are implanted into the bone tissue. However, samples treated by polishing, by blasting, or by coating with DLC have some limitations that reduce their potential for use as an implant material in general.

 ,
, 


