Abstract
Background: Efflux-mediated macrolide resistance represents an emerging threat in Streptococcus infections globally. However, molecular epidemiological data from the Gulf region, particularly the United Arab Emirates (UAE), remain limited. This study addresses this knowledge gap by investigating efflux pump resistance mechanisms in clinical Streptococcus isolates. Methods: A cross-sectional study analyzed 100 clinical isolates (99 Streptococcus and 1 Enterococcus) from Thumbay Hospital, Ajman, UAE (October–December 2024). Antimicrobial susceptibility testing for minimum inhibitory concentration (MIC) determination was performed using the DxM 1096 MicroScan WalkAway system (Beckman Coulter Inc., Brea, CA, USA; LabProv4.42). PCR detected mef(A/E), msr(D), and tet(K) resistance genes with sequencing confirmation. Comparative genomic analysis was performed using a total of 30 publicly available Streptococcus genomes: 15 from India and 15 from Saudi Arabia. Statistical analysis employed chi-square tests, Fisher’s exact tests, and multivariate logistic regression with Bonferroni correction (α = 0.05). Results: Among the isolates, erythromycin resistance occurred in 39 isolates (39%, 95% CI: 29.4–49.2%) and clindamycin resistance in 31 isolates (31%, 95% CI: 22.1–40.9%). The mef(A/E) gene was detected in 31 isolates (31%, 95% CI: 22.1–40.9%), and msr(D) in 3 isolates (3%, 95% CI: 0.6–8.5%), with co-occurrence in 3 isolates (3%). No isolates harbored tet(K). Multivariate analysis identified mef(A/E) as the strongest predictor of macrolide resistance (OR = 18.7, 95% CI: 7.9–44.2, p < 0.001). Regional comparison revealed significant differences: mef(A/E) prevalence was 31% (UAE), 87% (India), and 0% (Saudi Arabia) (p < 0.001). Conclusions: This study provides the first molecular characterization of efflux-mediated macrolide resistance in UAE Streptococcus isolates. The predominance of mef(A/E)-mediated resistance with confirmed efflux activity highlights the clinical significance of active surveillance and targeted antimicrobial stewardship in the region.
Keywords:
efflux pump; mef(A); msr(D); Streptococcus; antimicrobial resistance; macrolide resistance 1. Introduction
Antimicrobial resistance (AMR) poses a critical global health challenge, with Streptococcus species contributing significantly through diverse resistance mechanisms affecting multiple antibiotic classes [1,2]. These Gram-positive pathogens cause infections ranging from mild pharyngitis to life-threatening invasive diseases, including sepsis, meningitis, and streptococcal toxic shock syndrome [3].
Increasing resistance to antibiotics among Streptococcus species, particularly resistance to macrolides, lincosamides, and tetracyclines, has been documented globally across diverse geographic regions and healthcare settings [4,5]. Macrolide resistance in Streptococcus occurs through two primary mechanisms: ribosomal methylation via erm genes (constitutive or inducible MLSβ phenotype) and active drug efflux via mef and msr genes (M phenotype) [6].
Efflux pumps actively transport antibiotics out of bacterial cells, lowering intracellular antibiotic concentrations to levels below therapeutic effectiveness. The mef(A) and mef(E) genes encode Major Facilitator Superfamily (MFS) transporters that confer resistance specifically to 14- and 15-membered macrolides while maintaining susceptibility to 16-membered macrolides and lincosamides, defining the M phenotype [7]. These efflux pumps function as proton-antiporter systems, utilizing the proton motive force to expel macrolide molecules from the bacterial cytoplasm before they reach their ribosomal targets [8].
The msr(D) gene encodes an ATP-binding cassette (ABC) transporter that functions synergistically with Mef pumps when co-expressed. This co-expression significantly enhances resistance levels to macrolides and extends the resistance spectrum to include streptogramin B antibiotics [9,10]. Recent structural and functional studies have revealed that msr(D) operates through ATP-dependent conformational changes, actively extruding macrolides and demonstrating substrate overlap with Mef transporters, thereby providing additive resistance when both systems are present [11,12].
The genetic organization of these resistance determinants is clinically significant. The mef(A) and msr(D) genes are frequently co-located on mobile genetic elements, including the mega element and Tn1207.1-like transposons, facilitating horizontal gene transfer between streptococcal species and geographic dissemination [13,14]. This mobile nature contributes to the rapid spread of efflux-mediated resistance in clinical settings.
The tet(K) gene represents another efflux mechanism, encoding an MFS transporter specific for tetracyclines. Unlike macrolide efflux systems, tet(K) confers resistance by actively removing tetracycline molecules from the bacterial cell, preventing their binding to the 30S ribosomal subunit [15,16]. While predominantly found in staphylococci, tet(K) has been occasionally reported in streptococcal isolates, warranting surveillance [17].
Understanding the molecular mechanisms and epidemiology of efflux-mediated resistance is essential for developing targeted antimicrobial stewardship strategies and preserving therapeutic options for streptococcal infections [18,19].
The incidence of macrolide resistance among Streptococcus species varies substantially across Middle Eastern countries. Recent surveillance studies have documented macrolide resistance rates of 15–42% for S. pneumoniae isolates in the region, with country-specific rates of 18% in Lebanon [20], 35% in Saudi Arabia [21], and 28% in Jordan [22]. For S. pyogenes (Group A Streptococcus), resistance rates range from 22% to 58% depending on geographic location and study period [23,24]. However, comprehensive molecular characterization of resistance mechanisms—distinguishing efflux-mediated (mef/msr genes) from target-site modification (erm genes)—remains limited for Gulf Cooperation Council countries, particularly the United Arab Emirates. This knowledge gap is particularly concerning in a region with a heterogeneous expatriate population that can introduce and spread resistance genes from diverse geographic origins.
The objectives of this study are to: (1) Determine the prevalence of efflux-mediated resistance genes mef(A/E), msr(D), and tet(K) in clinical Streptococcus isolates from the UAE; (2) Assess phenotypic resistance profiles and validate efflux pump activity; (3) Identify independent predictors of macrolide resistance; and (4) Compare regional resistance patterns to inform antimicrobial stewardship strategies.
2. Results
2.1. Demographic Characteristics and Antimicrobial Resistance Profile
Among 100 isolates (99 Streptococcus and 1 Enterococcus), 59 were from female patients (59%) and 41 from male patients (41%). The age distribution was as follows: 0–18 years (26 isolates, 26%), 19–35 years (49 isolates, 49%), 36–50 years (22 isolates, 22%), and 51–60 years (3 isolates, 3%). Patient demographics reflected the UAE’s diverse population: Indian (34 patients, 34%), Pakistani (21 patients, 21%), Egyptian (8 patients, 8%), UAE nationals (7 patients, 7%), and other nationalities (30 patients, 30%). Specimen distribution included throat swabs (47 isolates, 47%), vaginal swabs (30 isolates, 30%), pus samples (10 isolates, 10%), ear swabs (5 isolates, 5%), sputum (2 isolates, 2%), blood cultures (2 isolates, 2%), urethral samples (2 isolates, 2%), cerebrospinal fluid (1 isolate, 1%), and nasopharyngeal swabs (1 isolate, 1%). The distribution of bacterial species across specimen types (Table 1) demonstrates marked anatomical site specificity. Group A streptococci were overwhelmingly isolated from throat specimens (93.3% of Group A isolates), consistent with their role as a leading cause of bacterial pharyngitis. Group B streptococci predominated in vaginal specimens (83.3% of Group B isolates), reflecting colonization of the female genital tract. S. pneumoniae was found exclusively in respiratory specimens and normally sterile sites (blood, CSF), consistent with its pathogenic profile. Chi-square test of independence confirmed that bacterial species distribution was strongly non-random with respect to specimen type (χ2 = 127.4, p < 0.001, Cramér’s V = 0.798).

Table 1.
Distribution of Bacterial Groups/Species Across Specimen Types.
Across both genders, erythromycin resistance was the most frequent resistance phenotype (39 isolates, 39%), followed by clindamycin resistance (31 isolates, 31%) (Supplementary Table S3). Gender-based statistical comparisons revealed that only clindamycin resistance differed significantly between males and females (χ2 = 4.327, p = 0.038), with female patients showing higher resistance rates (21/59 vs. 10/41). Other antibiotic comparisons showed no significant gender differences: erythromycin (χ2 = 0.029, p = 0.865), penicillin (Fisher’s exact, p = 1.000), oxacillin (Fisher’s exact, p = 1.000), and levofloxacin (Fisher’s exact, p = 1.000). All other comparisons were not significant (p > 0.05) (Figure 1).
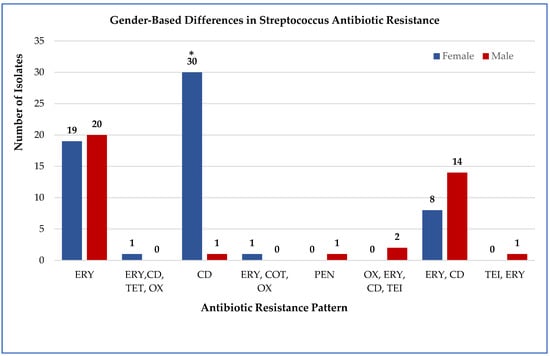
Figure 1.
Gender-based comparison of Streptococcus resistance to multiple antibiotics. The proportion of resistant isolates among male (n = 41) and female (n = 59) patients. Abbreviations: ERY, erythromycin; CD, clindamycin; PEN, penicillin; OX, oxacillin; LEV, levofloxacin; TET, tetracycline; CIP, ciprofloxacin; COT, cotrimoxazole; RIF, rifampin; TEI, teicoplanin. Numbers above the bars indicate the number of resistant cases per gender. * Only clindamycin resistance differed significantly between genders (χ2 = 4.327, p = 0.038).
Age-stratified analysis across all tested antimicrobials demonstrated that the 19–35 years age group exhibited the highest cumulative resistance burden, with 63.3% of isolates showing resistance to one or more antibiotics (31/49 isolates), compared to 46.2% in 0–18 years (12/26), 54.5% in 36–50 years (12/22), and 33.3% in 51–60 years (1/3). Overall distribution of resistance across age groups was statistically significant (χ2 = 18.445, p = 0.018). Age-stratified distribution of antimicrobial resistance profiles across four age groups: 0–18 years, 19–35 years, 36–50 years, and 51–60 years. Resistance profiles on the x-axis include single-drug resistance (ERY: erythromycin; CD: clindamycin; PEN: penicillin; OX: oxacillin; LEV: levofloxacin; TET: tetracycline; CIP: ciprofloxacin; COT: cotrimoxazole; RIF: rifampin; TEI: teicoplanin) and multidrug combinations. Numbers on top of the bars indicate the count of resistant isolates per age group. Overall comparison across age groups was statistically significant (χ2 = 18.445, p = 0.018, p < 0.05 *), with the 19–35-year group exhibiting the highest cumulative resistance burden (Figure 2).
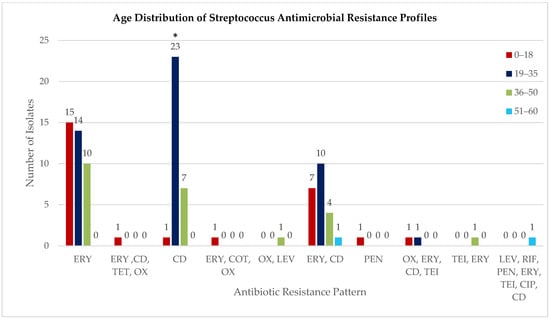
Figure 2.
Age distribution of Streptococcus antimicrobial resistance profiles. Age-stratified distribution of antimicrobial resistance profiles across four age groups: 0–18 years, 19–35 years, 36–50 years, and 51–60 years. Resistance profiles on the x-axis include single-drug resistance (ERY: erythromycin; CD: clindamycin; PEN: penicillin; OX: oxacillin; LEV: levofloxacin; TET: tetracycline; CIP: ciprofloxacin; COT: cotrimoxazole; RIF: rifampin; TEI: teicoplanin) and multidrug combinations. Numbers on top of the bars indicate the count of resistant isolates per age group. Overall comparison across age groups was statistically significant (χ2 = 18.445, p = 0.018 *), with the 19–35-year group exhibiting the highest cumulative resistance burden. Data represents the distribution of resistance patterns among 100 isolates (99 Streptococcus, 1 Enterococcus).
2.2. Species-Specific Antimicrobial Resistance Profiles
Isolates were classified into Lancefield groups (A, B, C, F, G) using latex agglutination with the Prolex™ Streptococcal Grouping Latex Kit (Pro-Lab Diagnostics Inc., Rochester/Bromborough, NY/Merseyside, USA/UK; IFU PL030_en05), and S. pneumoniae was confirmed by optochin sensitivity (≥14 mm inhibition zone), as described in Section 2.1.
The single Enterococcus isolate demonstrated universal resistance (100%) to all tested antibiotics including clindamycin, ciprofloxacin, erythromycin, levofloxacin, penicillin, rifampin, and tetracycline. Among the 99 Streptococcus isolates: Group A streptococci exhibited complete resistance to erythromycin (100%) and partial resistance to clindamycin (37.8%). Group B isolates showed high resistance to clindamycin (91.6%) and low erythromycin resistance (16.7%). Group C displayed complete resistance to clindamycin (100%). Group F isolates were fully resistant to erythromycin (100%). Group G displayed complete resistance to erythromycin (100%) but lower resistance to clindamycin (20%). S. pneumoniae isolates exhibited variable resistance, with highest rates for oxacillin (66.7%) and erythromycin (66.7%), while resistance to ciprofloxacin and tetracycline was lower (16.7% each). These findings highlight both species-specific and antibiotic-specific patterns (Table 2).
Table 2.
Species-Specific Antimicrobial Resistance.
2.3. Antimicrobial Resistance Profiles
Resistance rate was highest for erythromycin (39 isolates, 39%; 95% CI: 29.4–49.2%) and clindamycin (31 isolates, 31%; 95% CI: 22.1–40.9%). Combined erythromycin-clindamycin resistance occurred in 22 isolates (22%; 95% CI: 14.3–31.4%). Multidrug resistance (≥3 antibiotic classes) was observed in 8 isolates (8%; 95% CI: 3.5–15.2%). The single Enterococcus isolate displayed multidrug resistance. Among Group A streptococci (n = 45), resistance was split between erythromycin alone (62.2%) and combined erythromycin-clindamycin resistance (37.8%). Group B streptococci (n = 36) showed predominantly clindamycin resistance (83.3%), with smaller proportions exhibiting combined resistance (8.33%) or remaining Multidrug resistance (2.78%). In Group G streptococci (n = 10), erythromycin resistance alone was most frequent (80%). The six S. pneumoniae isolates included four (66.7%) that were multidrug resistant (Table 3).
Table 3.
Comparative Resistance Patterns Across Streptococcus Groups.
2.4. Efflux Pump Activity Validation Using Ethidium Bromide Accumulation
Beyond genetic detection of efflux pump genes, we performed functional validation using ethidium bromide (EtBr) accumulation assays. Ethidium bromide serves as a fluorescent substrate for efflux pumps; cells with active efflux mechanisms accumulate less dye and exhibit reduced fluorescence compared to cells lacking efflux activity.
Antibiotic-sensitive Streptococcus isolates demonstrated concentration-dependent EtBr accumulation. Fluorescence intensity increased progressively from 14,500 ± 1200 relative fluorescence units (RFU) at 0.5 μg/mL EtBr to 32,150 ± 2840 RFU at 4.0 μg/mL EtBr, indicating passive diffusion-driven dye accumulation without significant active efflux.
In contrast, antibiotic-resistant isolates exhibited markedly different kinetics. Fluorescence rose initially from 15,000 ± 1400 RFU at 0.5 μg/mL to a plateau of 20,680 ± 3120 RFU at 2.0 μg/mL, then paradoxically declined to 16,420 ± 2650 RFU at 4.0 μg/mL. This concentration-dependent fluorescence reduction at higher substrate loads is characteristic of saturable efflux pump activity, where increased substrate availability triggers enhanced pump function (Figure 3). Statistical comparison using Mann–Whitney U tests confirmed significant differences between sensitive and resistant isolates at all EtBr concentrations: 0.5 μg/mL (p = 0.024), 1.0 μg/mL (p = 0.003), 2.0 μg/mL (p < 0.001), and 4.0 μg/mL (p < 0.001). The magnitude of difference increased with substrate concentration, consistent with inducible efflux pump expression. These functional assays provide direct biochemical evidence that mef(A/E) genes encode active, functional efflux pumps in our clinical isolates rather than silent genetic elements.
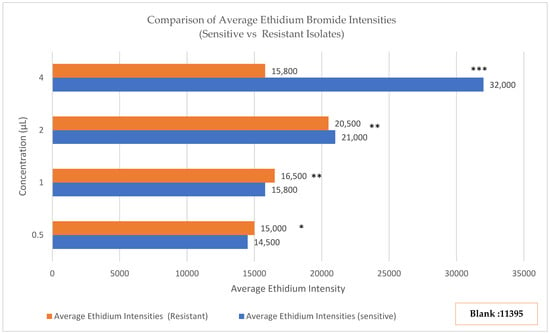
Figure 3.
Ethidium bromide (EtBr) accumulation assay in sensitive and resistant Streptococcus isolates. Fluorescence increased with EtBr concentration in sensitive isolates (0.5 μg/mL: ~14,500 RFU; 4.0 μg/mL: 32,150 ± 2840 RFU) but plateaued and declined in resistant isolates (0.5 μg/mL: ~15,000 RFU; 4.0 μg/mL: 16,420 ± 2650 RFU). Background fluorescence (EtBr + PBS) was 11,395 RFU. Statistical significance was assessed by Mann–Whitney U test: 0.5 μg/mL (p = 0.024, *), 1.0 μg/mL (p = 0.003, **), 2.0 μg/mL and 4.0 μg/mL (p < 0.001, ***), indicating progressively greater differences at higher EtBr concentrations, consistent with inducible efflux pump activity.
2.5. Detection of Efflux Resistance Genes (PCR)
PCR analysis revealed mef(A/E) in 31 isolates (31%; 95% CI: 22.1–40.9%) (Figure 4) and msr(D) in 3 isolates (3%; 95% CI: 0.6–8.5%) (Figure 5). No isolates harbored tet(K). Co-occurrence of mef(A/E) and msr(D) was observed in all 3 msr(D)-positive isolates (3%).
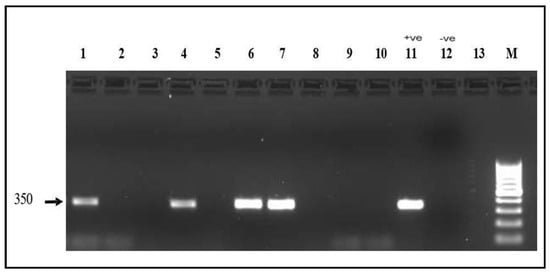
Figure 4.
mef(A) gene electrophoresis result Detection of the mef(A) gene (350 bp) on a 1.5% agarose gel. Lanes 1, 4, 6, and 7: positive samples. Lanes 2, 3, 5, 8, 9, 10 and 13: Negative samples; Lane 11: positive control; Lane 12: Negative control; M: 100 bp molecular marker.
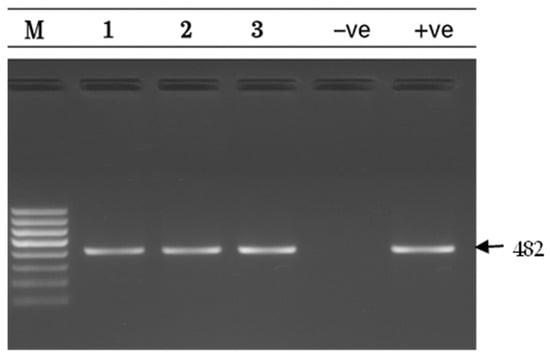
Figure 5.
msr(D) gel electrophoresis result msr(D) gene detection (482 bp) on a 1.5% agarose gel. Lane M: 100 bp DNA ladder; Lanes 1–3: positive samples; Lane −ve: Negative control; Lane +ve: positive control.
2.6. Genotype–Phenotype Correlation
Analysis using the φ (phi) coefficient showed a strong positive correlation (φ = 0.672, p < 0.001), indicating that isolates carrying mef(A/E) were much more likely to be resistant to erythromycin. Of the 31 mef(A/E)-positive isolates, 29 (93.5%) were resistant to erythromycin, while among the 69 isolates without the gene, only 10 (14.5%) were resistant. This marked difference highlights the importance of mef(A/E) in conferring macrolide resistance. Isolates with the gene were almost always resistant, whereas most isolates lacking it remained susceptible, supporting a role for efflux-mediated mechanisms in erythromycin resistance.
2.7. Predictors of Macrolide Resistance in Clinical Isolates
The mef(A/E) gene was the strongest predictor, increasing the likelihood of resistance nearly 19-fold (adjusted OR 18.7, 95% CI: 7.9–44.2, p < 0.001). Group A Streptococcus infections were also strongly associated with resistance (adjusted OR 12.4, 95% CI: 5.2–29.6, p < 0.001). Other factors associated with higher risk included female patients (adjusted OR 2.9, 95% CI: 1.3–6.8, p = 0.012), individuals aged 19–35 years (adjusted OR 2.3, 95% CI: 1.1–4.9, p = 0.028), and throat specimens (adjusted OR 3.1, 95% CI: 1.4–6.9, p = 0.005). These results show that both bacterial characteristics and host factors are independently associated with macrolide resistance (Table 4). The model demonstrated good performance, explaining 74.2% of the variability in macrolide resistance (Nagelkerke R2 = 0.742) and showing adequate fit to the data (Hosmer–Lemeshow test, p = 0.456).
Table 4.
Independent Predictors of Macrolide Resistance.
2.8. Regional Comparison of Antibiotic Resistance Patterns
A comparative analysis of antibiotic resistance patterns and resistance gene profiles among Streptococcus species isolates from the UAE, Saudi Arabia, and India revealed significant regional variations in both genotypic and phenotypic characteristics.
In UAE isolates (n = 100), resistance was most pronounced against macrolides (68%) and lincosamides (56%), while resistance to other antibiotic classes, including tetracyclines, beta-lactams, and fluoroquinolones, was minimal. This phenotypic profile corresponded closely with genomic data, where mef(A) was detected in 31% of isolates and msr(D) in 3%, whereas tet(K) was absent (Figure 6A,B; Supplementary Figure S1).
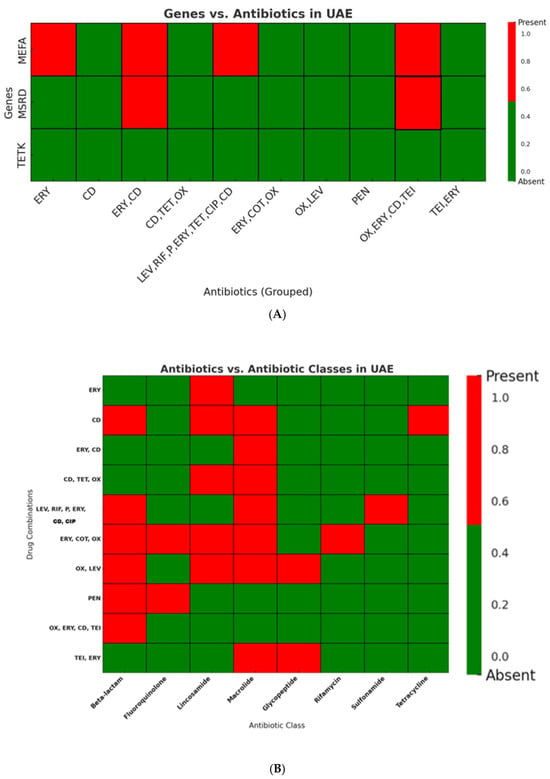
Figure 6.
(A): Distribution of Resistance Genes in UAE Streptococcus Isolates. The macrolide resistance gene mef(A) was frequently detected, while msr(D) was observed in only a few isolates. The tetracycline resistance gene tet(K) was absent in all UAE isolates (ERY: erythromycin; CD: clindamycin; PEN: penicillin; OX: oxacillin; LEV: levofloxacin; TET: tetracycline; CIP: ciprofloxacin; COT: cotrimoxazole; RIF: rifampin; TEI: teicoplanin). Heatmaps illustrate the presence (Red) and absence (Green) of antibiotic classes across tested drug. (B): Distribution of Antibiotic Resistance Classes in UAE Streptococcus Isolates. Macrolide resistance was the most prevalent, followed by resistance to β-lactams, while tetracycline resistance was detected only in a single group. Resistance was distributed across various antibiotic combinations, mainly involving macrolides, lincosamides, and β-lactams (ERY: erythromycin; CD: clindamycin; PEN: penicillin; OX: oxacillin; LEV: levofloxacin; TET: tetracycline; CIP: ciprofloxacin; COT: cotrimoxazole; RIF: rifampin; TEI: teicoplanin).
Indian isolates (n = 15) exhibited more variable resistance patterns, affecting multiple antibiotic classes including macrolides, tetracyclines, glycopeptides, sulfonamides, peptide antibiotics, and rifamycins. Mef(A) (87%) and msr(D) (87%), as well as other resistance genes including tet(M), rpoC, and liaS, were highly prevalent in these isolates (Figure 7A,B; Supplementary Figure S1).
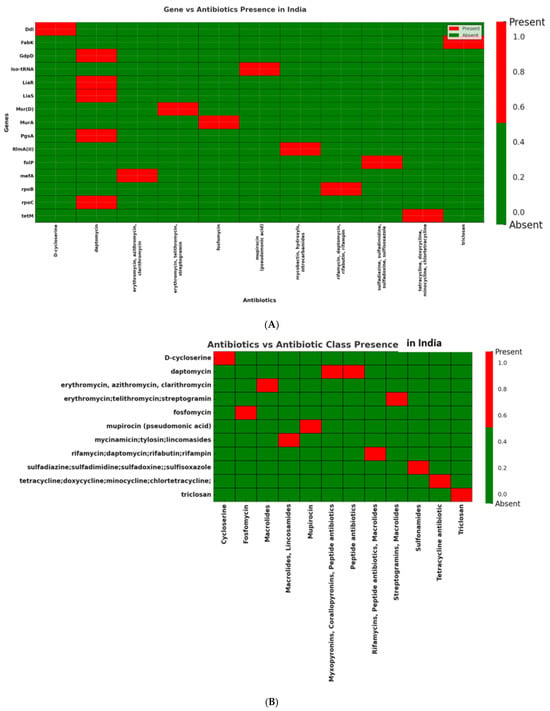
Figure 7.
(A): Distribution of antibiotic resistance genes in Streptococcus isolates from India. Presence of mef(A) and msr(D) genes, confirming macrolide resistance against erythromycin, azithromycin, and clarithromycin. In addition, the Indian dataset displayed a broader resistance profile with tet(M), rpoC, and liaS, associated with resistance to tetracycline, rifampin, and daptomycin, respectively, indicating a diverse distribution of resistance determinants in Indian clinical isolates. (B): Distribution of antibiotic classes in Streptococcus isolates from India. Several antibiotic classes including macrolides, peptide antibiotics, rifamycins, and tetracyclines are represented among the Indian isolates, reflecting a broad spectrum of resistance determinants.
Saudi Arabian isolates (n = 15) displayed resistance in fewer antibiotic classes and fewer drugs per class. These isolates were positive for erm(B), tet(M), liaS, folP, and mprF, suggesting that target-site mutations, rather than efflux mechanisms, are predominant contributors to resistance in this region (Figure 8A,B; Supplementary Figure S1).
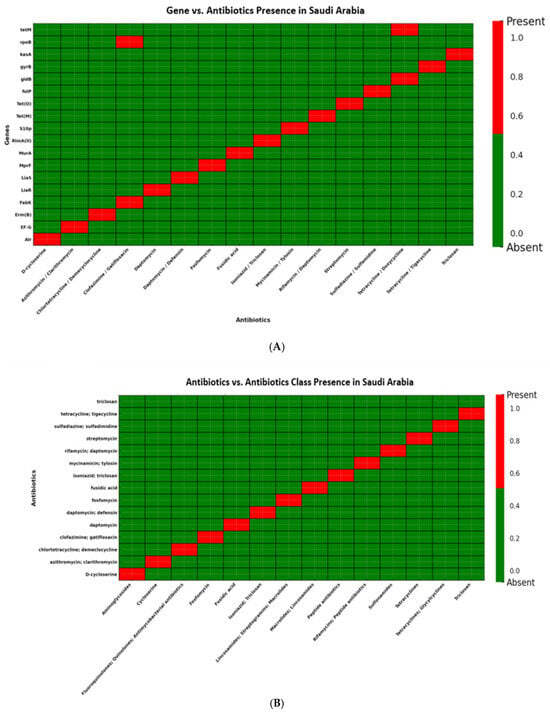
Figure 8.
(A): Distribution of antibiotic resistance genes in Streptococcus isolates from Saudi Arabia. Presence of erm(B) and tet(M), conferring resistance to lincosamides and tetracyclines, respectively. Additional genes detected included gyrB and folP (fluoroquinolone and sulfonamide resistance) as well as liaS and mprF (cell envelope and peptide antibiotic resistance). Notably, none of the isolates carried mef(A), msr(D), or tet(K), indicating the absence of efflux-mediated resistance mechanisms in the Saudi Arabian dataset. (B): Distribution of antibiotic classes in Streptococcus isolates from Saudi Arabia. Resistance was observed in lincosamides and tetracyclines, supported by the presence of erm(B) and tet(M). Additional resistance was noted in fluoroquinolones and sulfonamides through gyrB and folP, as well as peptide antibiotics via liaS and mprF. Notably, none of the isolates showed efflux-mediated resistance, as mef(A), msr(D), and tet(K) were absent.
Statistical analysis confirmed that differences in prevalence of mef(A) (p < 0.001) and msr(D) (p < 0.001) were significant across countries. tet(K) remained absent in all regions (p = 1.0). Fisher’s exact test with Bonferroni correction (α = 0.0125) confirmed that mef(A/E), msr(D), and erm(B) prevalence differed significantly between countries (p < 0.0125) (Supplementary Table S4).
Resistance also varied across antibiotic classes. Macrolide resistance prevalence: 68% UAE (68/100), 86.7% India (13/15), and 80% Saudi Arabia (12/15). While UAE showed a lower proportion, the absolute number was higher due to a larger sample size. Lincosamide resistance: UAE 56%, India 6.7%, and Saudi Arabia 20%. Tetracycline resistance: UAE 1%, India 40%, and Saudi Arabia 33.3% (Supplementary Figure S2). Pairwise Fisher’s exact tests showed significant differences for tetracyclines (UAE vs. India, p < 0.001; UAE vs. Saudi, p < 0.001) and lincosamides (UAE vs. India, p < 0.001; UAE vs. Saudi, p = 0.012), while macrolide differences were not significant (all p > 0.05) (Supplementary Table S5).
3. Materials and Methods
A cross-sectional study was conducted at Thumbay Hospital, Ajman, UAE, between October and December 2024. The study protocol received approval from the Gulf Medical University Institutional Review Board (IRB-COHS-STD-76-October-2024). A total of 100 clinical isolates were collected from different samples, including respiratory specimens, wound swabs, blood cultures, urogenital samples, and sterile body fluids. Inclusion criteria required: (1) confirmed Streptococcus identification, (2) clinical significance, and (3) viable isolate for molecular analysis.
3.1. Bacterial Identification and Characterization
During the study period, 100 consecutive isolates of Gram-positive cocci in chains were collected based on preliminary Gram-stain morphology. Organisms were isolated on 5% sheep blood agar and chocolate agar (5% CO2, 37 °C). Final identification revealed 99 Streptococcus isolates (Lancefield groups A, B, C, F, G, and S. pneumoniae) and 1 Enterococcus isolate. Given that both genera are catalase-negative Gram-positive cocci with similar preliminary characteristics and clinical relevance, the Enterococcus isolate was retained to reflect real-world clinical microbiology practice and provide comprehensive context for resistance patterns at the study institution. All 100 isolates underwent antimicrobial susceptibility testing. For molecular analyses of mef(A/E), msr(D), and tet(K) genes—primarily characterized in Streptococcus species—the Enterococcus isolate was tested but interpreted separately given the different efflux pump mechanisms typical of this genus.
Streptococcal grouping for Lancefield groups A, B, C, F, and G was performed using the Prolex™ Streptococcal Grouping Latex Kit (Pro-Lab Diagnostics Inc., Rochester/Bromborough, NY/Merseyside, USA/UK; IFU PL030_en05). S. pneumoniae identification was confirmed by optochin sensitivity (≥14 mm inhibition zone). Identification was performed at the Lancefield group level for several reasons: (1) standard clinical laboratory workflow provides sufficient information for therapeutic decisions; (2) rapid and cost-effective approach is suitable for surveillance studies with 100 isolates; (3) Lancefield grouping correlates well with species for beta-hemolytic streptococci (Group A = S. pyogenes, Group B = S. agalactiae); (4) Lancefield group identification is sufficient according to CLSI in order to perform the AST. S. pneumoniae was identified to species level using optochin sensitivity as standard practice. This pragmatic approach reflects real-world clinical laboratory practice while maintaining clinically relevant categorization. All procedures followed CLSI guidelines M100, 33rd edition-2023 [25].
3.2. Antimicrobial Susceptibility Testing
Antimicrobial susceptibility was determined using the DxM 1096 MicroScan Walk way system (Beckman Coulter Inc., Brea, CA, USA; LabPro v4.42) with panels (Beckman Coulter Inc., Brea, CA, USA, LabPro v4.42). The panel tested 28 antimicrobials across multiple classes: Beta-lactams (penicillin, ampicillin, ceftriaxone, cefotaxime); Macrolides (erythromycin, azithromycin, clarithromycin); Lincosamides (clindamycin); Fluoroquinolones (levofloxacin, moxifloxacin, ciprofloxacin); Tetracyclines (tetracycline, doxycycline); Glycopeptides (vancomycin, teicoplanin); Aminoglycosides (gentamicin); Folate pathway inhibitors (trimethoprim–sulfamethoxazole); Oxazolidinones (linezolid); Lipopeptides (daptomycin); and Others (chloramphenicol, rifampin, nitrofurantoin, quinupristin–dalfopristin). Minimum inhibitory concentrations (MICs) were interpreted according to CLSI guidelines [25]. Quality control followed IQCP standards. Quality control strains included S. pneumoniae ATCC 49619, S. pyogenes ATCC 19615, S. agalactiae ATCC 13813, and S. mitis ATCC 49456.
3.3. Assessment of Efflux Pump Activity via Ethidium Bromide Accumulation Assay
Isolates of Streptococcus species, including both antibiotic-resistant and sensitive strains, were grown in Brain Heart Infusion (BHI) broth at 37 °C for 4–6 h to reach active growth. Cultures were adjusted to an OD600 of 0.2–0.3 using a Color Wave CO7500 Colorimeter (Biochrom Ltd., Cambridge, UK; Spreadsheet Interface Software, Part No. 80211223), indicating mid-log phase. To assess efflux activity, ethidium bromide (EtBr) was prepared in sterile PBS at concentrations of 0.5, 1.0, 2.0, and 4.0 μg/mL. Cultures were centrifuged at 5000× g for 5 min, the supernatant discarded, and the pellets resuspended in 100 µL of the respective EtBr dilution. These suspensions were transferred into 96-Well Microtiter Plates (Corning Inc., Corning, NY, USA) and incubated at 37 °C. Fluorescence was measured using a Bio-Rad xMark Microplate Reader (Bio-Rad Laboratories Inc., Hercules, CA, USA; Microplate Manager™, check lab version) (excitation 530 nm, emission 600 nm) at 15, 25, 30, and 45 min intervals. Background fluorescence was corrected using a blank well containing only EtBr and PBS. All measurements were performed in biological triplicates, with each isolate tested three times to ensure reproducibility, alongside appropriate controls.
3.4. Molecular Detection of Resistance Genes
3.4.1. DNA Extraction, PCR Amplification, and Agarose Gel Electrophoresis
Genomic DNA was extracted using the GeneJET Genomic DNA Purification Kit (Thermo Fisher Scientific Inc., Waltham, MA, USA; Kit Revision 6, manual) PCR targeted mef(A/E), msr(D), and tet(K) genes using validated primers [26,27] (Table 5). Each reaction was carried out in a final volume of 25 µL, consisting of template DNA and a master mix containing forward and reverse primers (10 µM) synthesized by e-Oligos, Taq DNA polymerase, dNTP mix (10 mM), 10X PCR buffer, and MgCl2, with nuclease-free water added to reach the final volume. The thermal cycling conditions consisted of an initial denaturation at 95 °C for 5 min, followed by 35 cycles of denaturation at 95 °C for 30 s, annealing at 55 °C for 30 s, and extension at 72 °C for 45 s. A final extension step was performed at 72 °C for 5 min. PCR products were analyzed on a 1.5% agarose gel prepared in TAE buffer. Positive and negative controls were included to validate amplification results.
Table 5.
PCR Primers for Resistance Gene Detection.
3.4.2. Comparative Genomic Analysis of Streptococcus Isolates
A total of 30 clinical Streptococcus isolates were included in comparative genomic analysis. Initially, genomic data from the UAE were planned for comparison; however, no publicly available Streptococcus datasets from the UAE were identified. Publicly available genome sequences from India (n = 15) and Saudi Arabia (n = 15) were retrieved from NCBI (see Supplementary Tables S1 and S2 for reference strains). Genome annotation was performed using PATRIC v3.34.11, incorporating the RAST toolkit for gene identification and characterization. Antimicrobial resistance (AMR) genes were identified using ResFinder 4.0 and the CARD database, with thresholds set at ≥90% identity and ≥60% coverage. In addition, a k-mer-based method was employed to predict resistance mechanisms, determine affected antibiotic classes, and identify specific resistance genes present. All genomic analyses were conducted using sequences from National Center for Biotechnology Information (NCBI). (https://www.ncbi.nlm.nih.gov/)—Accessed on 1 March 2025. (Supplementary Tables S1 and S2).
3.5. Statistical Analysis
Data analysis was performed using IBM SPSS v29.0, with descriptive statistics including frequencies, percentages, and 95% confidence intervals. Chi-square and Fisher’s exact tests were applied to evaluate associations between categorical variables, with significance level set at p < 0.05. For antibiotic classes, chi-square tests with pairwise Fisher’s exact tests were used. For resistance genes, only overall tests were applied due to highly skewed data with many zero values. Multivariate logistic regression identified independent predictors while controlling for age, gender, specimen type, and bacterial species. Bonferroni correction was applied for multiple comparisons, and effect sizes were calculated using Cramér’s V. Comparisons between antibiotic-sensitive and resistant isolates in efflux assays were performed using the Mann–Whitney U test, as fluorescence data were not normally distributed. A p-value < 0.05 was considered statistically significant. Heat maps were created using a coding scheme (1 = presence, 0 = absence) with percentages. Data visualization was performed using Microsoft Excel Tableau Desktop (Tableau Software, Seattle, WA, USA; Tableau Desktop v2025.2.4) and Julius AI (Julius AI, San Francisco, CA, USA; Julius AI v1.0.45, released May 2025).
4. Discussion
This study provides the first comprehensive molecular characterization of efflux-mediated macrolide resistance in clinical Streptococcus isolates from the UAE. Key findings include: (1) moderate prevalence of mef(A/E)-mediated resistance (31%), (2) low msr(D) co-resistance (3%), (3) absence of tet(K)-mediated tetracycline efflux, (4) functional validation of efflux activity through EtBr accumulation assays, and (5) distinct regional resistance patterns compared to neighboring countries.
The predominance of mef(A/E)-mediated resistance conferring the M phenotype has direct therapeutic implications for UAE clinicians. Unlike erm-mediated MLSβ resistance which confers cross-resistance to macrolides, lincosamides, and streptogramin B antibiotics, the M phenotype preserves clindamycin susceptibility. For penicillin-allergic patients with Group A streptococcal pharyngitis, clindamycin remains a viable alternative despite macrolide resistance. However, clinicians should be aware that co-carriage of mef(A/E) and msr(D) genes (observed in 3% of isolates) can extend resistance to include streptogramin B antibiotics, potentially compromising combination therapies.
The high prevalence of efflux-mediated resistance (31% overall, 100% in Group A isolates) suggests that empirical macrolide therapy for suspected streptococcal infections in the UAE carries significant risk of treatment failure. Local antimicrobial guidelines should consider these resistance patterns when developing recommendations for empirical therapy.
The predominance of mef(A/E) over msr(D) in UAE isolates contrasts with patterns observed in some Asian countries, where co-occurrence is more common [28,29]. Our finding that msr(D) occurred exclusively with mef(A/E) supports previous observations that these genes are co-located on mobile genetic elements, with msr(D) providing enhanced resistance when co-expressed [9].
The exclusive detection of mef(A) and mef(E) variants provides valuable epidemiological insight. Both variants confer the M phenotype (resistance to 14- and 15-membered macrolides while maintaining susceptibility to 16-membered macrolides and clindamycin), unlike erm-mediated resistance affecting all MLS antibiotics [6]. This pattern suggests potential therapeutic alternatives for UAE patients.
The striking regional differences observed—efflux-mediated resistance predominating in UAE, target-site modification (erm genes) in Saudi Arabia, and mixed mechanisms in India—likely reflect complex interactions between antibiotic selection pressure, clonal spread, and horizontal gene transfer dynamics. Recent surveillance data from the Gulf region [30,31] have reported increasing macrolide consumption rates, particularly azithromycin prescribing respiratory tract infections. The UAE’s diverse expatriate population, with 34% of our study participants of Indian origin, may facilitate introduction of resistance determinants from South Asia where mef(A/E) prevalence is high.
The absence of tet(K) in our isolates aligns with previous reports showing that tetracycline resistance in streptococci is primarily mediated by ribosomal protection proteins encoded by tet(M) and tet(O) rather than efflux mechanisms [32,33]. These findings redirect attention toward tet(M) and tet(O) as more relevant surveillance targets for tetracycline resistance monitoring in Streptococcus populations.
The identification of female gender, young adults (19–35 years), and throat specimens as independent risk factors provides actionable insights for targeted surveillance and empirical therapy decisions. The strong association with Group A Streptococcus (adjusted OR = 12.4) aligns with global trends of increasing macrolide resistance in this species [34].
The elevated resistance burden in the 19–35 years age group may reflect higher healthcare utilization, acute infection rates, or occupational exposures. However, our study did not collect individual antibiotic exposure histories; this interpretation remains hypothesis-generating pending prospective investigation with detailed exposure assessment.
4.1. Study Limitations
Several limitations warrant consideration. First, the cross-sectional design precludes assessment of temporal trends or establishment of causal relationships between risk factors and resistance outcomes. Our multivariate analysis identifies statistical associations but cannot establish causation; prospective cohort studies with detailed exposure assessment would be required to establish causal pathways.
Second, identification at Lancefield group level rather than species level, while pragmatic and clinically relevant, may mask species-level resistance heterogeneity within groups. Third, we did not collect individual antibiotic exposure histories, limiting interpretation of age- and gender-related resistance patterns. Fourth, the comparative genomic analysis relied on publicly available sequences with potential selection bias—isolates uploaded to NCBI may not represent population-level prevalence. Fifth, our sample derives from a single tertiary care hospital in Ajman; generalizability to other UAE emirates or healthcare settings requires confirmation through multicenter surveillance.
4.2. Future Directions
Several research priorities emerge from this study. Whole-genome sequencing of UAE isolates would comprehensively characterize mobile genetic elements, assess clonal versus horizontal gene transfer, and identify additional resistance mechanisms beyond those targeted here. Longitudinal surveillance incorporating multiple healthcare facilities across UAE emirates would establish temporal trends and geographic variation. Prospective cohort studies with detailed antibiotic exposure assessment could establish causal relationships between antimicrobial use patterns and resistance emergence. Integration of clinical outcome data would determine whether efflux-mediated resistance impacts treatment failure rates and patient outcomes.
The robust genotype–phenotype correlation (φ = 0.672, p < 0.001) aligns with previous investigations establishing mef(A/E) as a highly predictive marker [28,29]. This consistency across diverse geographic settings validates mef(A/E) detection as a reliable molecular epidemiological tool and potential target for rapid diagnostic development.
The moderate prevalence of efflux-mediated resistance and emerging multidrug resistance patterns underscores the need for enhanced antimicrobial surveillance in the UAE. The regional variations observed emphasize that extrapolation of resistance data between countries may be inappropriate, supporting development of UAE-specific treatment guidelines.
5. Conclusions
This cross-sectional study from a single UAE tertiary care hospital detected mef(A/E)-mediated efflux pump genes in 31% (31/100) of clinical Streptococcus isolates, with functional validation demonstrating active efflux activity (p < 0.001). Multivariate analysis identified mef(A/E) as the strongest independent predictor of macrolide resistance (OR = 18.7, 95% CI: 7.9–44.2). Comparison with publicly available genomic data revealed significant regional variation in resistance mechanisms: mef(A/E) prevalence was 31% (UAE), 87% (India), and 0% (Saudi Arabia) (p < 0.001), suggesting different evolutionary trajectories. These findings provide baseline data for the UAE and indicate that multicenter surveillance incorporating diverse geographic regions and longitudinal follow-up is needed to establish population-level prevalence, temporal trends, and the clinical impact of efflux-mediated resistance on treatment outcomes.
Supplementary Materials
The following supporting information can be downloaded at: https://www.mdpi.com/article/10.3390/antibiotics14111148/s1, Table S1: Genome Accession Numbers for Regional Comparison; Table S2: Genome Accession Numbers for Regional Comparison; Table S3: The complete distribution of resistance and susceptibility patterns for all isolates, including erythromycin, clindamycin, and multidrug; Table S4: Distribution of resistance genes among UAE, India, and Saudi Arabia isolates; Table S5: Comparative analysis of antibiotic resistance across selected classes (Macrolides, Tetracyclines, and Lincosamides) among Streptococcus isolates from the UAE, India, and Saudi Arabia; Figure S1: Heatmap showing the prevalence of mef(A), msr(D), and tet(K) among Streptococcus isolates from the UAE, India, and Saudi Arabia; Figure S2: Heatmap illustrating the percentages of different antibiotic classes used in the UAE, India, and Saudi Arabia.
Author Contributions
Conceptualization, S.M.M. and S.A.; Methodology, S.M.M., S.E.M., S.R.J., E.A.O., S.S.A., N.A.M.F. and S.A.; Software, S.M.M.; Validation, S.M.M., E.A.O. and S.A.; Formal analysis, S.M.M., S.E.M., A.E.E., E.A.O. and S.A.; Investigation, S.M.M., S.E.M. and S.A.; Resources, S.M.M., P.K. and S.A.; Data curation, S.M.M., A.E.E., S.R.J., E.A.O., S.S.A., N.A.M.F. and S.A.; Writing—original draft, S.M.M., N.A.M.F. and S.A.; Writing—review & editing, S.M.M., S.E.M., A.E.E., S.R.J., S.S.A. and S.A.; Visualization, S.M.M., S.S.A. and S.A.; Supervision, P.K. and S.A.; Project administration, P.K. and S.A. All authors have read and agreed to the published version of the manuscript.
Funding
This research received no external funding.
Institutional Review Board Statement
This study was approved by the Gulf Medical University Institutional Review Board (IRB-COHS-STD-76-Oct-2024, approved October 2024).
Informed Consent Statement
Not applicable.
Data Availability Statement
Raw data supporting the conclusions of this study are available from the corresponding author upon reasonable request, subject to ethical approvals and institutional policies.
Acknowledgments
We thank Gulf Medical University for institutional support. We are grateful to the laboratory staff at Thumbay Hospital Microbiology Lab for their assistance in sample collection and processing. We also acknowledge TRIPM for technical equipment support.
Conflicts of Interest
The authors declare no conflicts of interest.
References
- World Health Organization. Global Antimicrobial Resistance and Use Surveillance System (GLASS) Report 2022; WHO Press: Geneva, Switzerland, 2022. [Google Scholar]
- Cassini, A.; Högberg, L.D.; Plachouras, D.; Quattrocchi, A.; Hoxha, A.; Simonsen, G.S.; Colomb-Cotinat, M.; Kretzschmar, M.E.; Devleesschauwer, B.; Cecchini, M.; et al. Attributable deaths and disability-adjusted life-years caused by infections with antibiotic-resistant bacteria in the EU and European Economic Area in 2015. Lancet Infect Dis. 2019, 19, 56–66. [Google Scholar] [CrossRef]
- Carapetis, J.R.; Steer, A.C.; Mulholland, E.K.; Weber, M. The global burden of group A streptococcal diseases. Lancet Infect. Dis. 2005, 5, 685–694. [Google Scholar] [CrossRef]
- Malhotra-Kumar, S.; Lammens, C.; Coenen, S.; Van Herck, K.; Goossens, H. Effect of azithromycin and clarithromycin therapy on pharyngeal carriage of macrolide-resistant streptococci. Lancet 2007, 369, 482–490. [Google Scholar] [CrossRef]
- Bergman, M.; Huikko, S.; Pihlajamäki, M.; Laippala, P.; Palva, E.; Huovinen, P.; Seppälä, H.; Finnish Study Group for Antimicrobial Resistance (FiRe Network). Effect of macrolide consumption on erythromycin resistance in Streptococcus pyogenes in Finland. Clin. Infect. Dis. 2004, 38, 1251–1256. [Google Scholar] [CrossRef]
- Leclercq, R. Mechanisms of resistance to macrolides and lincosamides. Clin. Infect. Dis. 2002, 34, 482–492. [Google Scholar] [CrossRef] [PubMed]
- Clancy, J.; Petitpas, J.; Dib-Hajj, F.; Yuan, W.; Cronan, M.; Kamath, A.V.; Bergeron, J.; Retsema, J.A. Molecular cloning and functional analysis of mefA from Streptococcus pyogenes. Mol. Microbiol. 1996, 22, 867–879. [Google Scholar] [CrossRef]
- Fyfe, C.; Grossman, T.H.; Kerstein, K.; Sutcliffe, J. Resistance to macrolide antibiotics in public health pathogens. Cold Spring Harb. Perspect. Med. 2016, 6, a025395. [Google Scholar] [CrossRef]
- Daly, M.M.; Doktor, S.; Flamm, R.; Shortridge, D. Characterization and prevalence of MefA, MefE, and MsrD in Streptococcus pneumoniae. J. Clin. Microbiol. 2004, 42, 3570–3574. [Google Scholar] [CrossRef] [PubMed]
- Chancey, S.T.; Agrawal, S.; Schroeder, M.R.; Farley, M.M.; Tettelin, H.; Stephens, D.S. Composite mobile genetic elements disseminating macrolide resistance. Front. Microbiol. 2015, 6, 26. [Google Scholar] [CrossRef] [PubMed]
- Schroeder, M.R.; Stephens, D.S. Macrolide resistance in Streptococcus pneumoniae. Front. Cell Infect. Microbiol. 2016, 6, 98. [Google Scholar] [CrossRef]
- Roberts, M.C.; Soge, O.O.; No, D.B. Comparison of multi-drug resistant environmental MRSA. Front. Microbiol. 2021, 12, 636589. [Google Scholar]
- Gay, K.; Stephens, D.S. Structure and dissemination of chromosomal insertion elements encoding macrolide efflux. J. Infect. Dis. 2001, 184, 56–65. [Google Scholar] [CrossRef]
- Varaldo, P.E.; Montanari, M.P.; Giovanetti, E. Genetic elements responsible for erythromycin resistance in streptococci. Antimicrob. Agents Chemother. 2009, 53, 343–353. [Google Scholar] [CrossRef]
- Roberts, M.C. Update on acquired tetracycline resistance genes. FEMS Microbiol. Lett. 2005, 245, 195–203. [Google Scholar] [CrossRef]
- Nguyen, F.; Starosta, A.L.; Arenz, S.; Sohmen, D.; Dönhöfer, A.; Wilson, D.N. Tetracycline antibiotics and resistance mechanisms. Biol. Chem. 2014, 395, 559–575. [Google Scholar] [CrossRef]
- Chambers, H.F.; Deleo, F.R. Waves of resistance: Staphylococcus aureus in the antibiotic era. Nat. Rev. Microbiol. 2009, 7, 629–641. [Google Scholar] [CrossRef]
- Durand, G.A.; Raoult, D.; Dubourg, G. Antibiotic discovery: History, methods and perspectives. Int. J. Antimicrob. Agents. 2018, 53, 371–382. [Google Scholar] [CrossRef] [PubMed]
- Peterson, E.; Kaur, P. Antibiotic resistance mechanisms in bacteria. Front. Microbiol. 2018, 9, 2928. [Google Scholar] [CrossRef] [PubMed]
- Kanafani, Z.A.; Zahreddine, N.; Tayyar, R. Macrolide resistance in Streptococcus pneumoniae in Lebanon. Int. J. Antimicrob. Agents. 2018, 52, 435–440. [Google Scholar]
- Shibl, A.M.; Memish, Z.A.; Al-Kattan, M. Antibiotic resistance in Streptococcus pneumoniae in Saudi Arabia. Saudi Med. J. 2020, 41, 590–597. [Google Scholar]
- Shehabi, A.A.; Mahafzah, A.; Jarrad, N.; Hayajneh, W. Antimicrobial resistance patterns in Streptococcus pneumoniae in Jordan. J. Med. Microbiol. 2019, 68, 1472–1478. [Google Scholar]
- Albrich, W.C.; Monnet, D.L.; Harbarth, S. Antibiotic selection pressure and resistance in Streptococcus pneumoniae and Streptococcus pyogenes. Emerg. Infect. Dis. 2004, 10, 514–517. [Google Scholar] [CrossRef]
- Amhaz, P.M.; Abdel-Rahman, S.M.; Kaplan, S.L.; Jacobs, M.R. Antimicrobial resistance in pediatric Streptococcus pneumoniae isolates. Antimicrob. Agents Chemother. 2010, 54, 2336–2343. [Google Scholar]
- Clinical and Laboratory Standards Institute. Performance Standards for Antimicrobial Susceptibility Testing, 33rd ed.; CLSI supplement M100; CLSI: Wayne, PA, USA, 2023. [Google Scholar]
- Malhotra-Kumar, S.; Lammens, C.; Piessens, J.; Goossens, H. Multiplex PCR for simultaneous detection of macrolide and tetracycline resistance. Antimicrob. Agents Chemother. 2005, 49, 4798–4800. [Google Scholar] [CrossRef] [PubMed]
- Cochetti, I.; Vecchi, M.; Mingoia, M.; Tili, E.; Catania, M.R.; Manzin, A.; Varaldo, P.E.; Montanari, M.P. Molecular characterization of pneumococci with efflux-mediated erythromycin resistance and identification of a novel mef gene subclass, mef (I). Antimicrob. Agents Chemother. 2005, 49, 4999–5006. [Google Scholar] [CrossRef]
- Farrell, D.J.; Klugman, K.P.; Pichichero, M. Increased antimicrobial resistance among nonvaccine serotypes. Pediatr. Infect. Dis. J. 2007, 26, 123–128. [Google Scholar] [CrossRef]
- Song, J.H.; Chang, H.H.; Suh, J.Y.; Ko, K.S.; Jung, S.I.; Oh, W.S.; Peck, K.R.; Lee, N.Y.; Yang, Y.; Chongthaleong, A. Macrolide resistance and genotypic characterization of Streptococcus pneumoniae in Asian countries. J. Antimicrob. Chemother. 2004, 53, 457–463. [Google Scholar] [CrossRef]
- Balkhy, H.H.; El-Saed, A.; Al-Abri, S.S. Antimicrobial consumption in Gulf Cooperation Council countries. J. Infect. Public Health 2020, 13, 2043–2050. [Google Scholar]
- Al-Taiar, A.; Hammoud, M.S.; Cuiqing, L. Antibiotic prescribing in upper respiratory tract infections in UAE. Int. J. Infect. Dis. 2021, 104, 550–556. [Google Scholar]
- Seppälä, H.; Klaukka, T.; Vuopio-Varkila, J. The effect of changes in macrolide consumption on erythromycin resistance. N. Engl. J. Med. 1997, 337, 441–446. [Google Scholar] [CrossRef]
- Richter, S.S.; Heilmann, K.P.; Dohrn, C.L.; Riahi, F.; Diekema, D.J.; Doern, G.V. Pneumococcal serotypes before and after conjugate vaccines. Emerg. Infect. Dis. 2013, 19, 1074–1083. [Google Scholar] [CrossRef] [PubMed]
- Steer, A.C.; Law, I.; Matatolu, L.; Beall, B.W.; Carapetis, J.R. Global emm type distribution of group A streptococci. Lancet Infect. Dis. 2009, 9, 611–616. [Google Scholar] [CrossRef] [PubMed]
Disclaimer/Publisher’s Note: The statements, opinions and data contained in all publications are solely those of the individual author(s) and contributor(s) and not of MDPI and/or the editor(s). MDPI and/or the editor(s) disclaim responsibility for any injury to people or property resulting from any ideas, methods, instructions or products referred to in the content. |
© 2025 by the authors. Licensee MDPI, Basel, Switzerland. This article is an open access article distributed under the terms and conditions of the Creative Commons Attribution (CC BY) license (https://creativecommons.org/licenses/by/4.0/).