Abstract
The highly sensitive detection of peanut allergens (PAs) using silicon-based electrolyte-gated transistors (Si-EGTs) was demonstrated. The Si-EGT was made using a top-down technique. The fabricated Si-EGT showed excellent intrinsic electrical characteristics, including a low threshold voltage of 0.7 V, low subthreshold swing of <70 mV/dec, and low gate leakage of <10 pA. Surface functionalization and immobilization of antibodies were performed for the selective detection of PAs. The voltage-related sensitivity (SV) showed a constant behavior from the subthreshold regime to the linear regime. The current-related sensitivity (SI) was high in the subthreshold regime and then significantly decreased as the drain current increased. The limit of detection (LOD) was calculated to be as low as 25 pg/mL based on SI characteristics, which is the lowest value reported to date in the literature for various sensor methodologies. The Si-EGT showed selective detection of PA through a non-specific control test. These results confirm that Si-EGT is a high-sensitivity and low-power biosensor for PA detection.
1. Introduction
Peanuts are a primary source of IgE-mediated food allergies, along with tree nuts, milk, eggs, soybeans, and fish [1,2]. Peanuts can be a particularly severe threat to sensitive people because they can cause life-threatening anaphylactic shock [3]. Additionally, peanut allergies persist into adulthood in 75% to 80% of cases [4]. Peanut allergens (PAs) constitute approximately 85% of the total peanut protein content, and PA is classified as Arachis hypogaea 1 (Ara h1) to Ara h13 [5,6]. Ara h1 and Ara h3 belong to the cupin superfamily and are the two main allergens that cause allergic reactions in up to 35% to 95% of patients [7]. An allergic person is strictly advised to avoid the consumption of peanut-related products because even a trace of PA can trigger an allergic reaction.
The enzyme-linked immunosorbent assay (ELISA) is the most commonly used method for diagnosing PAs. The ELISA has been used as a versatile platform with high reliability and sensitivity, and it has been demonstrated to detect allergenic proteins in peanuts [8,9,10]. However, this technique is typically very time-consuming and requires expensive laboratory equipment and trained experts. Alternative approaches have been reported, including polymerase chain reaction (PCR), real-time PCR, and PCR-ELISA [11,12,13,14]. These methods detect the peanut ingredients in food using PA DNA amplification. The limit of detection (LOD) is typically a few tenths of a DNA copy per reaction (~0.1 mL) [15]. However, these sensitive label-based PCR techniques have drawbacks similar to those of ELISA. Additionally, the quantitative detection of PAs is challenging based on the lack of a direct correlation between DNA concentrations and allergen concentrations.
To overcome the problems associated with ELISA and PCR methodologies, biologically active field-effect transistors (BioFETs) using nanomaterials or nanostructures have been investigated [16,17]. Such BioFETs rely on the label-free detection of electrical signals modulated by binding target biomolecules to a functionalized sensing surface. Several applications of BioFETs have been demonstrated to detect various biomolecules with higher normalized sensitivity and enhanced LODs [18,19,20,21]. However, the sensing current itself is very small as a result of the use of a nanoscale channel, which requires more complex and expensive signal-processing integrated circuits.
Recently, an electrolyte-gated FET (EGT) was introduced [22,23,24,25,26,27]. The large area of the gate electrode in an EGT can be utilized as a functionalization surface to increase the binding probability of biomolecules, thereby increasing the absolute sensing current.
Here, we demonstrated the ultrasensitive and label-free detection of Ara h1 and Ara h3 using an Si-EGT. Our devices were fabricated using micro- and nano-semiconductor processing techniques. Surface functionalization and immobilization of antibodies were performed for the selective detection of PAs. Voltage- or current-related sensitivities depending on the operation regime were investigated to achieve higher sensitivity and lower power consumption. Improved sensitivities and LOD were achieved in a Si-based EGT operation. Non-specific binding tests were also conducted.
2. Materials and Methods
2.1. Fabrication of Si-EGTs
Figure 1 shows the fabrication flow of an Si-EGT using a top-down process. An 8-inch silicon-on-insulator wafer (boron-doped, 10 Ω·cm) with a 100 nm top Si layer and 400 nm buried oxide layer was used as a starting material. The active region (composed of the source, drain, and channel) was defined using deep ultraviolet lithography and an inductively coupled plasma reactive ion etching process. An arsenic dopant with a dose of 2 × 10¹⁵/cm2 was implanted onto the substrate, excluding the channel region. Rapid thermal annealing was then conducted at 1000 °C for 20 s. Next, thermal wet oxidation was applied to grow silicon oxide (5 nm) as a gate insulator. A 50/500 nm Ti/Ag layer was formed using an e-beam evaporator and conventional lift-off process for the contacts, gate electrode, and transmission lines. Finally, an SU-8 passivation layer was formed on the entire surface using photolithography, excluding the gate electrode and channel regions which are supposed to be exposed to the sample solution. The surface areas of the gate electrode and channel were 300 μm × 300 μm and 10 μm × 10 μm, respectively.
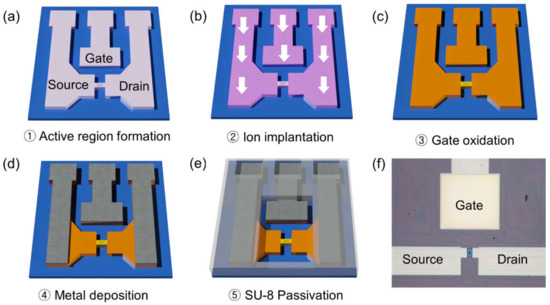
Figure 1.
(a–e) Schematics of fabrication flow and (f) an optical image of the top view of the fabricated Si-EGT.
2.2. Preparation of PAs and Their Antibodies
Monoclonal antibody (Mab) was produced from mice immunized with a thermal-stable soluble protein (TSSP) of peanut. To extract TSSP, including Ara h1 and h3 [28], 1 g of roasted peanut was crushed finely, followed by mixing with 10 mL of carbonate buffer (0.1 M, pH 9.6). The mixture was placed in boiling water for 15 min and then cooled to room temperature. The mixture was then centrifuged at 4 °C for 15 min at 3000 rpm. After filtering the supernatant containing TSSP through Whatman No. 1 filter paper, dialysis in 1 × phosphate-buffered saline (PBS) was performed twice daily for 3 d. The extracted TSSP was used as an immunogen. IgG Mab was developed through cell fusion and cloning [29,30]. Figure 2 shows the Western blot analysis. It confirmed that the antibody was specific to PA without cross-reactivity with other food allergens such as almonds, cashew nuts, and red beans. An antigen-binding fragment (Fab), which is a region on Mab binding to antigens, was generated via papain treatment [31]. After purification using a protein G column, the Fab was used as a receptor to detect PA.
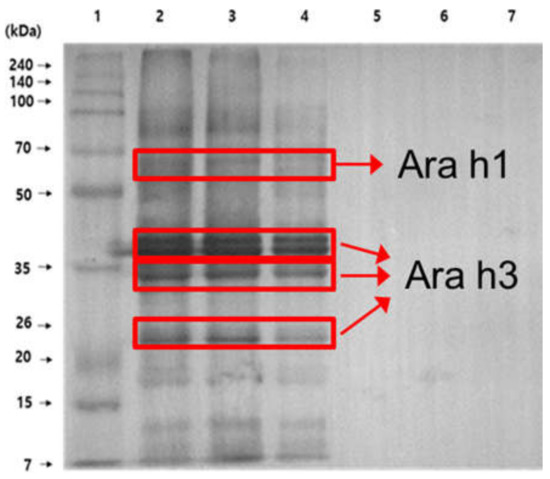
Figure 2.
Western blot results. Lane 1: marker; lane 2: roasting peanut; lane 3: boiled peanut; lane 4: peanut butter; lane 5: almond; lane 6: cashew nut; lane 7: red bean.
2.3. Immobilization of PA Antibodies on Si-EGT
A series of chemical surface treatments were conducted to attach Fab to the sensing surface. First, the devices were rinsed in ethanol and distilled water (DIW) for cleaning, followed by UV/ozone treatment for 1.5 min. Then, 3-aminopropyl-triethoxysilane (APTES) vaporization was performed for 1 min at 50 °C to cover the surface with an amine group (-NH2). Next, the device was immersed in a 1 × PBS solution with 2.5% glutaraldehyde for 90 min to form an aldehyde terminal (-CHO) on its surfaces. Finally, the device was exposed to a PA antibody solution (200 μg/mL) for 1 h.
The surface of the antibody-functionalized Ag electrode was analyzed using atomic force microscopy (AFM, VEECO, New York, NY, USA). As shown in Figure 3a,b, the average roughness and standard deviation were 6 and 9.6 nm for the bare surface, and 10.3 nm and 15.4 nm for the functionalized Ag surface, respectively. The increased surface roughness indicates that the PA antibody was successfully immobilized on the Ag surface.
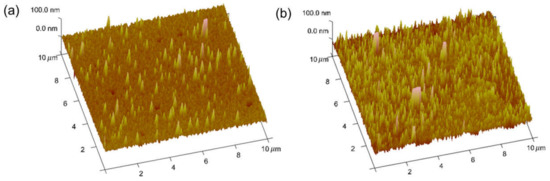
Figure 3.
AFM image analysis of the (a) bare and (b) antibody-immobilized Ag gate electrode.
2.4. Electrical Measurement System
The electrical characteristics and PA sensing responses were characterized using a semiconductor parameter analyzer (Keithley 4200SCS, Tektronix, Beavern, OR, USA) at room temperature. The transfer curve (drain current ID vs. gate voltage VG) was measured as a function of VG at VD = 0.1 V in 20 μL of 0.01 × PBS solution. For quantitative PA analyses, a PA solution using the extracted TSSP in a 1 × PBS solution was prepared with a concentration in the range of 10 pg/mL to 1 mg/mL. After the initial transfer curve was characterized, the device was exposed to 20 μL of PA solution for 20 min, followed by a DIW rinse. Next, 20 μL of 0.01 × PBS solution was dropped onto the device and another measurement was performed to analyze the PA sensing responses.
3. Results
3.1. Intrinsic Electrical Characteristics
Figure 4a shows the transfer curves (log (ID) vs. VG) and output curves (ID vs. VD) of the as-fabricated Si-EGTs prior to surface functionalization. These curves indicate that the device was a typical long-channel n-type FET with a threshold voltage (VTH) of ~0.7 V. A subthreshold swing (= dVG/dlog(ID)) of ~70 mV/dec, gate leakage current of <10 pA, and on/off current ratio of ~107 were achieved. The low gate leakage current indirectly confirms the high quality of the gate oxide and successful formation of SU-8 passivation. ID is exponentially proportional to VG in the subthreshold regime (VG < VTH) and has a linear dependency in the linear regime (VG > VTH), as follows [32]:
where q is the electron charge, k is the Boltzmann constant, T is the temperature, and ID_SUB and ID_LIN are the drain currents in the subthreshold and linear regimes, respectively.
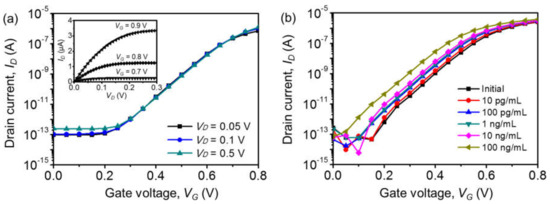
Figure 4.
(a) Log-scaled ID-VG transfer characteristics of the fabricated Si-EGT for various VD. Inset: ID-VD output characteristics. (b) Log-scaled ID-VG for varying [PA]s of 10 pg/mL to 100 ng/mL.
3.2. Sensing Responses for PA Detection
Figure 4b shows representative transfer curves for the Si-EGT with various PA concentrations ([PA]s) from the initial PBS (no PA) up to 100 ng/mL. The curve shifts in the negative VG direction as [PA] increases.
The voltage-related sensitivity (SV) and current-related sensitivity (SI) are defined as follows [33,34]:
where VG,Ab and VG,Ab_PA are the gate voltages after antibody immobilization and antibody–PA reactions at a fixed ID, respectively, and ID,Ab and ID,Ab_PA are the drain currents after antibody immobilization and the antibody–PA reactions at a fixed ID, respectively.
Figure 5a,b show the calculated SV and SI as functions of ID,Ab from the subthreshold to the linear regime. SV is almost constant, independent of ID. However, SI decreases significantly as the device is operated from the subthreshold to linear regimes by increasing VG. According to Equation (1), ID increases exponentially with a linear change in VG in the subthreshold regime. For example, with a PA of 100 ng/mL, the SI value is as high as 2000% at ID,Ab = 100 pA (subthreshold regime), which is almost 200 times higher than SI at ID,Ab = 1 μA (linear regime). Therefore, the device should be operated in the subthreshold regime to achieve high sensitivity and low power consumption.
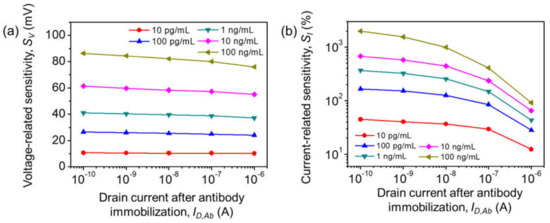
Figure 5.
(a) Average voltage-related sensitivity SV and (b) average current-related sensitivity SI vs. ID,Ab of various [PA]s.
3.3. Sensitivity, LOD, and Selectivity
Figure 6a,b show SV and SI vs. the logarithm of the [PA] at ID,Ab = 100 pA. A logistic calibration curve was used to determine the relationship between sensor responses and antigen concentrations [35,36,37]. The curves from the fit were SV = 130 × [PA]0.34/(2.06 × 10−3 + [PA]0.34) and SI = 7100 × [PA]0.42/(3.33 × 10−3 + [PA]0.42). The dynamic range was more than four orders of magnitude from 100 pg/mL to 1 μg/mL of [PA].
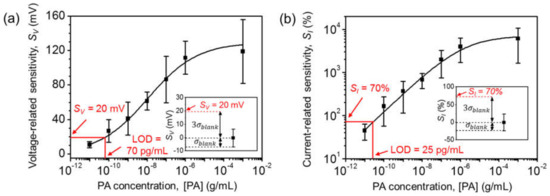
Figure 6.
[PA] vs. (a) SV and (b) SI at ID,Ab = 100 pA. The solid lines which are showed in the figures are logistic fitted lines. Inset: SV, SI of blank replicates (1 × PBS solution with no PAs), and SV, SI at the LOD using the three-sigma method.
The LOD was calculated using the three-sigma method [38,39]. The standard deviations from the blank replicate (1 × PBS solution without PA) were as low as 7 mV for SV and 23% for SI. The extracted LODs for SV and SI were as low as 70 pg/mL and 25 pg/mL, respectively. Table 1 summarizes the LODs of various PA sensors in the literature, including ELISA [9], heat transfer methods [40], surface-enhanced Raman spectroscopy (SERS) [41], and resistors [42,43]. The LOD for our Si-EGT is almost ten times lower than those in previous reports.

Table 1.
LOD comparison between various PA sensors.
Figure 7 shows non-specific control experiments for confirming PA selectivity. The immobilized devices were exposed to cardiac troponin I (cTnI), streptavidin, and avidin. The SI values from relatively high-concentration biomolecules were far below the LOD level, indicating that the sensitivity stems from specific PA binding. Additionally, SI was almost zero with no surface functionalization upon exposure to 1 μg/mL of PA, suggesting that the PA antibodies were successfully immobilized.
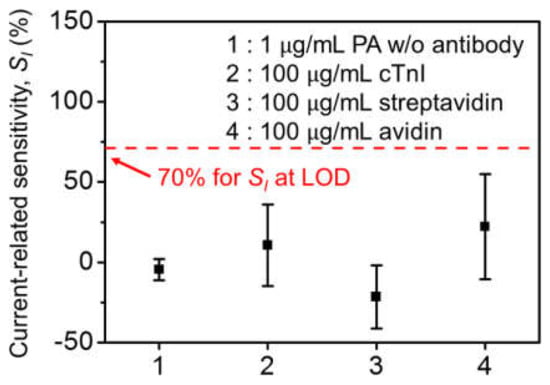
Figure 7.
Selectivity test with 1 μg/mL PA without surface functionalization, 100 μg/mL cTnI, streptavidin, and avidin with surface functionalization at ID,Ab = 100 pA.
3.4. Detection Principle of Si-EGTs
Binding events on a sensing surface are described using various methods [23,24,25,44]. Among them, the presence of a dipole layer has been typically utilized to explain the detection principle of EGT devices [23,24,25]. The magnitude and direction of the dipole layer are largely dependent on the type of antibody–antigen conjugate and its density on the surface. The dipole potential (VDP) generated by an antibody–antigen reaction is expressed as [25]:
where NAb_Ag is the areal density of antibody–antigen conjugates, PDP is the dipole moment, and εDP is the dielectric constant of the dipole layer. Because PDP and εDP are intrinsic characteristics of the conjugates and are the same on both gate electrode and the channel, VDP has a proportional relationship with NAb_Ag.
To compare the induced VDP on the gate electrode (VDP,GT) and channel (VDP,CH), NAb_Ag can be estimated using a gold nanoparticle (AuNP)-conjugated antigen. Based on the limited availability of AuNP-conjugated PA, streptavidin and AuNP-conjugated biotin were used alternatively. After the same functionalization treatment, 1 mg/mL of streptavidin solution was exposed for 2 h, followed by a reaction with AuNP-conjugated biotin for 2 h. Figure 8 shows the scanning electron microscopy (SEM) images of the immobilized AuNPs on the channel and the gate electrode. AuNPs were mainly attached along the grain boundary of the gate electrode. The areal density of AuNPs on the gate electrode was 5 to 10 times higher than that on the channel. This result indicates that VDP,GT is the dominant component affecting the sensing characteristics of Si-EGT.
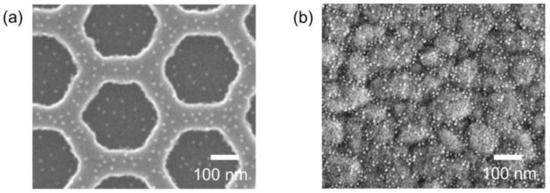
Figure 8.
SEM images of (a) the channel and (b) the gate electrode with the immobilization of AuNPs (diameter: 10 nm).
Figure 9 shows an energy band diagram for the Si-EGT after antibody immobilization and antibody–PA reaction. This diagram explains several sensing characteristics with two representative operation points: the flat band condition (VG = VFB, φS = 0) and threshold voltage condition (VG = VTH, φS = 2φF). The dipole potential on the gate electrode causes a change in the effective work function of the gate metal, which is relevant to the threshold voltage (VTH) [23,24,25].
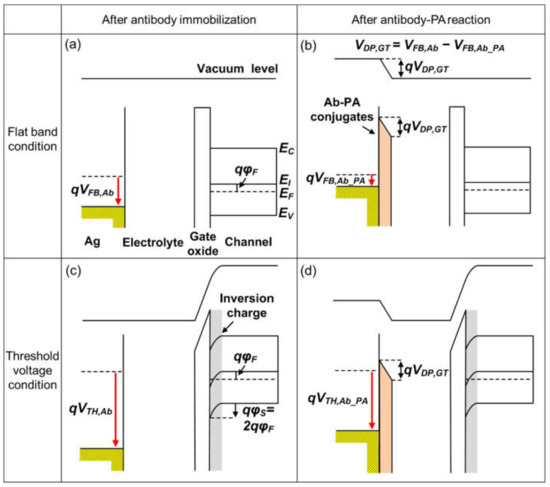
Figure 9.
(a–d) Energy band diagrams of EGTs after antibody immobilization and after antibody–PA reactions under flat band conditions (VG = VFB, φS = 0) and threshold voltage conditions (VG = VTH, φS = 2φF).
When a PA solution is dropped onto the antibody-immobilized Si-EGT, the antibody–PA conjugate forms a dipole layer on the gate surface where the electric field points toward the gate electrode, as shown in Figure 9b,d. The potential drop (VDP,GT) across the dipole decreases the work function of the gate electrode, followed by VFB,Ab_PA = VFB,Ab − VDP,GT. Therefore, an increase in [PA] requires a less positive VG to flow the same drain current, or it results in the reduction of VTH.
4. Conclusions
We demonstrated the highly sensitive detection of PAs using Si-based electrolyte-gated FET biosensors. The fabricated devices showed excellent intrinsic characteristics, including a low VTH of ~0.7 V, low subthreshold swing of ~70 mV/dec, low gate leakage current of <10 pA, and high ION/IOFF ratio of ~107. The voltage-related and current-related sensitivities depending on the operation regimes were investigated to achieve higher sensitivity and low power consumption. The current-related sensitivity decreases exponentially as ID increases from the subthreshold regime to the linear regime. The voltage-related sensitivity is almost constant with the gate voltage and increases by approximately 90 mV for [PA] = 100 ng/mL. The calculated LOD is 25 pg/mL. High specificity was also confirmed through non-specific binding tests. These results suggest that Si-EGT is very promising for identifying PAs and screening PAs in food samples.
Author Contributions
Conceptualization, D.K. and B.J.; methodology, D.K., S.-A.K. and K.K.; validation, W.C. and W.-B.S.; investigation, S.S. and J.P.; data curation, S.S. and J.P.; writing—original draft preparation, D.K., B.J., K.K. and J.-S.L.; writing—review and editing, D.K. and J.-S.L.; supervision, K.K. and J.-S.L. All authors have read and agreed to the published version of the manuscript.
Funding
This work was supported by Food, Agriculture, Forestry, and Fisheries (IPET) through the Animal Disease Management Technology Development Program, which is funded by the Ministry of Agriculture, Food, and Rural Affairs (MAFRA) (120091-02-1-CG000), and by the MSIT (Ministry of Science and ICT), Korea, under the “Nano·Material Technology Development Program” (2009-0082580) supervised by the NRF (National Research Foundation of Korea).
Conflicts of Interest
The authors declare no conflict of interest.
References
- Sicherer, S.H.; Sampson, H.A. Food allergy: A review and update on epidemiology, pathogenesis, diagnosis, prevention, and management. J. Allergy Clin. Immunol. 2018, 141, 41–58. [Google Scholar] [CrossRef] [Green Version]
- Lieberman, J.A.; Glaumann, S.; Batelson, S.; Borres, M.P.; Sampson, H.A.; Nilsson, C. The utility of peanut components in the diagnosis of IgE-mediated peanut allergy among distinct populations. J. Allergy Clin. Immunol. 2013, 1, 75–82. [Google Scholar] [CrossRef]
- Lieberman, J.A.; Gupta, R.S.; Knibb, R.C.; Haselkorn, T.; Tilles, S.; Mack, D.P.; Pouessel, G. The Global Burden of Illness of Peanut Allergy: A Comprehensive Literature Review. Allergy 2020, 76, 1367–1384. [Google Scholar] [CrossRef]
- Bégin, P.; Paradis, L.; Paradis, J.; Picard, M.; Roches, A.D. Natural resolution of peanut allergy: A 12-year longitudinal follow-up study. J. Allergy Clin. Immunol. 2013, 1, 528–530. [Google Scholar] [CrossRef]
- Hebling, C.M.; Ross, M.M.; Callahan, J.H.; McFarland, M.A. Size-Selective Fractionation and Visual Mapping of Allergen Protein Chemistry in Arachis hypogaea. J. Proteome Res. 2012, 11, 5384–5395. [Google Scholar] [CrossRef]
- Bublin, M.; Breiteneder, H. Cross-reactivity of peanut allergens. Curr. Allergy Asthme Rep. 2014, 14, 426. [Google Scholar] [CrossRef] [Green Version]
- Scurlock, A.M.; Burks, A.W. Peanut allergenicity. Ann. Allergy Asthma Immunol. 2004, 93, S12–S18. [Google Scholar] [CrossRef]
- Montserrat, M.; Sanz, D.; Juan, T.; Herrero, A.; Sanchez, L.; Calvo, M.; Perez, M.D. Detection of peanut (Arachis hypogaea) allergens in processed foods by immunoassay: Influence of selected target protein and ELISA format applied. Food Control. 2015, 54, 300–307. [Google Scholar] [CrossRef] [Green Version]
- Weng, X.; Gaur, G.; Neethirajan, S. Rapid Detection of Food Allergens by Microfluidics ELISA-Based Optical Sensor. Biosensors 2016, 6, 24. [Google Scholar] [CrossRef] [Green Version]
- Pandey, A.K.; Varshney, R.K.; Sudini, H.K.; Pandey, M.K. An Improved Enzyme-Linked Immunosorbent Assay (ELISA) Based Protocol Using Seeds for Detection of Five Major Peanut Allergens Ara h 1, Ara h 2, Ara h 3, Ara h 6, and Ara h 8. Front. Nutr. 2019, 6, 68. [Google Scholar] [CrossRef]
- Oliver, S.; Stefan, V. Development of a Real-Time PCR and a Sandwich ELISA for Detection of Potentially Allergenic Trace Amounts of Peanut (Arachis hypogaea) in Processed Foods. J. Agric. Food Chem. 2004, 52, 3754–3760. [Google Scholar]
- Inés, M.L.-C.; Silvia, d.l.C.; Nicolette, P.; Isabel, G.; Teresa, G.; Rosario, M. Development of a real time PCR assay for detection of allergenic trace amounts of peanut (Arachis hypogaea) in processed foods. Food Control. 2013, 30, 480–490. [Google Scholar]
- Zhang, W.-J.; Cai, Q.; Guan, X.; Chen, Q. Detection of peanut (Arachis hypogaea) allergen by Real-time PCR method with internal amplification control. Food Chem. 2015, 174, 547–552. [Google Scholar] [CrossRef]
- Puente-Lelievre, C.; Eischeid, A.C. Development and evaluation of a real-time PCR multiplex assay for the detection of allergenic peanut using chloroplast DNA markers. J. Agric. Food Chem. 2018, 66, 8623–8629. [Google Scholar] [CrossRef]
- Forootan, A.; Sjöback, R.; Björkman, J.; Sjögreen, B.; Linz, L.; Kubista, M. Methods to determine limit of detection and limit of quantification in quantitative real-time PCR (qPCR). Biomol. Detec. Quantif. 2017, 12, 1–6. [Google Scholar] [CrossRef]
- Cui, Y.; Wei, W.; Park, H.; Lieber, C.M. Nanowire nanosensors for highly sensitive and selective detection of biological and chemical species. Science 2001, 293, 1289–1292. [Google Scholar] [CrossRef]
- Ding, B.; Wang, M.; Wang, X.; Yu, J.; Sun, G. Electrospun nanomaterials for ultrasensitive sensors. Mater. Today 2010, 13, 16–27. [Google Scholar] [CrossRef]
- Kanai, Y.; Ohmuro-Matsuyama, Y.; Tanioku, M.; Ushiba, S.; Ono, T.; Inoue, K.; Kitaguchi, T.; Kimura, M.; Ueda, H.; Matsumoto, K. Graphene field effect transistor-based immunosensor for ultrasensitive noncompetitive detection of small antigens. ACS Sens. 2020, 5, 24–28. [Google Scholar] [CrossRef]
- Stern, E.; Klemic, J.F.; Routenberg, D.A.; Wyrembak, P.N.; Turner-Evans, D.B.; Hamilton, A.D.; LaVan, D.A.; Fahmy, T.M.; Leed, M.A. Label-free immunodetection with CMOS-compatible semiconducting nanowire. Nature 2007, 445, 519–522. [Google Scholar] [CrossRef]
- Kim, K.; Park, C.; Kwon, D.; Kim, D.; Meyyappan, M.; Jeon, S.; Lee, J.-S. Silicon nanowire biosensors for detection of cardiac troponin I (cTnI) with high sensitivity. Biosens. Bioelectron. 2016, 77, 695–701. [Google Scholar] [CrossRef]
- Hideshima, S.; Sato, R.; Inoue, S.; Kuroiwa, S.; Osaka, T. Detection of tumor marker in blood serum using antibody-modified field effect transistor with optimized BSA blocking. Sens. Actuators B Chem. 2012, 161, 146–150. [Google Scholar] [CrossRef]
- Mulla, M.Y.; Tuccori, E.; Magliulo, M.; Lattanzi, G.; Palazzo, G.; Persaud, K.; Torsi, L. Capacitance-modulated transistor detects odorant binding protein chiral interactions. Nat. Commun. 2015, 6, 6010. [Google Scholar] [CrossRef] [Green Version]
- Macchia, E.; Manoli, K.; Holzer, B.; Franco, C.D.; Chittorelli, M.; Torricelli, F.; Alberga, D.; Mangiatordi, G.F.; Palazzo, G.; Scamarcio, G.; et al. Single-molecule detection with a millimetre-sized transistor. Nat. Commun. 2018, 9, 3223. [Google Scholar] [CrossRef]
- Machhia, E.; Sarchina, L.; Picca, R.A.; Manoli, K.; Franco, C.D.; Scamarcio, G.; Torsi, L. Ultra-low HIV-1 p24 detection limits with a bioelectronics sensor. Anal. Bioanal. Chem. 2019, 412, 811–818. [Google Scholar] [CrossRef] [Green Version]
- Lin, P.; Luo, X.; Hsing, I.-M.; Yan, F. Organic Electrochemical Transistors Integrated in Flexible Microfluidic Systems and Used for Label-Free DNA Sensing. Adv. Mater. 2011, 23, 4035–4040. [Google Scholar] [CrossRef]
- Guo, K.; Wustoni, S.; Koklu, A.; Díaz-Galicia, E.; Moser, M.; Hama, A.; Alqahtani, A.A.; Ahmad, A.N.; Alhamlan, F.S.; Shuaib, M.; et al. Rapid single-molecule detection of COVID-19 and MERS antigens via nanobody-functionalized organic electrochemical transistors. Nat. Biomed. Eng. 2021, 5, 666–677. [Google Scholar] [CrossRef]
- Dastan, D.; Banpurkar, A. Solution processable sol-gel derived titania gate dielectric for organic field effect transistors. J. Mater. Sci: Mater. Electron. 2017, 28, 3851–3859. [Google Scholar] [CrossRef]
- Zhang, Y.; Wu, Z.; Li, K.; Li, X.; Yang, A.; Tong, P.; Chen, H. Allergenicity assessment on thermally processed peanut influenced by extraction and assessment methods. Food Chem. 2019, 281, 130–139. [Google Scholar] [CrossRef]
- Köhler, G.; Milstein, C. Continuous cultures of fused cells secreting antibody of predefined specificity. Nature 1975, 256, 495–497. [Google Scholar] [CrossRef]
- McKearn, T.J. Cloning of hybridoma cells by limiting dilution in fluid phase. Monocl. Antibod. 1980, 1980, 374. [Google Scholar]
- Song, H.N.; Kim, D.H.; Park, S.G.; Lee, M.K.; Paek, S.H.; Woo, E.J. Purification and characterization of Fab fragments with rapid reaction kinetics against myoglobin. Biosci. Biotechnol. Biochem. 2015, 79, 718–724. [Google Scholar] [CrossRef]
- Taur, Y.; Ning, T.H. Fundamentals of Modern VLSI Devices, 2nd ed.; Cambridge: New York, NY, USA, 2012; pp. 148–203. [Google Scholar]
- Shoorideh, K.; Chui, C.O. Optimization of the sensitivity of FET-based biosensors via biasing and surface charge engineering. IEEE Trans. Electron. Dev. 2012, 59, 3104–3110. [Google Scholar] [CrossRef]
- Hideshima, S.; Hinou, H.; Ebihara, D.; Sato, R.; Kuroiwa, S.; Nakanishi, T.; Nishimura, S.-I.; Osaka, T. Attomolar detection of influenza A virus hemagglutinin human H1 and avian H5 using glycan-blotted field effect transistor biosensor. Anal. Chem. 2013, 85, 5641–5644. [Google Scholar] [CrossRef]
- Tajima, N.; Takai, M.; Ishihara, K. Significance of Antibody Orientation Unraveled: Well-Oriented Antibodies Recorded High Binding Affinity. Anal. Chem. 2011, 83, 1969–1976. [Google Scholar] [CrossRef]
- Kurganov, B.I.; Lobanov, A.V.; Borisov, I.A.; Reshetilov, A.N. Criterion for Hill equation validaity for description of biosensor calibration curve. Anal. Chim. Acta 2001, 427, 11–19. [Google Scholar] [CrossRef]
- Tschmelak, J.; Kumpf, M.; Kappel, N.; Proll, G.; Gauglitz, G. Total internal reflectance fluorescence (TIRF) biosensor for environmental monitoring of testosterone with commercially available immunochemistry: Antibody characterization, assay development and real sample measurements. Talanta 2006, 69, 343–350. [Google Scholar] [CrossRef]
- Gao, A.; Lu, N.; Wang, Y.; Li, T. Robust ultrasensitive tunneling-FET biosensor for point-of-care diagnostics. Sci. Rep. 2016, 6, 22554. [Google Scholar] [CrossRef] [Green Version]
- Shrivastava, A.; Gupta, B. Methods for the Determination of Limit of Detection and Limit of Quantitation of the Analytical Methods. Chron. Young Sci. 2011, 2, 21–25. [Google Scholar] [CrossRef]
- Peeters, M.; Grinsven, B.V.; Cleji, T.J.; Jiménez-Monroy, K.L.; Cornelis, P.; Pérez-Ruiz, E.; Wackers, G.; Thoelen, R.; Ceuninck, W.D.; Lammertyn, J.; et al. Label-free Protein Detection Based on the Heat-Transfer Method—A Case Study with the Peanut Allergen Ara h 1 and Aptamer-Based Synthetic Receptors. ACS Appl. Mater. Interfaces 2015, 7, 10316–10323. [Google Scholar] [CrossRef] [Green Version]
- Pollet, J.; Delport, F.; Janssen, K.P.F.; Tran, D.T.; Wouters, J.; Verbiest, T.; Lammertyn, J. Fast and accurate peanut allergen detection with nanobead enhanced optical fiber SPR biosensor. Talanta 2011, 83, 1436–1441. [Google Scholar] [CrossRef]
- Alves, R.C.; Pimentel, F.B.; Nouws, H.P.A.; Marques, R.C.B.; González-García, M.B.; Oliveira, M.B.P.P.; Delerue-Matos, C. Detection of Ara h 1 (a major peanut allergen) in food using an electrochemical gold nanoparticle-coated screen-printed immunosensor. Biosens. Bioelectron. 2015, 64, 19–24. [Google Scholar] [CrossRef] [Green Version]
- Sobhan, A.; Oh, J.-H.; Park, M.-K.; Kim, S.W.; Park, C.; Lee, J. Assessment of peanut allergen Ara h1 in processed foods using a SWCNTs-based nanobiosensor. Biosci. Biotechnol. Biochem. 2018, 82, 1134–1142. [Google Scholar] [CrossRef] [Green Version]
- Zhou, W.-D.; Dastan, D.; Li, J.; Yin, X.-T.; Wang, Q. Discriminable Sensing Response Behavior to Homogeneous Gases Based on n-ZnO/p-NiO Composites. Nanomaterials 2020, 10, 785. [Google Scholar] [CrossRef] [Green Version]
Publisher’s Note: MDPI stays neutral with regard to jurisdictional claims in published maps and institutional affiliations. |
© 2022 by the authors. Licensee MDPI, Basel, Switzerland. This article is an open access article distributed under the terms and conditions of the Creative Commons Attribution (CC BY) license (https://creativecommons.org/licenses/by/4.0/).