Article

SERS-Active Substrate with Collective Amplification Design for Trace Analysis of Pesticides

1
Department of Materials Science and Engineering, National Cheng Kung University, 1 University Road, Tainan 701, Taiwan
2
Medical Device Innovation Center, National Cheng Kung University, 1 University Road, Tainan 701, Taiwan
3
Center for Measurement Standards, Industrial Technology Research Institute, No. 321, Kuang Fu Road, Sec. 2, Hsinchu 300, Taiwan
*
Author to whom correspondence should be addressed.
Nanomaterials 2019, 9(5), 664; https://doi.org/10.3390/nano9050664
Submission received: 10 April 2019 / Revised: 23 April 2019 / Accepted: 24 April 2019 / Published: 27 April 2019

Abstract

:
Health risks posed by the exposure to trace amounts of pesticide residue in agricultural products have gained a lot of concerns, due to their neurotoxic nature. The applications of surface-enhanced Raman Scattering (SERS) as a detection technique have consistently shown its potential as a rapid and sensitive means with minimal sample preparation. In this study, gold nanoparticles (Au NPs) in elliptical shapes were collected into a layer of ordered zirconia concave pores. The porous zirconia layer (pZrO2) was then deposited with Au NPs, denoted as Au NPs (x)/pZrO2, where x indicates the deposition thickness of Au NPs in nm. In the concave structure of pZrO2, Au-ZrO2 and Au-Au interactions provide a synergistic and physical mechanism of SERS, which is anticipated to collect and amplify SERS signals and thereafter improve the enhancement factor (EF) of Au NPs/pZrO2. By taking Rhodamine 6G (R6G) as the test molecule, EF of Au NPs/pZrO2 might reach to 7.0 × 10⁷. Au NPs (3.0)/pZrO2 was then optimized and competent to detect pesticides, e.g., phosmet and carbaryl at very low concentrations, corresponding to the maximum residue limits of each, i.e., 0.3 ppm and 0.2 ppm, respectively. Au NPs (3.0)/pZrO2 also showed the effectiveness of distinguishing between phosmet and carbaryl under mixed conditions. Due to the strong affinities of the phosphoric groups and sulfur in phosmet to the Au NPs (3.0)/pZrO2, the substrate exhibited selective detection to this particular pesticide. In this study, Au NPs (3.0)/pZrO2 has thus demonstrated trace detection of residual pesticides, due to the substrate design that intended to provide collective amplification of SERS.

1. Introduction

Trace detection of contaminant or target substance has gained a lot of interests to be effective for various applications, including food safety, environmental monitoring, and medical diagnostics among others [1]. In spite, analytical methods for such applications have already been established, for example, the techniques of chromatography [2] and mass spectroscopy [3]. The said methods are mostly suitable for cases wherein the analyte component in a sample is present at a relatively high concentration, and could also follow a time-consuming process for sample preparation.
Pesticides are undoubtedly effective in minimizing pest infestation on agricultural products, thus preventing losses in product yield. However, there has been a growing public concern on the residuals of pesticides being present in agricultural products intended for consumption and eventually posing health risks. Regulations have thus set maximum residue limits for the residuals of pesticides in products; however, these limits may range from 0.01 to 0.1 ppm, which would require a sensitive detection method [4]. In particular, a fast and precise technique is needed.
The technique of surface-enhanced Raman scattering (SERS) has demonstrated its versatility in rapidly detecting various types of molecules in a straightforward process, requiring a few to no sample preparation at all, while still maintaining integrity and accuracy of presented results. A SERS-active substrate is usually comprised of plasmonic metal nanostructures (e. g., Au, Ag, Cu) since the localized surface plasmon resonance (LSPR), which amplifies the characteristic Raman signals of the analyte(s) arises from collective oscillations of free electrons in these nanostructures [5,6]. Signal enhancement in SERS is based on two mechanisms–electromagnetic (EM) and chemical mechanism (CM). The former has the major contribution to the resulting SERS effect and particularly depends on the presence of localized hot spots between nanostructures where EM field resonance take place, following by interacting with the analyte species that are in close proximity (<5 nm) with the said nanostructures [7]. The EM mechanism relies largely on the physical features of the substrate (e.g., nanostructure geometry and materials for substrate components) and therefore it can be purposely tuned. Aside from substrate’ morphology, the choice of Raman laser wavelength and resulting peaks enhancement can be optimized. [8] Recently, studies have incorporated dielectric materials and oxides, such as TiO2, ZrO2, and Al2O3 alongside Au and Ag nanostructures for further SERS signal enhancement [9,10] to facilitate charge transfer with plasmonic nanostructures in relation to CM. Mechanisms explaining the transfer of active metallic electrons to the dielectric material states that localized EM fields could be formed at the metal-dielectric interface, due to charge transfers [11,12,13]. However, in terms of fabrication, metallic and dielectric components take on different synthesis routes, so to be able to produce SERS-active substrates that make use of both of these materials, multiple fabrication techniques would be necessary [14]. In particular, a zirconia (ZrO2)-based surface has demonstrated an extensive SERS contribution as a component of a metal-dielectric hybrid structure. It provides additional enhancement of SERS effect, not only comes from the charge transfers at the metal/dielectric interface, but also due to a bulge or concave structure serving as high-surface area support; presumably it may accommodate more plasmonic nanoparticles (NPs) on the surface [15,16]. ZrO2 is also capable of anchoring specific functional groups to its oxide surface owing to strong affinities with a variety of chemicals, so this property could be taken as an advantage to tailor the functionality of the surface and improve adsorption with specific target analytes [17].
SERS as a technique for pesticide detection has been cited in several studies, and has shown promising results to be a rapid method that could even detect analytes at trace amounts. Several materials and morphologies have been explored with this particular application in mind—Ag nanoflowers [18], Au/Ag nanorods [14], and colloidal Au nanoparticles [19] among others, all of which showed capabilities of detecting low pesticide concentrations, down to 10−10 M. However, aside from sensitivity, there are still more factors to consider in this particular application, such as the reproducibility of results and the capability of the substrates to detect multiple pesticides in real food matrices [20,21]. To address these issues, morphology control and material selection have been given emphasis, focusing on achieving large-scale uniformity in obtaining SERS measurements [22].
In this study, a straightforward method for substrate fabrication was performed wherein ZrO2 with the concave structure was formed through sol-gel technique and assisted by a template of single-layered polystyrene PS NPs after which, Au NPs were deposited through thermal evaporation. The as-prepared substrate was designed to investigate both the individual and combined SERS effects from the synergy of Au and ZrO2 components. Its specially-designed function as collective amplification of SERS effects was verified by trace analysis of pesticides and its selectivity towards organophosphates. The optimized SERS-active substrate was furthermore applied for the distinction of residual single and multiple pesticides at very low concentrations.

2. Materials and Methods

2.1. Fabrication of Au NPs (x)/pZrO2

Uniform PS NPs, with a diameter of 165 nm that were synthesized through surfactant-free emulsion polymerization, were first deposited onto a pre-cleaned 2 × 2 cm2 Si substrate Si by drawing Si out of PS NPs suspended in water, as shown in Figure 1a. The PS-coated Si was then subjected to slight annealing at 50 °C for 10 min, ensuring that all of the solvents has been evaporated before spin-coating the precursor ZrO2 solution onto Si as illustrated in Figure 1b. The precursor solution was prepared by dissolving pre-weighed zirconium tetrachloride (ZrCl4, 98%, Acros Organics, Pittsburgh, PA, USA) in isopropanol (99.8%, Panreac AppliChem, Darmstadt, Germany) that was left to stand for 24 h in a sealed vessel until it achieved a gel-like consistency. Subsequently it was then subjected to heat treatment at 600 °C for 3 h at a heating rate of 5 °C/min, for complete removal of the template layer of PS NPs and calcination of the remaining ZrO2, leaving behind an ordered concave structure of ZrO2 on Si, denoted as pZrO2, as shown in Figure 1c. The size and dimension of PS NPs, the concentration of the precursor solution, the parameters of spin coating procedure, and the temperature for calcination were all held constant throughout the experiment. As briefly illustrated in Figure 1d, Au NPs were then deposited onto pZrO2 through thermal evaporation using an electron beam evaporator (VT1-10CE, ULVAC, Chigasaki, Japan). The deposition was performed under a pressure of 6~8 × 10⁻⁶ torr, having a deposition rate of 0.1 Å/sec at varying deposition thickness of 1.5, 2.0, 3.0, and 5.0 nm. The pZrO2 containing Au NPs in a porous structure was prepared, and denoted as Au NPs (x)/pZrO2, where x indicates the deposition thickness of Au NPs in nm.

2.2. Physical Characterization of Au NPs (x)/pZrO2

The morphology and composition of Au NPs (x)/pZrO2 substrates were analyzed through high-resolution thermal field emission scanning electron microscope, coupled with energy dispersive X-ray spectroscopy (FE-SEM/EDS, JSM-7000, JEOL, Tokyo, Japan) and atomic force microscope (AFM, Dimension Icon, Bruker, Karlsruhe, Germany) in dynamic mode (scan rate of 0.5 Hz, Au front coating (WAu = 5.18 eV)). Photo-images of Au NPs (x)/pZrO2 were taken by FE-SEM using secondary electron imaging mode at an accelerating voltage of 10 kV. The size and dimension of Au NPs were then measured on the resulting images with the use of ImageJ software (version 1.47, National Institutes of Health, Rockville, MD, USA).

2.3. SERS Property of Au NPs (x)/pZrO2

The as-fabricated Au NPs (x)/pZrO2 was then subjected for evaluating their SERS properties through Raman spectrometer (Renishaw, Wotton-under-Edge, UK) with an incident power of 3 mW and an air-cooled charge-coupled device (CCD) as the detector. All measurements were done in a dry environment at ambient temperature, wherein a fixed amount of the test probe solution of Rhodamine 6G (R6G) at varying concentrations (10−2 M down to 10−7 M) was dropped onto the reference Si and Au NPs (x)/pZrO2, respectively. The substrates were left to dry before subjecting to experiments. The Raman spectrometer was set up in a way that the objective of the optical microscope was set to 50X, the spot size of Raman laser fixed at a diameter of 1 µm, and the diode and He-Ne lasers at excitation wavelengths of 633 and 785 nm with gratings at 1800 lines/nm and 1200 lines/nm, respectively. The calibration of the spectrum was done first before taking any measurements with the use of a standard Si and at a laser power set at 100%. The obtained Raman spectra were processed in to remove background fluorescent signals and noise that may have been generated from the use of an objective lens to focus the laser spot. Baseline correction and smoothing were also deemed necessary to normalize the data for acquiring more defined signals.

2.4. Trace Analysis of Pesticide(s) upon Au NPs (x)/pZrO2

The optimized Au NPs (x)/pZrO2 was employed for their efficacy in detecting trace amounts of pesticide(s), which both phosmet and carbaryl (Sigma Aldrich; pesticides in powder form, St. Louis, MO, USA) were used. Standard solutions from 10−2 to 10−6 M were prepared by dissolving the pesticides in analytical grade ethanol, while equimolar mixtures of both pesticides at 10−2, 10−3, and 10−4 M were also prepared. The effect of SERS involving pesticide solutions was performed in the same manner as those with R6G solutions wherein the solutions were dropped onto the optimized Au NPs (x)/pZrO2 and were allowed to dry at room temperature.

3. Results and Discussion

3.1. Size and Dimension of Au NPs (x)/pZrO2

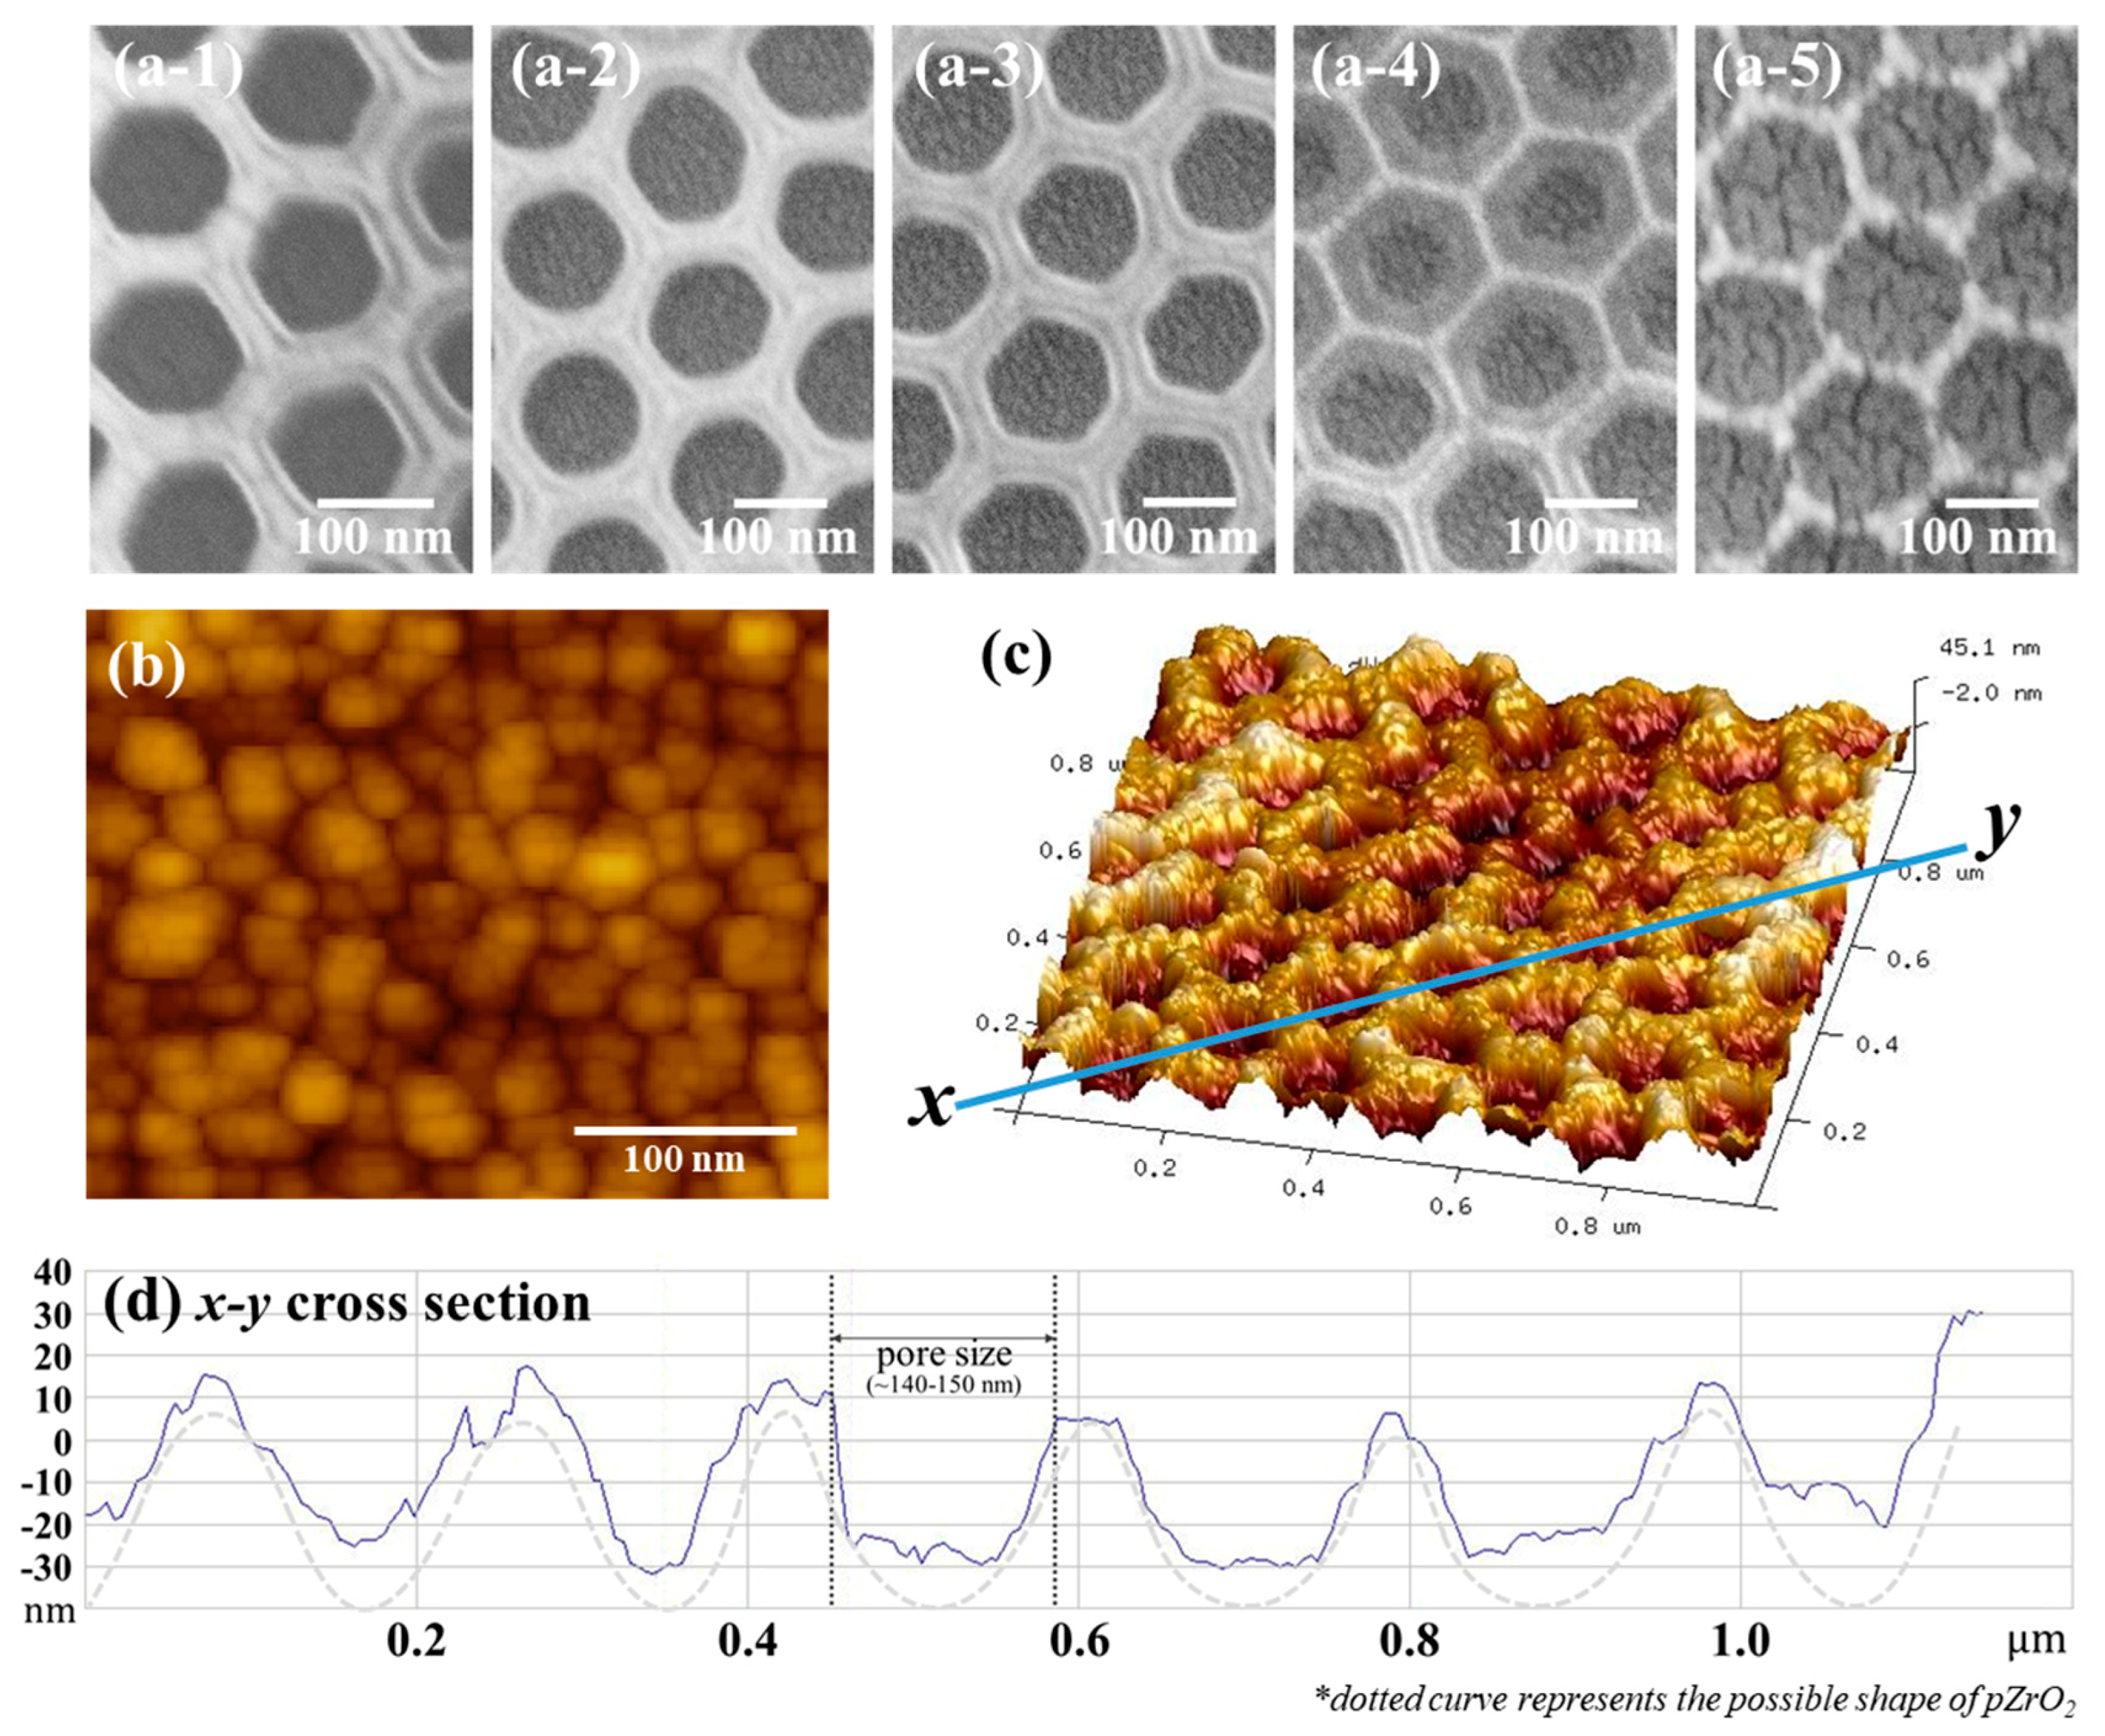
Scanning electron microscope (SEM) images and size distribution of the PS NPs and ZrO2 pores are provided in Figure S1. In Figure 2a, the morphologies of Au NPs (x)/pZrO2, x = 0 (a-1), 1.5 (a-2), 2.0 (a-3), 3.0 (a-4), and 5.0 (a-5) were demonstrated. The photo-images showed that when x = 2.0 (relative loose) and 3.0 (relative dense), Au NPs were relatively appropriate to cover upon pZrO2. With increasing deposition thickness (x), Au NPs appeared to increase in quantity and eventually exhibited agglomeration, as shown in x = 5.0 nm. In Figure 2b, inside a one-unit structure of Au NPs (3.0)/pZrO2, Au NPs exhibited elongated or elliptical in shapes as normally produced through thermal evaporation at low deposition thickness conditions [23].
In Figure 2c, an example of AFM topographical image (1 µm × 1 µm) from Au NPs (3.0)/pZrO2 showed the presence of uniform concave-like cavities on the substrate. As illustrated by a cross-sectional profile (x-y cross section), in Figure 2d, the concave cavities exhibited a geometry with depths ranging around 50 nm, whereas the width of the concave structure was estimated to be 140~150 nm. As compared the diameter (around 165 nm) of PS NPs, the shrinkage of width and depth was most probably due to the addition of ZrO2, followed by the removal of PS NPs and the deposition of Au NPs on the pZrO2.
In Figure 2b, inside a cavity of Au NPs (3.0)/pZrO2, the sizes and dimensions (i.e., lateral and longitudinal) of Au NPs exhibited diameters ranging from 15~50 nm (i.e., with the depths of upper or lower layers), and averaged around 25 nm, while the individual NPs in elongated or elliptical shapes showed closely collective (or sufficiently covered) within pZrO2. Note that as the target species is included in Au NPs (x)/pZrO2, followed by the incident Raman laser, an effect of collective amplification that increases surface contacts near Au-Au “hot spots” is thus anticipated. Among them, Au NPs (3.0)/pZrO2 with a relative dense Au NPs in the concave pore of pZrO2 is preferably selected. Au NPs appearing as clumping the individual NPs owing to an increased amount (e.g., x = 0.5) of material [24] is relatively inappropriate for the design.

3.2. SERS Property of Au NPs (3.0)/pZrO2

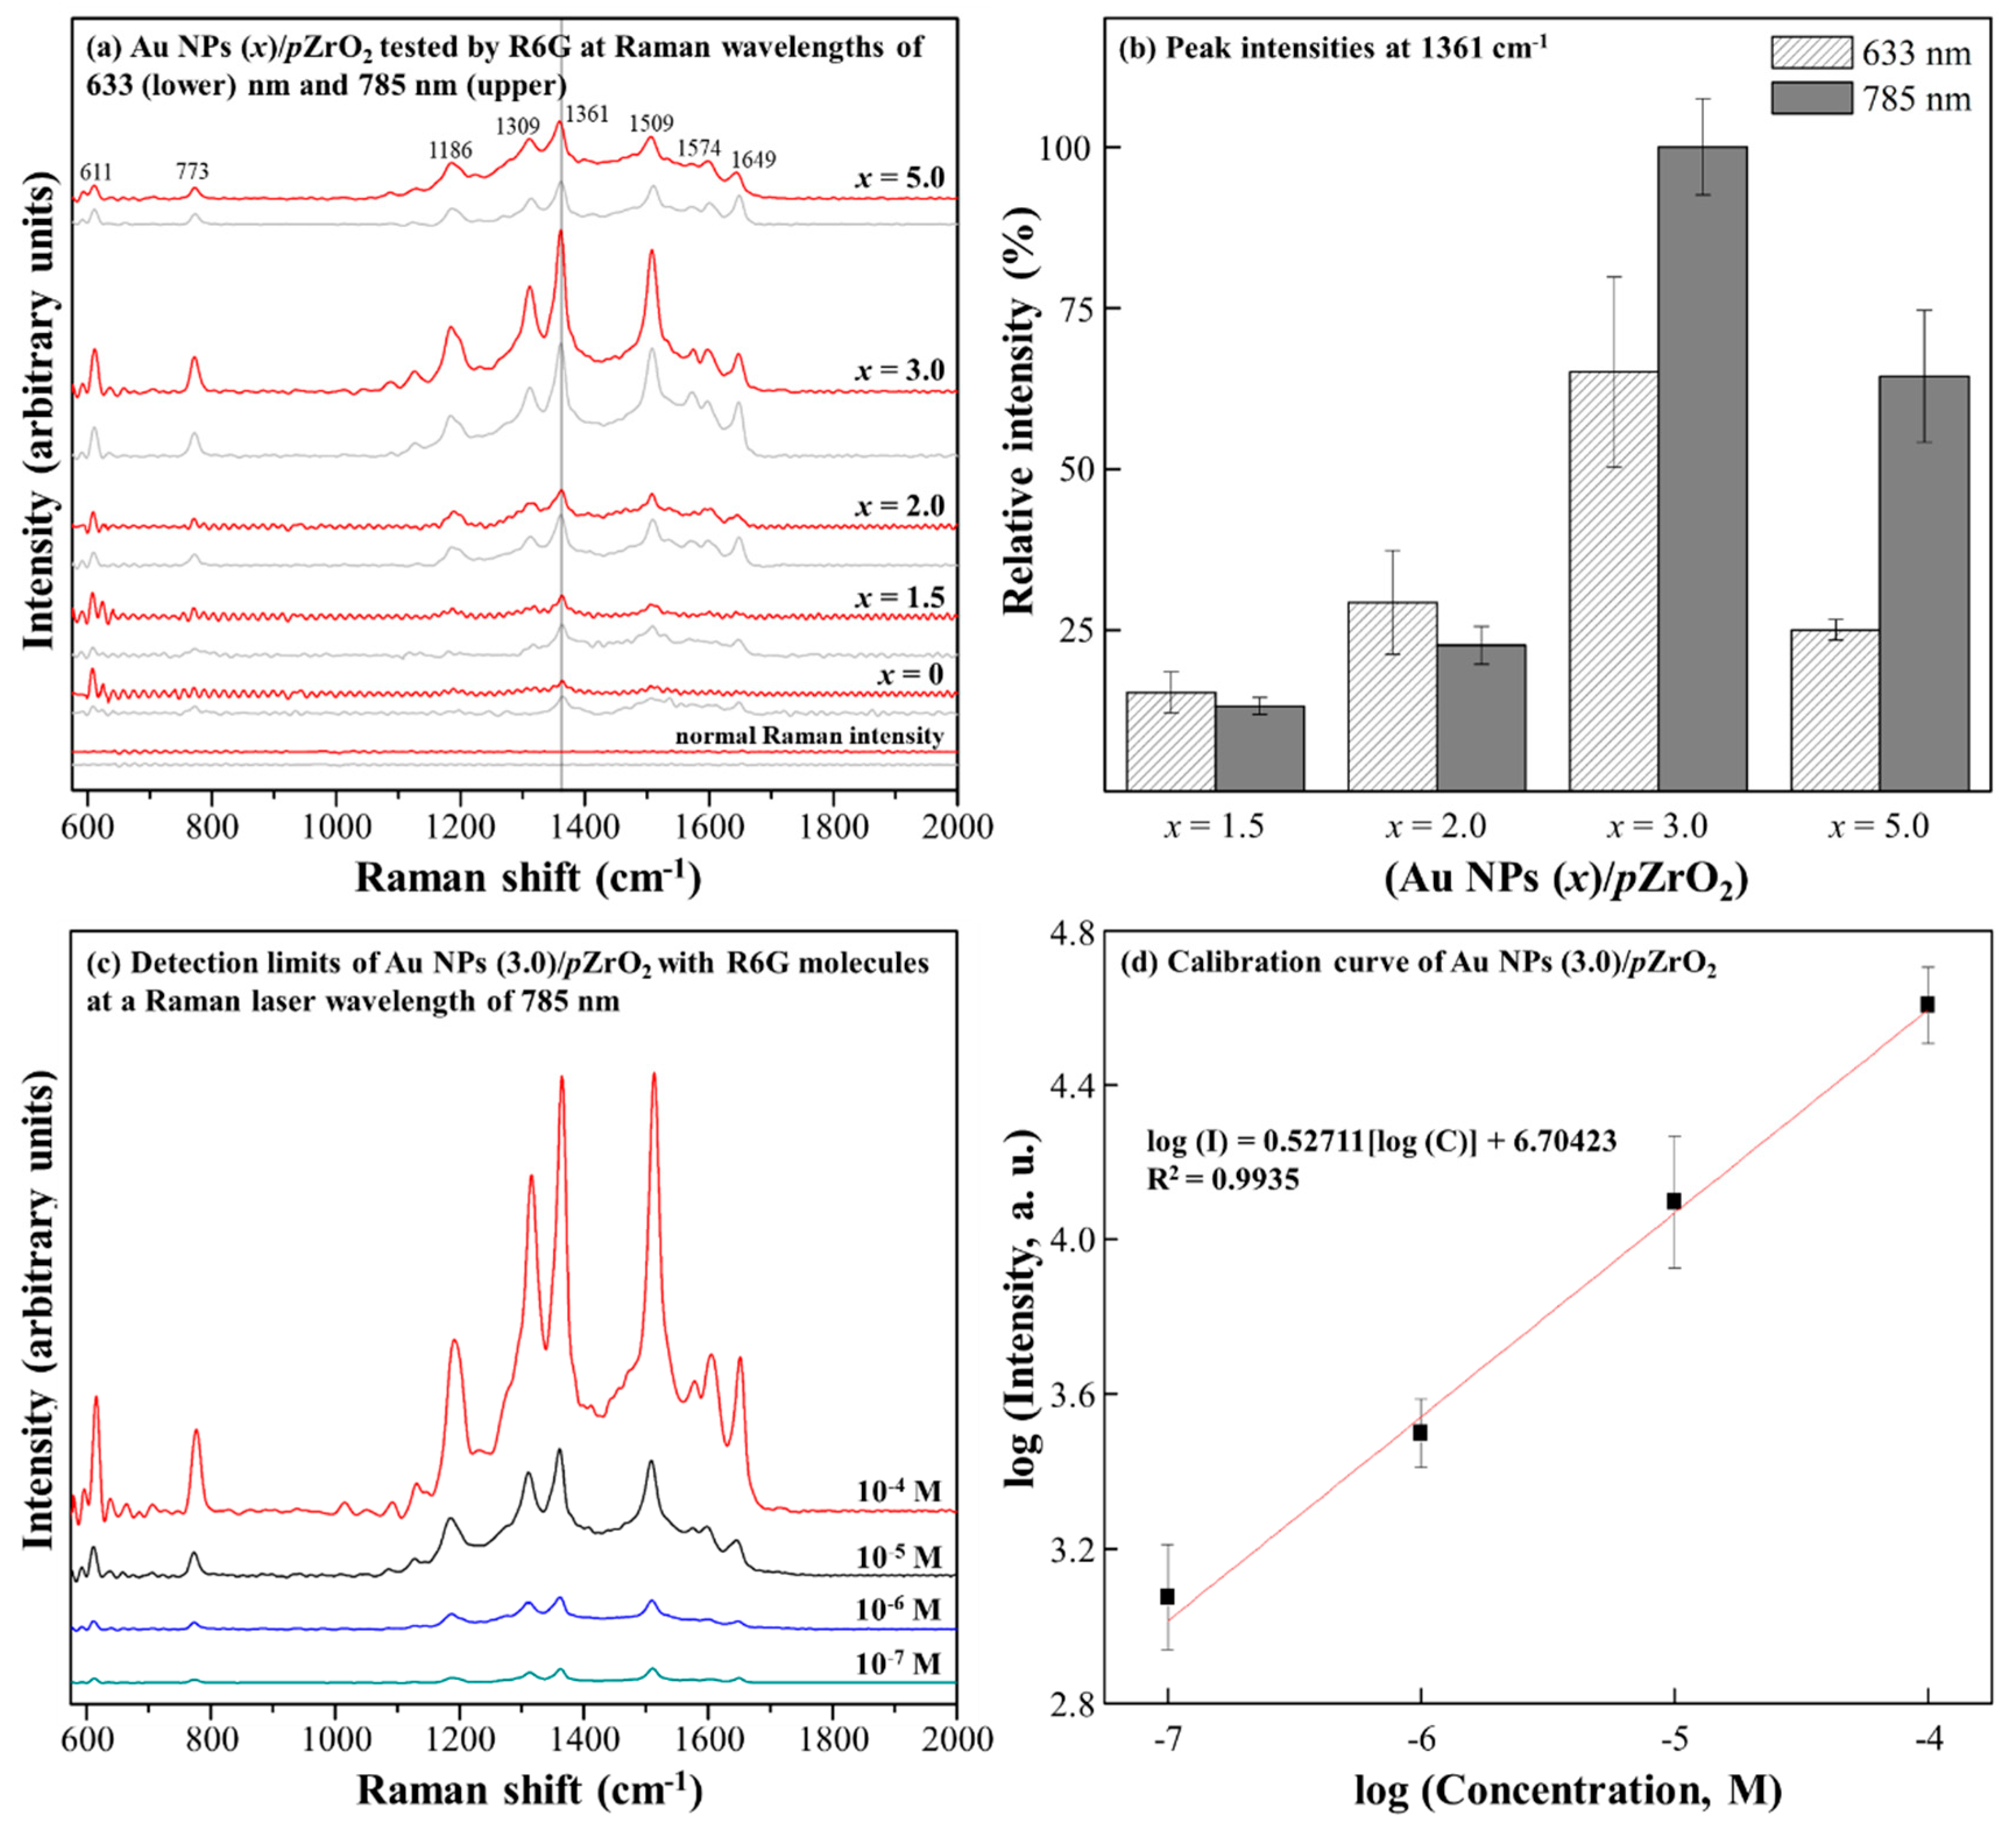
The relationship between the overall SERS effect with Au NPs (x)/pZrO2 was further investigated by checking their Raman intensities with the test molecule probe, R6G, with the variations of x and the excitation wavelengths (i.e., 633 and 785 nm) of Raman laser. As shown in Figure 3a, for both laser wavelengths, there is a noticeable change in the Raman intensities with varying deposition thickness (x) of Au NPs. In Figure 3b, considering the most intense characteristic peak of R6G at 1361 cm−1 as the reference, for both laser wavelengths, the highest intensities were acquired with the use of Au NPs (x)/pZrO2 at x = 3.0 or 5.0 (i.e., relatively abundant Au NPs in both cases). However, Au NPs (3.0)/pZrO2 provided a better combination among Au-Au “hot spots”, R6G molecules, and Raman laser wavelength of 785 nm within the concave pore of pZrO2, an optimal condition was therefore chosen. Reproducibility of signals was investigated by obtaining the R6G SERS spectra from 6 randomly chosen spots across one sample of Au NPs (3.0)/pZrO2, as shown in Figure S2.
In Figure 3c, based on the above result, a detection limit for R6G molecule with the concentrations of 10−4, 10−5, 10−6, and 10−7 M was examined. In Figure 3d, by taking 1361 cm−1 as the indication, a linear log relation between Raman intensity and the concentration was recorded, and a very low detection limit of 10−7 M was estimated. In some studies, a quantitative determination for a trace amount of a target analyte in a sample has been done [25,26]. The EF of Au NPs (3.0)/pZrO2 is calculated to be 7.0 × 10⁷, typically comparable to an averaged EF of recently-developed Au/oxide composite as SERS substrate [27,28], in particular with Au/ZrO2 nanofiber substrate that exhibited an EF of 107 [28].
For SERS effects imparted by the individual component of Au NPs or pZrO2, in comparison to that of combined Au NPs/pZrO2 composite, their SERS spectra were shown in Figure S3. The pZrO2 alone exhibited weak SERS intensity as observed through the enhancement of the major characteristic peaks of R6G, with an average EF of ~102, attributing to the chemical mechanism that works between R6G and ZrO2. Among the above substrates in Figure S1, Au NPs (3.0)/pZrO2, exhibited much significant enhancement that takes the benefits from the individual components and the combination of both. The inset shows that the particular peak at 1311 cm−1 with Au NPs (3.0)/pZrO2 is shifted when Au NPs (3.0)/Si is used, whereas it becomes absent (or not enhanced) in the spectrum produced in pZrO2. It is likely that peaks shifting or absence are resulting from the variation of metal-oxide interactions or that of molecular orientations with respect to the substrate composition [29].

3.3. SERS Properties of Au NPs (x)/pZrO2 to Pesticides Detection

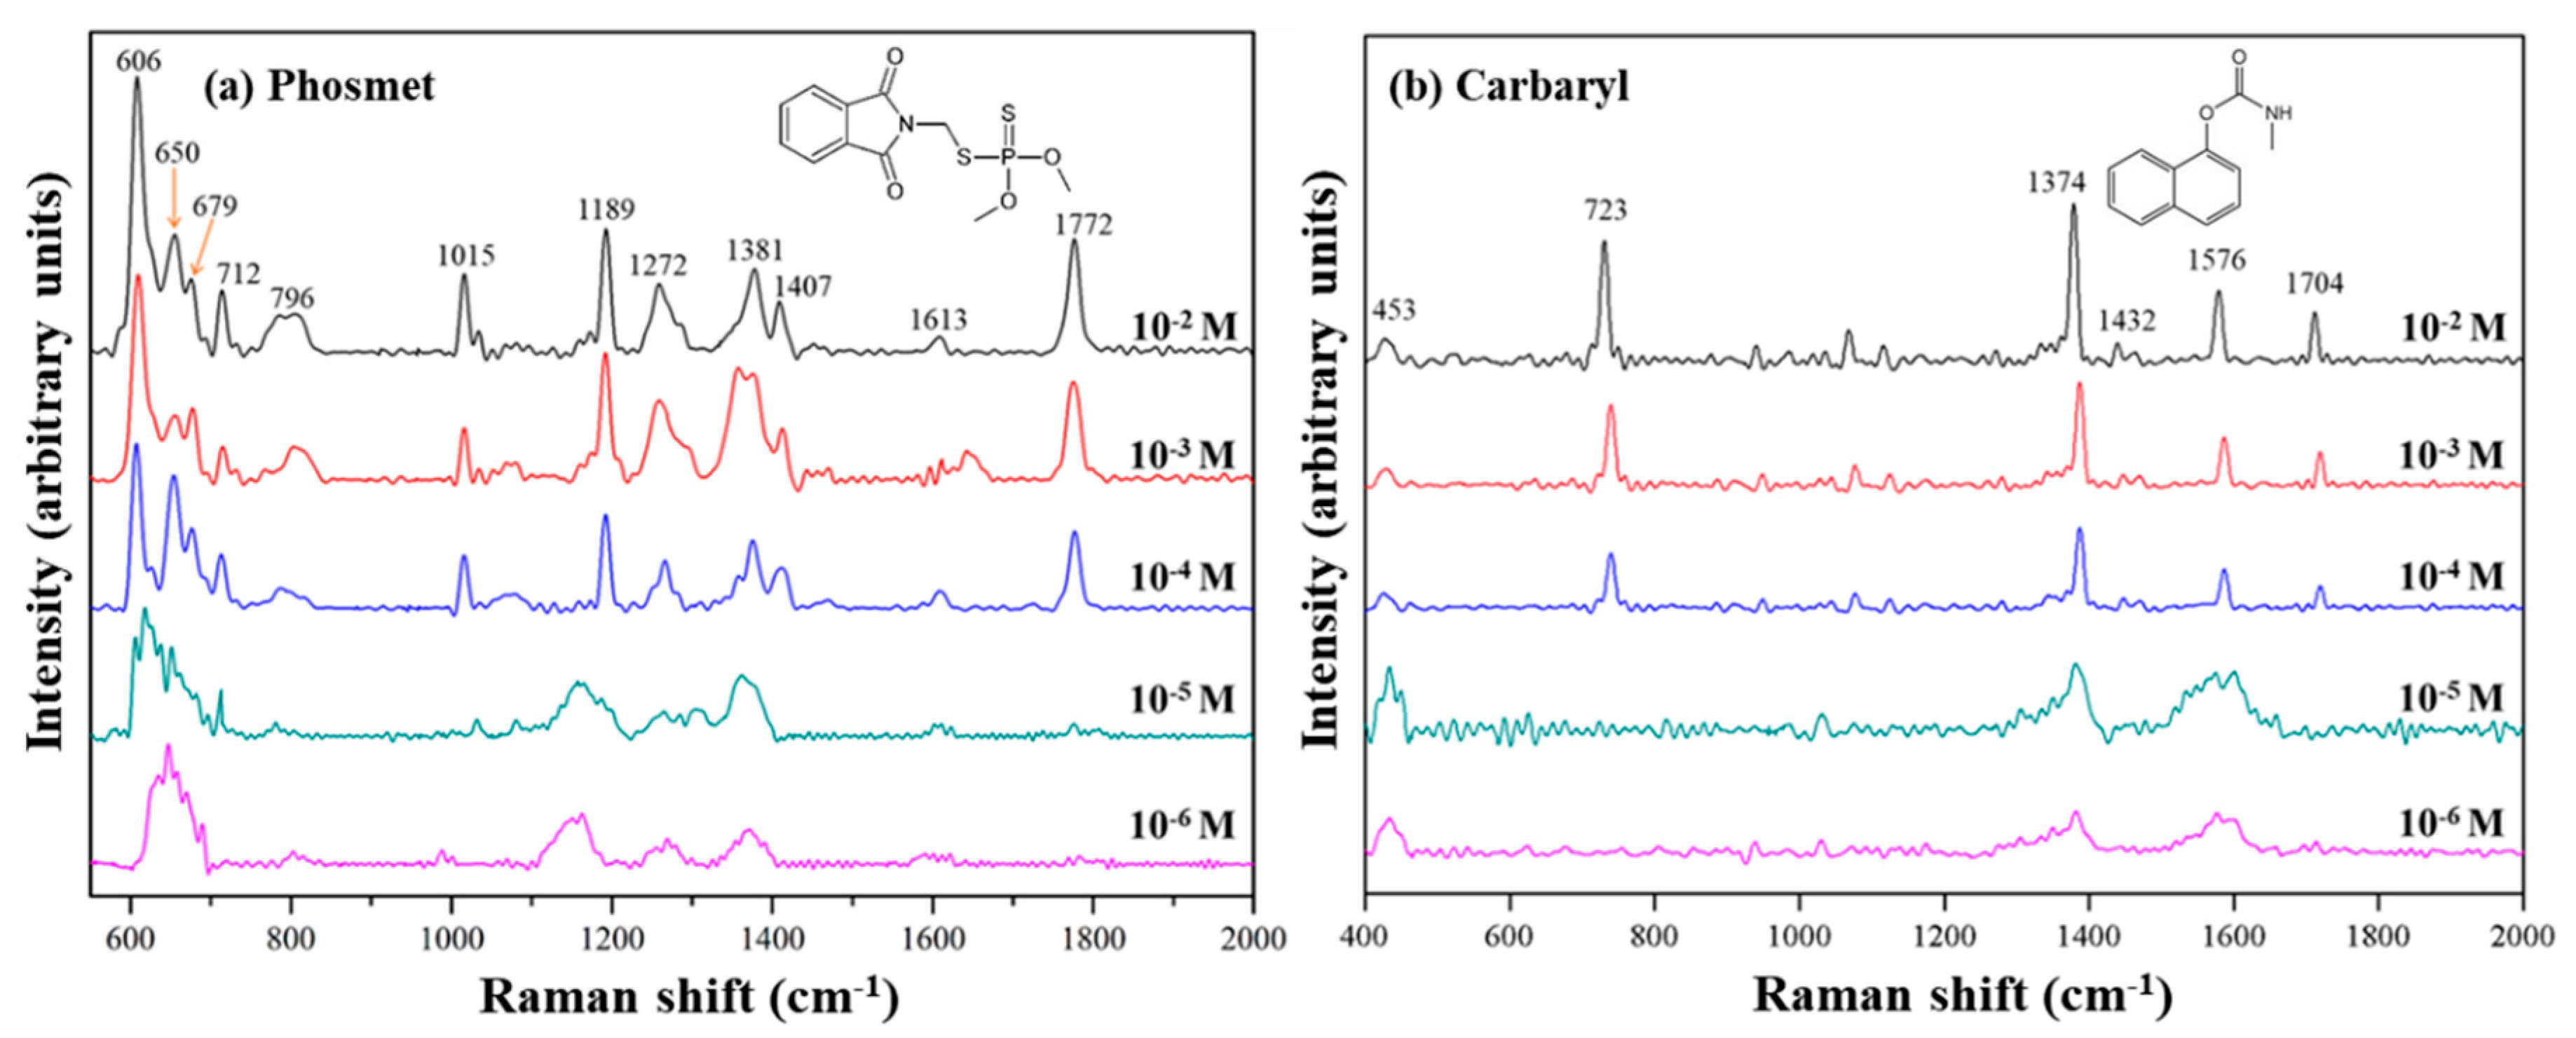
To evaluate the effect of SERS upon Au NPs (3.0)/pZrO2, two pesticides of different chemical structures were respectively examined. In Figure 4a,b, the characteristic peaks of Phosmet and Carbaryl with different concentrations were shown. As summarized in Table S1, the peaks at 606, 653, 675, 712, 796, 1014, 1189, 1260, 1381, 1409, and 1772 cm−1 are represented for Phosmet, while those at 713, 1380, 1441, and 1582 cm−1 for Carbaryl [30,31,32,33]. For both pesticides, at 10−2, 10−3, and 10−4 M, the characteristic peaks appeared to be identical. At lower concentrations of 10−5 and 10−6 M, the effect of SERS became less distinctive.
By taking the characteristic peaks at 606 and 1189 cm−1 for Phosmet and those at 1062 and 1576 cm−1 for Carbaryl, the SERS signal of the pesticides was still detectable, therefore, Au NPs (3.0)/pZrO2 was competent to have the detection limit lower than 10−6 M. According to the regulations set by the Food and Agriculture Organization of the United Nations (FAO) and World Health Organization (WHO), the maximum residue limit for both pesticides in crop products is defined around 5~10 ppm, or 10−5 to 10−4 M, as a consequence, Au NPs (3.0)/pZrO2 is presumably used for trace detection of the measured pesticides.
However, it should be noted that in this study, only standard solutions were used and the effects in simulated and real conditions would differ from the presented results. It was also observed that for both pesticides at lower concentrations (10−5 to 10−4 M), major peaks appear to broaden possibly due to the background of the substrate affecting the resulting Raman spectra. Nevertheless, for both Phosmet and Carbaryl, major characteristic Raman peaks appear regardless of concentration.

3.4. Particular Two Pesticides Detection Using Au NPs (3.0)/pZrO2

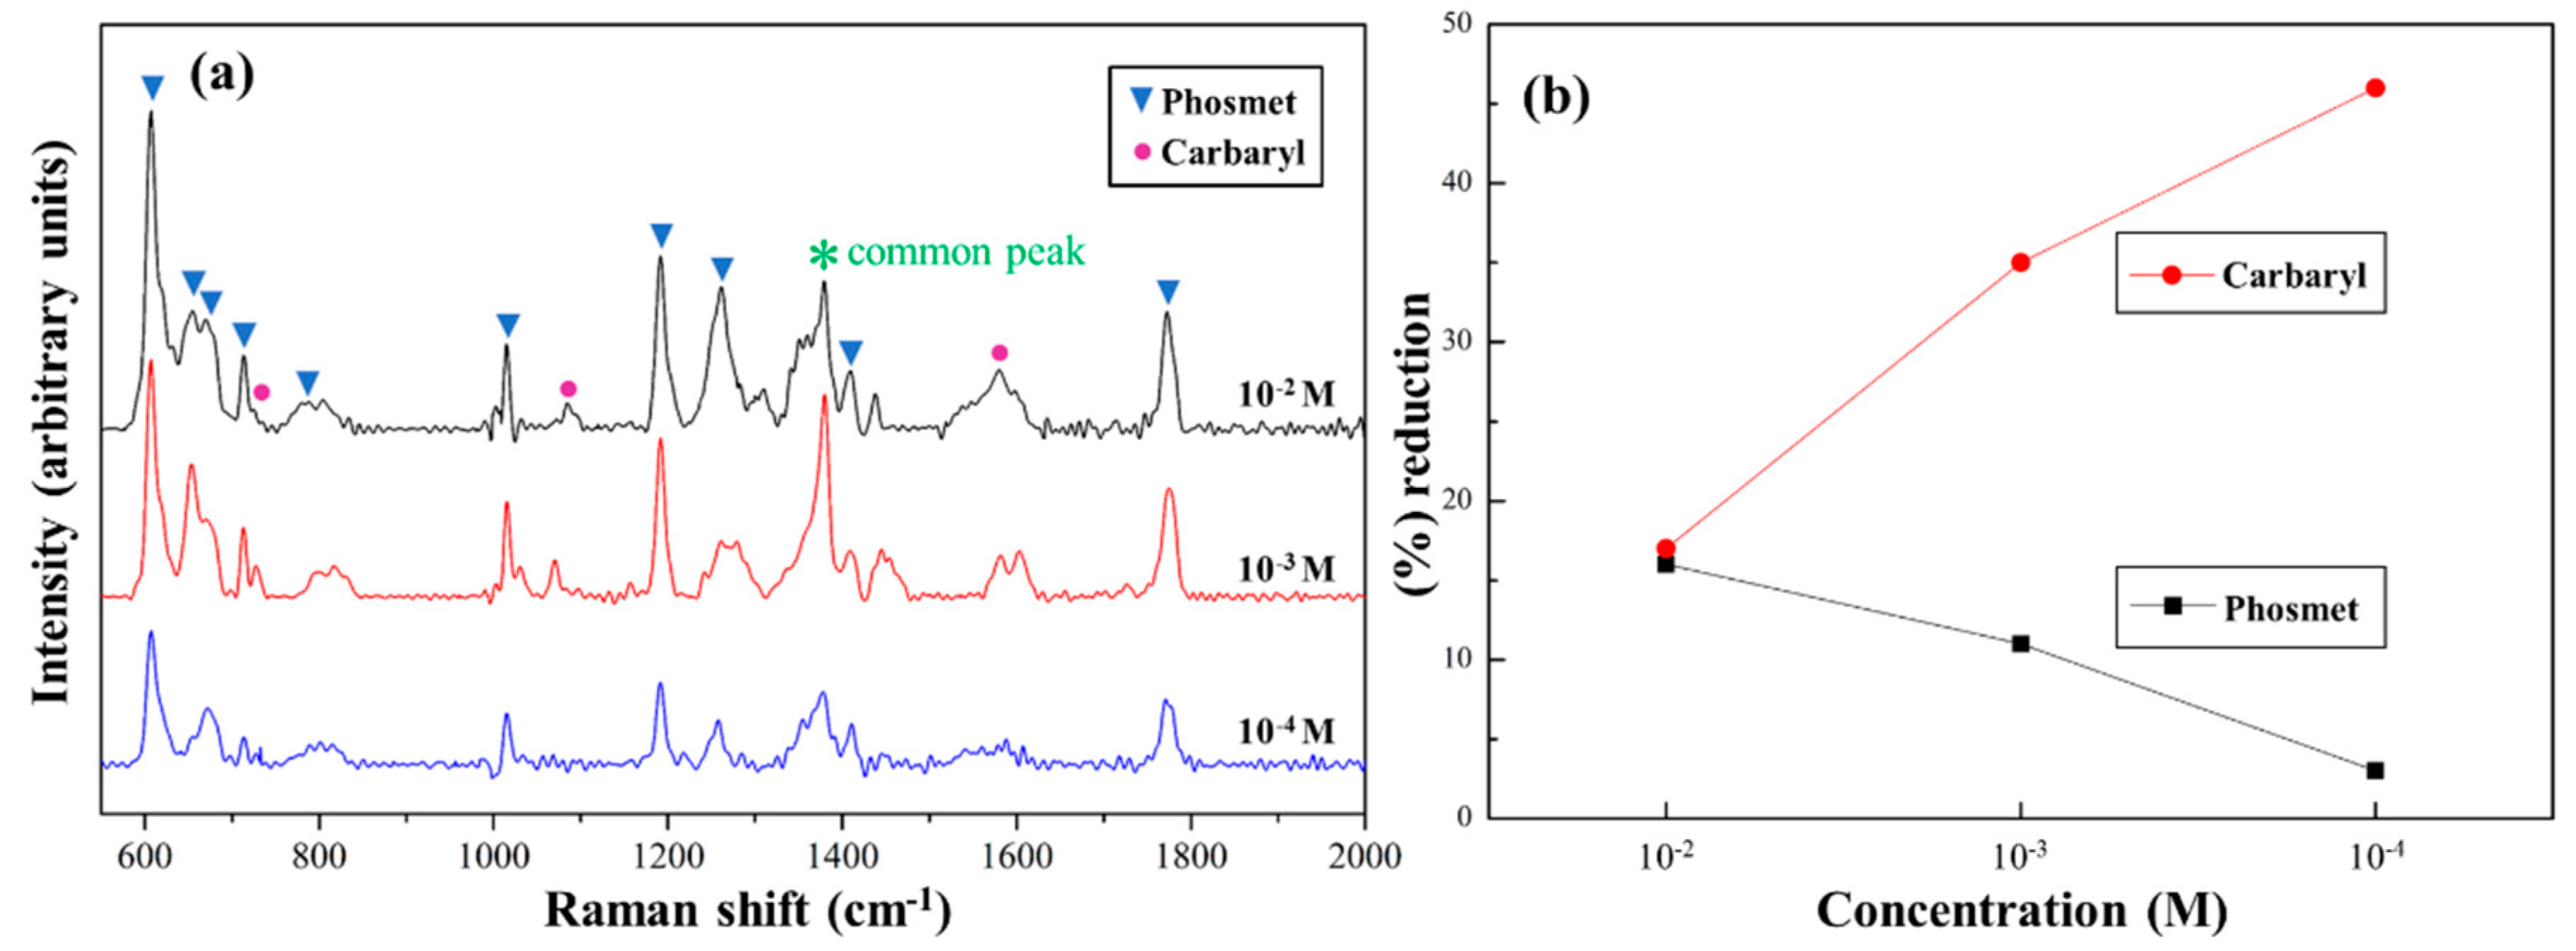
Furthermore, SERS-active substrate of Au NPs (3.0)/pZrO2 was used to perform the detection of both pesticides in a single run. In Figure 5a, the peaks found in the resulting SERS spectra are relevant to both pesticides, indicating that the substrate is capable of detecting analytes. As with any solution of mixtures, the involved analytes tend to compete for adsorption sites on the substrate, thus further investigation that influences the measured signals or intensities is necessary. In Figure 5a, two strongest peaks from each pesticide (606 and 1189 cm−1 for Phosmet and 1062 and 1576 cm−1 for Carbaryl) were taken, and the intensities of the peaks for each pesticide were used to obtain ratios (i.e., I606/I1189 for Phosmet and I1062/I1576 for Carbaryl) from both standard solution and mixture conditions. The peak intensity ratios in the mixture condition were apparently lower than that in each standard solution condition.
In Figure 5b, this decrease is represented by the percentage (%) reduction. These two pesticides showed diversified into opposite trends in terms of the % reduction of peak intensity ratios with concentrations: At a higher concentration of 10−2 M, % reductions for both pesticides were comparable, whereas the differences enlarged as the concentrations decreased. In Figure 5a, with the decrease of mixture concentrations, the peaks corresponding to Phosmet are relatively stronger than those to Carbaryl, as also shown low % reduction in Figure 5b. It indicates that despite being in a multiple analyte environment, the relative peak intensities of Phosmet are sufficiently strong to be detected. Phosmet has a strong binding affinity to the substrate owing to its sulfur and organophosphate components, which bind to Au and ZrO2 components (i.e., the hot spots) of the substrate, respectively. This strong affinity allows a sufficient number of Phosmet molecules even at low concentrations to be adsorbed and detected.
In contrast to Phosmet, Carbaryl suspends within Au NPs (3.0)/pZrO2, relatively away from Au-Au hot spots or ZrO2 surfaces. Therefore, considering the difference in the affinities of the pesticides to the substrate, Carbaryl was shown to exhibit a greater % reduction. This is notably due to the quenching of the Carbaryl signals brought by competitive adsorption among the analytes wherein the presence of Phosmet in the mixture takes up the majority of the available adsorption sites, due to its strong affinity to the substrate [34]. The high selectivity of Au NPs (3.0)/pZrO2 towards Phosmet as demonstrated in this study aligned with the results of another study that also utilized a substrate of Au/ZrO2 with a different morphology to detect 4 various pesticides in a mixture [28]. In Figure 4, each of both pesticide solutions presented a promising SERS result; however, it was not proportional in the case of the mixture condition owing to the changes of the chemical environment. Consequently, for Au NPs (3.0)/pZrO2, the affinity of target molecules to the “hot spots” area should be considered when performing multiple detections of analytes through the technique of SERS.
Chemical enhancement mechanism is based on the modification of the electronic properties of the adsorbed analyte, in which the vibrations resulting from the electronic transitions improve the effect of SERS by 1-2 orders of magnitude [8]. In this study, Phosmet having a stronger affinity to the substrate would thus have a more pronounced chemical enhancement effect, as compared to the weakly-bonded Carbaryl. With this fact, Au NPs (3.0)/pZrO2 has not only shown the capability to detect trace amounts of various pesticides but has also exhibited selectivity specific to organophosphate pesticides.

3.5. Particular Two Pesticides Detection Using Au NPs (3.0)/pZrO2

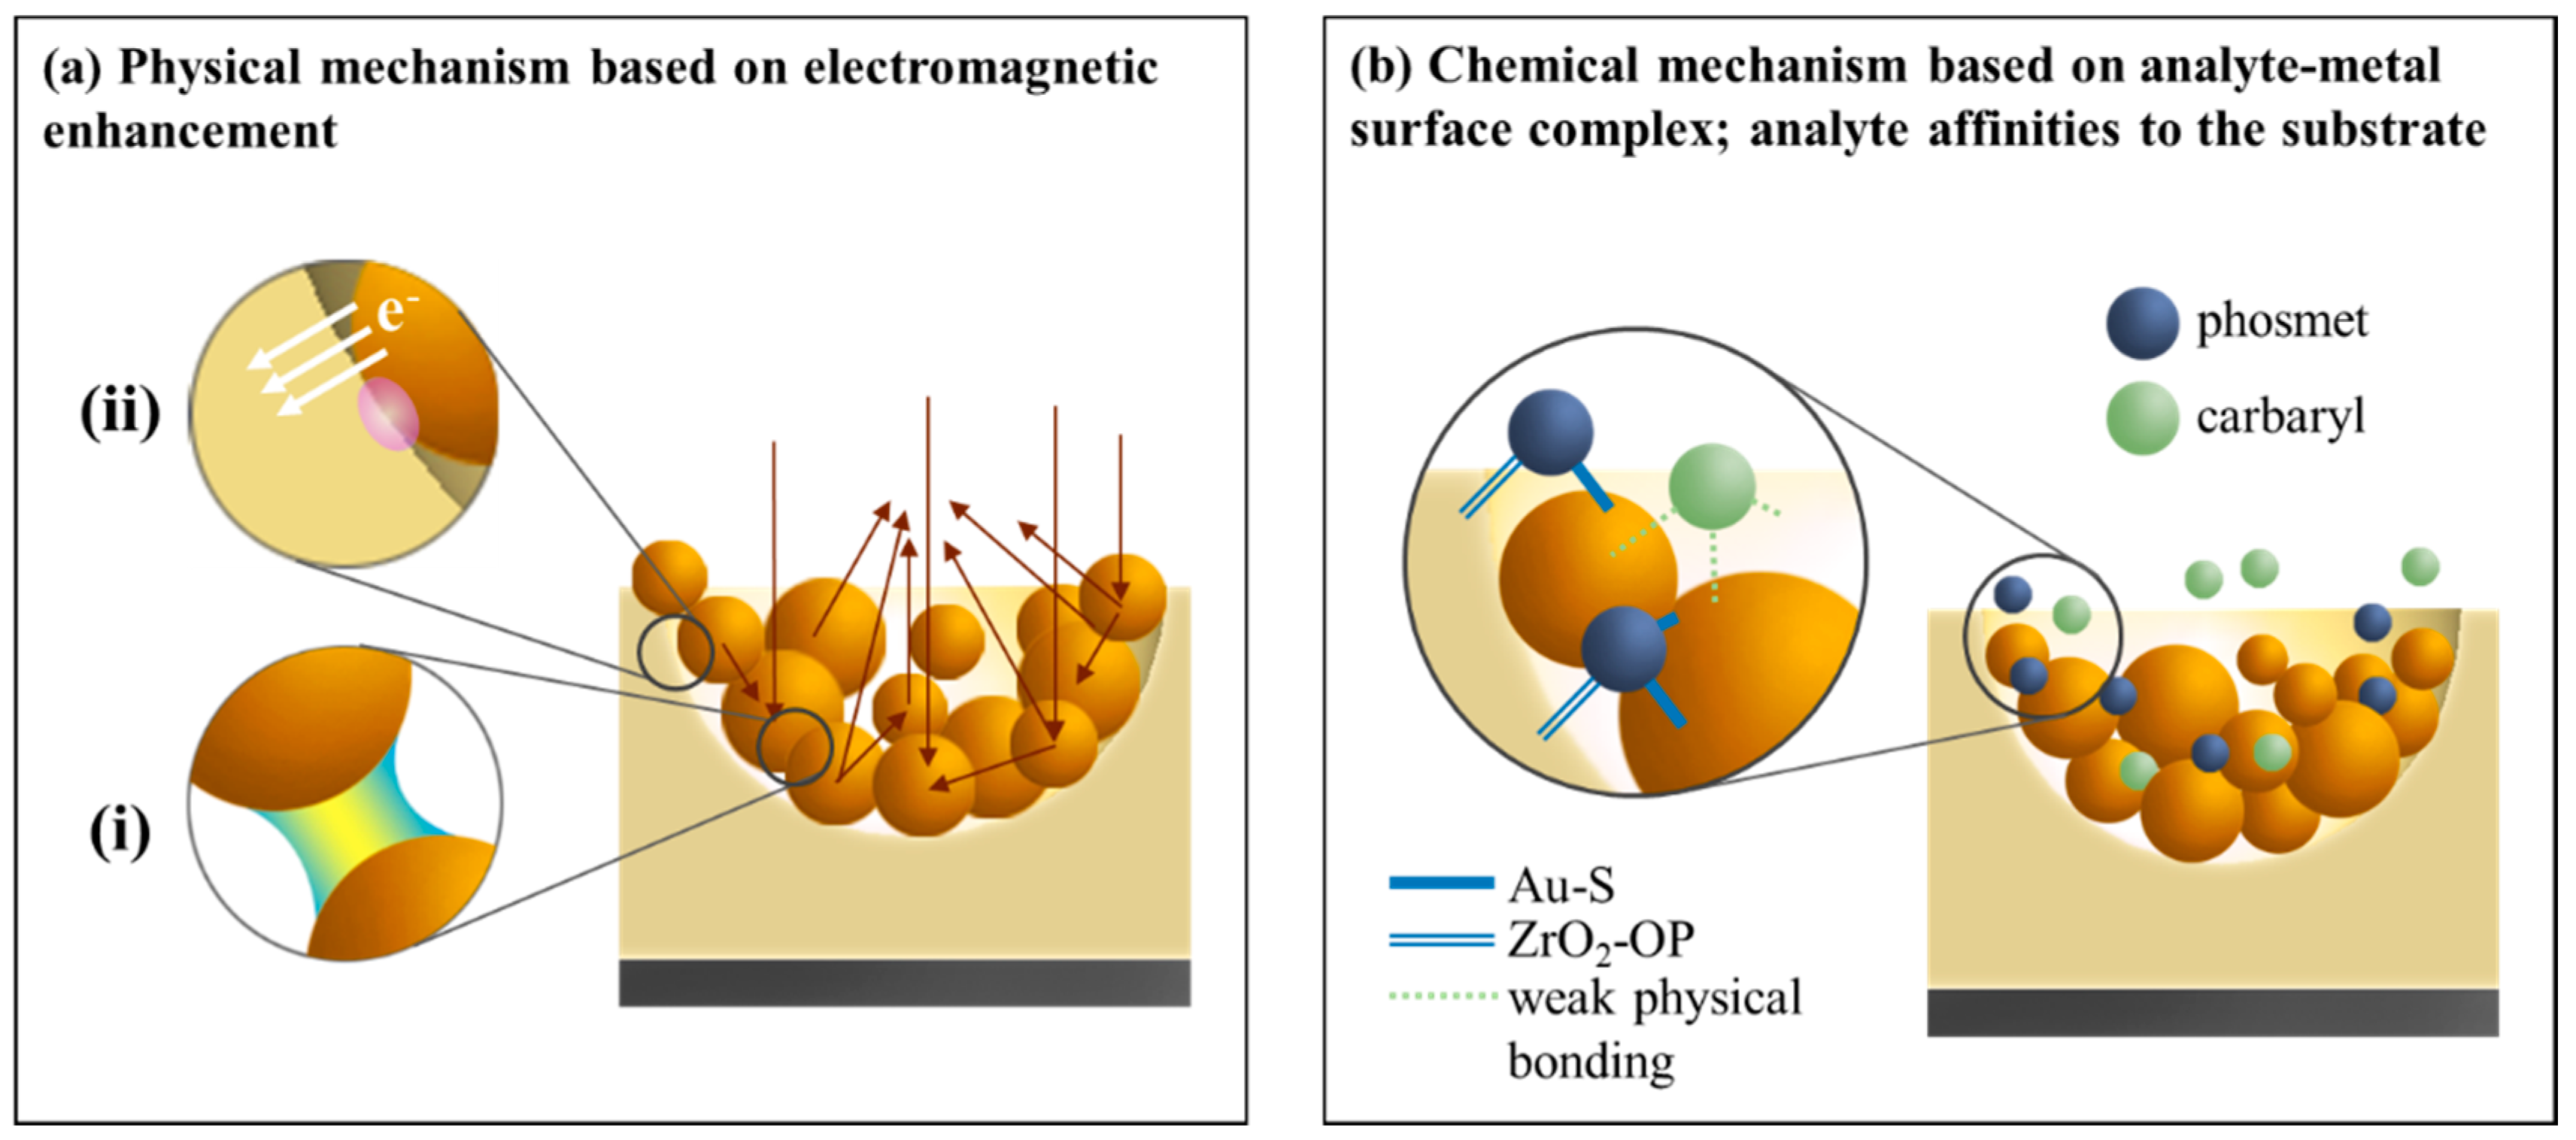
Physical and chemical enhancement mechanisms involved in the effect of SERS imparted by Au NPs/pZrO2 are shown in Figure 6. In Figure 6a, the physical mechanism is largely dependent on the substrate material and geometry. In terms of substrate geometry, two aspects can be considered: Firstly, since Au NPs follow an arrangement according to the concave shape of the pore, under a vertical incident laser, Au NPs may direct the light to converge at the center of the pores, as indicated by the arrows in Figure 6a. More hot spots for SERS are generated from the overlaps of electric field and brought by the negative curvature arrangement of Au NPs. Second, the concave pore of ZrO2 provides an increase of surface area for Au NPs to be adsorbed on, compared to that when Au NPs are on a flat surface with the same projected horizontal area.
Looking into a smaller scale, Figure 6a(i) shows the dominant electromagnetic mechanism provided by the hot spots formed in the gaps between Au NPs as a result of LSPR coupling. In addition, Figure 6a(ii) shows the transfer of charges between Au NP and ZrO2, a low Schottky barrier between these components eases the charge transfer, resulting in an effect of SERS. This transfer results to concentrating the plasmon-induced electromagnetic field at the metal/semiconductor interface, which provides enhancement not only in generating effective carriers in the plasmonic component but also induces further charge transfer, resulting in an overall enhancement in the electric field and SERS signals.
On the other hand, the chemical mechanism is largely analyte-dependent. In Figure 6b, both Phosmet and Carbaryl can be adsorbed onto Au NPs (x)/pZrO2 in different degrees, while an analyte-substrate complex is formed that modifies the polarizability of as-adsorbed molecules. However, since Phosmet possesses a higher affinity to the substrate, the tendency of forming a strong complex with the substrate would be higher than that of Carbaryl, which could only form weaker complexes and lead to be even unable to modify the electronic structure of Carbaryl. Therefore, this as well explains the fact that Au NPs (x)/pZrO2 is selective towards Phosmet.
Both mechanisms described in Figure 6a,b simultaneously function when the substrate system is subjected to Raman spectroscopy, as a consequence, the combined effects from both mechanisms bring a synergistic effect with collective SERS amplification that provides a strengthened capability of Au NPs (x)/pZrO2 for the application of trace detection.

4. Conclusions

A substrate specially designed for collective SERS amplification by taking into consideration substrate geometry and materials, as well as its interactions with target analytes, was presented in this study. Au NPs were deposited onto a concave-pore ZrO2 array, and the optimized substrate Au NPs (3.0)/pZrO2 provided an EF of 7.0 × 10⁷, which was competent to detect trace amounts of Phosmet and Carbaryl at a detection limit of 10−6 M. Moreover, multiplex detection of both pesticides was demonstrated as well but the substrate exhibited a higher selectivity towards Phosmet, due to its functional groups having a strong affinity towards both Au and ZrO2 components in/on the substrate. The combined effects of the physical mechanisms involving the geometry of the substrate of Au NPs arranged in concave ZrO2 pores, Au-Au hot spots, and Au-ZrO2 charge transfers, and chemical mechanisms associated with the interactions between the pesticide molecules and the substrate, were thus proposed to be the contributing factors behind the collective SERS amplification provided by the substrate.

Supplementary Materials

The following are available online at https://www.mdpi.com/2079-4991/9/5/664/s1, Figure S1: SEM images of (a) polystyrene nanoparticles and (b) porous ZrO2 arranged in a monolayer, and the (c,d) corresponding size distribution histograms, Figure S2: SERS intensity plots taken from 6 positions at 3 different peaks (left) and the corresponding full-range spectra (right) of 10−3 M R6G, Figure S3: SERS spectra of R6G on different substrates (bare pZrO2, Au 3.0 on Si, and Au NPs (3.0)/pZrO2) show that each individual component exhibit SERS activity, inset shows the highlighted region in the plot wherein there is an observed shift in peaks, Table S1: Major characteristic peaks of phosmet and carbaryl and their corresponding vibrational modes [19,28,30,31,32,33].

Author Contributions

Investigation and writing, J.S.; Conceptualization, design, and methodology, J.S., J.-D.L., H.L., B.H.L. and W.-e.F.; supervision, J.-D.L and B.H.L.; review and editing, J.-D.L.; funding acquisition, J.-D.L. and H.L.

Funding

This work was financially supported by the Headquarters of University Advancement at National Cheng Kung University and the Ministry of Education, Taiwan, under grant number D108-F2302.

Conflicts of Interest

The authors declare no conflict of interest.

References

  1. Lutz, B.; Dentinger, C.; Sun, L.; Nguyen, L.; Zhang, J.; Chmura, A.; Allen, A.; Chan, S.; Knudsen, B. Raman nanoparticle probes for antibody-based protein detection in tissues. J. Histochem. Cytochem. 2008, 56, 371–379. [Google Scholar] [CrossRef]
  2. Deconinck, E.; Sacré, P.Y.; Courselle, P.; De Beer, J.O. Chromatography in the detection and characterization of illegal pharmaceutical preparations. J. Chromatogr. Sci. 2013, 51, 791–806. [Google Scholar] [CrossRef]
  3. Chambers, M.; Maclean, B.; Burke, R. A cross-platform toolkit for mass spectrometry and proteomics. Nat. Biotechnol. 2012, 30, 918–920. [Google Scholar] [CrossRef] [Green Version]
  4. Liu, B.; Zhou, P.; Liu, X.; Sun, X.; Li, H.; Lin, M. Detection of Pesticides in Fruits by Surface-Enhanced Raman Spectroscopy Coupled with Gold Nanostructures. Food Bioprocess Technol. 2013, 6, 710–718. [Google Scholar] [CrossRef]
  5. Shiohara, A.; Wang, Y.; Liz-Marzán, L.M. Recent approaches toward creation of hot spots for SERS detection. J. Photochem. Photobiol. C Photochem. Rev. 2014, 21, 2–25. [Google Scholar] [CrossRef]
  6. Granger, J.H.; Granger, M.C.; Firpo, M.A.; Mulvihill, S.J.; Porter, M.D. Toward development of a surface-enhanced Raman scattering (SERS)-based cancer diagnostic immunoassay panel. Analyst 2013, 138, 410–416. [Google Scholar] [CrossRef]
  7. Kneipp, K.; Kneipp, H.; Kneipp, J. Surface-enhanced raman scattering in local optical fields of silver and gold nanoaggregates—From single-molecule raman spectroscopy to ultrasensitive probing in live cells. Acc. Chem. Res. 2006, 39, 443–450. [Google Scholar] [CrossRef]
  8. Guerrini, L.; Graham, D. Molecularly-mediated assemblies of plasmonic nanoparticles for Surface-Enhanced Raman Spectroscopy applications. Chem. Soc. Rev. 2012, 41, 7085–7107. [Google Scholar] [CrossRef] [PubMed]
  9. Tarakeshwar, P.; Finkelstein-Shapiro, D.; Hurst, S.J.; Rajh, T.; Mujica, V. Surface-enhanced Raman scattering on semiconducting oxide nanoparticles: Oxide nature, size, solvent, and pH effects. J. Phys. Chem. C 2011, 115, 8994–9004. [Google Scholar] [CrossRef]
  10. Knight, M.W.; Wu, Y.; Lassiter, J.B.; Nordlander, P.; Halas, N.J. Substrates Matter Influence of an Adjacent Dielectric on an Individual Plasmonic Nanoparticle. Nano Lett. 2009, 9, 2188–2192. [Google Scholar] [CrossRef] [PubMed]
  11. Wu, K.; Chen, J.; Mcbride, J.R.; Lian, T. Efficient hot-electron transfer by a plasmon-induced interfacial charge-transfer transition. Science 2015, 349, 632–635. [Google Scholar] [CrossRef]
  12. Li, X.; Jia, C.; Ma, B.; Wang, W.; Fang, Z.; Zhang, G.; Guo, X. Substrate-induced interfacial plasmonics for photovoltaic conversion. Sci. Rep. 2015, 5, 1–10. [Google Scholar] [CrossRef] [PubMed]
  13. Jia, C.; Li, X.; Xin, N.; Gong, Y.; Guan, J.; Meng, L.; Meng, S.; Guo, X. Interface-Engineered Plasmonics in Metal/Semiconductor Heterostructures. Adv. Energy Mater. 2016, 6, 1–11. [Google Scholar] [CrossRef]
  14. Luo, S.C.; Sivashanmugan, K.; Liao, J.D.; Yao, C.K.; Peng, H.C. Nanofabricated SERS-active substrates for single-molecule to virus detection in vitro: A review. Biosens. Bioelectron. 2014, 61, 232–240. [Google Scholar] [CrossRef]
  15. Wolosiuk, A.; Tognalli, G.; Mart, E.D.; Granada, M.; Fuertes, M.C.; Troiani, H.; Bilmes, S.A.; Fainstein, A.; Soler-illia, G.J.A.A. Silver Nanoparticle-Mesoporous Oxide Nanocomposite Thin Films: A Platform for Spatially Homogeneous SERS-Active Substrates with Enhanced Stability. ACS Appl. Mater. Interfaces 2014, 6, 5263–5272. [Google Scholar] [CrossRef] [PubMed]
  16. Pisarek, M.; Roguska, A.; Kudelski, A.; Holdynski, M.; Janik-Czachor, M.; Hnida, K.; Sulka, G.D. Ag/ZrO2-NT/Zr hybrid material: A new platform for SERS measurements. Vib. Spectrosc. 2014, 71, 85–90. [Google Scholar] [CrossRef]
  17. Liu, G.; Lin, Y. Electrochemical sensor for organophosphate pesticides and nerve agents using zirconia nanoparticles as selective sorbents. Anal. Chem. 2005, 77, 5894–5901. [Google Scholar] [CrossRef]
  18. Zhang, D.; Liang, P.; Yu, Z.; Huang, J.; Ni, D.; Shu, H.; Dong, Q.-M. The effect of solvent environment toward optimization of SERS sensors for pesticides detection from chemical enhancement aspects. Sens. Actuators B Chem. 2018, 256, 721–728. [Google Scholar] [CrossRef]
  19. Luo, H.; Huang, Y.; Lai, K.; Rasco, B.A.; Fan, Y. Surface-enhanced Raman spectroscopy coupled with gold nanoparticles for rapid detection of phosmet and thiabendazole residues in apples. Food Control 2016, 68, 229–235. [Google Scholar] [CrossRef]
  20. Bassi, B.; Albini, B.; D’Agostino, A.; Dacarro, G.; Pallavicini, P.; Galinetto, P.; Taglietti, A. Robust, reproducible, recyclable SERS substrates: Monolayers of gold nanostars grafted on glass and coated with thin silica layer. Nanotechnology 2019, 30, 025302. [Google Scholar] [CrossRef]
  21. Lee, M.; Oh, K.; Choi, H.-K.; Lee, S.G.; Youn, H.J.; Lee, H.K.; Jeong, D.H. Subnanomolar Sensitivity of Filter Paper-Based SERS Sensor for Pesticide Detection by Hydrophobicity Change of Paper Surface. ACS Sens. 2018, 3, 151–159. [Google Scholar] [CrossRef] [PubMed]
  22. Guselnikova, O.; Postnikov, P.; Elashnikov, R.; Miliutina, E.; Svorcik, V.; Lyutakov, O. Metal-organic framework (MOF-5) coated SERS active gold gratings: A platform for the selective detection of organic contaminants in soil. Anal. Chim. Acta 2019. [Google Scholar] [CrossRef]
  23. Gingery, D.; Bühlmann, P. Formation of gold nanoparticles on multiwalled carbon nanotubes by thermal evaporation. Carbon 2008, 46, 1966–1972. [Google Scholar] [CrossRef]
  24. Keyes, T.E.; Forster, R.J. Spectroelectrochemistry. In Handbook of Electrochemistry; Zoski, C.G., Ed.; Elsevier: Amsterdam, The Netherlands, 2007; pp. 591–635. [Google Scholar]
  25. Kahraman, M.; Wachsmann-Hogiu, S. Label-free and direct protein detection on 3D plasmonic nanovoid structures using surface-enhanced Raman scattering. Anal. Chim. Acta 2015, 856, 74–81. [Google Scholar] [CrossRef] [PubMed]
  26. Sui, C.; Wang, K.; Wang, S.; Ren, J.; Bai, X.; Bai, J. SERS activity with tenfold detection limit optimization on a type of nanoporous AAO-based complex multilayer substrate. Nanoscale 2016, 8, 5920–5927. [Google Scholar] [CrossRef]
  27. Grochowska, K.; Siuzdak, K.; Sokołowski, M.; Karczewski, J.; Szkoda, M.; Śliwiński, G. Properties of ordered titanium templates covered with Au thin films for SERS applications. Appl. Surf. Sci. 2016, 388, 716–722. [Google Scholar] [CrossRef]
  28. Lee, H.; Liao, J.; Sivashanmugan, K.; Liu, B.H.; Chen, C.; Chen, G.D.; Juang, Y. Gold Nanoparticle-Coated ZrO2-Nanofiber Surface as a SERS-Active Substrate for Trace Detection of Pesticide Residue. Nanomaterials 2018, 8, 402. [Google Scholar] [CrossRef]
  29. Singh, D.K.; Ganbold, E.O.; Cho, E.M.; Lee, C.M.; Yang, S.I.; Joo, S.W. Tautomerism of a thiabendazole fungicide on Ag and Au nanoparticles investigated by Raman spectroscopy and density functional theory calculations. J. Mol. Struct. 2013, 1049, 464–472. [Google Scholar] [CrossRef]
  30. Kudelski, A.; Pisarek, M.; Roguska, A.; Hoałdýski, M.; Janik-Czachor, M. Surface-enhanced Raman scattering investigations on silver nanoparticles deposited on alumina and titania nanotubes: Influence of the substrate material on surface-enhanced Raman scattering activity of Ag nanoparticles. J. Raman Spectrosc. 2012, 43, 1360–1366. [Google Scholar] [CrossRef]
  31. Fan, Y.; Lai, K.; Rasco, B.A.; Huang, Y. Analyses of phosmet residues in apples with surface-enhanced Raman spectroscopy. Food Control 2014, 37, 153–157. [Google Scholar] [CrossRef]
  32. Liu, Y.; He, B.; Zhang, Y.; Wang, H.; Ye, B. Detection of Phosmet Residues on Navel Orange Skin by Surface-enhanced Raman Spectroscopy. Intell. Autom. Soft Comput. 2015, 21, 423–432. [Google Scholar] [CrossRef]
  33. Fan, Y.; Lai, K.; Rasco, B.A.; Huang, Y. Determination of carbaryl pesticide in Fuji apples using surface-enhanced Raman spectroscopy coupled with multivariate analysis. LWT-Food Sci. Technol. 2015, 60, 352–357. [Google Scholar] [CrossRef]
  34. Altun, A.O.; Bond, T.; Pronk, W.; Park, H.G. Sensitive Detection of Competitive Molecular Adsorption by Surface-Enhanced Raman Spectroscopy. Langmuir 2017, 33, 6999–7006. [Google Scholar] [CrossRef]
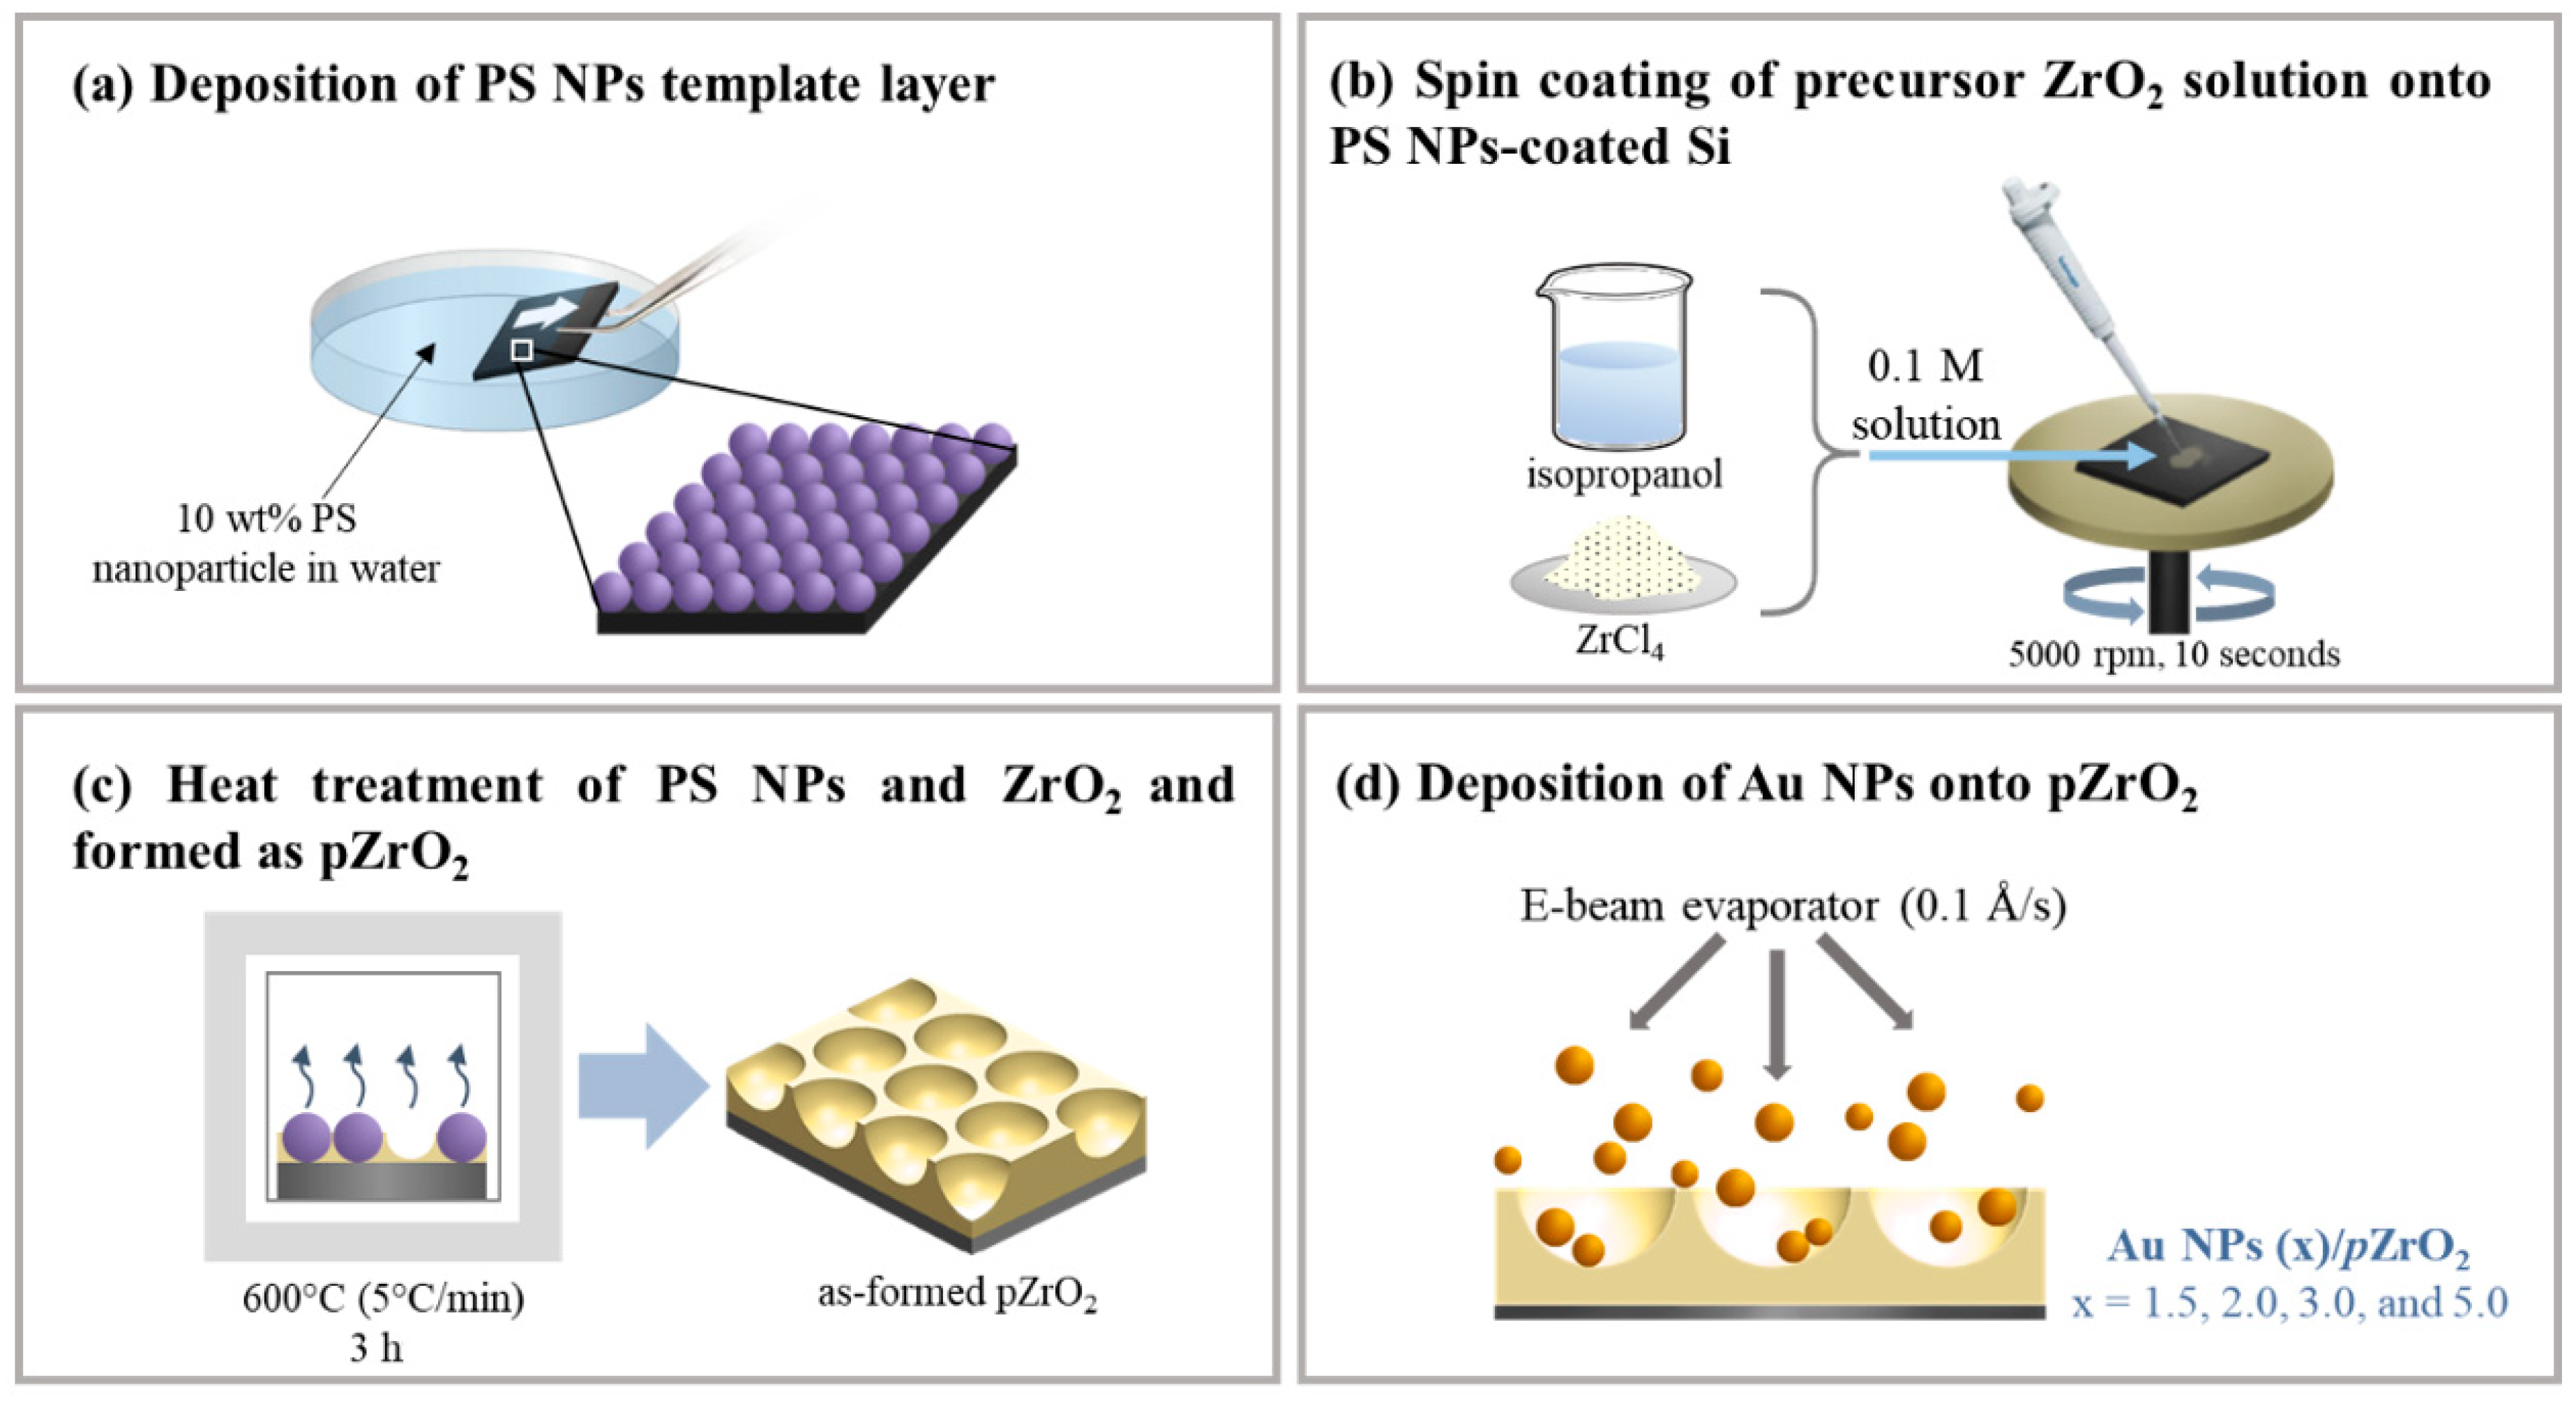
Figure 1. Schematic illustration of the fabrication of the Au NPs/pZrO2 surface-enhanced Raman Scattering (SERS) substrates: (a) Formation of the pore template through deposition of monolayered polystyrene nanoparticles onto the Si substrate; (b) deposition of a precursor solution which is a mixture of isopropanol and ZrCl4 through spin coating; (c) simultaneous removal of PS NPs and calcination of ZrO2 through heat treatment; (d) thermal evaporation of Au nanoparticles onto the already-made pZrO2 substrate.
Nanomaterials 09 00664 g001
Figure 2. Surface morphologies of the fabricated Au NPs/pZrO2: (a) SEM images from left to right—pZrO2, Au NPs (1.5)/pZrO2, Au NPs (2.0)/pZrO2, Au NPs (3.0)/pZrO2, and Au NPs (5.0)/pZrO2 shows the morphological evolution of the substrate in terms of Au NP deposition thickness; (b) 2D AFM image shows the estimated sizes of the Au NPs; (c) 3D AFM image of Au NPs (3.0)/pZrO2 clearly shows the presence of porous cavities as formed by the ZrO2; (d) Cross-sectional profile of the structure corresponding to the x-y line in Figure 2c confirms the structure of the porous ZrO2.
Nanomaterials 09 00664 g002
Figure 3. (a) SERS spectra of 10−3 M R6G measured at the respective excitation wavelengths of 633 and 785 nm on Au NPs/pZrO2 SERS substrates and normal Raman on plain Si; indicated as shown is the most intense peak which is at 1361 cm−1; (b) Relative Raman intensities of 10−3 M R6G at the 1361 cm−1 peak taken using the Au NPs (x)/pZrO2 samples at 633 and 785 nm excitation wavelengths show the effects of varying the laser wavelengths and Au NP deposition thickness; (c) SERS spectra of varying concentrations of R6G on Au 3.0/pZrO2 showing a relative decrease in the peak intensities with decreasing concentration; (d) Calibration plot produced by the logarithmic linear trend between the 1361 cm−1 peak intensity and concentration.
Nanomaterials 09 00664 g003
Figure 4. SERS spectra of standard solutions of (a) phosmet and (b) carbaryl at varying concentrations on Au NPs (3.0)/pZrO2.
Nanomaterials 09 00664 g004
Figure 5. (a) Average SERS spectra of equimolar mixtures of phosmet and carbaryl at varying concentrations show that Au NPs (3.0)/pZrO2 is capable of multiplex detection; (b) Plot of the % reduction (from standard solution to mixture condition) in the peak intensity ratios obtained from the two major characteristic peaks of each pesticide.
Nanomaterials 09 00664 g005
Figure 6. Proposed mechanisms that provide the overall SERS amplification: (a) Physical mechanism of the Au/pZrO2 substrate showing two major contributors: (i) Electromagnetic enhancement brought by the formation of hot spots between Au NPs. Additionally, the arrows indicate the convergent scattering of light with respect to the arrangement of Au NPs in a concave cavity, and (ii) interfacial charge transfer between Au NPs and ZrO2, and (b) Chemical mechanism owing to the formation of analyte-substrate complexes, related to the affinities of the analyte molecules to the substrate.
Nanomaterials 09 00664 g006