Abstract
Nickel and nickel oxide are widely used as heterogeneous catalysts in various processes involving the hydrogenation or reduction of organic compounds, and also as excellent methanation catalysts in the hydrogenation of CO2. As heterogeneous catalysis is a surface-dependent process, nickel compounds in the form of microparticles (MPs), and particularly nanoparticles (NPs), improve the catalytic activity of Ni-based catalysts due to their high specific surface area. Solvothermal synthesis, which has so far been neglected for the synthesis of Ni-based methanation catalysts, was used in this study to synthesize nickel and nickel oxide MPs and NPs with a narrow size distribution. Solvothermal synthesis allows for the control of both the chemical composition of the resulting Ni catalysts and their physical structure by simply changing the reaction conditions (solvent, temperature, or concentration of reactants). Only non-toxic substances were used for synthesis in this study, meaning that the whole synthesis process can be described as environmentally friendly. Solvothermally prepared Ni compounds were subsequently transformed into nickel oxide by means of high-temperature decomposition, and all of the prepared Ni-based compounds were tested as catalysts for CO2 methanation. The best catalysts prepared in this study exhibited a CO2 conversion rate of nearly 95% and a selectivity for methane close to 100%, which represent thermodynamic limits for this reaction at the used temperature. These results are commonly achieved with much more complex catalytic composites containing precious metals, while here we worked with pure nickel and its oxides, in the form of micro- or nanoparticles, only.
1. Introduction
Nickel and its compounds are among the most popular substances in heterogeneous catalysis [1,2]. As reflected in the thousands of studies and patents devoted to developing and studying various forms of nickel catalysts [3], up to 10% of the nickel produced in the world is used in the manufacturing of catalysts. The main field of utilization of nickel and nickel-based compounds in catalysis relates to various hydrogenation reactions [4,5].
One of the most popular and oldest catalysts based on pure nickel is Raney nickel, obtained in 1925 by melting nickel and aluminum together at 1200 °C [6,7]. This catalyst is mainly used for the hydrogenation and reduction of unsaturated organic compounds with hydrogen, but also to accelerate oxidation processes.
Nickel oxide (NiO) has high catalytic activity and is used as a catalyst in reactions related to the conversion of electrical energy to chemical energy (batteries) [8], the hydrogenation of compounds in the food industry [9], the polymerization of phenolic compounds [10], and the decomposition of toxic ozone in the environment [11]. It is also tested for the production of synthetic gas (methane) [12], the synthesis of carbon nanotubes, and natural gas purification processes.
Nickel hydroxide Ni(OH)2 is an unstable green powder that decomposes in a temperature range of 230–360 °C to NiO [13], meaning that it is not a usable compound for catalysis in high-temperature reactions. However, the decomposition product of this compound is NiO, which as stated previously is a very promising catalyst. Nickel metahydroxide NiO(OH) [14] is a black powder that decomposes into nickel oxide when heated to a temperature of about 600 °C. However, many non-stochiometric metahydroxides have been discovered. For instance, the non-stoichiometric nickel metahydroxide Ni(OH)2(NiOOH)0.167)0.857 prepared in our study was a yellow substance that decomposed to nickel oxide at a temperature of only 350–360 °C.
There are a wide variety of methods available for the synthesis of MPs and NPs of nickel compounds: the thermal decomposition of precursors prepared by means of the chemical precipitation method [15,16], sonochemical synthesis [17,18], chemical vapor deposition [19,20], biosynthesis [21,22], the sol–gel method [23,24], etc. Unfortunately, many published preparation methods are unsuitable for industrial production due to a lack of scalability.
All nickel compounds used in the current study were obtained using solvothermal synthesis based on the hydrolysis (and reduction) of soluble nickel compounds [25,26,27,28,29,30,31]. Solvothermal reactions are interesting in their similarity to actual production processes in industry, since they are carried out in autoclaves (special containers that can withstand high pressure). Moreover, these reactions are relatively simple to perform and provide good and reproducible results in producing highly dispersed micro- and nanoparticles of inorganic substances. Some disadvantages of solvothermal synthesis include its duration and the need for high temperature and pressure during the reaction, which can easily be addressed by using an autoclave reactor. Meanwhile, there is minimal to no need to use toxic or environmentally hazardous solvents and other chemicals in the process, meaning that solvothermal methods can, in many cases, be labeled as environmentally friendly.
The modified Fischer–Tropsch [32,33] reaction involves the conversion of carbon dioxide via hydrogenation to form hydrocarbons and their derivatives. In the case of the preferential formation of CH4, the process is called methanation and proceeds according to the classical Sabatier scheme [34,35,36]:
CO2 + 4H2 → CH4 + 2H2O
Due to the high thermodynamic stability of CO2, the methanation process is complicated to implement in practice. A high temperature and effective catalysts are needed for its application on an industrial scale to remove excess carbon dioxide from the atmosphere and obtain valuable energy-rich compounds, e.g., methane.
Nickel compounds are promising catalysts for the methanation reaction, with the obtained conversion and methane selectivity reaching thermodynamic limits [37,38,39]. The main goal of this study, and the basis of its novelty, is the verification of the usability of the solvothermal reaction for producing effective Ni-based methanation catalysts, as the solvothermal method is easily scalable from laboratory experiments up to industrial production. Additionally, using only nickel salt, sodium acetate, ethylene glycol, and ethanol as solvents allows this method to be labeled as environmentally friendly in comparison with traditionally used precipitation methods. Based on the selection of the source compound of nickel and the solvent for the reaction itself, a series of compounds, including metallic Ni, Ni hydroxide, Ni metahydroxide, and Ni oxide, were prepared and subsequently tested as catalysts for CO2 methanation. The study’s second goal was to explore the influence of the thermal treatment of the primary prepared Ni-based compounds on their catalytic efficiency.
2. Experimental
2.1. Materials
Ni(Cl)2·6H2O (98.5%), ethylene glycol (EG, 99.98%), ethanol (Et, 95%), and CH3COONa·3H2O (NaAc·3H2O, 99.8%) were obtained from Lach-Ner, Neratovice, Czech Republic. Silica gel (SG) was obtained from Penta Chemicals Unlimited, Prague, Czech Republic, while polyethylene glycol 1500 (PEG 1500) was purchased from Fluka Chemika (Buchs, Switzerland). Deionized water (DW, 18 MΩ·cm, Millipore, Burlington, MA, USA) was used to prepare all aqueous solutions.
2.2. Catalyst Preparation
The precatalysts (Ni-based compounds ranging from pure Ni to Ni metahydroxides) were prepared using a solvothermal method similar to that described in previous publications [40,41,42]. The scheme of preparation used was as follows: NiCl2·6H2O (2.38 g, 0.01 mol) was dissolved in 80 mL of EG (or 40 mL EG + 40 mL Et) in a 150 mL beaker at room temperature, followed by the addition of CH3COONa·3H2O (5.96 or 11.92 g). After 10 min of stirring (700 rpm), PEG 1500 (3 g) was added, and the mixture was stirred for 30 min. Finally, the mixture was placed in a 200 mL Teflon autoclave and left to react at 200 °C for 8 h. Products of this primary preparation step were separated via centrifugation and dried (vacuum, 0.1 bar, 60 °C/8 h). After this step, the final oxides for catalytic testing were obtained by means of the thermal decomposition of the prepared precursors at elevated temperature in the laboratory furnace under an air atmosphere. The specific conditions for preparing all tested samples are presented in Table 1.

Table 1.
Summary table of synthesis of Ni-based samples.
2.3. Instruments and Methods of Characterization
Thermogravimetric analysis was conducted with TG/DSC SDT 650 (TA Instruments, New Castle, DE, USA). The crystal structure and chemical composition of the catalysts were studied by means of powder X-ray diffraction using an X’pert Pro (Malvern PANalytical, Malvern, UK) device. XRD analyses were conducted using a CoKa-radiation source in the 5–105° 2 Theta range and a total measurement time of 128 min/sample. The reduction process of the NiO samples was monitored using the same X’pert Pro device with a mounted XRK 900 reaction chamber (Anton Paar, GmbH, Graz, Austria): approximately 80 mg of the sample was placed in the sample holder, heated to 50 °C, and diffraction was measured for 10 min. Subsequently, the average diffraction over 10 min was measured at 25 °C intervals as temperature increased until the material was completely reduced to nickel metal. A measurement time of 10 min per scan was selected to allow for the detection of relatively rapid structural and phase changes. Additionally, the angular measurement range was narrowed to 5 to 80° 2 Theta to improve the signal-to-noise ratio. The reduction was carried out in a hydrogen atmosphere (purity 99.9999% H2) at atmospheric pressure with a flow rate of 45 mL/min.
Surface area, temperature-programmed H2 reduction (TPR-H2), and temperature-programmed CO2 desorption (TPD-CO2) characterizations were performed on a 3-flex Micromeritics device from Micromeritics (Norcross, GA, USA). All analyses were carried out in a temperature range of 25–600 °C with a heating rate of 10 °C/min. Determination of PSD was conducted using the BJH-A model with corrections via the Kruk–Jaroniec–Sayari method with data obtained from the adsorption part of the measured isotherms.
The SEM images were obtained using a Scios 2 Dual Beam microscope at an accelerating voltage of 5 kV and Phenom Pro X (both from Thermo Fisher SCIENTIFIC, Waltham, MA, USA), while the TEM images were obtained using a Tecnai G2 F20 microscope (FEI Technologies, Hillsboro, OR, USA) with an Eagle 4K CCD camera (FEI Technologies, Hillsboro, OR, USA) and TEM JEOL 2100, 200 kV (JEOL, Peabody, MA, USA). Surface elemental mapping of the spent catalysts was conducted using the EDS method in combination with high-resolution transmission electron microscopy (HRTEM) on an FEI TITAN 60–300 kV microscope (Thermo Fisher Scientific Inc., Waltham, MA, USA).
The sample’s X-ray photoelectron spectra (XPS) were measured using a modified ESCA 3 MkII multi-technique spectrometer equipped with a hemispherical electron analyzer operated in fixed transmission mode. Al Kα radiation was used for electron excitation. The binding energy scale was calibrated using the Au 4f7/2 (84.0 eV) and Cu 2p3/2 (932.6 eV) photoemission lines, and the pressure in the XPS analysis chamber during spectrum acquisition was 6 × 10⁻⁹ mbar. The samples were spread on an aluminum surface, and the spectra were collected at a takeoff angle of 45° in relation to the macroscopic surface’s normal. High-resolution spectra of Ni 2p, Si 2p, O 1s, and C 1s photoelectrons were measured, and the spectra of Ni 2p3/2 photoelectrons were curve fitted after subtraction of the Shirley background [43] using the Gaussian−Lorentzian line shape and nonlinear least-squares algorithms (CasaXPS ver. 2.3.15 software [44]). Binding energies were obtained with reference to the C 1s peak of adventitious carbon at 285.0 eV, providing 103.4 eV for the Si 2p peak. The elemental concentrations were quantified by correcting the photoelectron peak intensities for their cross sections [45] and the analyzer transmission function.
Raman spectra were recorded using a Raman microscope DRX (Thermo Fisher Scientific Inc., Waltham, MA, USA) with an excitation laser wavelength of 780 nm and an estimated spot size of 3.1 μm. For the experiments, a 400 line/mm grating with a resolution of 5.0 cm−1 FWHM was used, and the spectral dispersion was 2 cm−1 per CCD pixel element. Laser power was chosen for each sample individually according to its photosensitivity (4.5–10.0 mW). Each spectrum was averaged from 250 scans, with the exposure time for one spectrum being 2 s.
The catalytic reactions were studied using the flow reactor Micro EFFI PID from PID Eng&Tech (Madrid, Spain), with the reaction tube being 4 mm in diameter. The analysis of reaction products was performed using gas chromatography with an Agilent 7890B equipped with a TCD detector and a mass spectrometer, the Agilent 5977B (Santa Clara, CA, USA). The gas reaction mixture and other conditions of the conducted reactions are stated in the next section for the individual studied cases.
2.4. Catalytic Performance
2.4.1. Evaluation of Catalysis Efficiency
The conversion of CO2 (, Equation (1)), selectivity for CO (, Equation (2)), selectivity for CH4 (, Equation (3)), reaction yield of CH4 (, Equation (4)), and space–time yield (STYCH4, Equation (5)) were calculated for each catalyst. STYCH4 indicates the amount of methane produced per unit weight of the catalyst.
FCO2 is the molar flow rate of CO2 [mmol·h−1] and mcat is the weight of the catalyst [g].
2.4.2. Catalytic Tests—Temperature Ramp
The catalytic mixture for this test experiment was obtained by mixing 100 mg of NiO and 150 mg of silica. The catalytic test was conducted with activation at 300 °C for 2 h at 1 bar of H2 atmosphere, and the temperature ramp used started at 350 °C and finished at 475 °C with 25 °C intervals. The total flow of reaction gases was 66 mL/min at a ratio of H2 to CO2 of 4:1 (CO2, 6 mL/min, H2, 24 mL/min, He, 36 mL/min, equal to 55% of the gaseous mixture). The reaction pressure was adjusted to 30 bar. The reaction time for each temperature step was 3 h after reaching the desired temperature.
2.4.3. Catalysis Conditions for Stability Tests
The main study of the catalytic performance and stability of the prepared catalysts was conducted under the following conditions:
- (1)
- The amount of catalyst samples used was 100 mg NiO/Ni/Ni(OH)x + 150 mg SG;
- (2)
- Activation of the catalyst was performed at 300 °C, 1 bar, for 2 h using a pure H2 atmosphere;
- (3)
- Catalysis was conducted at 450 °C, 30 bar, for 21 h, but two samples (Ni(a) and NiO600(b)) were also tested for 42 h; CO2 flow was adjusted to 6 mL/min, H2 flow was adjusted to 24 mL/min (ratio of H2 and CO2 4:1), that of He was adjusted 36 mL/min (55% of the gaseous mixture).
However, in all presented graphs from stability catalytic experiments, the activation time is not included in the overall catalytic time, as the initial moment of catalysis (t = 0 h) was taken as the moment at the end of activation when reaching a temperature of 450 °C.
3. Results and Discussion
3.1. TG/DSC Study of Ni-Based Precursors
A sample of the precursor Ni(a) was tested in the temperature range 40–1200 °C (Figure 1). As can be seen from the DSC graph, the phase transformation occurred once, at about 550 °C. The TG graph demonstrates that the sample grew in weight by about 27% compared to its initial mass at this temperature. XRD confirmed that a pure Ni precursor was initially prepared by means of the solvothermal method, and it was transformed into NiO due to oxidation at elevated temperatures. The obtained data corresponds to the stoichiometric equation of the thermal oxidation of nickel:
Ni+1/2O2 = NiO (M(NiO)/M(Ni) = 74.7 × 100%/58.7 = 27.25%)
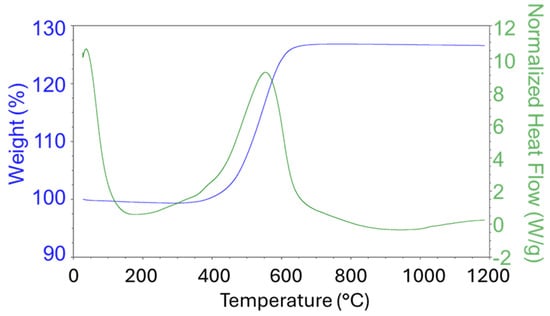
Figure 1.
TG/DSC graphs of Ni(a) measured under an oxidation atmosphere (air).
Based on this measurement, two nickel oxide precatalysts were prepared from the Ni(a) precursor at 600 and 1000 °C (NiO600(a) and NiO1000(a)).
A sample of the Ni(OH)2(b) precursor was studied at the temperature range 40–1200 °C (Figure 2). As can be seen from the DSC graph, the phase transformation occurred at about 340 °C. The TG graph demonstrates that the sample lost about 20% of its initial mass. XRD confirmed that α-Ni(OH)2 was initially prepared by means of the solvothermal method, which was transformed into NiO at elevated temperatures. The analysis data corresponds to the stoichiometric equation of the thermal decomposition of nickel hydroxide:
Ni(OH)2 = NiO+H2O (M(H2O)/M(Ni(OH)2) = 18 × 100%/92.7 = 19.41%)
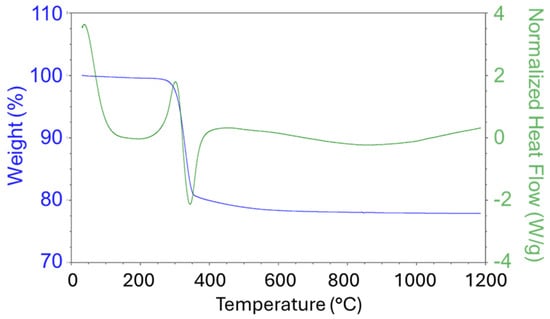
Figure 2.
TG/DSC graphs of Ni(OH)2(b) measured under an oxidation atmosphere (air).
Based on this diagram, two nickel oxide precatalysts were prepared from this precursor by means of thermal decomposition at 400 and 600 °C (NiO400(b) and NiO600(b)).
The NiO(OH)x(c) precursor was studied under the same conditions as the two previous precursors at a temperature range of 40–1200 °C (Figure 3). As can be seen from the DSC graph, the phase transformation occurred at about 350 °C, which was a slightly higher temperature in comparison with the Ni(OH)2(b) precursor. The TG graph shows that the sample lost about 35% of its initial mass at this temperature. XRD indicated that (Ni(OH)2(NiOOH)0.167)0.857 was initially prepared and then thermally transformed into NiO. Based on this diagram, two nickel oxide precatalysts were prepared from this precursor by means of thermal decomposition at 400 and 600 °C (NiO400(c) and NiO600(c)).
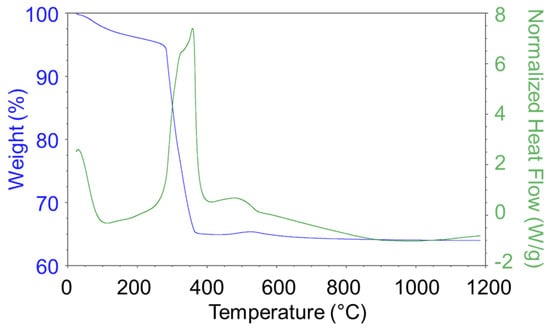
Figure 3.
TG/DSC graphs of the NiO(OH)x(c) decomposition process (air atmosphere).
3.2. XRD Analysis of Precursors and Precatalysts
XRD analysis of precursors showed that Ni(a) mostly consisted of a cubic structure of Ni with a trace content of a hexagonal structure. In turn, the Ni(OH)2(b) precursor consisted of 100% α-Ni(OH)2, while the NiO(OH)x(c) precursor displayed a non-stoichiometrically complex hydroxide structure (Ni(OH)2(NiOOH)0.167)0.857. Therefore, the amount of sodium acetate used during synthesis was insufficient to completely convert NiCl2 into stoichiometric nickel hydroxide Ni(OH)2.
All nickel oxide precatalysts (NiO600(a), NiO1000(a), NiO600(b), NiO600(c)) prepared at temperatures of 600 and 1000 °C contained 100% NiO. However, a temperature of 400 °C was not high enough for the complete conversion of hydroxide structures (Ni(OH)2(b) and NiO(OH)x(c)) into nickel oxides, and the samples NiO400(b) and NiO400(c) contained 0.8% Ni. The full results of the XRD measurements are presented in Table 2 and Figure S1a–h.

Table 2.
Summary table of XRD results—quantification of crystalline phase composition from Rietveld refinement of XRD patterns.
In addition, XRD analysis of the reduction of the prepared NiO600(b) and NiO600(c) oxides under elevated temperature was carried out. This experiment showed that the complete reduction of the oxide to Ni metal occurred as early as 300 °C (see Figure S2a,b), and therefore this temperature was chosen for the activation of the precatalyst in the CO2 methanation reactor.
3.3. Temperature-Programmed H2 Reduction (TPR-H2) and Temperature-Programmed Desorption of CO2 (TPD-CO2) Characterization of Precatalysts
The TPR-H2 and TPD-CO2 diagrams of the selected precatalyst samples show their interaction with both test gases at an increased temperature (temperature range: 20–600 °C).
In Figure 4a, for the TPR-H2 of the Ni(a) sample, three small peaks can be seen in the temperature range of 250–400 °C, indicating a consecutive reduction of the Ni surface oxides, formed during manipulation with this catalyst before the catalytic experiment in the air. The fourth more pronounced peak at about 450 °C is likely connected with the chemisorption of H2 on the surface of metallic Ni particles. Based on this experiment, an activation temperature of 300 °C was chosen for the conducted catalytic experiments. The TPD-CO2 method showed strong sorption of CO2, as demonstrated by a high and broad peak starting at about 450 °C (Figure 4b). In addition to this main peak, the graph also shows a significantly smaller peak at about 100 °C, which corresponds to weak basic sites on the catalyst surface, in contrast to the main peak at about 460 °C, which is associated with CO2 adsorption on medium basic sites. Since the signal originating from CO2 desorption does not decrease with increasing temperature from the main peak value reached, it can be concluded that the basicity of these sites is very close to that of the strong basic sites on which CO2 adsorption is the highest [46]. As the medium basic sites are the most important for the efficient catalytic transformation of CO2, a temperature of 450 °C was identified as being optimal for catalyst stability and performance tests. This temperature was also confirmed by catalytic preliminary tests (see Section 3.7.1).
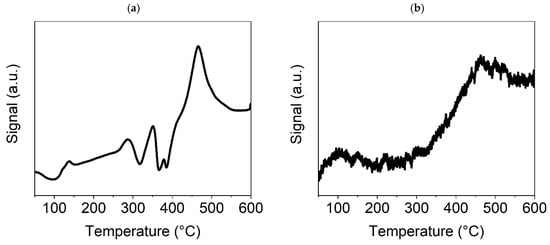
Figure 4.
TPR-H2 (a) and TPD-CO2 (b) graphs for the Ni(a) sample.
In Figure 5a, for the TPR-H2 of the NiO600(b) sample, there is only one high peak at approximately 400 °C, which indicates the reduction of this sample to metallic nickel; additional XRD tests (see Section 3.2) confirmed the complete reduction of Ni oxides to metallic Ni at a temperature of 300 °C. The presence of metallic nickel in the sample usually improves its catalytic properties. However, this will be discussed further in Section 3.7.2, which is focused on the catalytic activity of the Ni-based catalysts. The TPD-CO2 graph (Figure 5b) demonstrates no peak, only a linearly increasing line indicating the existence of nonspecific basic sites (discrete distribution of sites according to their basicity) on the surface of Ni oxide. However, the growing signal from CO2 desorption with increasing test temperature indicates that the adsorption of CO2 on the NiO surface could be sufficient for catalysis to proceed at temperatures above 400 °C, when the curve breaks and becomes steeper.
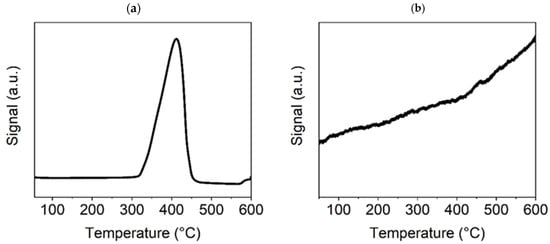
Figure 5.
TPR-H2 (a) and TPD-CO2 (b) graphs for the Ni600(b) sample.
In Figure 6a, for the TPR-H2 experiment with Ni(OH)2(b), the presence of only one strong peak indicates the reduction of hydroxide to metallic nickel at a temperature of approximately 330–340 °C, which is lower than was observed in the case of the NiO600(b). This may have been caused by the higher specific surface area for this sample due to its smaller particles, leading to a rapid reduction to metallic Ni. As was shown previously, from the results of the thermogravimetric test (Figure 2), at approximately this temperature, nickel hydroxide decomposes to oxide and subsequently is reduced by the H2 to metallic Ni. The CO2-TPD diagram (Figure 6b) shows three CO2 desorption peaks. The peak slightly below 100 °C corresponds to weak basic sites on the catalyst surface. The sharp peak at around 380 °C corresponds to a high concentration of medium basic sites on the surface, which is very important for the Ni-based methanation catalyst’s catalytic efficiency. The following broad peak at around 500 °C corresponds to strong basic sites, the concentration of which is also likely to be high because, after reaching the maximum value, desorption does not decrease with a further temperature increase. The results for both temperature-programmed experiments indicate that this Ni compound is suitable for the catalysis of the methanation process.
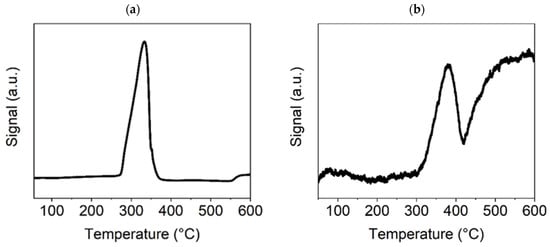
Figure 6.
TPR-H2 (a) and TPD-CO2 (b) graphs for the Ni(OH)2(b) sample.
TPR and TPD experiments with the selected precatalysts showed essential differences in their reducibility and sorption properties in relation to CO2. Ni(a) is a pure Ni metal compound, meaning that in a H2 atmosphere, it is reduced only in small areas on its surface, which were formed during the preparation steps conducted in an air atmosphere. The other two precatalysts are reduced in the H2 atmosphere to metallic Ni, but hydroxide is reduced more easily than oxide, as can be seen from the TPR-H2 graphs of the Ni(OH)2(b) and NiO600(b) samples. Additionally, hydroxide can more effectively (and reversibly) sorb CO2 in comparison with oxide and metallic Ni, which is an essential property in the hydrogenation of CO2 from the point of view of catalytic activity. Comparison of these CO2-TPD graphs shows that only in the case of the Ni(OH)2(b), the measurable amount of CO2 is adsorbed on the medium basic sites, which are commonly connected with the O defects on the surface of the catalyst, which are important for high catalytic activity in CO2 hydrogenation [47]. Therefore, the TPR and TPD experiments provided useful information for preparing an effective Ni-based catalyst for CO2 methanation, revealing Ni hydroxide to be the best Ni catalyst, with this assumption being confirmed by subsequent catalytic tests.
3.4. Electron Microscopy of the Ni-Based Catalysts
3.4.1. SEM/TEM Before Catalysis
The SEM image of the Ni(a) sample in Figure 7a shows the presence of spherical MPs 0.5–2 μm in size. Several particles of polyhedral form (octahedron, dodecahedron, etc.) are also present, as confirmed by the TEM image in Figure S3a.
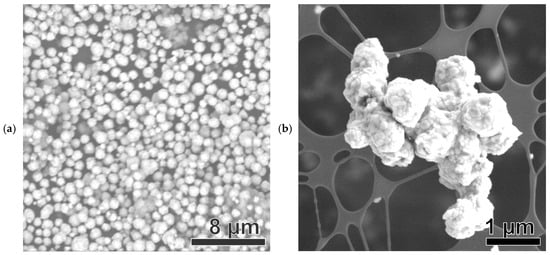
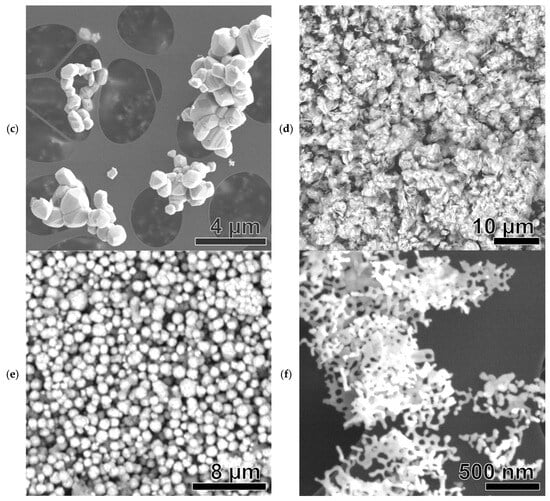
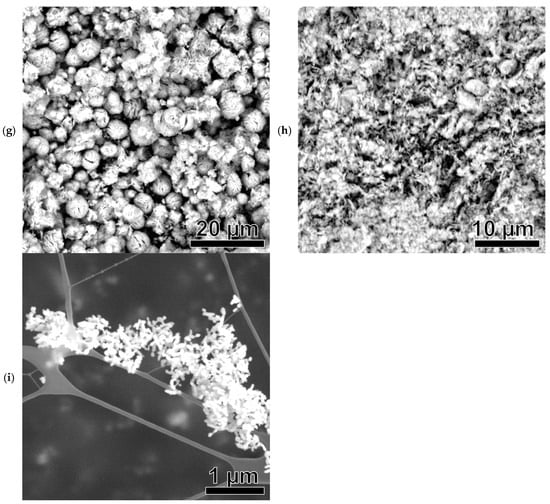
Figure 7.
SEM images of Ni-based samples: Ni(a) (a), NiO600(a) (b), NiO1000(a) (c), Ni (OH)2(b) (d), NiO400(b) (e), NiO600(b) (f), NiO(OH)x(c) (g), NiO400(c) (h), and NiO600(c) (i).
The SEM image of the NiO600(a) sample (a derivative of Ni(a)) shows a structure differing from that of the original precursor Ni(a), comprising clusters with spherical-like MPs with a diameter of about 500–1000 nm (Figure 7b). These clusters, in turn, mostly consist of shapeless, and to some extent disk-like, NPs about 50–100 nm in size. The TEM image in Figure S3b confirms this structure.
The SEM image in Figure 7c depicts NiO1000(a), a derivative of Ni(a). In this case, clusters assembled from an irregular polyhedral can be seen, 0.1–1.5 μm in size. Sphere-like structures are not observable. The TEM image in Figure S3c confirms the SEM analysis data.
In the case of the SEM image of Ni(OH)2(b) in Figure 7d, it can be observed that massive clusters with a rough structure of peculiar microsheets about 2–3 μm in size are present. The TEM image in Figure S3d shows the multi-layered nature of these clusters.
NiO400(b) (a derivative of Ni(OH)2(b)), as shown in the SEM image in Figure 7e, has a structure differing from that of the original hydroxide, consisting of spherical-like MPs with a diameter of about 0.5–3 μm. In the corresponding TEM image (Figure S3e), plenty of spherical and cylindrical NPs around 50–100 nm in size can be seen, making up the spherical-like MPs.
NiO600(b) (a derivative of Ni(OH)2(b)) has a significantly different structure compared to the particles forming it (Figure 7f), with these particles creating a net of several microns in size with holes less than 100 nanometers in diameter. The TEM image in Figure S3f also shows the continuous nature of this structure.
NiO(OH)x(c) has rounded MPs with a broad size distribution ranging from 200 nm to about 3 μm (Figure 7g). The fibrous, tangled nature of these particles is evident. The TEM image in Figure S3g shows a round, needle-like structure resembling a hedgehog. The particles display some stabilization but are also prone to cluster formation.
NiO400(c) (a derivative of NiO(OH)x(c)) has the shape of a vast, endless cluster with a rough, needle-like surface (Figure 7h). However, in the TEM image in Figure S3h, it is possible to identify individual MPs with a size of about 5–8 μm and a hedgehog-like shape.
NiO600(c) (a derivative of NiO(OH)x(c)) has a very different structure from the previous sample. Structurally, the sample is a set of small cylindrical rods with a length of less than 100 nm (Figure 7i). This structure is confirmed in the TEM image in Figure S3i.
SEM EDX analysis (Figure S4a–c) confirmed the precatalysts’ elemental composition, containing only Ni and O. Carbon is also detectable on some spectra, which probably originates from residues of PEG 1500 used in the preparation method as a stabilizer.
In conclusion, the SEM images show that nickel oxides, after calcination, do not display the same structure as primary nickel or nickel hydroxide particles. Moreover, the morphology of MPs and NPs of oxides also changes with increased calcination temperature. These changes affect the catalytic activity of prepared nickel catalysts, as explored later in this paper.
3.4.2. SEM After Catalysis
The SEM images in Figure 8a–i reveal a cardinal change in the morphology of the Ni-based catalysts after the catalytic reaction. Amorphous MPs can be observed to be several microns in size. The observed structures are therefore different from those of the original particles before catalysis. It can be safely argued that this change is a result of thermal stress and chemical modifications of primary Ni-based particles during catalysis; particles lose their shape and aggregate to form more giant structures, which may be the reason for the observed gradual decrease in catalytic activity over the course of the experiment (see Section 3.7). However, in Figure 8f–i, traces of the original morphology of the particles can be observed (net-like, sphere-like, needle-like, and rod-like particles).
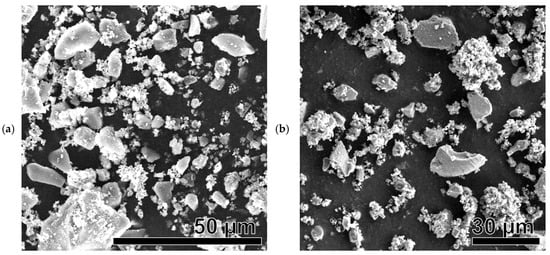
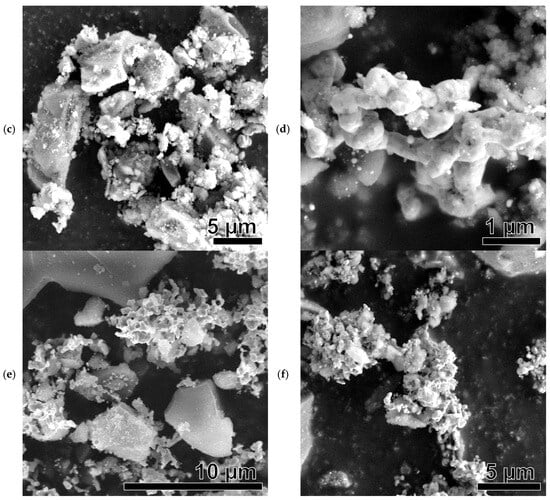
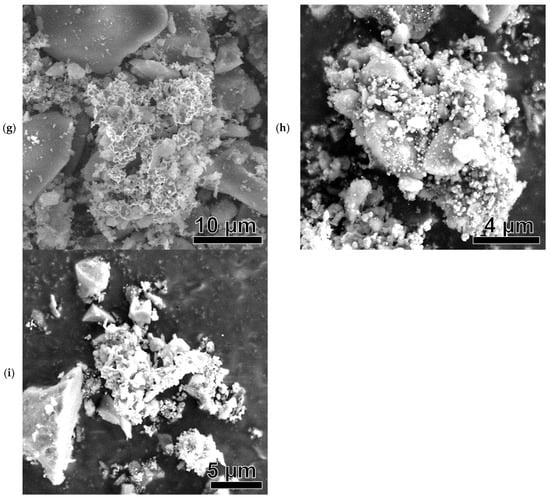
Figure 8.
SEM images of Ni-based samples after catalysis: Ni(a)* (a), NiO600(a)* (b), NiO1000(a)* (c), Ni (OH)2(b)* (d), NiO400(b)* (e), NiO600(b)* (f), NiO(OH)x(c)* (g), NiO400(c)* (h), and NiO600(c)* (i).
All SEM images show brighter, larger (several tens of micrometers) silica particles that did not participate in the catalytic reaction. They were used as unreactive supporting material to avoid the sintering of Ni-based catalytic particles.
3.5. Surface Area and Pore Volume Characterization
The values of the surface area (m2/g) and pore volume (cm3/g) are presented in Table 3, and graphs of the measured isotherms are provided in Figure S5a,b.

Table 3.
Surface area, pore size, and total volume of Ni-based samples.
The data presented shows a clear trend, where the highest surface area values are primarily observed for the prepared Ni-based compounds. Pure metal Ni shows the lowest surface area value, at only 7.03 m2/g, while metahydroxide has a medium value of 70.07 m2/g and Ni(OH)2 has the highest value of 83.99 m2/g. Thermal treatment reduced these values, with higher temperatures having a greater impact. Therefore, the sample Ni1000(a), formed via the oxidation of Ni(a) at 1000 °C, shows a surface area value of only 1.09 m2/g. The observed values for specific surface area are consistent with the electron microscopic observations. The lowest values of this quantity are connected with the smooth spherical microparticles of pure Ni, which, after oxidation at elevated temperatures, form larger aggregates with a smaller surface area. The existence of the aggregates is apparently a reason for the highest values of pore size for these samples with the smallest specific surface area. On the other hand, samples with the highest surface area are formed by the imperfectly developed nanocrystalline particles of Ni(OH)2 or of the non-stochiometric Ni metahydroxide NiO(OH)x, and their pore size is undoubtedly caused by the irregular structure of particles, which improves the value of specific surface area and consequently the catalytic activity.
3.6. X-Ray Photoelectron Spectroscopy of Post-Catalytic Samples
Using X-ray photoelectron spectroscopy (XPS), three samples, Ni(a)*, Ni(OH)2(b)*, and NiO400(b)*, were examined after catalysis. The wide-scan spectra (Figure S6), normalized to the same height and vertically shifted for clarity, show the presence of Ni, Si, O, and C only. In Figure 9a, the spectra of catalyst samples, together with those of metallic nickel and nickel oxide acquired in the Ni 2p region, are displayed. The fitted Ni 2p3/2 spectrum of the Ni(OH)2(b)* catalyst is shown with assignments of individual components in Figure 9b. The fitted and assigned spectra of Ni 2p3/2 photoelectrons of Ni(a)* and NiO400(b)* catalysts are displayed in the supporting material (Figure S7). The low-binding-energy component located at ~852.5 eV belongs to metallic Ni, while the higher-binding-energy component is consistent with the presence of Ni2+. Assuming a homogeneous sample, the elemental atomic concentrations displayed in Table 4 were calculated from integrated intensities of Ni 2p, Si 2p, O 1s, and C 1s spectra after their correction for pertinent photoionization cross sections and the transmission function of the spectrometer using CasaXPS software.
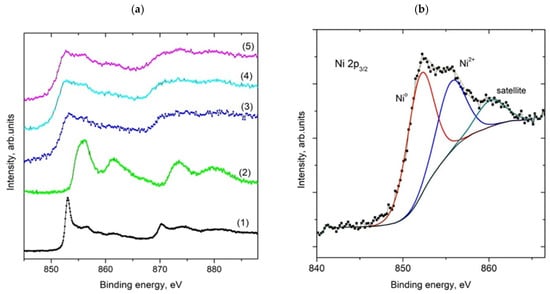
Figure 9.
XPS of Ni 2p photoelectrons for Ni metal (1), Ni oxide (2), Ni(a)* (3), NiO400(b)* (4), and Ni(OH)2(b)* (5) catalysts (a), and fitted high-resolution Ni 2p3/2 spectrum for the Ni(OH)2(b)* catalyst (b). The spectra of Ni 2p3/2 electrons for the other two catalysts are within the margin for error and are included in the supporting information.

Table 4.
Populations of elements (in atomic%) on the catalyst’s surface after catalysis evaluated from XPS measurements.
It should be mentioned that samples were, in fact, not homogeneous and were formed by bunches of catalytically active particles dispersed in larger particles of silica, as evident from SEM images (Figure 8). This inhomogeneity not only influenced the results of quantitative analysis but also resulted in broadening of the spectra, as can be seen from the spectra of C 1s photoelectrons (Figure S7d), where the dominant photoemission peak is associated with carbon atoms in C-C and C-H bonds and a high-binding-energy tail caused by the presence of oxygen-containing functionalities.
XPS analysis based on high-resolution spectra indicated that Ni(a)* has nearly the same carbon content on its surface as the two other samples. This is an interesting result as the duration of the experiment conducted with this catalyst was two times longer (42 vs. 21 h). Therefore, twice as much carbon dioxide passed through the sample, but the amount of carbon deposited was not twice as high as that for the other two samples. For the other two catalysts, XPS showed a significantly greater amount of carbon in Ni(OH)2(b)*, which may be due to its higher catalytic activity, which can cause higher deposition of carbon compared to NiO400(b)*. The high-resolution XPS of Ni 2p photoelectrons for the three post-catalytic samples is nearly identical. Their fitting did not show the differences in the populations of Ni oxidation states for the measured catalysts (Figure 9b). These spectra show a significant content (about 50%) of metallic Ni, which is essential for their excellent catalytic activity due to the activation of the hydrogen molecules for their reaction with CO2 molecules. However, the total amount of Ni on the surface of these three tested catalysts was significantly different, but due to the inhomogeneity of the measured samples (influence of SiO2 inert), these differences cannot be interpreted as a major argument for their catalytic activity. The influence of oxygen vacancies on catalytic activity is the most important parameter affecting the performance of metal oxide catalysts in heterogeneous catalysis [48]. However, in the case of the conducted catalytic experiments, it is difficult to evaluate their influence since a large part of the O 1s XPS (Figure S8a–c) came from the SiO2 added to the NiOx catalysts before the catalytic experiments.
3.7. Results of Catalytic Hydrogenation of CO2 Using Different Ni-Based Catalysts
The hydrogenation of CO2 on Ni-based catalysts follows two possible pathways, one of which starts with the formation of CO via the reverse water gas shift reaction (RWGS) and its subsequent transformation to methane via the carbide pathway. The second pathway starts with the formate pathway, which then leads back to the carbide pathway of methane formation [49]. Metallic Ni plays a crucial role in these reactions because its surface is essential for activating hydrogen molecules for their subsequent reaction with CO2 [50]. Regardless of the starting form of Ni in the catalyst (metallic Ni or any oxide), the active form always contains metallic Ni, formed in the reducing reaction atmosphere, as demonstrated by the XPS of the spent catalysts.
The catalytic experiments’ main products were CH4 and CO, along with an almost immeasurable quantity of C2H6 (less than 0.1%) and C3H8 (less than 0.01%). Exemplary GC chromatograms of these products are presented in Figure S9a,b.
3.7.1. Preliminary Catalytic Tests Using a Temperature Ramp
As can be seen in the graphs presented in Figure 10, the highest conversion rate of CO2 (68%) and the highest selectivity for CH4 (95.3%) were obtained for NiO1000(a) at a temperature of 450 °C. For the second sample, NiO400(b), the highest conversion rate of CO2 and the highest selectivity for CH4 were also found at 450 °C, at 86% and 99%, respectively (Figure 11).
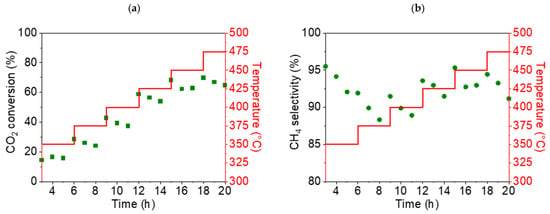
Figure 10.
Conversion rate of CO2 (a) and selectivity for CH4 (b) for the NiO1000(a) sample (displayed as green points in both cases) during the temperature ramp from 350 up to 475 °C.
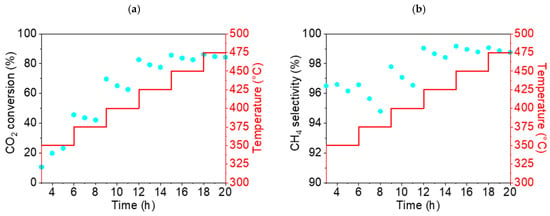
Figure 11.
Conversion rate of CO2 (a) and selectivity for CH4 (b) for the NiO400(b) sample (displayed as blue points in both cases) during the temperature ramp from 350 up to 475 °C.
Based on the results of these preliminary catalytic tests, a reaction temperature of 450 °C was identified as being optimal for all subsequent catalytic tests of stable methane production.
3.7.2. Catalytic Efficiency of Catalysts with a Ni(a) Precursor (a-Group Catalysts)
This section discusses the catalytic properties of nickel-derived catalysts (a-group catalysts): Ni(a), NiO600(a), and NiO1000(a). The CO2 conversion rate XCO2 dropped significantly for all three samples during the experiment. It is noteworthy that in the case of Ni(a) and NiO1000(a), there was a significant drop in the first hour of the test, from 94.9 (t = 1 h) to 84.3% (t = 2 h) and from 59.9 (t = 1 h) to 52.6% (t = 2 h), respectively (Figure 12a). For NiO600(a), the decrease in the conversion rate during the first hour of the experiment was less than 1%, from 76.0 (t = 1 h) to 75.5% (t = 2 h). However, Ni(a) demonstrated the best conversion rate throughout the entire 21 h test: the maximum was 94.9% (t = 1 h) and the minimum was 66.4% (t = 21 h). Therefore, the overall decrease in conversion rate during the 21 h test was 28.5%. The oxides showed significantly worse conversion rates overall, but the relative decrease was less than that of nickel Ni(a), from 76.0 (t = 1 h) to 58.2% (t = 21 h) (decrease 17.8%) for NiO600(a) and from 59.9 (t = 1 h) to 38.2% (t = 21 h) (decrease 21.7%) for NiO1000(a).
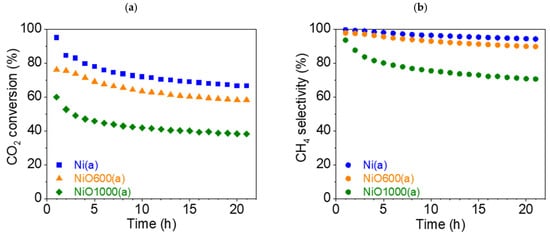
Figure 12.
(a) Conversion rate of CO2 and (b) CH4 selectivity (●) of a-group catalysts at 450 °C: Ni(a) (■, blue), NiO600(a) (▲, orange), and NiO1000(a) (◆, green).
The selectivity SCH4 of all samples also fell. Additionally, the absolute values varied significantly compared to the conversion rate (Figure 12b). SCH4 for Ni(a) was close to 100% at the beginning of the test (99.6%, t = 1 h) and slightly decreased to 94.2% at the end of the test (t = 21 h). SCH4 for NiO600(a) also fell by less than 10%, from 97.7 (t = 1 h) to 89.7% (t = 21 h). However, in the case of NiO1000(a), the decrease in SCH4 was more significant—from 93.5 (t = 1 h) to 70.6% (t = 21 h). Moreover, in the first third of the test, the drop roughly corresponded to an exponential decrease, after which it became linear.
The maximum selectivity SCO (Figure S10a) for the undesirable product, CO, was less than 6% (t = 21 h) for Ni(a) and less than 11% (t = 21 h) for NiO600(a). However, in the case of NiO1000(a), the increase in CO selectivity became very significant—from 6.5 (t = 1 h) to 29.4% (t = 21 h). The graphs of the reaction yield ηCH4 and space–time yield STYCH4 can be found in the Supplementary Materials (Figures S11a and S12a).
Summing up the results obtained with this group of catalysts, oxidation and increases in temperature during the thermal treatment of precursors significantly worsened the catalytic properties of Ni(a) MPs. This suggests that the initially prepared pure nickel precursor Ni(a) was a better catalyst than oxides prepared through thermal treatment above its oxidation temperature. Subsequent hydrogen activation of the oxides at the start of the catalytic experiment was not sufficient to obtain high and stable catalytic activity compared with metallic Ni. Additionally, using temperature treatment at very high temperatures can worsen the catalytic activity of the final catalyst due to the recrystallization of primary crystals, forming nonactive crystal facets [51].
3.7.3. Catalytic Efficiency of Catalysts with a Ni(OH)2(b) Precursor (b-Group Catalysts)
This section discusses the catalytic properties of nickel hydroxide-derived catalysts (b-group catalysts): Ni(OH)2(b), NiO400(b), and NiO600(b). Among these, the precursor nickel hydroxide Ni(OH)2(b) was converted entirely to NiO not only by oxidative thermal treatment but also by the temperature used for the catalytic reaction experiment (450 °C), as the temperature for oxidative transformation was observed to be below 400 °C (Figure 2). On the other hand, it should be remembered that during the activation phase, the reduction of oxides to metallic Ni occurs.
The CO2 conversion rate XCO2 dropped for all samples during the 21 h test. For Ni(OH)2(b) and NiO400(b), it fell by just over 10%—from 95.6% (t = 1 h) to 84.2% (t = 21 h) and from 86.9% (t = 3 h) to 75.4% (t = 21 h), respectively (Figure 13). During the experiment, the XCO2 for Ni(OH)2(b) was about 10% higher than that for NiO400(b), which is very significant for such similar catalysts. The third catalyst, NiO600(b), demonstrated a significantly worse conversion rate during catalysis, reducing from 78.6% (t = 1 h) to 58.1% (t = 21 h). Overall, all three catalysts showed an excellent conversion rate compared to other studies that used pure Ni-based catalysts [38].
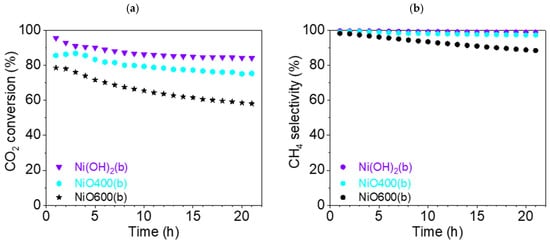
Figure 13.
(a) Conversion of CO2 and (b) CH4 selectivity (●) of b-group catalysts at 450 °C: Ni(OH)2(b) (▼, violet), NiO400(b) (⬢, light blue), and NiO600(b) (★, black).
Excellent selectivity for methane SCH4 was found for Ni(OH)2(b), at more than 99% during all 21 h experiments. Slightly inferior results were demonstrated for NiO400(b), at more than 97% during the test. However, the third catalyst was significantly worse, as SCH4 decreased from 98.3 (t = 1 h) to 88.5% (t = 21 h).
The CO selectivity (Figure S10b) for Ni(OH)2(b) was less than 1%, and for NiO400(b), it was less than 3% during the entire catalysis testing period. For NiO600(b), the selectivity for CO grew significantly, from 1.7 (t = 1 h) to 11.5% (t = 21 h). The graphs of the reaction yield ηCH4 and space–time yield STYCH4 can be found in the Supplementary Materials (Figures S11b and S12b).
It can also be argued that, in this case, the thermal treatment at a temperature much higher than the transformation temperature observed during the TG/DSC experiment worsened the properties of the catalyst. On the other hand, using a temperature close to the temperature required for the hydroxide’s transformation to an oxide did not significantly influence the catalytic efficiency of the precatalyst in comparison with the direct use of the hydroxide precursor. However, the transformation proceeding directly in the reaction conditions seems to be the best way to prepare a highly efficient catalyst.
3.7.4. Catalytic Efficiency of Catalysts with a Ni(OH)x(c) Precursor (c-Group Catalysts)
This section discusses the catalytic properties of nickel metahydroxide-derived catalysts (c-group catalysts): NiO(OH)x(c), NiO400(c), NiO600(c). In this case, as in previous cases, the primary form of the tested catalysts was nickel oxide. The precursor nickel metahydroxide NiO(OH)x(c) was completely converted to NiO at 450 °C, as can be seen from TG/DSC analysis (Figure 3). Using thermal treatment in an oxidative atmosphere, two other catalysts were prepared, NiO400(c) and NiO600(c). The trends observed in the case of the Ni(OH)2(b) precursor are different to the results observed in this section. Firstly, the catalytic activity of the prepared catalysts was not as good as that observed for b-group catalysts. The CO2 conversion rate XCO2 decreased during catalysis, but did not decrease in the same manner for the tested samples. For NiO(OH)x(c) and NiO600(c), the drop in conversion rate was moderate: from 83.6 (t = 3 h) to 71.4% (t = 21 h) and from 78.0 (t = 3 h) to 65.7% (t = 21 h), respectively. It is noteworthy that in both cases, the maximum value was not observed in the first hour of the experiment but in the third, as can be seen on the graphs (Figure 14). Remarkably, NiO400(c), which was obtained at a lower calcination temperature than NiO600(c), had a much poorer conversion rate, dropping from 53.3 (t = 1 h) to 17.9% (t = 21 h), representing the worst values for all the catalysts tested in this study.
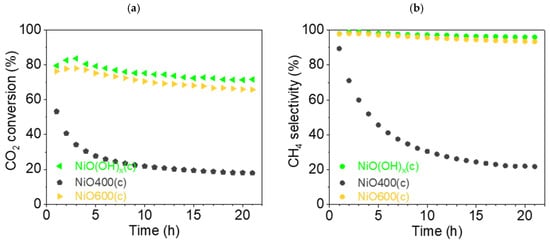
Figure 14.
(a) Conversion of CO2 and (b) CH4 selectivity (●) of c-group catalysts at 450 °C: NiO(OH)x(c) (◄, light-green), NiO400(c) (⬟, gray), and NiO600(c) (▶, orange).
The values of CH4 selectivity SCH4 varied according to similar patterns, as was observed for the conversion rate. For metahydroxide NiO(OH)x(c), the peak value was 98.9 (t = 3 h), dropping to 95.9% (t = 21 h), while for NiO600(c), the peak value was 98.0 (t = 3 h), falling to 93.5% (t = 21 h). Meanwhile, NiO400(c) showed significantly worse selectivity, with the graph showing a hyperbolic 4-fold drop from 89.4 (t = 1 h) to 21.8% (t = 21 h).
The CO selectivity (Figure S10c) for NiO(OH)x(c) increased from 1.1 (t = 3 h) to 4.0% (t = 21 h) and for NiO600(c) from 2.1 (t = 3 h) to 6.6% (t = 21 h) during catalysis. For NiO400(c), selectivity for CO production grew greatly, by more than 7 times, from 10.6 (t = 1 h) to 78.2% (t = 21 h).
The graphs of the reaction yield ηCH4 and space–time yield STYCH4 can be found in the Supplementary Materials (Figures S11c and S12c).
Summarizing the results for c-group catalysts, it can be argued that NiO(OH)x(c) and NiO600(c) displayed methanation from the point of view of selectivity and conversion, similar to most catalysts in the other two groups. However, the abnormally low catalytic activity of NiO400(c) is surprising. The large drop in selectivity for CH4 and the conversion rate of CO2 with the same increase in selectivity for CO demonstrates a principal change in the catalytic properties of all the Ni-based catalysts tested here. A possible reason for this is the irregular, rough structure of the sample, which was seen in the SEM images. The second reason for such a different catalytic activity could be connected with the imperfect transformation of non-stochiometric hydroxide into an active NiO catalyst. However, to elucidate the real reasons for the existence of this phenomenon, a more detailed study of the changes in the chemistry of this catalyst should be optimally supported by theoretical calculations and in situ measurements.
3.7.5. Stability Tests of Ni-Based Catalysts
Stability tests (42 h) were carried out for two catalysts: Ni(a) and NiO600(b). In the case of Ni(a), the CO2 conversion rate XCO2 fell from 94.9 (t = 1 h) to 61.4% (t = 42 h), i.e., the drop was nearly 35% (Figure 15a). The drop in selectivity for CH4 was not as substantial, being about 8.1%, from 99.6 (t = 1 h) to 91.5% (t = 42 h), as can be seen from Figure 15b.
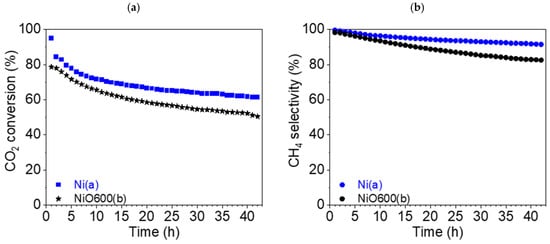
Figure 15.
(a) Conversion of CO2 and (b) CH4 selectivity (●) of Ni(a) (■, blue) and NiO600(b) (★, black) at 450 °C during a stability test.
The absolute values for the catalyst NiO600(b) look similar. The CO2 conversion rate XCO2 also decreased by about 25%: from 78.6 (t = 1 h) to 50.5% (t = 42 h) (Figure 15a). The decrease in selectivity for CH4 was more pronounced in this case, at approximately 16%, from 98.3 (t = 1 h) to 82.5% (t = 42 h) (Figure 15b).
The graphs of selectivity for CO production (SCO), reaction yield ηCH4, and space–time yield STYCH4 can be found in the Supplementary Materials (Figures S10d, S11d, and S12d).
To summarize the stability tests, it can be deduced that in long-term catalysis, the metallic nickel Ni(a) precursor appeared to be a more stable catalyst in comparison with the oxide NiO600(b) prepared at elevated temperatures from Ni(OH)2(b).
3.8. Summary of Catalytic Results
In general, most of the tested samples of Ni-based catalysts showed high catalytic activity, with their basic parameters reaching thermodynamic limits at the reaction temperature, namely conversion rate of CO2 of 89.9% and a selectivity for CH4 production of 99.9% [52]. The degree of conversion was influenced by the physical state of the catalyst (specific surface area) and simultaneously by the chemical composition of precatalysts (see Table 5). As metallic Ni is the most efficient form of Ni-based catalyst for CO2 methanation, the catalyst Ni(a) showed the second highest starting conversion rate, regardless of its very low specific surface area. On the other hand, a high specific surface area was not a guarantee for high catalytic activity, as the precatalyst NiO(OH)x(c) with the second highest specific surface area value only ranked fourth regarding its starting conversion rate in the methanation reaction. This may be due to the fact that this compound forms relatively large, strongly agglomerated aggregates of needle-like crystals that protrude out from the surface of the aggregates and thus increase the value of the specific surface area. However, at elevated temperatures of several hundred degrees Celsius, these needles with diameters in the tens of nanometers at most disappeared from the surface of the aggregates (Figure S3h), which is likely the reason for the low catalytic activity at the optimum reaction temperature of 450 °C. Therefore, we can conclude that the effect of surface area on the catalytic activity is not as important as the presence of the well-defined form of Ni needed for optimal transformation to metallic Ni in the reaction atmosphere. The morphology of the precatalyst particles also plays an important role. Therefore, the best catalyst in the presented study was well-defined Ni(OH)2(b), which can be easily thermally transformed into the active catalyst in the reduction atmosphere, as can be deduced from TPR-H2 measurement (see Figure 6). Additionally, TPD-CO2 measurement confirmed excellent interaction with CO2 for this precatalyst. The positive collaboration of the high surface area and the presence of the metallic Ni formed in the reaction atmosphere (see XPS spectrum in Figure 9b) resulted in this compound having the best catalytic activity among all of the tested catalysts in this study. On the other hand, the high surface area was advantageous for stabilizing the catalytic efficiency of the studied catalysts. The best catalyst with the highest surface area in this study was also the catalyst whose performance did not change significantly during the standard experiment (21 h). However, the low surface area value of the pure Ni(a) precatalyst caused low resistance to deterioration of its catalytic efficiency, despite its high starting catalytic activity. The main reason for the significant decrease in the CO2 conversion rate was connected with the deposition of elemental carbon on its surface (see Table 4), preferably in the amorphous form, as was determined by Raman spectroscopy. Figure S13 shows the Raman spectrum (baseline subtracted and smoothed by Savizky–Golay algorithm) of Ni(OH)2(b), which contains two main broad bands with maxima at 1310 cm−1 (FWHM 82.39 cm−1) and 1593 cm−1 (FWHM 53.01 cm−1) of Raman shift, which indicates the presence of amorphous carbon or a carbon film, with these bands being correlated with the D and G bands of carbon materials, respectively [53]. Although the amount of deposited carbon determined by XPS was nearly the same for all three studied samples, the ratio of carbon content vs. specific surface area was highest for the Ni(a) catalyst, at 0.79, which was ten times higher in comparison with the value of 0.074 for the Ni(OH)2(b) catalyst. Therefore, carbon distribution on the surface of the Ni(a) catalyst with a low surface area was more limited, and commonly, the deterioration of the catalytic activity of catalysts with a low specific surface area, as is the case of the Ni(a) catalyst, was much higher in comparison with catalysts with a higher specific surface area, as seen for Ni(OH)2(b) (more than 10 times, see Table 5). To confirm this hypothesis, the ratio of the initial to the final CO2 conversion rate for the 21 h experiments can be used. In the case of the Ni(a) precatalyst, this ratio was 0.7, i.e., a decrease of 30%. In the case of the Ni(OH)2(b) precatalyst, this ratio was 0.88, i.e., a decrease of only 12%. Comparison of these relative values shows that the decrease in catalytic activity was 2.5 times higher for Ni(a) than for Ni(OH)2(b). Thus, these values qualitatively support the hypothesis of a decrease in catalytic activity due to the formation of surface deposits of reduced carbon.

Table 5.
Comparison of the specific surface area (Ssp) and catalytic activity (CO2 conversion at start XCO2,start, and at the end XCO2,end of the catalytic experiment) of the studied Ni-based catalysts.
The fact that the catalytic activity due to the deposition of elemental carbon during the catalytic reaction with the Ni(a) catalyst did not decrease in proportion to its smaller surface area compared to the Ni(OH)2(b) catalyst is due to the fact that carbon was deposited not only on the catalyst’s surface but also on the silica surface used as the antisintering agent. This fact is clearly documented by the EDX elemental mapping of the two catalysts in Figure 16 for Ni(a) and Figure 17 for Ni(OH)2(b).
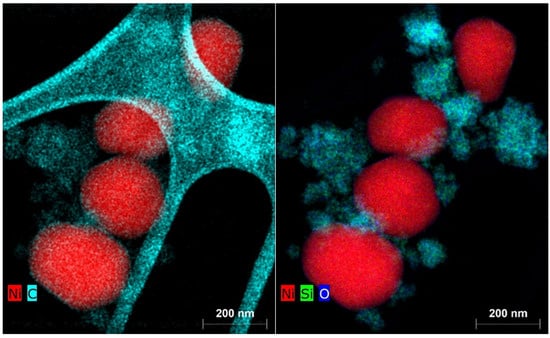
Figure 16.
Elemental mapping of the main elements in the Ni(a) spent catalyst.
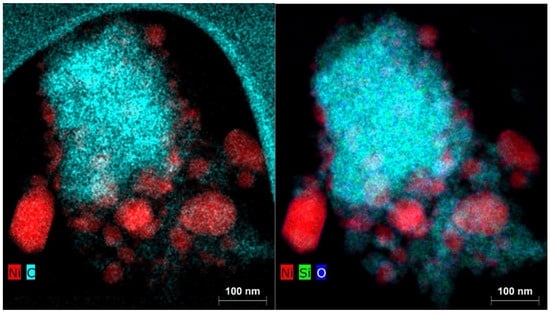
Figure 17.
Elemental mapping of the main elements in the Ni(OH)2(b) spent catalyst.
Another important finding from the conducted experiments relates to the effect of heat treatment of the precatalysts. In all three cases (a–c), the most effective catalyst was the primary prepared substance, and its thermal treatment in an oxidizing atmosphere reduced the specific surface area; in connection with this fact, deterioration of the catalytic activity of the final precatalysts was observed.
A comparison of the key characteristics, selectivity for CH4, and conversion rate of CO2 with previously published research results is presented in Table 6. These studies showed the favorability of the use of the solvothermal method for the preparation of Ni-based methanation catalysts in comparison with the conventional precipitation method [54,55,56,57].

Table 6.
Comparison of the catalytic activity (average CO2 conversion rate and CH4 selectivity) of the studied Ni-based catalysts with some previously published cases.
4. Conclusions
The experiments conducted in this study demonstrated that the solvothermal synthesis of Ni-based catalysts for CO2 methanation is an efficient way to prepare highly active catalysts. The obtained results of catalytic activity showed that the final formation of the active catalyst at elevated temperatures from precursors in a reducing reaction atmosphere directly in the reactor could be preferred over thermal transformation at elevated temperatures in air. The results showed that there are two main factors influencing the catalytic efficiency of the final catalysts, the high specific surface area and metallic Ni (preferably formed during the activation period in the reactor), which are needed for optimal catalysis. However, stabilizing Ni-based catalysts by anchoring them onto suitable supports (typically oxides of less noble metals) will be required to improve the time stability of the catalytic activity of the tested pure Ni-based catalysts, as was proven by other studies published previously. Furthermore, optimization of the catalytic activity in order to lower the optimal reaction temperature via decoration of the Ni catalytic particles with noble metals (e.g., Pt, Rh, Pd, Ru) or rare earth metals (e.g., Y, La, Eu) will be another direction of subsequent research.
Supplementary Materials
The following supporting information can be downloaded at https://www.mdpi.com/article/10.3390/nano15171379/s1, Figure S1: XRD characterization of Ni-consisted catalysts: (a) Ni(a), (b) NiO600(a), (c) NiO1000(a), (d) NiO400(b), (e) NiO600(b), (f) NiO(OH)x(c), (g) NiO400(c) and (h) NiO600(c); Figure S2: Dynamic XRD study of NiO sample reduction under H2 atmosphere: (a) NiO600(b), (b) NiO600(c); Figure S3: TEM characterization of Ni-consisted samples: (a) Ni(a), (b) NiO600(a), (c) NiO1000(a), (d) Ni(OH)2(b) (e) NiO400(b), (f) NiO600(b), (g) NiO(OH)x(c), (h) NiO400(c) and (i) NiO600(c); Figure S4: EDX analysis of precatalysts (a) Ni(a), (b) Ni(OH)2(b), and (c) NiO400(c); Figure S5: Isotherm linear plots and BET surface area plots for (a) Ni(a) and (b) NiO600(a); Figure S6: X-ray photoelectron spectroscopy (XPS) survey spectra: Ni(a)* (1, blue), NiO400(b)* (2, light-blue), and Ni(OH)2(b)* (3, pink); Figure S7: Fitted spectra of Ni 2pš/2 photoelectrons of (a) Ni(a)* and (b) NiO400(b)* catalyst samples; Figure S8: Fitted spectra of O 1s photoelectrons of catalyst samples of (a) Ni(a)*, (b) NiO400(b)*, and (c) Ni(OH)2(b)* catalysts, and (d) of C 1s photoelectrons of Ni(a)* (1, blue), NiO400(b)* (2, light-blue), and Ni(OH)2(b)* (3, pink). Spectra are normalized to the same height and vertically shifted for the sake of clarity; Figure S9: GC chromatograms taken during the catalytic experiments with Ni-consisted catalysts (10th hour): (a) Ni(a), (b) NiO600(a), (c) NiO1000(a), (d) Ni(OH)2(b), (e) NiO400(b), (f) NiO600(b), (g) NiO(OH)x(c), (h) NiO400(c), and (i) NiO600(c); Figure S10: Selectivity CO for a-group (a), b-group (b), c-group (c) of catalysts and in stability test (d); Figure S11: Reaction yield for a-group (a), b-group (b), c-group (c) of catalysts and in stability test (d); Figure S12: Space-time yield for a-group (a), b-group (b), c-group (c) of catalysts and in stability test (d); Figure S13: Raman spectrum of Ni(OH)2(b) sample, 780 nm, 10 mW.
Author Contributions
Conceptualization, A.B., R.P., P.F., C.P., Š.V. and L.K.; Methodology, A.B., T.S., M.K., A.P., A.G., Z.B. and L.K.; Validation, R.P., A.P., P.F., C.P. and L.K.; Formal analysis, A.B., T.S., M.K., Z.K., A.P.T., K.S., J.K., K.R., L.B., Z.B. and L.K.; Investigation, A.B., T.S., Z.K., A.P.T., J.K., K.R., L.B. and Z.B.; Resources, R.P., P.F., C.P., Š.V. and L.K.; Data curation, T.S., R.P., J.K., Z.B., Š.V. and L.K.; Writing – original draft, A.B., K.S. and L.K.; Writing – review & editing, A.B., T.S., M.K., Z.K., A.P.T., K.S., R.P., A.P., J.K., P.F., K.R., A.G., C.P., L.B., Z.B., Š.V. and L.K.; Visualization, A.B., K.S., P.F., A.G. and L.K.; Supervision, Š.V. and L.K.; Project administration, A.P., Š.V. and L.K.; Funding acquisition, R.P., J.K., Š.V. and L.K. All authors have read and agreed to the published version of the manuscript.
Funding
L.K. acknowledges support from ERDF project “Development of pre-applied research in nanotechnology and biotechnology” (No. CZ.02.1.01/0.0/0.0/17_048/0007323), J.K. acknowledges funding from the Research Infrastructure project NanoEnviCz, supported by the Ministry of Education, Youth and Sports of the Czech Republic (No. LM2023066), and R.P. acknowledges support from an internal grant from Palacký University, grant number IGA_Prf_2025_024. K.S. acknowledges support from a project funded by the European Union under Horizon Europe (project No. 101079142) and S.V. acknowledges funding by project from the Programme Johannes Amos Comenius Advanced Multiscale Materials for Key Enabling Technologies supported by the Ministry of Education, Youth and Sports of the Czech Republic (No. CZ.02.01.01/00/22_008/0004558).
Data Availability Statement
The original contributions presented in this study are included in the article and its Supplementary Material. Further inquiries can be directed to the corresponding author.
Acknowledgments
The authors acknowledge Vitezslav Heger (Department of Physics, Palacký University in Olomouc) for his help with the preliminary XRD characterization of the prepared compounds, Alexandra Rancová (Department of Physical Chemistry, Palacký University in Olomouc) for her help with BET measurements of the prepared catalysts, Barbora Štefková (Department of Physical Chemistry, Palacký University in Olomouc) for her help with Raman spectroscopy measurements, and Ondřej Tomanec (CATRIN, Palacký University in Olomouc) for his help in the elemental mapping of spent catalysts.
Conflicts of Interest
The authors declare no conflicts of interest.
Correction Statement
This article has been republished with a minor correction to the Data Availability Statement. This change does not affect the scientific content of the article.
References
- Zaiman, N.F.H.N.; Shaari, N. Review on flower-like structure nickel-based catalyst in fuel cell application. J. Ind. Eng. Chem. 2023, 119, 1–76. [Google Scholar] [CrossRef]
- Lycourghiotis, S.; Kordouli, E.; Bourikas, K.; Kordulis, C. The role of promoters in metallic nickel catalysts used for green diesel production: A critical review. Fuel Process. Technol. 2023, 244, 107690. [Google Scholar] [CrossRef]
- Ghatak, A.; Das, M. The Recent Progress on Supported and Recyclable Nickel Catalysts towards Organic Transformations: A Review. ChemistrySelect 2021, 6, 3656–3682. [Google Scholar] [CrossRef]
- Wang, R.; Zhang, M.; Zhang, J.; Yang, J.H. Supported Nickel-based Catalysts for Heterogeneous Hydrogenation of Aromatics. ChemistrySelect 2023, 8, e202302787. [Google Scholar] [CrossRef]
- Shi, D.C.; Wojcieszak, R.; Paul, S.; Marceau, E. Ni Promotion by Fe: What Benefits for Catalytic Hydrogenation? Catalysts 2019, 9, 451. [Google Scholar] [CrossRef]
- Lieber, E.; Morritz, F.L. The Uses of Raney Nickel. Adv. Catal. 1953, 5, 417–455. [Google Scholar] [CrossRef]
- Sun, Z.H.; Zhang, Z.H.; Yuan, T.Q.; Ren, X.H.; Rong, Z.M. Raney Ni as a Versatile Catalyst for Biomass Conversion. ACS Catal. 2021, 11, 10508–10536. [Google Scholar] [CrossRef]
- Bonomo, M.; Dini, D.; Decker, F. Electrochemical and Photoelectrochemical Properties of Nickel Oxide (NiO) with Nanostructured Morphology for Photoconversion Applications. Front. Chem. 2018, 6, 601. [Google Scholar] [CrossRef] [PubMed]
- Singh, H.; Rai, A.; Yadav, R.; Sinha, A.K. Glucose hydrogenation to sorbitol over unsupported mesoporous Ni/NiO catalyst. Mol. Catal. 2018, 451, 186–191. [Google Scholar] [CrossRef]
- Liu, L.D.; Liu, Q.; Wang, Y.; Huang, J.; Wang, W.J.; Duan, L.; Yang, X.; Yu, X.Y.; Han, X.; Liu, N. Nonradical activation of peroxydisulfate promoted by oxygen vacancy-laden NiO for catalytic phenol oxidative polymerization. Appl. Catal. B-Environ. 2019, 254, 166–173. [Google Scholar] [CrossRef]
- Gong, S.Y.; Wang, A.Q.; Wang, Y.; Liu, H.D.; Han, N.; Chen, Y.F. Heterostructured Ni/NiO Nanocatalysts for Ozone Decomposition. Acs Appl. Nano Mater. 2020, 3, 597–607. [Google Scholar] [CrossRef]
- Bikbashev, A.; Stryšovský, T.; Kajabová, M.; Kovářová, Z.; Prucek, R.; Panáček, A.; Kašlík, J.; Fodor, T.; Cserháti, C.; Erdélyi, Z.; et al. NiO Nano- and Microparticles Prepared by Solvothermal Method—Amazing Catalysts for CO2 Methanation. Molecules 2024, 29, 4838. [Google Scholar] [CrossRef] [PubMed]
- Zhu, Z.; Zhang, Y.; Liu, H.; Wei, N. Synthesis of original spherical α-Ni(OH)2 architectures by microwave-assisted hydrothermal method and their in situ thermal conversion to NiO. Superlattices Microstruct. 2012, 51, 232–238. [Google Scholar] [CrossRef]
- Morrow, G.W. Nickel(II) Peroxide. In Encyclopedia of Reagents for Organic Synthesis; John Wiley & Sons: Hoboken, NJ, USA, 2001. [Google Scholar] [CrossRef]
- Khalaji, A.D.; Grivani, G.; Izadi, S.; Ebadi, M. Facile synthesis of Ni/NiO nanocomposites via thermal decomposition. J. Nanoanalysis 2018, 5, 115–120. [Google Scholar] [CrossRef]
- Zhao, B.; Yang, Y.; Bao, J.H.; Chen, H.L. Preparation of NiO nanoparticles via thermal decomposition of nickel acetate coated by CDs. Chin. J. Inorg. Chem. 2006, 22, 952–956. [Google Scholar]
- Numan, A.; Duraisamy, N.; Omar, F.S.; Gopi, D.; Ramesh, K.; Ramesh, S. Sonochemical synthesis of nanostructured nickel hydroxide as an electrode material for improved electrochemical energy storage application. Prog. Nat. Sci.-Mater. Int. 2017, 27, 416–423. [Google Scholar] [CrossRef]
- Ata, S.; Tabassum, A.; Din, M.I.; Fatima, M.; Ghafoor, S.; Islam, A.; Ahad, A.; Bhatti, M.A. Novel Sonochemical Single Step Fabrication of NiO Nanoparticles. Dig. J. Nanomater. Biostruct. 2016, 11, 65–80. [Google Scholar]
- Ali, M.; Remalli, N.; Gedela, V.; Padya, B.; Jain, P.K.; Al-Fatesh, A.; Rana, U.A.; Srikanth, V.V.S.S. Ni nanoparticles prepared by simple chemical method for the synthesis of Ni/NiO-multi-layered graphene by chemical vapor deposition. Solid State Sci. 2017, 64, 34–40. [Google Scholar] [CrossRef]
- Chandrakala, M.; Bharath, S.R.; Maiyalagan, T.; Arockiasamy, S. Synthesis, crystal structure and vapour pressure studies of novel nickel complex as precursor for NiO coating by metalorganic chemical vapour deposition technique. Mater. Chem. Phys. 2017, 201, 344–353. [Google Scholar] [CrossRef]
- Singh, Y.; Sodhi, R.S.; Singh, P.P.; Kaushal, S. Biosynthesis of NiO nanoparticles using Spirogyra sp. cell-free extract and their potential biological applications. Mater. Adv. 2022, 3, 4991–5000. [Google Scholar] [CrossRef]
- Uddin, S.; Bin Safdar, L.; Anwar, S.; Iqbal, J.; Laila, S.; Abbasi, B.A.; Saif, M.S.; Ali, M.; Rehman, A.; Basit, A.; et al. Green Synthesis of Nickel Oxide Nanoparticles from Berberis balochistanica Stem for Investigating Bioactivities. Molecules 2021, 26, 1548. [Google Scholar] [CrossRef]
- Ningsih, S.K.W. Synthesis and Characterization of NiO Nanopowder by Sol-Gel Process. In Proceedings of the 5th International Conference on Mathematics and Natural Sciences, Bandung, Indonesia, 2–3 November 2014. [Google Scholar] [CrossRef]
- Zorkipli, N.N.M.; Kaus, N.H.M.; Mohamad, A.A. Synthesis of NiO Nanoparticles Through Sol-gel Method. In Proceedings of the 5th International Conference on Recent Advances in Materials, Minerals and Environment (RAMM) & 2nd International Postgraduate Conference on Materials, Mineral and Polymer (MAMIP), Penang, Malaysia, 4–5 August 2015; pp. 626–631. [Google Scholar] [CrossRef]
- Chen, T.; Yang, Y.; Zhao, W.Y.; Pan, D.Q.; Zhu, C.T.; Lin, F.Y.; Guo, X.Y. Solvothermal Preparation and Characterization of Nano-nickel Oxide. ACTA Chim. Sin. 2019, 77, 447–454. [Google Scholar] [CrossRef]
- Xu, J.; Wang, M.R.; Liu, Y.Y.; Li, J.; Cui, H.T. One-pot solvothermal synthesis of size-controlled NiO nanoparticles. Adv. Powder Technol. 2019, 30, 861–868. [Google Scholar] [CrossRef]
- Poimenidis, I.A.; Lykaki, M.; Moustaizis, S.; Loukakos, P.; Konsolakis, M. One-step solvothermal growth of NiO nanoparticles on nickel foam as a highly efficient electrocatalyst for hydrogen evolution reaction. Mater. Chem. Phys. 2023, 305, 128007. [Google Scholar] [CrossRef]
- Zhang, Q.; Liu, H.X.; Li, H.L.; Liu, Y.; Zhang, H.Y.; Li, T.D. Solvothermal synthesis and photocatalytic properties of NiO ultrathin nanosheets with porous structure. Appl. Surf. Sci. 2015, 328, 525–530. [Google Scholar] [CrossRef]
- Abbas, S.A.; Jung, K.D. Preparation of mesoporous microspheres of NiO with high surface area and analysis on their pseudocapacitive behavior. Electrochim. Acta 2016, 193, 145–153. [Google Scholar] [CrossRef]
- Wang, J.; Pang, H.; Yin, J.; Guan, L.; Lu, Q.; Gao, F. Controlled fabrication and property studies of nickel hydroxide and nickel oxide nanostructures. CrystEngComm 2010, 12, 1404–1409. [Google Scholar] [CrossRef]
- Su, C.; Zhang, L.; Han, Y.; Ren, C.; Chen, X.; Hu, J.; Zeng, M.; Hu, N.; Su, Y.; Zhou, Z.; et al. Controllable synthesis of crescent-shaped porous NiO nanoplates for conductometric ethanol gas sensors. Sens. Actuators B Chem. 2019, 296, 126642. [Google Scholar] [CrossRef]
- Zhang, Q.H.; Kang, J.C.; Wang, Y. Development of Novel Catalysts for Fischer-Tropsch Synthesis: Tuning the Product Selectivity. Chemcatchem 2010, 2, 1030–1058. [Google Scholar] [CrossRef]
- Adesina, A.A. Hydrocarbon synthesis via Fischer-Tropsch reaction: Travails and triumphs. Appl. Catal. A-Gen. 1996, 138, 345–367. [Google Scholar] [CrossRef]
- Ghaib, K.; Nitz, K.; Ben-Fares, F.Z. Chemical Methanation of CO2: A Review. ChemBioEng Rev. 2016, 3, 266–275. [Google Scholar] [CrossRef]
- Lee, W.J.; Li, C.E.; Prajitno, H.; Yoo, J.; Patel, J.; Yang, Y.X.; Lim, S. Recent trend in thermal catalytic low temperature CO2 methanation: A critical review. Catalysis 2021, 368, 2–19. [Google Scholar] [CrossRef]
- Molinet-Chinaglia, C.; Shafiq, S.; Serp, P. Low Temperature Sabatier CO2 Methanation. Chemcatchem 2024, 16, e202401213. [Google Scholar] [CrossRef]
- Medina, O.E.; Amell, A.A.; López, D.; Santamaría, A. Comprehensive review of nickel-based catalysts advancements for CO2 methanation. Renew. Sustain. Energy Rev. 2024, 207, 114926. [Google Scholar] [CrossRef]
- Ridzuan, N.D.M.; Shaharun, M.S.; Anawar, M.A.; Ud-Din, I. Ni-Based Catalyst for Carbon Dioxide Methanation: A Review on Performance and Progress. Catalysts 2022, 12, 469. [Google Scholar] [CrossRef]
- Wang, Z.H.; Wang, L.; Cui, Y.K.; Xing, Y.; Su, W. Research on nickel-based catalysts for carbon dioxide methanation combined with literature measurement. J. CO2 Util. 2022, 63, 102117. [Google Scholar] [CrossRef]
- Deng, H.; Chen, Z.Q.; Chen, Y.Z.; Mei, J.; Xu, W.J.; Wang, L.S.; Peng, D.L. Nickel submicron particles synthesized via solvothermal approach in the presence of organic bases: Formation mechanism and magnetic properties. Colloids Surf. A Physicochem. Eng. Asp. 2023, 661, 130971. [Google Scholar] [CrossRef]
- Jaji, N.D.; Othman, M.B.H.; Lee, H.L.; Hussin, M.H.; Hui, D. One-pot solvothermal synthesis and characterization of highly stable nickel nanoparticles. Nanotechnol. Rev. 2021, 10, 318–329. [Google Scholar] [CrossRef]
- Guo, H.; Pu, B.X.; Chen, H.Y.; Yang, J.; Zhou, Y.J.; Yang, J.; Bismark, B.; Li, H.D.; Niu, X.B. Surfactant-assisted solvothermal synthesis of pure nickel submicron spheres with microwave-absorbing properties. Nanoscale Res. Lett. 2016, 11, 352. [Google Scholar] [CrossRef]
- Shirley, D.A. High-Resolution X-Ray Photoemission Spectrum of the Valence Bands of Gold. Phys. Rev. B 1972, 5, 4709–4714. [Google Scholar] [CrossRef]
- Casa Software Ltd. CasaXPS: Processing Software for XPS, AES, SIMS. Available online: http://www.casaxps.com/ (accessed on 4 January 2025).
- Scofield, J.H. Hartree-Slater subshell photoionization cross-sections at 1254 and 1487 eV. J. Electron Spectrosc. Relat. Phenom. 1976, 8, 129–137. [Google Scholar] [CrossRef]
- Zheng, X.; Li, B.; Huang, R.; Jiang, W.; Shen, L.; Lei, G.; Wang, S.; Zhan, Y.; Jiang, L. Asymmetric Oxygen Vacancy-Promoted Synthesis of Aminoarenes from Nitroarenes Using Waste H2S as a “Hydrogen Donor”. ACS Catal. 2024, 14, 10245–10259. [Google Scholar] [CrossRef]
- Zheng, X.; Huang, R.; Li, B.; Jiang, W.; Shen, L.; Lei, G.; Wang, S.; Zhan, Y.; Wang, S.; Jiang, L. Oxygen vacancies-promoted removal of COS via catalytic hydrolysis over CuTiO2-δ nanoflowers. Chem. Eng. J. 2024, 492, 152322. [Google Scholar] [CrossRef]
- Dai, J.; Zhu, Y.; Tahini, H.A.; Lin, Q.; Chen, Y.; Guan, D.; Zhou, C.; Hu, Z.; Lin, H.J.; Chan, T.S.; et al. Single-phase perovskite oxide with super-exchange induced atomic-scale synergistic active centers enables ultrafast hydrogen evolution. Nat. Commun. 2020, 11, 5657. [Google Scholar] [CrossRef] [PubMed]
- Schmider, D.; Maier, L.; Deutschmann, O. Reaction Kinetics of CO and CO2 Methanation over Nickel. Kinet. Catal. React. Eng. 2021, 60, 5792–5805. [Google Scholar] [CrossRef]
- Zhu, J.; Cannizzaro, F.; Liu, L.; Zhang, H.; Kosinov, N.; Filot, I.A.; Rabeah, J.; Brückner, A.; Hensen, E.J. Ni–In Synergy in CO2 Hydrogenation to Methanol. ACS Catal. 2021, 11, 11371–11384. [Google Scholar] [CrossRef]
- Tangstad, E.; Andersen, A.; Myhrvold, E.M.; Myrstad, T. Catalytic behaviour of nickel and iron metal contaminants of an FCC catalyst after oxidative and reductive thermal treatments. Appl. Catal. A Gen. 2008, 346, 194–199. [Google Scholar] [CrossRef]
- Yarbaş, T.; Ayas, N. A detailed thermodynamic analysis of CO2 hydrogenation to produce methane at low pressure. Int. J. Hydrogen Energy 2024, 49, 1134–1144. [Google Scholar] [CrossRef]
- Ferrari, A.C. Raman spectroscopy of graphene and graphite: Disorder, electron–phonon coupling, doping and nonadiabatic effects. Solid State Commun. 2007, 143, 47–57. [Google Scholar] [CrossRef]
- Danaci, S.; Protasova, L.; Lefevere, J.; Bedel, L.; Guilet, R.; Marty, P. Efficient CO2 methanation over Ni/Al2O3 coated structured catalysts. Catal. Today 2016, 273, 234–243. [Google Scholar] [CrossRef]
- Usman, M.; Podila, S.; Al-Zahrani, A.A.; Alamoudi, M.A. CO2 methanation over Ni/SiO2–Al2O3 catalysts: Effect of Ba, La, and Ce addition. RSC Adv. 2025, 15, 10958–10969. [Google Scholar] [CrossRef] [PubMed]
- Nobakht, A.R.; Rezaei, M.; Alavi, S.M.; Akbari, E.; Varbar, M.; Hafezi-Bakhtiari, J. CO2 methanation over NiO catalysts supported on CaO-Al2O3: Effect of CaO: Al2O3 molar ratio and nickel loading. Int. J. Hydrogen Energy 2023, 48, 38664–38675. [Google Scholar] [CrossRef]
- Li, Z.H.; Zhao, T.T.; Zhang, L.J. Promotion effect of additive Fe on Al2O3 supported Ni catalyst for CO2 methanation. Appl. Organomet. Chem. 2018, 32, e4328. [Google Scholar] [CrossRef]
Disclaimer/Publisher’s Note: The statements, opinions and data contained in all publications are solely those of the individual author(s) and contributor(s) and not of MDPI and/or the editor(s). MDPI and/or the editor(s) disclaim responsibility for any injury to people or property resulting from any ideas, methods, instructions or products referred to in the content. |
© 2025 by the authors. Licensee MDPI, Basel, Switzerland. This article is an open access article distributed under the terms and conditions of the Creative Commons Attribution (CC BY) license (https://creativecommons.org/licenses/by/4.0/).