Abstract
Na2Ti3O7 (NTO), with low sodium insertion potential (~0.3 V vs. Na+/Na) and potential for high-energy-density batteries, is regarded as one of the most promising anode materials for sodium-ion batteries (SIBs). However, its practical application is hindered by poor electronic conductivity, sluggish Na⁺ (de)intercalation kinetics, and interfacial instability, leading to inferior cycling stability, low initial Coulombic efficiency, and poor rate capability. In this work, micron-sized rod-like NTO and Al-doped NTO (NTO-Al) samples were synthesized via a one-step high-temperature solid-state method. Al doping slightly reduced the size of NTO microrods while introducing oxygen vacancies and generating Ti3+, thereby enhancing electronic conductivity and reducing ionic diffusion resistance. H2-TPR confirms that doping activates lattice oxygen and promotes its participation in the reaction. The optimized NTO-Al0.03 electrode delivered a significantly improved initial charge capacity of 147.4 mA h g−1 at 0.5 C, surpassing pristine NTO (124.7 mA h g−1). Moreover, it exhibited the best cycling stability (49.5% capacity retention after 100 cycles) and rate performance (36.3 mA h g−1 at 2 C).
1. Introduction
Insertion-based electrodes are widely preferred in battery systems because alkali metal ions can reversibly intercalate into their layered structures without inducing significant crystallographic damage, ensuring long-term cycling stability [1,2]. The superior electrochemical behavior of insertion-type electrodes can be attributed to intercalation pseudocapacitance, where capacity retention remains stable across a wide range of current densities [3]. As a result, such electrodes typically exhibit outstanding cycling durability and high-rate performance. However, the selection of suitable anode materials for insertion-type sodium-ion batteries (SIBs) remains limited. Unlike in lithium-ion batteries (LIBs), many high-rate electrode materials fail to deliver comparable performance in SIBs due to the larger ionic radius of Na+, which hinders efficient ion transport and storage [4].
Na2Ti3O7 (NTO) is a potential insertion-type anode for sodium-ion batteries, as its layered TiO6 octahedral framework enables reversible Na+ intercalation with a theoretical capacity of 178 mAh g−1 [5,6]. Notably, NTO exhibits a low redox plateau at 0.3 V, representing the first oxide-based material capable of sodium storage at such a low potential [7]. However, its poor electronic conductivity restricts achievable capacity, falling short of theoretical values and underperforming compared to hard carbons or organic anodes [8,9]. Furthermore, rapid capacity decay during prolonged cycling hinders its practical viability in SIBs [10]. Therefore, improving the intrinsic conductivity of NTO remains a critical challenge for advancing its electrochemical performance.
The design of nanostructure, doping, and nanocomposites were normally strategies to address the above challenges [11,12,13]. Among them, the introduction of defects or dopant ions into the crystal structure enables precise control over both bulk and surface architectures [14], thereby enhancing the intrinsic ionic and electronic conductivity of active materials [15,16,17,18,19]. This structural modification facilitates more efficient and rapid sodium-ion storage. It is reported that n-type dopants can enhance conductivity by providing excess electrons and partially reducing Ti4+ to Ti4+ [20]. When p-type lanthanide doping is employed, oxygen vacancies are readily introduced, thereby improving the electrochemical performance of NTO [21]. As demonstrated by Pak et al., the presence of defect structures can reduce the activation energy for Na+ migration along the 1D [010] pathway within the interlayer space to below 0.4 eV [22]. In the TiO2 production process, titanyl sulfate (TiOSO₄) forms as an intermediate product, which undergoes hydrolysis to yield metatitanic acid. The industrial-grade TiOSO4 solution pre-hydrolysis typically contains multiple impurity ions, such as Ca, Mg, Al, and Si [23,24]. Given the cost-effectiveness considerations for NTO doping, investigating these naturally occurring impurity ions from upstream precursors for NTO modification represents a promising strategy.
Inspired by the above, Al3+ (0.535 Å) and Ca3+ (1.00 Å,) were selected as dopants for Ti4+ sites (0.605 Å) based on their ionic radii and anticipated defect chemistry. The smaller Al3+ could enable stable substitution at Ti4+ sites with reduced lattice distortion, while the larger Ca2+ induces controlled lattice expansion to facilitate Na+ diffusion. In this work, a series of Al- and Ca-doped NTO electrode materials (NTO-Al and NTO-Ca) were first synthesized, with their cycling stability and rate capability systematically evaluated. The results demonstrated superior performance enhancement from Al doping compared to Ca doping. The Al-doped NTO was then selected for in-depth investigation, where XRD, TEM, and XPS characterizations revealed its modified lattice structure, optimized morphology, and altered surface chemistry. Further mechanistic studies through dQ/dV curve analysis, GITT measurements, and EIS testing provided critical insights into the improved sodium-ion diffusion kinetics and enhanced charge transfer properties induced by Al doping.
2. Materials and Methods
2.1. Materials
Anatase TiO2 (99.0%) and sodium carbonate (Na2CO3, ≥99.0%, AR grade) were purchased from Sinopharm Chemical Reagent Co., Ltd. (Shanghai, China). Aluminum oxide (Al2O3, ≥99.99%) was purchased from Kelong Chemical Reagent Company (Chengdu, China). Anhydrous ethanol (C2H5OH, AR grade) was purchased from Chengdu Jinshan Chemical Reagent Co., Ltd. (Chengdu, China). Polyvinylidene fluoride (PVDF, battery grade) was purchased from Taiyuan Lizhiyuan Battery Materials (Taiyuan, China). N-Methylpyrrolidone (NMP, ≥99.0%, AR grade) and Super P (battery grade) were purchased from Guangdong Zhuguang New Energy Technology Co., Ltd. (Guangzhou, China). Carboxymethyl cellulose (CMC, AR grade) was purchased from Aladdin Reagent Co., Ltd. (Shanghai, China). Styrene-butadiene rubber (SBR, AR grade) was purchased from Shanghai Huiping Chemical Co., Ltd. (Shanghai, China). Dimethyl carbonate (DMC, AR grade), NC-009 electrolyte (NaClO4/EC+DEC (1:1 v/v), battery grade), and NP-035 electrolyte (NaPF6/DME (100%), battery grade) were purchased from Suzhou Duoduo Chemical Technology Co., Ltd. (Suzhou, China). Copper foil (9 μm × 170 mm), corundum crucible, and quartz tube were purchased from Guangdong Kelude New Energy Technology Co., Ltd. (Guangzhou, China). Glass fiber (GF/D) was purchased from Whatman Ltd. (Maidstone, UK). Coin cell casings (CR2025) were purchased from Shenzhen Kejing Technology Co., Ltd. (Shenzhen, China). High-purity argon gas (Ar, ≥99.9995%, v/v) was purchased from Sichuan Jinrui Gas Co., Ltd. (Chendu, China). Deionized water (H2O, AR grade) was prepared in-house.
2.2. Preparation of NTO, NTO-Al, and NTO-Ca Anode
All NTO and NTO-Al doped samples were synthesized via the identical solid-state reaction method. Typically, 1.02 g of Na2CO3 and 2.20 g TiO2 (with slight Na2CO3 excess relative to stoichiometric ratio) were manually ground with ~3 mL ethanol for 30 min. For Ca- or Al-doped NTO, predetermined amounts of Al2O3 or CaCO3 were introduced prior to grinding. The homogenized powder mixtures were then calcined in a tube furnace at 900 °C for 15 h under static air, with controlled heating/cooling rates of 5 °C min−1. According to previous reports, there are two possible substitution sites in sodium transition metal oxide materials: the transition metal site (Ti site) and the Na site. Based on ionic radius considerations, Al3+ (0.53 Å) has a closer ionic radius to Ti4+ (0.61 Å), suggesting Al likely occupies Ti sites, while Ca2+ (0.99 Å) closely matches Na+ (1.02 Å), indicating Ca preferentially substitutes Na sites. Therefore, according to the stoichiometric ratio of guest ions, the Al-doped samples were designated as Na2Ti3-xAlxO7 (NTO-Alx, x = 0.01, 0.03, and 0.05), and the Ca-doped samples as Na2-yCayTi3O7 (NTO-Cay, y = 0.02, 0.04, 0.06, 0.08, and 0.10).
2.3. Preparation of Electrode and Cell
The electrode slurry was prepared by blending the active material (70 wt%), Super P carbon (20 wt%), and PVDF binder (10 wt%) in N-methyl-2-pyrrolidone (NMP) solvent, followed by coating onto copper foil current collectors. The coated electrodes were dried at 90 °C for 12 h prior to cell assembly. The battery assembly was conducted in an argon-filled glovebox with oxygen and water contents maintained below 0.5 ppm. CR2025 coin cell hardware was used for the assembly. The positive electrode shell was first placed flat on the working surface, followed by careful placement of the pre-weighed electrode disk at its exact center. A glass fiber separator was then positioned over the electrode, and an appropriate amount of electrolyte was dispensed. For half-cells, a freshly cut sodium metal disk was used as the counter electrode before sealing the negative shell. The cells were crimped at 0.65 MPa pressure using a hydraulic crimper. After removal from the glovebox, the assembled cells were allowed to stabilize for at least 12 h prior to electrochemical testing.
2.4. Electrochemical Performance
Differential capacity (dQ/dV) curves were derived from smoothed GCD data to identify voltage plateaus, with peaks matching those in CV. A wider differentiation interval (k > 1) reduced noise while preserving resolution. Measurements used a Neware BTS-610 system (2.5–0.01 V vs. Na/Na+). CV tests (LK 9805 workstation, Tianjin, China) were performed at 0.01–2.5 V (vs. Na+/Na) with varying scan rates. The pseudocapacitive contribution was quantified by fitting scan-rate-dependent CV curves. GITT (CT2001A LANHE workstation, Wuhan, China) applied 17.7 mA g−1 pulses (10 min) followed by 1 h rests. Diffusion coefficients were calculated from potential relaxation data. All tests were at 25 °C.
2.5. Hydrogen Programmed Temperature Reduction (H2-TPR)
The experimental procedure was as follows: First, 100 mg of the sample was weighed and placed in a U-shaped quartz tube. The temperature was raised from room temperature to 200 °C at a rate of 10 °C min−1 for drying pretreatment. The sample was purged with He gas (50 mL min−1) for 1 h, cooled to 50 °C, and then exposed to a 10% H2/Ar mixture (50 mL min−1) for 0.5 h until baseline stabilization. Subsequently, the temperature was increased to 900 °C at 10 °C min−1 under the same gas flow for desorption, while a thermal conductivity detector (TCD) monitored the signals of reduced gases.
2.6. Charactrization
A field-emission scanning electron microscope (FE-SEM; JEOL JSM-7500F, Tokyo, Japan) was used to observe the morphology and elemental distribution of the samples after heat treatment. X-ray diffraction (XRD) measurements were performed on a Bruker D8 Advance diffractometer with Cu Kα radiation (λ = 1.5406 Å). Fourier-transform infrared spectroscopy (FTIR) was conducted using a Bruker R200-L spectrometer. Raman spectra were acquired on a Thermo DXRxi instrument with a 532 nm laser. X-ray photoelectron spectroscopy (XPS) was performed on a Thermo Scientific K-Alpha+ spectrometer (Al Kα excitation source). The binding energy scale was calibrated using the C 1s peak (284.8 eV). The microstructure of the samples was examined by transmission electron microscopy (TEM; FEI Talos F200 S). The component of Ti and Al was detected by the inductively coupled plasma-optical emission spectrometer (ICP-OES, Thermo Fisher Scientific Inc., Waltham, MA, USA).
3. Results and Discussion
The XRD patterns of all samples were collected as shown in Figure S1. The XRD patterns of NTO and NTO-Alx (Figure S1a) show that all diffraction peaks can be indexed to a monoclinic structure with space group P21/m (PDF card No. 72-0148), confirming the layered NTO crystal structure [25]. The sharp peaks indicate high crystallinity achieved through high-temperature calcination. The strongest peak at ~10.52° corresponds to the (100) plane with an interlayer spacing of 0.84 nm [26]. No impurity peaks (e.g., TiO2 or Al2O3) were detected, suggesting successful Al incorporation into the NTO lattice. The NTO-Cay samples also match well with the NTO pattern (Figure S1b). However, a small amount of Na2Ti6O13 (PDF No. 73-1398) was detected in NTO-Ca0.02 [27]. The entry of Ca into Na sites leads to less Na in the sample, which is consistent with the lower Na content of Na2Ti6O13 compared to Na2Ti3O7 [28].
The cycling performance of all samples was further investigated at 0.5 C for 100 cycles (Figure S2). The related capacity in initial and 100th cycles are displayed in Figure S2c. The Ca-doped samples did not significantly improve the first-cycle reversible capacity of NTO but enhanced cycling stability. Specifically, the reversible capacity after 100 cycles increased from 57.1 mA h g−1 for pristine NTO to 70.9 mA h g−1 for the optimal Ca-doped sample (NTO-Ca0.06). In contrast, Al doping improved the initial reversible capacity, increasing it from 124.7 mA h g−1 (NTO) to 147.4 mA h g−1 for the best-performing Al-doped sample (NTO-Al0.03), leading to a higher 100 cycle capacity of 72.9 mA h g−1. The related rate performance is shown in Figure S3. Clearly, NTO-Cay electrodes show a relatively low capacity at various current density compared with NTO, which could be ascribed to that Ca doping has a negative impact on the migration barrier of Na. Notably, NTO-Al0.03 delivered a superior rate performance. Thus, the Al-doped samples were selected for further investigation. Compared with the previous reported anode, NTO-Al0.03 delivered a good electrochemical performance [29,30,31].
The crystal structure of NTO is illustrated in Figure 1a, where TiO6 octahedra (composed of central Ti atoms and surrounding O atoms) form zigzag layers through edge-sharing connections. Na+ ions are intercalated between these layers, occupying two distinct sites. While ionic bonds form between Na+ ions and TiO6 octahedra, the octahedral framework itself maintains strong covalent bonding, constituting the Na2Ti3O7 structure. Notably, identifying the doping sites is crucial for understanding how crystal structure influences the electrochemical performance of NTO anode materials. The incorporation of Al3+ into the NTO lattice is particularly important due to the valence differences among Na+, Al3+, and Ti4+. Charge balance considerations suggest that Al substitution at different sites would lead to varying stoichiometric ratios of Al, Na, and Ti. To verify the precise chemical position of Al3+ doping, an ICP elemental analysis was performed. Although the Na content could not be accurately determined due to its instability during ICP testing, Table S1 presents the mass percentages of Al and Ti along with their molar ratios. The observed Ti/Al ratio trends align well with theoretical predictions for Ti-site doping, consistent with ionic radius considerations. Figure 1b displays the Raman spectra of different samples. Characteristic peaks were observed at 81 cm−1 (Na1), 299 cm−1 (O2-Ti2-O3 vibration), 845 cm−1 (Ti1-O4 stretching vibration), and 881 cm−1 (O3-Ti2-O5 symmetric stretching) [32,33]. Using the strongest peak at 299 cm−1 as a reference, Table S2 compares the relative intensities of these prominent peaks. The results show that NTO-Al0.05 maintains vibrational modes most similar to pristine NTO, while NTO-Al0.03 exhibits the most significant reduction in O3-Ti2-O5 symmetric stretching intensity. This phenomenon can be attributed to altered bond energies resulting from Ti-O-Al configurations.
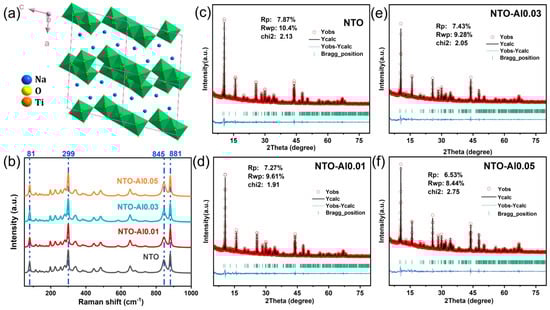
Figure 1.
(a) Schematic of the crystal structure of Na2Ti3O7, (b) Raman spectra of the as-synthesized NTO and Al doping samples, (c–f) Rietveld refinement of NTO, NTO-Al0.01, NTO-Al0.03, and NTO-Al0.05.
To obtain further insights into the crystal structure of the samples, Rietveld refinement was performed on the XRD patterns [34]. The refinement profiles (Figure 1c–f) present the experimentally observed and calculated difference patterns for four representative samples, with the corresponding refinement results summarized in Table S3. The refinements were conducted using the FullProf software (June 2020 version) suite, and the relatively small values of Rwp and χ2 confirm the reliability of the refinement results [35]. Comparative analysis of the unit cell parameters obtained from XRD refinement revealed systematic variations induced by Al doping. The unit cell volume initially decreased and then increased with higher doping concentrations. The initial volume contraction can be attributed to the smaller ionic radius of Al3+ (0.53 Å) compared to Ti4+ (0.61 Å), while the stronger Al-O bond energy may also contribute to this slight structural shrinkage. The evolution of lattice parameters (a, b, c) showed less obvious trends. For NTO-Al0.01 and NTO-Al0.03, the volume reduction primarily resulted from decreases in the a and c parameters, whereas the subsequent volume expansion in NTO-Al0.05 was also dominated by changes in these same directions. The significant parameter variations in NTO-Al0.05 likely reflect overdoping effects, as they deviate from theoretical predictions for Al3+ substitution. Notably, examination of the β angles revealed that NTO-Al0.03 exhibited the largest value among all samples, indicating that optimal Al doping induces measurable lattice distortion in NTO. The potential impact of this structural modification on electrochemical performance requires further investigation in subsequent analyses.
The SEM images (Figure S4) display the surface microstructures of pristine NTO and Al-doped NTO samples (NTO-Al0.01, NTO-Al0.03, and NTO-Al0.05). Low-magnification images reveal irregular aggregates with randomly stacked morphologies, characteristics of conventional solid-state synthesis, and inherited precursor features. High-resolution observations show all samples possess nanorod-like structures several micrometers in length, though with slight variations in width and surface roughness, where the rods appear coated with fine particulate debris. Notably, while NTO-Al0.01 to NTO-Al0.03 maintain similar morphologies, with only marginal nanorod size reduction at higher doping levels, NTO-Al0.05 exhibits more irregular rods with non-uniform dimensions. This size refinement suggests Al doping may elevate oxide surface energy, slightly inhibiting crystal growth during calcination. The resultant smaller grain size and increased surface area could enhance electrochemical performance by shortening Na+ diffusion paths, reducing volume strain during (de)intercalation, and providing additional active sites.
To further investigate the microstructure of the samples, Figure 2 presents TEM images of NTO and NTO-Alx particles. All samples exhibit rod-like particle structures with well-defined crystalline regions (Figure 2i–l). The HRTEM images (Figure 2a–d) reveal distinct lattice fringes, while the corresponding inverse fast Fourier transform (IFFT) images and line profiles (Figure 2e–h) provide accurate measurements of the d-spacings. For undoped NTO, the IFFT image shows an interplanar spacing of 0.3495 nm, matching the (110) plane of Na2Ti3O7 as calculated by Bragg’s law (2dsin θ = nλ) [36]. Similarly, the NTO-Al0.01 sample exhibits an average fringe spacing of 0.3162 nm, corresponding to the (111) plane of Na2Ti3O7, while the NTO-Al0.03 sample displays a spacing of 0.3618 nm, consistent with the (102) plane [37]. The NTO-Al0.05 sample shows a spacing of 0.2968 nm, aligning with the (003) plane [38]. Notably, the HRTEM images did not capture the (100) plane, which corresponds to the strongest XRD peak, due to the random orientation of the small regions analyzed in TEM and the challenges in resolving larger d-spacings in IFFT patterns, where reciprocal lattice points are more densely packed and harder to distinguish. Consequently, TEM analysis could not provide consistent comparisons of specific crystallographic planes across different doped samples. Finally, EDX mapping confirms the uniform distribution of Na, Ti, and O in all samples, along with homogeneous Al dispersion in the doped samples, indicating successful incorporation of Al into the Na2Ti3O7 crystal structure, in agreement with the XRD results.
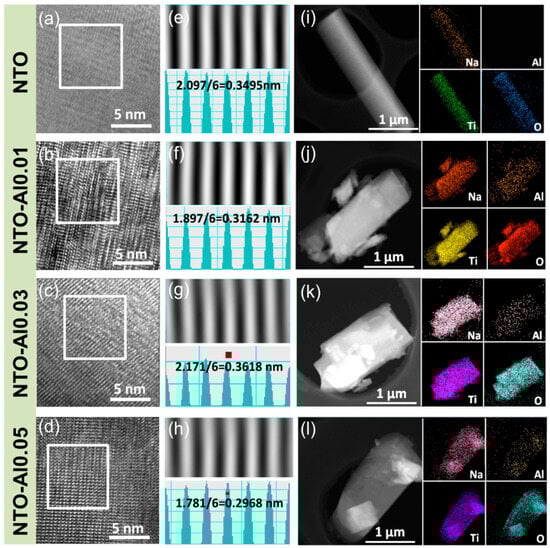
Figure 2.
(a–d) HRTEM images of NTO-Alx (x = 0, 0.01, 0.03, 0.05) samples, (e–h) inverse FFT images of each sample and their corresponding line profiles, (i–l) STEM images and related EDX elemental maps for Na, O, Ti, and Al taken from the same zone of STEM images with the scale bar being 1 μm.
To gain deeper insights into the influence of Al doping on the chemical composition and electronic states of NTO materials, XPS analyses were conducted on both undoped and doped samples. High-resolution spectra of Ti2p, O1s, C1s, and Al2p were collected. As shown in Figure 3a, the Ti2p spectrum of pristine NTO exhibits two characteristic peaks at 458.1 eV (Ti2p3/2) and 463.8 eV (Ti2p1/2), with a spin–orbit splitting of 5.7 eV, confirming the dominant presence of Ti4+ [39]. In contrast, the Al-doped sample NTO-Al0.01 displays additional small peaks at lower binding energies (457.6 eV for Ti2p3/2 and 463.3 eV for Ti2p1/2), indicating partial reduction of Ti4+ to Ti3+ upon Al doping [40]. The Ti2p spectra of NTO-Al0.01 were thus deconvoluted into two components, with the lower-energy peaks assigned to Ti3+ [41]. Similarly, NTO-Al0.03 and NTO-Al0.05 also exhibit Ti3+ signatures, with NTO-Al0.03 showing the most pronounced Ti3+ contribution, suggesting a higher concentration of reduced Ti species in this sample. In the O1s region (Figure 3b), the partial reduction of Ti4+ induces a shift in oxygen vacancy-related peaks toward higher binding energies. The O1s spectrum of undoped NTO was fitted with three peaks at 529.6 eV (O-Ti bonds), 531.2 eV (O-Na bonds), and 534.9 eV (Na Auger peak). The doped samples exhibit an additional small peak at a slightly higher binding energy than the O-Ti peak, attributed to oxygen vacancies. According to the Kröger–Vink notation, the substitution of Ti4+ by lower-valent Al3+ in Na2Ti3O7 necessitates the formation of oxygen vacancies to maintain charge neutrality while preserving the original crystal structure. These oxygen vacancies increase electron density around Ti ions, lowering their binding energy and facilitating the generation of Ti3+. The presence of oxygen vacancies enhances carrier density and improves electrical conductivity [42], which is crucial for electrochemical performance. The Al 2p peak appears as a single symmetric peak, characteristic of Al3+ in oxides, with no observable spin–orbit splitting (Figure 3c) [43]. The intensity of the Al 2p peak increases with higher Al2O3 doping levels, confirming the incorporation of Al3+. However, while NTO-Al0.05 exhibits the highest Al3+ content, it does not show the highest Ti3+ or oxygen vacancy concentrations. Combined with XRD refinement results, this suggests that excessive Al doping may lead to unfavorable lattice distortions. In contrast, NTO-Al0.03 demonstrates an optimal balance, with the highest Ti3+ and oxygen vacancy concentrations, likely due to the compensation effect of Ti3+ (ionic radius: 0.67 Å) for the smaller Al3+ ions, mitigating lattice mismatch. In conclusion, controlled Al doping introduces beneficial Ti3+ and oxygen vacancies, significantly enhancing the electronic conductivity of NTO anodes. NTO-Al0.03 represents the optimal doping level, where the synergistic effects of Ti3+ and oxygen vacancies improve charge transport without inducing detrimental structural changes.
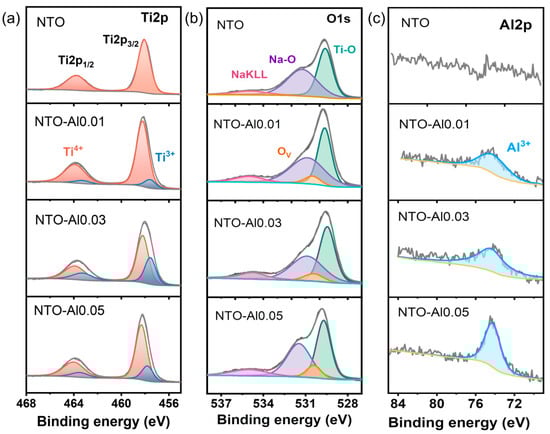
Figure 3.
XPS spectra taken from the NTO-Alx (x = 0, 0.01, 0.03, and 0.05) samples of (a) Ti 2p spectra, (b) O 1s spectra, and (c) Al 2p spectra.
Figure 4a demonstrates the electrochemical performance of Al-doped NTO samples at 0.5 C. The initial charge capacities of NTO-Al0.01 and NTO-Al0.03 reach 147.1 and 147.4 mA h g−1, respectively, slightly higher than NTO-Al0.05 (140.9 mA h g−1) and significantly exceeding pristine NTO (124.7 mA h g−1). This confirms that Al doping effectively increases active sites in NTO materials to enhance reversible capacity. Correspondingly, the initial Coulombic efficiency (ICE) improves from 57.7% for NTO to 61.5% (NTO-Al0.01), 62.4% (NTO-Al0.03), and 61.6% (NTO-Al0.05). After 100 cycles at 0.5 C, the capacity retention follows the order: NTO-Al0.03 (49.5%) > NTO-Al0.01 (47.6%) > NTO (45.8%) > NTO-Al0.05 (43.3%). Although all samples show relatively low cycling stability due to intrinsic limitations of NTO materials, NTO-Al0.03 maintains a superior discharge capacity of 72.9 mA h g−1 at the 100th cycle compared to 57.1 mA h g−1 for pristine NTO. Notably, NTO-Al0.05 shows slightly worse retention than undoped NTO, indicating that while Al doping inherently enhances stability, excessive doping (NTO-Al0.05) adversely affects cycling performance. Figure 4b presents rate performance of NTO-Al0.01 and NTO-Al0.03 (10 cycles per rate). While both demonstrate similar capacities below 0.5 C, NTO-Al0.03 exhibits significantly higher capacity at ≥1 C rates (e.g., 36.3 vs. 20.85 mA h g−1 at 2 C). As shown in Figure 4c,d, NTO-Al0.03 maintains distinct voltage plateaus even at 2C, whereas NTO-Al0.01 nearly loses this feature. When returning to 0.1C, both samples recover similar capacities, but NTO-Al0.03 shows a slight capacity increase during 5C cycling, while NTO-Al0.01 displays gradual degradation. The superior rate performance of NTO-Al0.03 correlates with its higher oxygen vacancy concentration (confirmed by XPS), which enhances electronic conductivity.
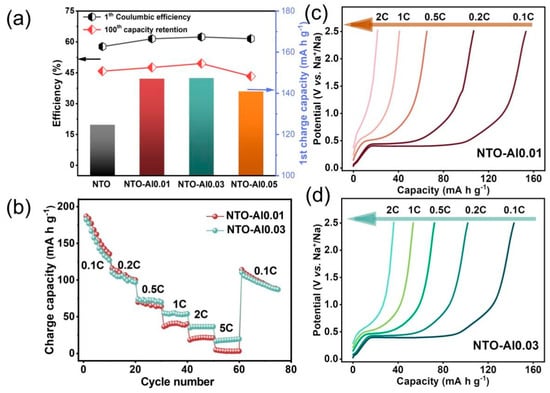
Figure 4.
(a) Comparison chart of ICE, capacity retention rate, and first charge capacity; (b) rate performance of the NTO-Al0.01 and NTO-Al0.03 samples; the charge curves of (c) NTO-Al0.01 and (d) NTO-Al0.03.
Figure 5a shows the charge/discharge curves of different samples during cycling. All samples lose part of their voltage plateaus quickly in the first 10 cycles, then show slower capacity fading later. To understand their storage mechanisms better, we analyzed the differential capacity (dQ/dV) curves in Figure 5b. The reduction peaks (sodiation) are stronger than oxidation peaks (desodiation) for all samples, meaning Na2Ti3O4 (NTO) materials have faster reduction than oxidation. In the first cycle, besides the irreversible peak at 0.3–0.6 V (from electrolyte decomposition and SEI formation), all samples show two clear oxidation and reduction peaks. These come from two different Na storage sites in NTO: A low-voltage site (~0.31 V for oxidation) that works fast but stores less energy, and a high-voltage site (~0.39 V for oxidation) that stores more energy but works slower. In Al-doped samples, the high-voltage peak (~0.39 V) becomes much stronger than the low-voltage one (~0.31 V). This suggests Al doping helps Na ions move more easily in NTO. The peak positions stay almost the same for all samples, except small changes in the first-cycle reduction peak. With more Al doping, the reduction voltage shifts slightly higher. By the 10th cycle, the low-voltage reduction peak (~0.05 V) almost disappears, and its matching oxidation peak (~0.31 V) becomes very weak. The higher-voltage peaks (~0.17 V reduction and ~0.39 V oxidation) stay stronger, but NTO and NTO-Al0.05 show weaker peaks than NTO-Al0.01 and NTO-Al0.03. This means Al doping changes the NTO structure during cycling, affecting the Na+ deintercalation/intercalation behavior.
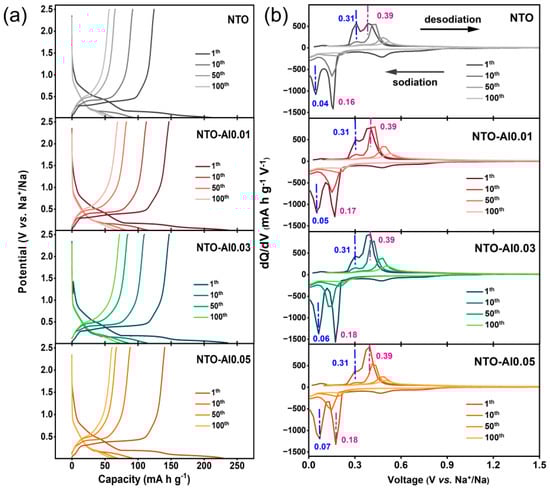
Figure 5.
(a) Charge/discharge curves and (b) corresponding dQ/dV curves of NTO-Alx (x = 0, 0.01, 0.03, 0.05) samples at 88.5 mA g−1 current during 100 cycles.
Figure 6a presents the potential response of electrodes during GITT measurements after one cycle at 0.2C. The potential variation during each relaxation period reflects the overpotential at different sodiation/desodiation stages. Notably, NTO-Al0.03 exhibits smaller overpotentials than pristine NTO at the same voltage, particularly in higher voltage ranges, indicating superior kinetic properties. The calculated Na⁺ diffusion coefficients (DNa) are shown in Figure 6b. Both electrodes initially show decreasing DNa values during sodiation (above the plateau voltage), corresponding to the sloping region of discharge curves. As sodiation progresses, the material transitions from single-phase to two-phase coexistence, leading to varied diffusion behaviors. The sharp DNa drop at plateau voltages occurs because Na+ must overcome repulsive charge gradients from pre-inserted ions for further diffusion. During desodiation, DNa generally decreases with reduced Na content, except at the desodiation plateau.
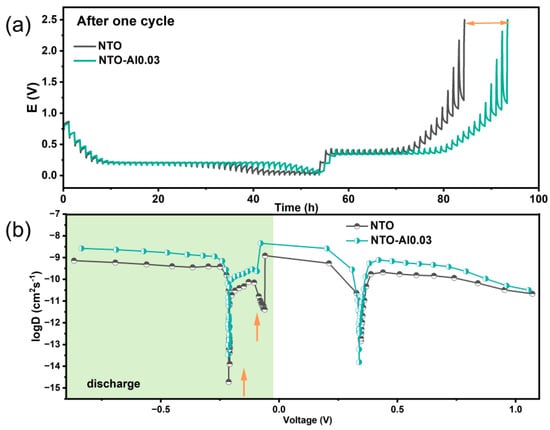
Figure 6.
(a) GITT profiles and (b) calculated Na-ion diffusion coefficients during the two cycles at 0.2 C current of the NTO and NTO-Al0.03.
Despite similar trends, NTO-Al0.03 demonstrates DNa values at least one order of magnitude higher than NTO in non-plateau regions, attributed to Al doping-induced oxygen vacancies that facilitate faster Na+ migration. Notably, at the desodiation plateau, NTO-Al0.03 shows lower DNa, suggesting deeper and more reversible Na+ extraction, consistent with its higher charge capacity. Two distinct voltage regions (marked by arrows) in NTO exhibit particularly low DNa during sodiation. Since DNa depends not only on sodiation degree (e.g., vacancy concentration) but also phase transitions and lattice/electronic changes, these regions likely reflect unfavorable reduction reactions caused by poorer electronic conductivity in undoped samples, leading to irreversible Na⁺ trapping.
Electrochemical impedance spectroscopy (EIS) was used to further analyze the effect of Al doping on electrode impedance. Before EIS testing, all half-cells underwent complete charge/discharge cycles and reached equilibrium at their end-of-charge voltage. Figure 7a,b show the Nyquist plots of NTO and NTO-Al0.03 electrodes after two and ten cycles. The impedance spectra consist of overlapping semicircles in the high-to-medium frequency region and a straight line in the low-frequency region, which were analyzed using the simplified equivalent circuit model shown in the Figure 7a inset. The intercept at the Zre axis in the high-frequency region corresponds to the ohmic resistance (Rs), representing the resistance of the electrolyte and electrodes [44,45]. The semicircles in the high-to-medium-frequency range represent the SEI film resistance (RSEI) and charge transfer resistance (Rct), while the constant phase element (CPE) in parallel represents the double-layer capacitance and SEI film capacitance. The sloping line in the low-frequency region indicates the Warburg impedance (Zw), which is related to sodium ion diffusion within NTO particles. The plots clearly show that both NTO and NTO-Al0.03 samples exhibit increased resistance from 2 to 10 cycles.
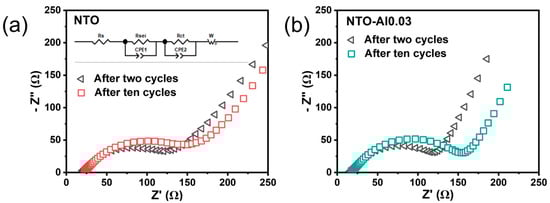
Figure 7.
The Nyquist plots of (a) the NTO cells and (b) the NTO-Al0.03 cells after two cycles and ten cycles; inset figure is the equivalent circuit.
For more detailed comparison, Table S4 lists the specific resistance values obtained from equivalent circuit fitting. The Rs values of these samples show little difference, indicating that Al doping and cycling numbers did not significantly affect the electrolyte–electrode interaction, as expected from using identical electrode formulations and electrolytes. The Rsei and Rct values show slight variations, and NTO exhibits higher resistance (100.0 Ω) than NTO-Al0.03 (85.5 Ω) after two cycles, but after ten cycles, the resistance of the pristine NTO shows a slight decrease (81.0 Ω), whereas that of NTO-Al0.03 exhibits a moderate increase (113.2 Ω), possibly due to increased interface resistance caused by slightly reduced particle size in NTO-Al0.03. The Zw values constitute a major portion of the total resistance (Rtotal), demonstrating that ion diffusion is a critical step in the entire (de)intercalation process. The smaller Zw values of NTO-Al0.03 at both two (74.8 Ω) and ten (88.7 Ω) cycles, along with its much slower resistance increase compared to NTO, indicate that Al doping effectively enhances ion and electron transfer kinetics at the electrode. These results confirm that appropriate Al doping reduces electrode resistance and represents an effective approach to improve the electrochemical activity of NTO materials.
For NTO electrodes, sodium insertion/extraction follows a phase transition mechanism where multiple phases coexist during discharge/charge processes, with the electrode performance closely related to the Ti3+/Ti4+ redox characteristics. A H2-TPR analysis was conducted to examine the reduction capability from Ti4+ to Ti3+ in both NTO and NTO-Al0.03. As shown in Figure 8, Peak1 corresponds to surface oxygen while Peak2 represents lattice oxygen. After doping, both peaks shift to lower temperatures (Peak1 from 294 °C to 248 °C; Peak2 from 554 °C to 410 °C), indicating that Al doping activates lattice oxygen and enhances its participation in reactions. The lower reduction temperatures of NTO-Al0.03 demonstrate that Al doping facilitates the reduction of Ti4+ to Ti3+, thereby improving the redox reaction kinetics of the electrode.
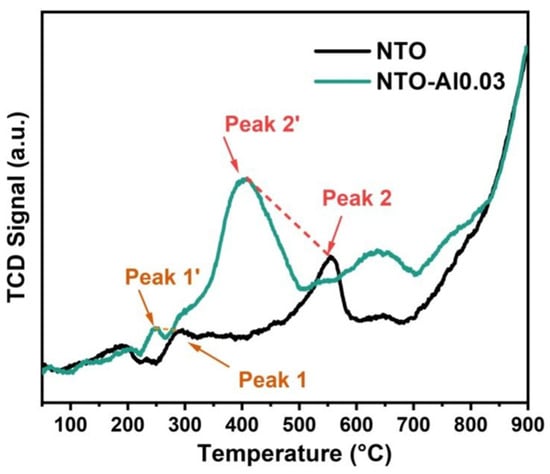
Figure 8.
The H2-TPR diagrams of NTO and NTO-Al0.03 samples.
4. Conclusions
This work proposed an Al- and Ca-doped NTO electrode materials using a one-step solid-state synthesis method. We successfully prepared Al-doped NTO-Alx (x = 0.01, 0.03, 0.05) and Ca-doped NTO-Cay (y = 0.02, 0.04, 0.06, 0.08, and 0.10) samples, with comprehensive characterization confirming effective Al or Ca incorporation into the NTO lattice. The Ca-doped samples did not significantly improve the first-cycle reversible capacity of NTO but enhanced cycling stability. After 100 cycles, optimized NTO-Ca0.06 only delivered a capacity of 70.9 mA h g−1. The optimal NTO-Al0.03 sample demonstrated enhanced electrochemical performance, delivering a higher initial charge capacity (147.4 vs. 124.7 mA h g⁻1 for pristine NTO at 0.5C), improved cycling stability (49.5% capacity retention after 100 cycles), and better rate capability (36.3 mA h g−1 at 2 C). Detailed mechanistic investigations revealed that Al doping facilitated faster Na+ diffusion through the formation of oxygen vacancies and reduced charge-transfer resistance while simultaneously stabilizing the host structure during cycling. These findings demonstrate that controlled Al doping can effectively improve both the capacity and kinetics of NTO anode materials for sodium-ion battery applications. However, while Al doping effectively enhances electronic conductivity, it fails to sufficiently suppress the structural degradation in NTO anodes, and NTO-Alx exhibited an unsatisfied cycling stability. Future optimization should employ integrated approaches combining interface engineering (e.g., carbon coating/artificial SEI), electrolyte modification, and nanostructural design to concurrently address interfacial instability and mechanical failure.
Supplementary Materials
The following supporting information can be downloaded at https://www.mdpi.com/article/10.3390/nano15120885/s1, Figure S1: XRD patterns of NTO and doping samples; Figure S2: Cycle performance of NTO with (a) Al doping samples, (b) Ca doping samples, (c) cycle performance comparison of all samples; Figure S3: (a) Rate performance of NTO and doping samples, (b) rate capacity comparison of all samples; Figure S4: SEM images of NTO-Alx (x = 0, 0.01, 0.03, and 0.05) samples; Table S1: Elemental analysis based on ICP results and theoretical results; Table S2: The ratio of Raman peak intensities of Na2Ti3O7 and doping samples; Table S3: The refinement results from XRD patterns of Na2Ti3O7 and doping samples; Table S4: The impedance values of NTO and NTO-Al0.03 samples based on equivalent circuit fitting.
Author Contributions
Conceptualization, Y.W., C.X.; formal analysis, C.W.; writing—original draft preparation, C.W., K.S., Y.X., J.C.; writing—review and editing, Y.W., C.X., Y.C., J.C., C.H.; visualization, Y.W., C.X.; supervision, Y.W., C.X. All authors have read and agreed to the published version of the manuscript.
Funding
The authors are grateful for the financial support provided by the Sichuan Provincial Science and Technology Support Program (2025ZNSFSC0966).
Data Availability Statement
Data are contained within the article.
Acknowledgments
We acknowledged Sheng Liu from Shiyanjia Lab (http://www.shiyanjia.com) for XPS measurement.
Conflicts of Interest
Authors Chen Wu, Kejing Song, Yongda Cao and Chenzhi Huang were employed by PetroChina Southwest Oil & Gasfield Company. The remaining authors declare that the research was conducted in the absence of any commercial or financial relationships that could be construed as a potential conflict of interest.
References
- Xu, C.; Chen, J.; Feng, G.; Chen, Z.; Yang, W.; Yang, C.; Shmatova, O.; Hu, Y.-S.; Zhao, J. A novel KTP-type NaTiPO4F electrode material for high-performance Na-ion batteries. Energy Storage Mater. 2025, 76, 104156. [Google Scholar] [CrossRef]
- Xu, C.; Liu, Y.; Han, S.; Chen, Z.; Ma, Y.; Guo, Q.; Zhang, P.; Yang, W.; Yang, C.; Zhao, J.; et al. Rational Design of Aqueous Na Ion Batteries Toward High Energy Density and Long Cycle Life. J. Am. Chem. Soc. 2025, 147, 7039–7049. [Google Scholar] [CrossRef]
- Chen, X.; Li, J.; Gao, Z.; Qian, D.; Waterhouse, G.I.N.; Liu, J. Deeper Insights into the Morphology Effect of Na2Ti3O7 Nanoarrays on Sodium-Ion Storage. Small 2024, 20, 2400845. [Google Scholar] [CrossRef]
- Cao, Y.; Ye, Q.; Wang, F.; Fan, X.; Hu, L.; Wang, F.; Zhai, T.; Li, H. A New Triclinic Phase Na2Ti3O7 Anode for Sodium-Ion Battery. Adv. Funct. Mater. 2020, 30, 2003733. [Google Scholar] [CrossRef]
- Jin, X.; Li, F.; Zhang, X.; Zeng, G.; Liu, X.; Cai, B.; Wang, C.; Zhao, X.S. Isovalent doping of tin in sodium trititanate for enhanced sodium-ion battery performance. J. Energy Chem. 2025, 103, 324–332. [Google Scholar] [CrossRef]
- Tian, R.-N.; Zhao, S.; Lv, Z.; Lu, G.; Fu, M.; Chen, J.; Wang, D.; Dong, C.; Mao, Z. Topological proton regulation of interlayered local structure in sodium titanite for wide-temperature sodium storage. Carbon Energy 2024, 6, e560. [Google Scholar] [CrossRef]
- Meng, W.; Dang, Z.; Li, D.; Jiang, L. Long-Cycle-Life Sodium-Ion Battery Fabrication via a Unique Chemical Bonding Interface Mechanism. Adv. Mater. 2023, 35, 2301376. [Google Scholar] [CrossRef]
- Moustafa, E.; Esmat, M.; Iwanade, A.; Oishi, M.; Nagai, T.; Tsunoji, N.; Fukata, N.; Chaikittisilp, W.; Ide, Y. 2D-to-1D Conversion of a Layered Sodium Titanate via Rational Framework Splitting for Highly Efficient Cation Exchange. Small Methods 2025, 9, 2400947. [Google Scholar] [CrossRef] [PubMed]
- Dong, J.; Chen, Z.; Wang, J.; Jiang, Y.; Ao, J.; Wang, R.; Pan, J.; Wei, Q.; Zhang, X. Heterointerface with Continuous Channels Enables Fast Na+ Transport in Layered Na2Ti3O7. ACS Nano 2025, 19, 10337–10346. [Google Scholar] [CrossRef]
- Dong, J.; Jiang, Y.; Wang, R.; Wei, Q.; An, Q.; Zhang, X. Review and prospects on the low-voltage Na2Ti3O7 anode materials for sodium-ion batteries. J. Energy Chem. 2024, 88, 446–460. [Google Scholar] [CrossRef]
- Shang, Z.; Zhang, T.; Yang, Q.; Wang, D.; Liao, Y.; Xie, D.; Dai, Y.; Wang, Y.; Yuan, S. Constructing Fe2O3/Carbon heterointerfaces on porous carbon fibers: Achieving a synergistic effect for enhanced supercapacitors. J. Power Sources 2025, 633, 236468. [Google Scholar] [CrossRef]
- Xie, D.; Liu, S.; Wei, W.; Zhou, Z.; Fu, X.; Shang, Z.; Wang, Y.; Yuan, S. Nitrogen-Doped Porous Carbon Fiber as a Self-Supporting Electrode for Boosting Zinc-Ion Hybrid Supercapacitors. Ind. Eng. Chem. Res. 2024, 63, 21146–21153. [Google Scholar] [CrossRef]
- Wang, Y.; Zhang, T.; Zheng, X.; Tian, X.; Yuan, S. Enhancing Energy Storage via Confining Sulfite Anions onto Iron Oxide/Poly(3,4-Ethylenedioxythiophene) Heterointerface. ACS Appl. Mater. Interfaces 2023, 15, 59413–59421. [Google Scholar] [CrossRef] [PubMed]
- You, Z.; Shen, J.; Wang, S.; Wang, Y.; Liang, Y.; Yuan, S. Constructing high activity Cu/Cu2O via nitrate-assisted directed evolution for enhanced electro catalytic nitrate-to-ammonia conversion. Sep. Purif. Technol. 2025, 369, 133165. [Google Scholar] [CrossRef]
- Pan, D.; Chen, W.; Sun, S.; Lu, X.; Wu, X.; Yu, C.; Hu, Y.-S.; Bai, Y. A high-rate capability and energy density sodium ion full cell enabled by F-doped Na2Ti3O7 hollow spheres. J. Mater. Chem. A 2022, 10, 23232–23243. [Google Scholar] [CrossRef]
- Li, F.; Gao, L.; Lv, Y.; Cai, B.; Wang, C.; Zhao, X.S. Doping of potassium by partial substitution of sodium in sodium trititanate for improved sodium-ion storage properties. J. Power Sources 2024, 623, 235393. [Google Scholar] [CrossRef]
- Gao, L.; Ma, Y.; Cao, M. Self-supported Se-doped Na2Ti3O7 arrays for high performance sodium ion batteries. Int. J. Hydrogen Energy 2024, 49, 1–10. [Google Scholar] [CrossRef]
- Wang, L.; Ou, W.; Liu, H.; Wang, S.; Xia, Z.; Wang, X.; Yu, K. Electronic structure optimization of titanium-based layered oxide to boost flexible sensing performance. Appl. Surf. Sci. 2023, 618, 156702. [Google Scholar] [CrossRef]
- Wang, Y.; Zhang, T.; Xiao, J.; Tian, X.; Yuan, S. Enhancing electrochemical performance of ultrasmall Fe2O3-embedded carbon nanotubes via combusting-induced high-valence dopants. J. Mater. Sci. Technol. 2023, 134, 142–150. [Google Scholar] [CrossRef]
- Xia, J.; Zhao, H.; Pang, W.K.; Yin, Z.; Zhou, B.; He, G.; Guo, Z.; Du, Y. Lanthanide doping induced electrochemical enhancement of Na2Ti3O7 anodes for sodium-ion batteries. Chem. Sci. 2018, 9, 3421–3425. [Google Scholar] [CrossRef]
- Chen, J.; Zhou, X.; Mei, C.; Xu, J.; Wong, C.-P. Improving the sodiation performance of Na2Ti3O7 through Nb-doping. Electrochim. Acta 2017, 224, 446–451. [Google Scholar] [CrossRef]
- Pak, Y.-C.; Rim, C.-H.; Hwang, S.-G.; Ri, K.-C.; Yu, C.-J. Defect formation and ambivalent effects on electrochemical performance in layered sodium titanate Na2Ti3O7. Phys. Chem. Chem. Phys. 2023, 25, 3420–3431. [Google Scholar] [CrossRef]
- Basavarajappa, P.S.; Patil, S.B.; Ganganagappa, N.; Reddy, K.R.; Raghu, A.V.; Reddy, C.V. Recent progress in metal-doped TiO2, non-metal doped/codoped TiO2 and TiO2 nanostructured hybrids for enhanced photocatalysis. Int. J. Hydrogen Energy 2020, 45, 7764–7778. [Google Scholar] [CrossRef]
- Fang, L.; Hou, L.; Zhang, Y.; Wang, Y.; Yan, G. Synthesis of highly hydrophobic rutile titania-silica nanocomposites by an improved hydrolysis co-precipitation method. Ceram. Int. 2017, 43, 5592–5598. [Google Scholar] [CrossRef]
- Pradeep, A.; Kumar, B.S.; Kumar, A.; Srihari, V.; Poswal, H.K.; Mukhopadhyay, A. Electrochemically stable and very high ‘Rate-capable’ bi-phase Na-titanate based composite anodes for Na-ion batteries. Electrochim. Acta 2020, 362, 137122. [Google Scholar] [CrossRef]
- de Abreu Lima, C.D.; dos Santos Sousa, R.; Miranda, A.W.; Moura, J.V.B.; de Sousa Pinheiro, G.; Viana, B.C.; Lima, I.S.; Oliveira, T.M.B.F.; Baffa, O.; Araujo, J.F.D.F.; et al. Synthesis, characterization, and thermal stability study of sodium and sodium–aluminum titanate nanotubes. Solid State Sci. 2023, 138, 107134. [Google Scholar] [CrossRef]
- Zhu, L.; Yin, X.; Pan, C.; Han, Q.; Miao, Y.; Liu, J.; Xie, L.; Cao, X. Facile synthesis of nanorods Na2Ti6O13 as anode materials for high-performance sodium ion batteries. J. Alloys Compd. 2022, 906, 164306. [Google Scholar] [CrossRef]
- Zuo, C.; Shao, Y.; Li, M.; Zhang, W.; Zhu, D.; Tang, W.; Hu, J.; Liu, P.; Xiong, F.; An, Q. Layered Na2Ti3O7 as an Ultrastable Intercalation-Type Anode for Non-Aqueous Calcium-Ion Batteries. ACS Appl. Mater. Interfaces 2024, 16, 33733–33739. [Google Scholar] [CrossRef]
- Minakshi, M.; Mitchell, D.R.G.; Baur, C.; Chable, J.; Barlow, A.J.; Fichtner, M.; Banerjee, A.; Chakraborty, S.; Ahuja, R. Phase evolution in calcium molybdate nanoparticles as a function of synthesis temperature and its electrochemical effect on energy storage. Nanoscale Adv. 2019, 1, 565–580. [Google Scholar] [CrossRef]
- Minakshi, M.; Barmi, M.; Mitchell, D.R.G.; Barlow, A.J.; Fichtner, M. Effect of oxidizer in the synthesis of NiO anchored nanostructure nickel molybdate for sodium-ion battery. Mater. Today Energy 2018, 10, 1–14. [Google Scholar] [CrossRef]
- Minakshi, M.; Mitchell, D.R.G.; Munnangi, A.R.; Barlow, A.J.; Fichtner, M. New insights into the electrochemistry of magnesium molybdate hierarchical architectures for high performance sodium devices. Nanoscale 2018, 10, 13277–13288. [Google Scholar] [CrossRef] [PubMed]
- Luo, L.; Zhen, Y.; Lu, Y.; Zhou, K.; Huang, J.; Huang, Z.; Mathur, S.; Hong, Z. Structural evolution from layered Na2Ti3O7 to Na2Ti6O13 nanowires enabling a highly reversible anode for Mg-ion batteries. Nanoscale 2020, 12, 230–238. [Google Scholar] [CrossRef] [PubMed]
- e Silva, F.L.R.; Filho, A.A.A.; da Silva, M.B.; Balzuweit, K.; Bantignies, J.-L.; Caetano, E.W.S.; Moreira, R.L.; Freire, V.N.; Righi, A. Polarized Raman, FTIR, and DFT study of NaTiO microcrystals. J. Raman Spectrosc. 2018, 49, 538–548. [Google Scholar] [CrossRef]
- Senguttuvan, P.; Rousse, G.; Seznec, V.; Tarascon, J.-M.; Palacín, M.R. Na2Ti3O7: Lowest Voltage Ever Reported Oxide Insertion Electrode for Sodium Ion Batteries. Chem. Mater. 2011, 23, 4109–4111. [Google Scholar] [CrossRef]
- da Silva, J.P.; Biondo, M.M.; Nobre, F.X.; Anglada-Rivera, J.; Almeida, A.; Agostinho-Moreira, J.; Sanches, E.A.; Paula, M.M.d.S.; Aguilera, L.; Leyet, Y. Structure and electrical properties of the composite Na2Ti3O7/ Na2Ti6O13/POMA: A study of the effect of adding POMA. J. Alloys Compd. 2021, 867, 159025. [Google Scholar] [CrossRef]
- Zhang, L.; Chen, L.; Fan, X.; Xiao, X.; Zheng, J.; Huang, X. Enhanced hydrogen storage properties of MgH2 with numerous hydrogen diffusion channels provided by Na2Ti3O7 nanotubes. J. Mater. Chem. A 2017, 5, 6178–6185. [Google Scholar] [CrossRef]
- Tsiamtsouri, M.A.; Allan, P.K.; Pell, A.J.; Stratford, J.M.; Kim, G.; Kerber, R.N.; Magusin, P.C.M.M.; Jefferson, D.A.; Grey, C.P. Exfoliation of Layered Na-Ion Anode Material Na2Ti3O7 for Enhanced Capacity and Cyclability. Chem. Mater. 2018, 30, 1505–1516. [Google Scholar] [CrossRef]
- Song, T.; Chen, H.; Xu, Q.; Liu, H.; Wang, Y.-G.; Xia, Y. Black Phosphorus Stabilizing Na2Ti3O7/C Each Other with an Improved Electrochemical Property for Sodium-Ion Storage. ACS Appl. Mater. Interfaces 2018, 10, 37163–37171. [Google Scholar] [CrossRef]
- Muñoz-Márquez, M.A.; Zarrabeitia, M.; Castillo-Martínez, E.; Eguía-Barrio, A.; Rojo, T.; Casas-Cabanas, M. Composition and Evolution of the Solid-Electrolyte Interphase in Na2Ti3O7 Electrodes for Na-Ion Batteries: XPS and Auger Parameter Analysis. ACS Appl. Mater. Interfaces 2015, 7, 7801–7808. [Google Scholar] [CrossRef]
- Li, M.; Zhao, J.; Li, Y.; Li, M.; Wu, Y.; Wang, C.; Jiao, H.; Na, P. Enhanced adsorption of cesium ions by electrochemically switched ion exchange method: Based on surface-synthetic Na2Ti3O7 nanotubes. Colloids Surf. A Physicochem. Eng. Asp. 2019, 579, 123712. [Google Scholar] [CrossRef]
- Liu, J.; Wang, Z.; Lu, Z.; Zhang, L.; Xie, F.; Vasileff, A.; Qiao, S.-Z. Efficient Surface Modulation of Single-Crystalline Na2Ti3O7 Nanotube Arrays with Ti3+ Self-Doping toward Superior Sodium Storage. ACS Mater. Lett. 2019, 1, 389–398. [Google Scholar] [CrossRef]
- Wang, Y.; Xiao, J.; Zhang, T.; Ouyang, L.; Yuan, S. Single-Step Preparation of Ultrasmall Iron Oxide-Embedded Carbon Nanotubes on Carbon Cloth with Excellent Superhydrophilicity and Enhanced Supercapacitor Performance. ACS Appl. Mater. Interfaces 2021, 13, 45670–45678. [Google Scholar] [CrossRef] [PubMed]
- Alev, O.; Özdemir, O.; Kılıç, A.; Akcan, D.; Büyükköse, S. Effect of Al doping on structural and optical properties of atomic layer deposited ZnO thin films. Surf. Interfaces 2024, 52, 104942. [Google Scholar] [CrossRef]
- Tong, Y.; Wu, C.; He, H.; Wang, Y.; Yuan, S. Iron-assisted molten salt synthesis of highly graphitized hierarchical porous N-doped carbon for enhanced aqueous energy storage. J. Power Sources 2025, 644, 237086. [Google Scholar] [CrossRef]
- Wang, Y.; Wang, T.; Liu, S.; Wei, Z.; Zhang, T.C.; Yuan, S. Bilayer diatomite-based composite coatings with superhydrophobic and self-healing properties for enhanced anticorrosion of AZ31B magnesium alloys. Surf. Coat. Technol. 2024, 489, 131151. [Google Scholar] [CrossRef]
Disclaimer/Publisher’s Note: The statements, opinions and data contained in all publications are solely those of the individual author(s) and contributor(s) and not of MDPI and/or the editor(s). MDPI and/or the editor(s) disclaim responsibility for any injury to people or property resulting from any ideas, methods, instructions or products referred to in the content. |
© 2025 by the authors. Licensee MDPI, Basel, Switzerland. This article is an open access article distributed under the terms and conditions of the Creative Commons Attribution (CC BY) license (https://creativecommons.org/licenses/by/4.0/).