Abstract
Vanadium dioxide (VO2) has been a promising energy-saving material due to its reversible metal-insulator transition (MIT) performance. However, the application of VO2 films has been seriously restricted due to the intrinsic low solar-energy modulation ability (ΔTsol) and low luminous transmittance (Tlum) of VO2. In order to solve the problems, the surface structure of VO2 particles was regulated by the quenching process and the VO2 dispersed films were fabricated by spin coating. Characterizations showed that the VO2 particles quenched in deionized water or ethanolreserved VO2(M) phase structure and they were accompanied by surface lattice distortion compared to the pristine VO2. Such distortion structure contributed to less aggregation and highly individual dispersion of the quenched particles in nanocomposite films. The corresponding film of VO2 quenched in water exhibited much higher ΔTsol with an increment of 42.5% from 8.8% of the original VO2 film, because of the significant localized surface plasmon resonance (LSPR) effect. The film fabricated from the VO2 quenched in ethanol presented enhanced thermochromic properties with 15.2% of ΔTsol and 62.5% of Tlum. It was found that the excellent Tlum resulted from the highly uniform dispersion state of the quenched VO2 nanoparticles. In summary, the study provided a facile way to fabricate well-dispersed VO2 nanocomposite films and to facilitate the industrialization development of VO2 thermochromic films in the smart window field.
1. Introduction
Since Morin F. J. discovered the reversible metal-insulator transition (MIT) behavior of vanadium oxides in 1959 [1], VO, V2O3, VO2, V6O13, V3O7, and V2O5 [1,2,3] have been reported undergoing MIT at different ambient temperatures and showing significant gaps of the electrical, optical, magnetic properties before and after the MIT. Among them, the phase transition temperature (Tc) of VO2, 341 K (68 °C), is the closest to room temperature, which makes VO2 a promising candidate for intelligent film for smart windows. Below Tc, the strong electron-correlated VO2 is monoclinic (M phase, P21/c) and highly transparent to NIR, which helps warm up the indoor room. When the ambient temperature rises above Tc, the VO2 crystal transits to be tetragonal (R phase, P42/mnm) and reflective to the NIR, which is beneficial for blocking out the thermal radiation and cooling down the room temperature. Such characteristic of temperature-sensitive response of VO2 is expected to enable intelligent regulation of indoor temperature, thereby reducing the energy consumption of architectures [2,3,4].
However, challenges remain in balancing the admirable luminous transmittance (Tlum) for illuminance and the appreciable solar-energy modulation ability (ΔTsol) for temperature regulations [5,6,7]. Such problems severely hinder the application of VO2 thermochromic smart windows. Up till now, plenty of strategies have been dedicated to the performance optimization of VO2. Element doping is confirmed to be an effective way to diminish the yellow color and boost the visible transmittance Tlum [3,5,8], and F [9], Mg [9,10], Ti [11], and Zr [12] are common dopants. Besides, VO2 nano-/microstructure engineering [4], such as porous structure [13,14], grid structure [15], and biomimetic patterning [16] of VO2 film, has been testified to cater for the optimization of thermochromic properties. In addition, multilayer construction [17,18,19] based on VO2 film becomes an effective approach to enhance thermochromic properties, including but not limited to oxide buffer layers [20], antireflection layers [21], and noble metal layers [22]. Apart from multilayer structure, VO2 nanocomposite coating by means of distributing VO2 particles into matrix materials is another feasible way to improve Tlum and ΔTsol. When the ambient temperature is above Tc, the VO2(R) nanoparticles, with grain size much smaller than the wavelength of the incident light, present the localized surface plasma resonance (LSPR) effect around 1200 nm. Such an effect enables to enlarge the absorption and decreased transmittance of the infrared light. On the other hand, VO2(M) nanoparticles below Tc do not possess the characteristic of LSPR and the corresponding films are highly transparent to NIR. Such a NIR transmittance gap between VO2(M) and VO2(R) results in much higher ΔTsol. Additionally, the transparent matrix covering isolated particles gives rise to higher Tlum of the VO2 nanocomposite coatings. Typically, SiO2 [23], SnO2 [24], TiO2 [25], and Si-Al oxide [26] are common inorganic matrixes for VO2 nanoparticles. Unfortunately, these matrixes require a strict annealing atmosphere or precisely uniform dispersion of VO2 in the nanocomposite films. Compared to inorganic matrix, organic agents, such as polyvinyl pyrrolidone (PVP) [13,27], polyurethane (PU) [28], polyvinyl butyral (PVB) [29], and acrylic resin [30], have become more favorable hosts due to their low refractive index and facile fabrication process. Gao et al. [31] synthesized a flexible coating by dispersing SiO2 capsuled monocrystal VO2 with good crystallinity, fine grain size (VO2@SiO2) into PU, which showed good optical properties (Tlum = 55.3%, ΔTsol =7.5%). In addition, they further developed a roll-coated VO2 nanocomposite coating with smoothness, uniformity, and high transparency on 1200 × 1000 mm2 large-scale glass. By modulating the viscosity of the host PU, Zou et al. [32] upgraded the solar modulation ability of VO2/PU composite film from 6.6% to 14.5%, whereas the luminous transmittance was maintained 54%. On the other hand, PVP was widely reported to be an alternative matrix. Zhao et al. [13] mixed VO2 nanoparticles, ZnO nanoparticles, and PVP to fabricate a composite film, successfully enhancing Tlum from 54.9% to 63.9% and improving ΔTsol from 9.9% to 11.3%. Recently, Tian et al. [33] demonstrated an in-situ synthesis route to coat VO2 nanocomposite on the glass surface by PVP decomposition and a mass transfer process during annealing, achieving remarkable optical performance with Tlum of 72.5% and ΔTsol of 10.1%. Yet, there were rare reports about the interactions between the VO2 and the matrix.
In this work, high-purity VO2(M) particles obtained by a one-step annealing process were quenched to induce surface structural distortion. Deionized water and ethanol were used as the quenching solvents to modulate the surface structure of VO2 particles. As it turned out, the phase transition temperature of the quenched powders was slightly reduced by around 3 °C. In addition, the quenched VO2 nanoparticles were dispersed individually in the PVP when spin-coated to form the VO2 nanocomposite films. Such dispersion structures contributed to the optimization of the thermochromic properties of the film. It was discovered that the quenched VO2 particles showed high dispersity in the nanocomposite films and presented an evident LSPR effect, which contributed to the enhanced solar-energy modulation ability of the films. Moreover, the film fabricated by the ethanol-quenched VO2 uncovered excellent optical performance, accompanied by ΔTsol of 15.2% and Tlum of 62.5%. The outstanding performance successfully achieved the simultaneous enhancement of both solar energy modulation ability and luminous transmittance of the film, and it was superior to most of the VO2 nanocomposite films in previous reports [21,23,27,31,32,33] that failed to make a positive balance of ΔTsol and Tlum. Herein, this work provided a facile quenching process to benefit the thermochromic performance of VO2 composite film and to drive its application in smart windows.
2. Methods
2.1. Fabrication of Quenched VO2(M) Nanoparticles
All reagents that were used directly were analytically pure and provided by Sinopharm Chemical Reagent Co., Ltd, Shanghai, China. A certain mass of vanadium pentoxide (V2O5, 0.8 g) powders and half the amount of ammonium bicarbonate (NH4HCO3, 0.4 g) particles were loaded together in a quartz crucible and then transferred into the tube furnace. The furnace was pumped below 50 Pa and heated around 550 °C until the powders changed to dark-blue VO2 particles. After that, the particles were processed with quenching treatment as Scheme 1 described. In detail, VO2 particles were placed in a vacuum tube furnace for thermal insulation treatment for half an hour and then they were rapidly moved into the 0 °C quenching solution surrounded by an ice-water system. Extra ice bulks were constantly added to the system so that the quenching solvent was maintained at around 0 °C. Next, the beaker holding the above-mentioned solution mixed with quenched VO2 grains was put in a thermostatic oven to completely evaporate the solvent. Finally, the remaining nanoparticles in the beaker were collected as quenched VO2(M).
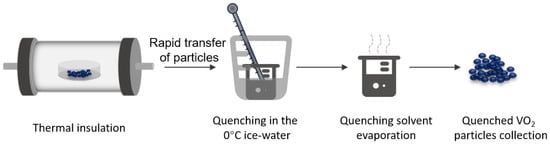
Scheme 1.
Diagram of the quenching process of the VO2 particles.
2.2. Fabrication of VO2-PVP Nanocomposite Film
The obtained VO2(M) nanoparticles were mixed with polyvinylpyrrolidone (PVP, K30) and ethanol in the mill tank. Intermittent ball milling gave rise to particles with smaller sizes to achieve thorough dispersion in the ethanol. Afterward, the mixture liquid was transferred into a centrifuge tube for solid-liquid separation. The upper liquid in the tube remained turbid as VO2 with extreme fine sizes dispersed well in PVP, which dissolved well in ethanol. With the evaporation of liquid in the upper suspension, VO2-PVP nanocomposites were collected and then made into a coating slurry by mixing them with additional ethanol. Continuous stirring and ultrasonic vibration were implemented to make the slurry homogeneous. Then spin-coating was carried out to form a sol/wet film by dropping the solution on a common soda-lime-silica glass substrate. In the end, ethanol was removed by heating to form the VO2-PVP nanocomposite films.
2.3. Characterization
X-ray diffraction (XRD, D8DISCOVER, Bruker, Billerica, MA, USA) with Cu Kα (λ = 0.154056 nm) serving as the source of radiation, and 3 kW of the output power)was adopted to determine the phase structures of the powders over the 2θ between 10° and 80°. A differential scanning calorimeter (DSC, DSC8500,PerkinElmer, Waltham, MA, USA) was used to examine the phase transition temperature of the powders with the temperature ranging from 0 °C to 100 °C at the rate of 5 °C/min in the heating/cooling loop, as illustrated in Equation (1). Tc refers to the average phase transition temperature of VO2 particles. Tc,h and Tc,c correspond to the phase transition temperature peak of VO2 in the heating and cooling stages, respectively. A field emission scanning electron microscopy (FE-SEM, Zeiss Ultra Plus, Carl Zeiss CMP GmbH, Oberkochen, Germany) was used to observe the morphology of both the composite powders and films. X-ray photoelectron spectroscopy (XPS, ESCALAB 250Xi, ThermoFisher, Waltham, MA, USA) was utilized to determine the element composition and valence. FT−IR spectrum (Nicolet6700, ThermoFisher, Waltham, MA, USA) was served to identify the functional groups of the samples.
The thermochromic performance of the films was measured from 300 to 2500 nm by a UV–vis–NIR spectrophotometer (UV-3600) equipped with a temperature-controlling device. The transmittance of the films at 20 °C and 90 °C corresponded to VO2(M) and VO2(R), respectively. The integrated luminous transmittance (Tlum, 380 nm ≤ λ ≤ 780 nm) and solar transmittance (Tsol, 300 nm ≤ λ ≤ 2500 nm) can be calculated according to Equations (2) and (3).
In the equations, T(λ) represents the film transmittance of light at a certain wavelength (λ), φlum(λ) is the standard luminous efficiency function for the photopic vision of human eyes [11], and φsol(λ) is the solar irradiance spectrum for air mass 1.5 corresponding to the sun standing 37° above the horizon. ΔTsol is the difference value of Tsol at 20 °C and 90 °C, as given in Equation (4).
3. Results and Discussion
3.1. Structure of the VO2 Nanoparticles
VO2 powders were obtained from V2O5 by a facial annealing reduction reaction. As shown in the TG-DSC pattern (Figure 1a) of the mixture of V2O5 and NH4HCO3, NH4HCO3 kept decomposing to release NH3 at the beginning during the homogeneous heating period, illustrating the continuous mass loss of the raw materials. Till 183.5 °C, NH4HCO3 decomposed completely and the mass loss in this period was 8.28% in total. The endothermic peak at 226.2 °C indicated that the absorbed H2O was released, accounting for 3.29% of the reaction agents. With the rising temperature, the reducibility of NH3 contributed to changing the vanadium (V) in V2O5 to lower valence, accompanied by an exothermic process at 360.0 °C, and finally reached the stable phase until 400 °C, as no mass loss or well as energy exchange could be observed in the pattern. This result suggested that 400 °C was suitable for V2O5 reduction. Additionally, the small temperature deviation between DSC and DTG could be attributed to the errors caused by the test instrument. Figure 1b showed the XRD patterns of the VO2 samples annealed from V2O5 and NH4HCO3 mixture at 400 °C, 450 °C, 550 °C, and 550 °C. Although the main diffraction peaks (27.8°, 35.7°, 37.8°, and 55.8°) matched well with VO2(M) (PDF #44-0252), extra peaks with evident intensity (25.3°, 33.5°, and 49.5°) belonging to V6O13 (PDF #27-1318) could be observed for the samples obtained at 400 °C, which meant the incomplete reduction of V2O5 to V6O13. Such a result disagreed with the ideal reaction temperature in Figure 1a. The reason could be attributed to the fact that the furnace chamber in the annealing process was too large, and the effective heating interval of the furnace was small, which caused partial energy loss. When raising the annealing temperature to 450 °C, the fabricated samples came across the same situation. Interestingly, the diffraction peaks belonging to V6O13 of the VO2 sample reduced at 450 °C were much weaker than those of VO2 reduced at 400 °C, testifying that the proportion of V6O13 among the VO2 samples annealed at 450 °C was much less than that of the VO2 annealed at 400 °C. Thus, a higher annealing temperature was demanded to overcome the energy barrier for reducing V2O5 into VO2 thoroughly. In addition, it turned out that the material annealed at 500 °C became pure VO2(M) with sharp diffraction peaks. Such peaks implied that the 500 °C reduced VO2 featured excellent crystallinity. Comparably, the powders annealed at 550 °C remained pure VO2(M) structure but exhibited a decreased peak intensity, indicating worse crystallinity of the related VO2 powders. This might be caused by the unexpected grain agglomeration during the thermal insulation at higher temperatures. Therefore, 500 °C was selected as the ideal temperature to produce pristine VO2 (labeled as P-VO2).
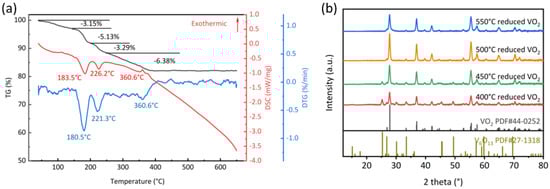
Figure 1.
(a) TG-DSC pattern of the V2O5 and NH4HCO3 raw mixture and (b) XRD pattern of VO2 powders annealed at different temperatures.
To observe the metal-insulator transition, P-VO2 was characterized through in-situ XRD technique, and the results were shown in Figure 2a,b, and Figure 2b was the enlarged view of the pink area in Figure 2a. The VO2 stayed the monoclinic structure below 45 °C, and the main peak (27.76°) corresponded to the (011) crystal plane of VO2(M). When the temperature rose above 65 °C, the peak shifted to 27.63°, revealing that the VO2 crystals had transferred to the rutile phase, featured with the (110) crystal plane of VO2(R) (PDF #73-2362). This phenomenon suggested that the phase transition temperature of P-VO2 ranged between 45 °C and 65 °C. This was in agreement with previous reports [5] for VO2 particles. When the VO2 particles cooled down from 75 °C to 65 °C, VO2 crystals transited back to monoclinic structure from rutile structure. This helped obverse the evident and reversible MIT behavior between VO2(M) and VO2(R) in the previous report [34]. Furthermore, the phase transition temperature of the cooling stage was inconsistent with that of the heating stage, confirming the thermal hysteresis loop feature of VO2 in the phase transition stage. It was the MIT behavior that made VO2 a promising material for smart windows.
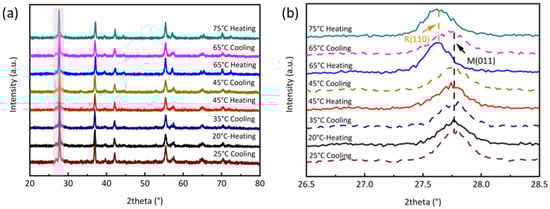
Figure 2.
(a) In-situ XRD pattern of P-VO2 and (b) enlarged view of the diffraction angle ranging from 26.5° to 28.5° in the heating and cooling stages.
In order to cause surface distortion for the crystal, P-VO2 featured with the notable MIT behavior was placed in a 0 °C ice-water system for quenching treatment as Scheme 1 illustrated. According to the difference in quenching solvent, the VO2 quenched in deionized water was named H-VO2 and the one quenched in ethanol was noted as E-VO2. The XRD pattern of VO2 under different quenching solvents was shown in Figure 3a. Compared to the pristine VO2 without the quenching process, both the H-VO2 and E-VO2 powders held the phase structure of VO2(M) in Figure 1b. A smaller peak located at 25.3° appeared in the quenched samples, which could be the localized oxidation caused by exposure to air during powder transfer. It is worth noting that quenched particles presented the VO2(M) phase and manifested great crystallinity. In addition, surface lattice distortion of the VO2 was assumed to occur after the quenching process [35], which would be discussed in the next part. According to the Scherrer equation, the average grain size of E-VO2 and H-VO2 were calculated as 30.08 nm and 17.06 nm, respectively, larger than the average size (12.11 nm) of P-VO2. To explain the mean grain size changes of the three samples, an enlarged view of the XRD diffraction angle ranging from 27.0° to 28.5° (Organe area in Figure 3a) was presented to illustrate the half-width changes of the peaks. As shown in Figure 3b, the diffraction curve of P-VO2 exhibited the greatest widening state compared to E-VO2 and H-VO2. Such a state endowed P-VO2 with the largest half-width and thus, the smallest grain size among the three particles. On the other hand, the half-width of the E-VO2 (011) crystal plane diffraction peak was approaching that of H-VO2. However, the diffraction peak of E-VO2 shifted to a higher position at 27.91°, compared to the peak at 27.86° of P-VO2. Such a shift to a higher angle caused the fact that the grain size of E-VO2 was a bit larger than that of H-VO2. This phenomenon might be attributed to the hydroxy group attached to the surface of VO2 when the heated particles encountered an ice-water/ice-ethanol system and thus, leading to surface lattice distortion of the crystals. Moreover, thermal insulation during the quenching process in Scheme 1 was also beneficial to grain growth.
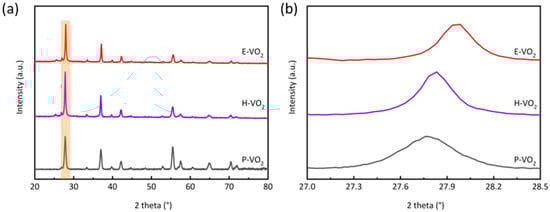
Figure 3.
(a) XRD pattern of P-VO2, H-VO2, and E-VO2 powders and (b) enlarged view of the diffraction angle ranging from 27.0° to 28.5°.
With the goal of further determining the effect of the quenching process on VO2, the XPS technique was used to identify the chemical environment of elements, and the results were presented in Figure 4. Regarding the C1s peak at 284.80 eV as the calibration position, the full spectrum (Figure 4a) illustrated the existence of vanadium and oxygen in all the P-VO2, H-VO2, and E-VO2 powders according to the V2p and O1s peaks. The V2p peaks were analyzed by Avantage of Thermo Scientific. In addition, Shirley background subtraction was employed to diminish the influence of heightened peaks due to signals from electrons undergoing inelastic scattering during the XPS characterization, ensuring a convincing quantification analysis of the peaks. As the high-resolution pattern for V2p shown in Figure 4b to d, both the V2p3/2 and V2p1/2 spectral peaks were significantly asymmetrical and each was split into two peaks, which implied that the vanadium of all the VO2 samples involved two different chemical states, corresponding to V4+ (The fitted purple curve) and V5+ (The fitted green curve), respectively. V5+ owing to V2O5 consisted of V2p3/2 at 517.5 eV and V2p1/2 at 525.0 eV. The gap between the V2p3/2 orbital and V2p3/2 orbital was 7.5 eV, which is in line with previous work [13]. Additionally, it is supposed that the existence of V5+ was caused by partial oxidation when the VO2 particles were exposed to air [36]. The V4+ attributed to VO2 was made up of V2p3/2 at 516.2 eV and V2p1/2 at 523.7 eV. In addition, the V2p3/2 of P-VO2 was most occupied with V5+, and V4+ only accounted for a small proportion. Comparably, the V4+ in the V2p orbitals of H-VO2 in Figure 4c showed the highest percentage, followed by E-VO2 in Figure 4d, and finally, the P-VO2 declared the least V4+ content in Figure 4b. Such results could be attributed to the surface lattice distortion of H-VO2 and E-VO2.
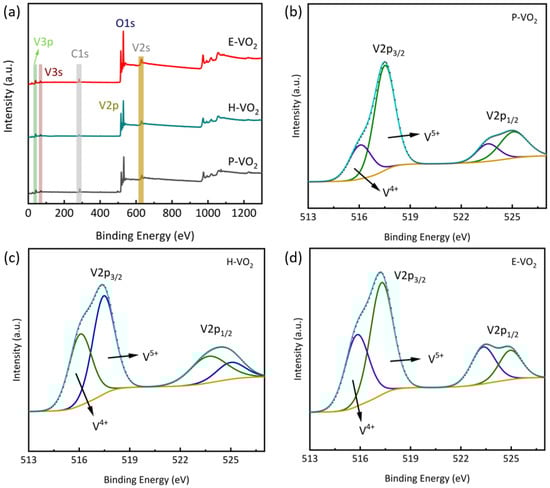
Figure 4.
(a) XPS spectrum comparison of VO2 powders and the high-resolution patterns for V2p of P-VO2 (b), H-VO2 (c), and E-VO2 (d).
SEM was employed to investigate the morphology of the aforementioned VO2 particles. Due to the large size of the commercial precursor V2O5, the directly annealed P-VO2 particles inherited the large grain size, as shown in Figure 5a. It is evident that the particles aggregated severely to form large-scale clusters, with irregular shapes and different sizes ranging from 0.2 μm to 1.2 μm.Unfortunately, such sizes hindered P-VO2 from dispersing in the PVP matrix for film coating. Compared to the pristine sample, the degree of particle aggregation of quenched VO2 was much improved. In Figure 5b, the big clusters were broken into small H-VO2 parts with varying sizes, showing that the deionized water was able to split the large-size P-VO2 gathering during the quenching process. Especially, when the quenched solvent was replaced with ethanol with a smaller density, E-VO2 interacted more severely with the liquid and turned more entire separation into nanoparticles with approximately 200 nm in size, as presented in Figure 5c. In addition, the voids clearly appeared among the E-VO2 nanoparticles and the linkage knot hinted the E-VO2 separated from large-size P-VO2 particles. The observation that the quenched VO2 nanoparticles were easily separated into small pellets from large-sized clusters resulted from the thermodynamically unstable state of these aggregated clusters. This unstable state was due to the surface crystal distortion caused by the quenching process, confirming the results of XPS spectrums. It is worth mentioning that the particle was much larger than the value calculated in Figure 3a. The fact that the XRD resulted from Cu Kα radiation reflected crystalline particles rather than the actual morphology of the powders might explain the difference in the mean particle sizes. As for SEM, the signals of secondary electrons with much smaller De Broglie wavelengths were collected to reflect the topography of the particles. The different wavelengths of Cu Kα in XRD and secondary electrons in SEM caused different imaging results. On the other hand, VO2 particles in Figure 5 were assumed to be polycrystalline consisting of substantial crystals.
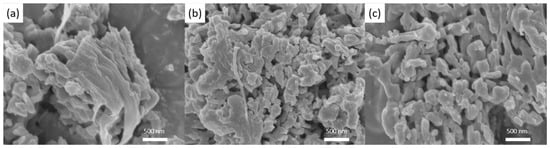
Figure 5.
SEM images of (a) P-VO2, (b) H-VO2, and (c) E-VO2 powders.
The DSC curves of the above P-VO2 H-VO2 and E-VO2 powders are illustrated in Figure 6a with expected exothermic and endothermic peaks. Such a thermal energy change suggested the phase transition behavior between VO2(M) and VO2(R). The exothermic peak (Tc,h) at 68.35 °C and endothermic peak (Tc,c) at 61.09 °C of P-VO2 implied the average Tc was 64.72 °C according to Equation (1). On the other hand, the energy involved in the MIT behavior was 47 J/g, approaching 51 J/g of the bulk VO2, showing good crystallinity of P-VO2 powders as shown in Figure 2. With the quenching process, the H-VO2 powders with phase transition peaks at 65.61 °C and 58.53 °C presented the average Tc as 62.07 °C, while the Tc of E-VO2 nanoparticles was calculated as 62.73 °C from the Tc,h peak at 65.73 °C and Tc,c peak at 58.24 °C. It is clear that the Tc of the quenched samples was slightly lowered, which could be attributed to the surface lattice distortion of the VO2 crystal structure as the XPS results suggested.
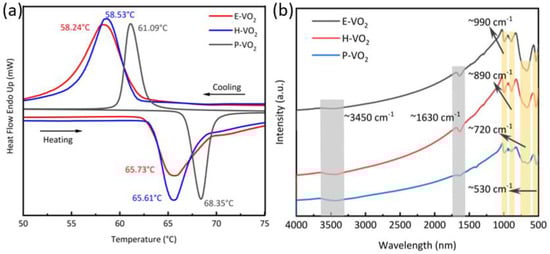
Figure 6.
(a) DSC curve and (b) FT−IR spectrum of P-VO2, H-VO2, and E-VO2 powders.
Considering the similar structure of H2O and C2H6O, FT−IR was employed to detect the -OH bond of the VO2 particles. In Figure 6b, the -OH bond corresponded to the peaks at 3450 cm−1 and hydrogen bonds appeared at 1630 cm−1. The integral area of the peak at 1630 cm−1 was used to reflect the relative content of the hydroxyl group in the samples. It turned out that the hydroxyl peak area of H-VO2 particles was the largest at 106.4, followed by the peak area of 87.7 of E-VO2, and finally the value of 25.3 of P-VO2. Such results indicated that the absorbed hydroxyl on the surface of both H-VO2 and E-VO2 particles was more than P-VO2. This could be due to the surface lattice distortion of the quenched samples, so there were more absorption sites bound to the hydroxyl group on the surface of these particles. Additionally, the peaks at around 990 cm−1 and 890 cm−1, respectively, corresponded to the stretching vibration and asymmetric stretching vibration of the V=O bond. The overlapping peaks at 720 cm−1 and 660 cm−1 were the characteristic peaks of VO2(M) [37]. In addition, the peaks at around 530 cm−1 were labeled as the stretching vibration of the V-O-V bond. Apart from the peak offset of the corresponding bonds in VO2, small extra peaks at around 1285 m−1 were discovered in H-VO2 and E-VO2, which was attributed to the O-H band after the quenching process. Such a phenomenon confirmed the surface lattice distortion to VO2 crystals of H-VO2 and E-VO2.
3.2. Thermochromic Properties and Morphology of VO2 Nanocomposite Films
To reduce the grain size of the as-synthesized particles, VO2 samples were mixed with PVP and ethanol in the mill tank to conduct thorough ball milling and centrifugation, ending up with a dark liquid mixture. The turbid upper solution was dried to collect the VO2-PVP compound, which was then mixed with additional ethanol to configure the spin-coating slurry. The slurry was then dropped on the soda-lime-silica glass substrate and spun to form the VO2 nanocomposite films. A UV3600 spectrophotometer coupled with a temperature-controlling device was served to characterize the transmittance of the films ranging from 300 nm to 2500 nm, and the thermochromic properties of the VO2 nanocomposite films were integrated by Equations (2) to (4). The solid lines in Figure 7a were tested at 20 °C, revealing the transmittance of M phase VO2 samples, and the dash lines were obtained at 90 °C, appearing the transmittance of R phase VO2 samples. As shown in Figure 7a and Table 1, the Tlum of P-VO2 film was 53.2% and ΔTsol just reached 8.8%. The grain accumulation in Figure 5a was the cause for such poor properties. Comparably, the H-VO2 film sacrificed a small amount of luminous transmittance of 3.1% to achieve as enormous as 42.5% of improvement in solar-energy modulation ability to reach 12.5%. The reason for the enhanced ΔTsol originated from the LSPR absorption peak of H-VO2 located at 1258 nm, which was stronger than the P-VO2 peak at 1293 nm. Such a phenomenon led to an enlarged gap in the transmittance of VO2 at 20 °C and 90 °C and contributed to higher ΔTsol. The E-VO2 nanocomposite film that came across with the same LSPR effect at 1150 nm revealed an exceeding increment of ΔTsol of 72.2% (from 8.8% to 15.2%). In addition, the Tlum of E-VO2 film was boosted to 62.5%, indicating a better dispersity of the VO2 nanoparticles in the PVP matrix. The optimized luminous transmittance was also credited for less aggregation of the nanoparticles as shown in Figure 5c. In Figure 7b, the thermochromic performance of E-VO2 in this work was compared to previously reported VO2 nanocomposite films, and it was clear that the E-VO2 film exceeded most VO2 films [21,23,27,31,32,33]. Besides, the excellent ΔTsol of the E-VO2 film was able to satisfy the demands of effectively regulating room temperature while the great Tlum met the requirement of indoor brightness, which was a great achievement for the potential application of VO2 thermochromic smart windows.
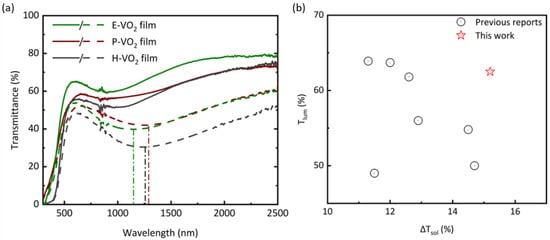
Figure 7.
(a) Transmittance spectrum comparison of VO2 films and (b) thermochromic performance comparison between this work and previously reported VO2 nanocomposite films.

Table 1.
Thermochromic properties of different VO2 films.
The morphology of the films was presented. It is clear that P-VO2 turned into nanoparticles with a size of around 100 nm after a ball milling process as described in Figure 8a. However, particle aggregation in Figure 5a was still common even though they were spin-coated to film. This aggregation structure was the reason for the unsatisfied thermochromic properties of the P-VO2 film. Comparably, grain accumulation also existed in H-VO2 film, which caused low luminous transmittance of the film. Additionally, cracks could be found in the film, and they were the cause of the inadequate performance of Tlum. It is worth mentioning that most H-VO2 nanoparticles exhibited much smaller sizes than P-VO2 and they were dispersed individually in the PVP in Figure 8b, causing the LSPR effect and the improvement of ΔTsol. In Figure 8c, the E-VO2 nanoparticles showed an average size of tens of nanometers and nearly no sign of particle aggregation. Additionally, these particles with surface lattice distortion were highly isolated from each other and uniformly dispersed in the E-VO2 nanocomposite film. The large-scale surface morphology of E-VO2 film in Figure 8d introduced such dispersity of VO2 nanoparticles in a more intuitive perspective. This dispersion structure became beneficial for the optical properties of E-VO2 nanocomposite film.
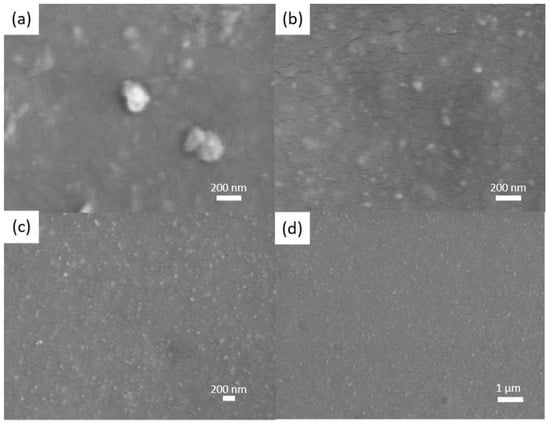
Figure 8.
SEM images of (a) P-VO2, (b) H-VO2, and (c,d) E-VO2 nanocomposite films.
4. Conclusions
As a strong electronic associated material, VO2(M) underwent a reversible phase transition between the monoclinic phase and rutile phase, corresponding with an abrupt change of near-infrared light transmittance, thus showing great potential in the smart window application. To improve the thermochromic properties of VO2, this paper applied a facile annealing method to synthesize VO2(M) powders. With the quenching treatment, the VO2 particles presented surface lattice distortion and they were individually dispersed in the PVP host to induce the LSPR effect, contributing to the exciting increment of solar-energy modulation ability. Hereby, the film corresponding to H-VO2 achieved an enormous improvement in ΔTsol from 8.8% to 12.5%. Moreover, the film fabricated by the ethanol-quenched VO2 with no sign of aggregation showed an exceedingly high ΔTsol of 15.2%, and the high dispersity of E-VO2 nanoparticles in the film contributed to much enhanced Tlum of 62.5%. Therefore, this work provided a new thought to promote the thermochromic performance of VO2 by particle quenching and the strategy was beneficial to the commercialization of VO2 thermochromic smart windows.
Author Contributions
S.W. contributed to writing the original draft and conducting the experiment and data analysis. L.Z. contributed to characterizing the structure of the samples and B.L. was responsible for the optical performance characterization of the films. S.T. contributed to analyzing all the data and supervising the experimental routine and data analysis. X.Z. was involved in analyzing all the data and revising the manuscript. All authors have read and agreed to the published version of the manuscript.
Funding
This work was supported by the National Natural Science Foundation of China (Grant No. 51772229), the 111 project (No. B18038), the National Key R&D Program of China (No. 2017YFE0192600), Key R&D Project of Hubei Province (No. 2020BAB061), National innovation and entrepreneurship training program for college students (No. 201910497034), Open Foundation of the State Key Laboratory of Silicate Materials for Architectures at WUT (No. SYSJJ2021-05 and SYSJJ2022-01), State Key Laboratory of Materials Processing and Die & Mould Technology, Huazhong University of Science and Technology (No. P2021-010).
Institutional Review Board Statement
Not applicable.
Informed Consent Statement
Not applicable.
Data Availability Statement
Data are available on request from the authors.
Acknowledgments
We also thank the Analytical and Testing Center of WUT for the help with carrying out the materials characterization.
Conflicts of Interest
The authors declare no potential conflict of financial interest with respect to the research.
References
- Morin, F.J. Oxides which show a metal-to-insulator transition at the neel temperature. Phys. Rev. Lett. 1959, 3, 34–36. [Google Scholar] [CrossRef]
- Hu, P.; Hu, P.; Vu, T.D.; Li, M.; Wang, S.; Ke, Y.; Zeng, X.; Mai, L.; Long, Y. Vanadium oxide: Phase diagrams, structures, synthesis, and applications. Chem. Rev. 2023, 123, 4353–4415. [Google Scholar] [CrossRef]
- Zhang, Z.; Zhang, L.; Zhou, Y.; Cui, Y.; Chen, Z.; Liu, Y.; Li, J.; Long, Y.; Gao, Y. Thermochromic energy efficient windows: Fundamentals, recent advances, and perspectives. Chem. Rev. 2023, 123, 7025–7080. [Google Scholar] [CrossRef]
- Bhupathi, S.; Wang, S.; Ke, Y.; Long, Y. Recent progress in vanadium dioxide: The multi-stimuli responsive material and its applications. Mater. Sci. Eng. R Rep. 2023, 155, 100747. [Google Scholar] [CrossRef]
- Gao, Y.; Luo, H.; Zhang, Z.; Kang, L.; Chen, Z.; Du, J.; Kanehira, M.; Cao, C. Nanoceramic VO2 thermochromic smart glass: A review on progress in solution processing. Nano Energy 2012, 1, 221–246. [Google Scholar] [CrossRef]
- Xu, F.; Cao, X.; Luo, H.; Jin, P. Recent advances in VO2-based thermochromic composites for smart windows. J. Mater. Chem. C 2018, 6, 1903–1919. [Google Scholar] [CrossRef]
- Song, J.; Zhao, Y.; Sun, L.; Luo, Q.; Xu, H.; Wang, C.; Xin, H.; Wu, W.; Ma, F. VO2/ATO nanocomposite thin films with enhanced solar modulation and high luminous transmittance for smart windows. Ceram. Int. 2022, 48, 15868–15876. [Google Scholar] [CrossRef]
- Ding, X.; Li, Y.; Zhang, Y. Sol-gel derived tungsten doped VO2 thin films on Si substrate with tunable phase transition properties. Molecules 2023, 28, 3778. [Google Scholar] [CrossRef]
- Abdellaoui, I.; Merad, G.; Maaza, M.; Abdelkader, H.S. Electronic and optical properties of Mg-, F-doped and Mg∖F-codoped M1-VO2 via hybrid density functional calculations. J. Alloys Compd. 2016, 658, 569–575. [Google Scholar] [CrossRef]
- Panagopoulou, M.; Gagaoudakis, E.; Boukos, N.; Aperathitis, E.; Kiriakidis, G.; Tsoukalas, D.; Raptis, Y.S. Thermochromic performance of Mg-doped VO2 thin films on functional substrates for glazing applications. Sol. Energy Mater. Sol. Cells 2016, 157, 1004–1010. [Google Scholar] [CrossRef]
- Zhao, J.; Chen, D.; Hao, C.; Mi, W.; Zhou, L. The optimization and role of Ti surface doping in thermochromic VO2 film. Opt. Mater. 2022, 133, 112960. [Google Scholar] [CrossRef]
- Qin, S.; Fan, Y.; Qiu, X.; Gou, G.; Zhang, K.; Feng, Q.; Gan, G.; Sun, W. Modulation of the phase transition behavior of VO2 nanofilms by the coupling of Zr doping and thickness-dependent band gap. ACS Appl. Mater. Interfaces 2022, 4, 6067–6075. [Google Scholar] [CrossRef]
- Wu, S.; Tian, S.; Liu, B.; Tao, H.; Zhao, X.; Palgrave, R.G.; Sankar, G.; Parkin, I.P. Facile synthesis of mesoporous VO2 nanocrystals by a cotton-template method and their enhanced thermochromic properties. Sol. Energy Mater. Sol. Cells 2018, 176, 427–434. [Google Scholar] [CrossRef]
- Long, S.; Cao, X.; Wang, Y.; Chang, T.; Li, N.; Jin, L.; Ma, L.; Xu, F.; Sun, G.; Jin, P. Karst landform-like VO2 single layer solution: Controllable morphology and excellent optical performance for smart glazing applications. Sol. Energy Mater. Sol. Cells 2020, 209, 110449. [Google Scholar] [CrossRef]
- Ke, Y.; Wen, X.; Zhao, D.; Che, R.; Xiong, Q.; Long, Y. Controllable fabrication of two-dimensional patterned VO2 nanoparticle, nanodome, and nanonet arrays with tunable temperature-dependent localized surface plasmon resonance. ACS Nano 2017, 11, 7542–7551. [Google Scholar] [CrossRef] [PubMed]
- Qian, X.; Wang, N.; Li, Y.; Zhang, J.; Xu, Z.; Long, Y. Bioinspired multifunctional vanadium dioxide: Improved thermochromism and hydrophobicity. Langmuir 2014, 30, 10766–10771. [Google Scholar] [CrossRef]
- Yao, L.; Qu, Z.; Sun, R.; Pang, Z.; Wang, Y.; Jin, B.; He, J. Long-lived multilayer coatings for smart windows: Integration of energy-saving, antifogging, and self-healing functions. ACS Appl. Energy Mater. 2019, 2, 7467–7473. [Google Scholar] [CrossRef]
- Mlyuka, N.R.; Niklasson, G.A.; Granqvist, C.G. Thermochromic multilayer films of VO2 and TiO2 with enhanced transmittance. Sol. Energy Mater. Sol. Cells 2009, 93, 1685–1687. [Google Scholar] [CrossRef]
- Long, S.; Zhou, H.; Bao, S.; Xin, Y.; Cao, X.; Jin, P. Thermochromic multilayer films of WO3/VO2/WO3 sandwich structure with enhanced luminous transmittance and durability. RSC Adv. 2016, 6, 106435–106442. [Google Scholar] [CrossRef]
- Panagopoulou, M.; Gagaoudakis, E.; Aperathitis, E.; Michail, I.; Kiriakidis, G.; Tsoukalas, D.; Raptis, Y.S. The effect of buffer layer on the thermochromic properties of undoped radio frequency sputtered VO2 thin films. Thin Solid Films 2015, 594, 310–315. [Google Scholar] [CrossRef]
- Yao, L.; Qu, Z.; Pang, Z.; Li, J.; Tang, S.; He, J.; Feng, L. Three-layered hollow nanospheres based coatings with ultrahigh-performance of energy-saving, antireflection, and self-cleaning for smart windows. Small 2018, 14, e1801661. [Google Scholar] [CrossRef] [PubMed]
- Granqvist, C.G. Transparent conductors as solar energy materials: A panoramic review. Sol. Energy Mater. Sol. Cells 2007, 91, 1529–1598. [Google Scholar] [CrossRef]
- Kang, J.; Liu, J.; Shi, F.; Dong, Y.; Song, X.; Wang, Z.; Tian, Z.; Xu, J.; Ma, J.; Zhao, X. Facile fabrication of VO2/SiO2 aerogel nanocomposite films with excellent thermochromic properties for smart windows. Appl. Surf. Sci. 2022, 573, 151507. [Google Scholar] [CrossRef]
- Li, D.; Deng, S.; Zhao, Z.; Yang, J.; Wang, B.; Li, J.; Jin, H. VO2(M)@SnO2 core–shell nanoparticles: Improved chemical stability and thermochromic property rendered by SnO2 shell. Appl. Surf. Sci. 2022, 598, 153741. [Google Scholar] [CrossRef]
- Samal, A.; Lakshya, A.K.; Dhar Dwivedi, S.M.M.; Dalal, A.; Ghosh, A.; Paul, A.D.; Mahapatra, R.; Gupta, R.K.; Hasan, M.A.; Dey, A.; et al. Stable and reversible phase change performance of TiO2 coated VO2 nano-columns: Experiments and theoretical analysis. Ceram. Int. 2021, 47, 14741–14749. [Google Scholar] [CrossRef]
- Liu, C.; Cao, X.; Kamyshny, A.; Law, J.Y.; Magdassi, S.; Long, Y. VO2/Si-Al gel nanocomposite thermochromic smart foils: Largely enhanced luminous transmittance and solar modulation. J. Colloid Interface Sci. 2014, 427, 49–53. [Google Scholar] [CrossRef]
- Li, B.; Liu, J.; Tian, S.; Liu, B.; Yang, X.; Yu, Z.; Zhao, X. VO2-ZnO nanocomposite films with enhanced thermochromic properties for smart windows. Ceram. Int. 2020, 46, 2758–2763. [Google Scholar] [CrossRef]
- Kang, J.; Liu, J.; Shi, F.; Dong, Y.; Jiang, S. The thermochromic characteristics of Zn-doped VO2 that were prepared by the hydrothermal and post-annealing process and their polyurethane nanocomposite films. Ceram. Int. 2021, 47, 15631–15638. [Google Scholar] [CrossRef]
- Cool, N.I.; Larriuz, C.A.; James, R.; Ayala, J.R.; Anita; Al-Hashimi, M.; Banerjee, S. Thermochromic fenestration elements based on the dispersion of functionalized VO2 nanocrystals within a polyvinyl butyral laminate. ACS Eng. Au 2022, 2, 477–485. [Google Scholar] [CrossRef]
- Mao, Z.; Huang, W.; Zhou, W.; Tang, L.; Shi, Q. In-situ stirring assisted hydrothermal synthesis of W-doped VO2(M) nanorods with improved doping efficiency and mid-infrared switching property. J. Alloys Compd. 2020, 821, 153556. [Google Scholar] [CrossRef]
- Cao, C.; Yanfeng, G.; Hongjie, L. Pure single-crystal rutile vanadium dioxide powders: Synthesis, mechanism and phase-transformation property. J. Phys. Chem. C 2008, 112, 18810–18814. [Google Scholar] [CrossRef]
- Yang, X.; Zou, J. Facile fabrication of VO2 composite film with enhanced significantly solar modulation performance by adjusting viscosity of VO2/PU dispersion. J. Alloys Compd. 2023, 940, 168868. [Google Scholar] [CrossRef]
- Li, B.; Tian, S.; Qian, J.; Wu, S.; Liu, B.; Zhao, X. In situ synthesis of highly dispersed VO2(M) nanoparticles on glass surface for energy efficient smart windows. Ceram. Int. 2023, 49, 2310–2318. [Google Scholar] [CrossRef]
- Yuan, L.; Hu, Z.; Hou, C.; Meng, X. In-Situ thermochromic mechanism of Spin-Coated VO2 film. Appl. Surf. Sci. 2021, 564, 150441. [Google Scholar] [CrossRef]
- Liu, B.; Cheng, K.; Nie, S.; Zhao, X.; Yu, H.; Yu, J.; Fujishima, A.; Nakata, K. Ice–water quenching induced Ti3+ self-doped TiO2 with surface lattice distortion and the increased photocatalytic activity. J. Phys. Chem. C 2017, 121, 19836–19848. [Google Scholar] [CrossRef]
- Li, B.; Tian, S.; Tao, H.; Zhao, X. Tungsten doped M-phase VO2 mesoporous nanocrystals with enhanced comprehensive thermochromic properties for smart windows. Ceram. Int. 2019, 45, 4342–4350. [Google Scholar] [CrossRef]
- Mohamed Azharudeen, A.; Karthiga, R.; Rajarajan, M.; Suganthi, A. Enhancement of electrochemical sensor for the determination of glucose based on mesoporous VO2/PVA nanocomposites. Surf. Interfaces 2019, 16, 164–173. [Google Scholar] [CrossRef]
Disclaimer/Publisher’s Note: The statements, opinions and data contained in all publications are solely those of the individual author(s) and contributor(s) and not of MDPI and/or the editor(s). MDPI and/or the editor(s) disclaim responsibility for any injury to people or property resulting from any ideas, methods, instructions or products referred to in the content. |
© 2023 by the authors. Licensee MDPI, Basel, Switzerland. This article is an open access article distributed under the terms and conditions of the Creative Commons Attribution (CC BY) license (https://creativecommons.org/licenses/by/4.0/).