
Study on the Application of Nitrogen-Doped Holey Graphene in Supercapacitors with Organic Electrolyte

 ,
,  and
and
Abstract
1. Introduction
2. Experimental Section
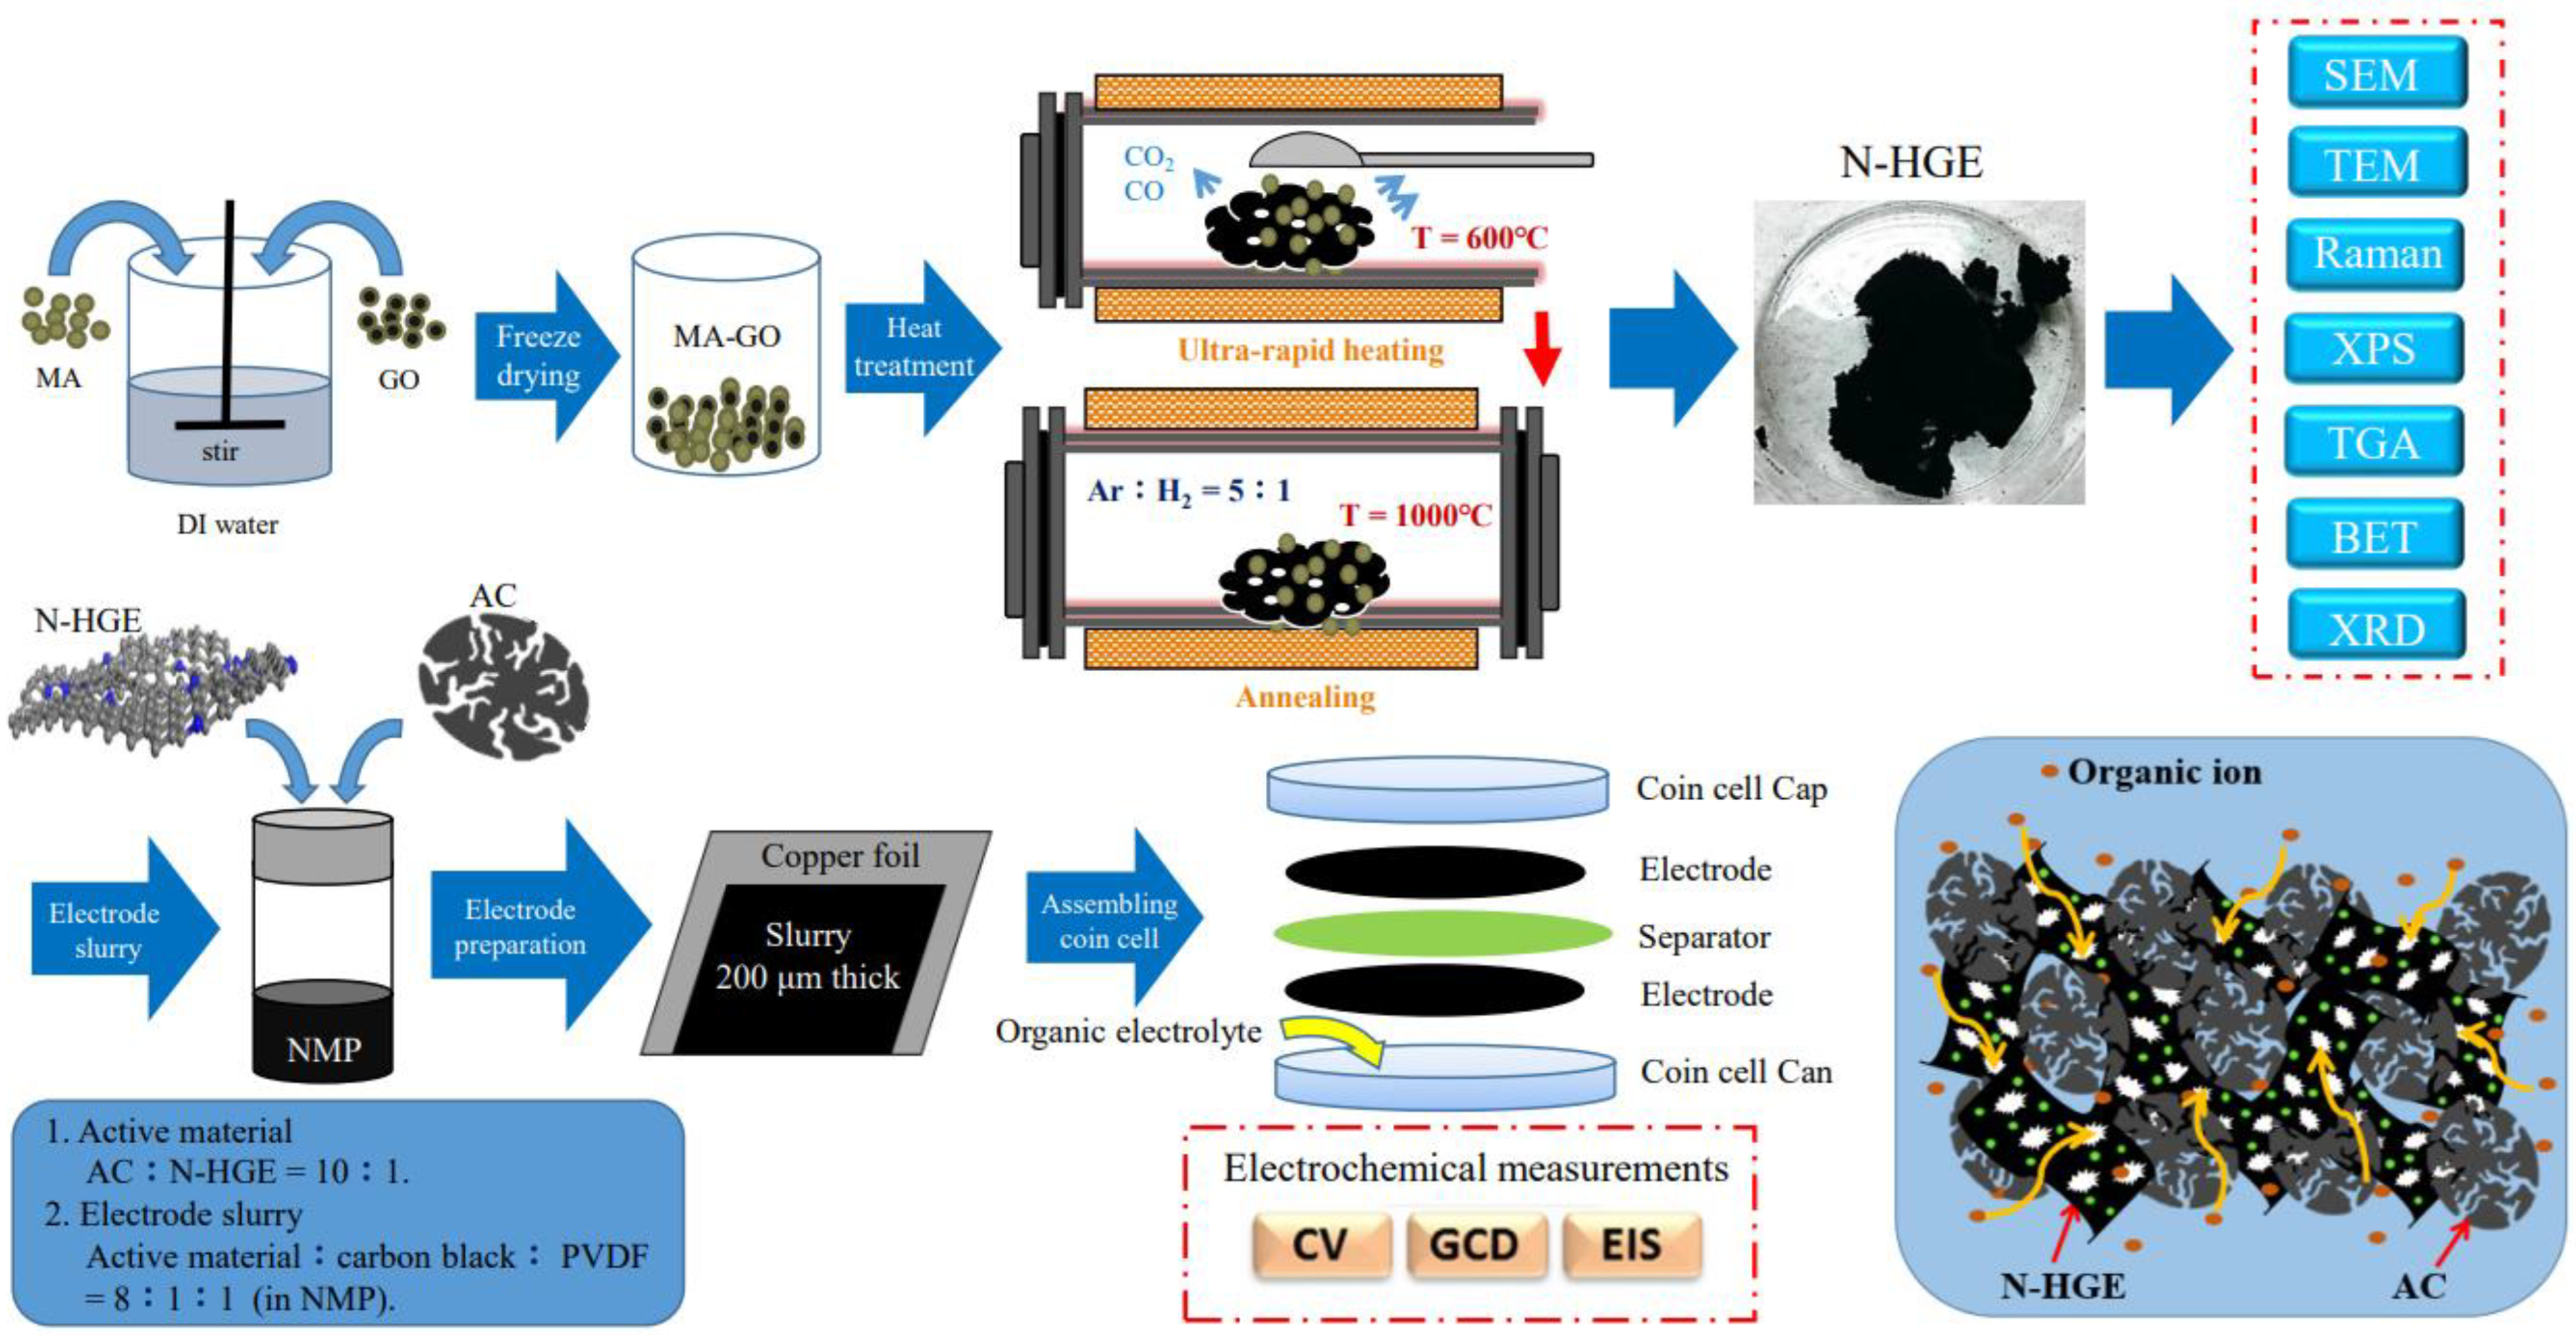
2.1. Preparation of N-Doped Graphene Samples
2.2. Characterization
2.3. Electrochemical Measurements
3. Results and Discussion
4. Conclusions
Supplementary Materials
Author Contributions
Funding
Data Availability Statement
Conflicts of Interest
References
- Largeot, C.; Portet, C.; Chmiola, J.; Taberna, P.-L.; Gogotsi, Y.; Simon, P. Relation between the Ion Size and Pore Size for an Electric Double-Layer Capacitor. J. Am. Chem. Soc. 2008, 130, 2730–2731. [Google Scholar] [CrossRef]
- Wang, G.; Zhang, L.; Zhang, J. A review of electrode materials for electrochemical supercapacitors. Chem. Soc. Rev. 2012, 41, 797–828. [Google Scholar] [CrossRef]
- Frackowiak, E.; Beguin, F. Carbon materials for the electrochemical storage of energy in capacitors. Carbon 2001, 39, 937–950. [Google Scholar] [CrossRef]
- Simon, P.; Gogotsi, Y.; Dunn, B. Where Do Batteries End and Supercapacitors Begin? Science 2014, 343, 1210–1211. [Google Scholar] [CrossRef]
- Wang, Y.; Song, Y.; Xia, Y. Electrochemical capacitors: Mechanism, materials, systems, characterization and applications. Chem. Soc. Rev. 2016, 45, 5925–5950. [Google Scholar] [CrossRef] [PubMed]
- Béguin, F.; Presser, V.; Balducci, A.; Frackowiak, E. Carbons and Electrolytes for Advanced Supercapacitors. Adv. Mater. 2014, 26, 2219–2251. [Google Scholar] [CrossRef] [PubMed]
- Frackowiak, E. Carbon materials for supercapacitor application. Phys. Chem. Chem. Phys. 2007, 9, 1774–1785. [Google Scholar] [CrossRef] [PubMed]
- Bose, S.; Kuila, T.; Mishra, A.K.; Rajasekar, R.; Kim, N.H.; Lee, J.H. Carbon-based nanostructured materials and their composites as supercapacitor electrodes. J. Mater. Chem. 2012, 22, 767–784. [Google Scholar] [CrossRef]
- Yan, J.; Wang, Q.; Wei, T.; Fan, Z. Recent Advances in Design and Fabrication of Electrochemical Supercapacitors with High Energy Densities. Adv. Energy Mater. 2014, 4, 1300816. [Google Scholar] [CrossRef]
- Zhang, L.L.; Zhou, R.; Zhao, X.S. Graphene-based materials as supercapacitor electrodes. J. Mater. Chem. 2010, 20, 5983–5992. [Google Scholar] [CrossRef]
- Xu, Y.; Lin, Z.; Zhong, X.; Huang, X.; Weiss, N.O.; Huang, Y.; Duan, X. Holey graphene frameworks for highly efficient capacitive energy storage. Nat. Commun. 2014, 5, 4554. [Google Scholar] [CrossRef]
- El-Kady, M.F.; Shao, Y.; Kaner, R.B. Graphene for batteries, supercapacitors and beyond. Nat. Rev. Mater. 2016, 1, 16033. [Google Scholar] [CrossRef]
- Li, Y.; van Zijll, M.; Chiang, S.; Pan, N. KOH modified graphene nanosheets for supercapacitor electrodes. J. Power Sources 2011, 196, 6003–6006. [Google Scholar] [CrossRef]
- Shao, Y.; El-Kady, M.F.; Wang, L.J.; Zhang, Q.; Li, Y.; Wang, H.; Mousavi, M.F.; Kaner, R.B. Graphene-based materials for flexible supercapacitors. Chem. Soc. Rev. 2015, 44, 3639–3665. [Google Scholar] [CrossRef] [PubMed]
- Huang, J.; Wang, J.; Wang, C.; Zhang, H.; Lu, C.; Wang, J. Hierarchical Porous Graphene Carbon-Based Supercapacitors. Chem. Mater. 2015, 27, 2107–2113. [Google Scholar] [CrossRef]
- Yan, J.; Wei, T.; Fan, Z.; Qian, W.; Zhang, M.; Shen, X.; Wei, F. Preparation of graphene nanosheet/carbon nanotube/polyaniline composite as electrode material for supercapacitors. J. Power Sources 2010, 195, 3041–3045. [Google Scholar] [CrossRef]
- Wang, H.; Ma, L.; Gan, M.; Zhou, T.; Sun, X.; Dai, W.; Wang, H.; Wang, S. Design and assembly of reduced graphene oxide/polyaniline/urchin-like mesoporous TiO2 spheres ternary composite and its application in supercapacitors. Compos. Part B Eng. 2016, 92, 405–412. [Google Scholar] [CrossRef]
- Huang, J.-B.; Patra, J.; Lin, M.-H.; Ger, M.-D.; Liu, Y.-M.; Pu, N.-W.; Hsieh, C.-T.; Youh, M.-J.; Dong, Q.-F.; Chang, J.-K. A Holey Graphene Additive for Boosting Performance of Electric Double-Layer Supercapacitors. Polymers 2020, 12, 765. [Google Scholar] [CrossRef]
- Yan, J.; Liu, J.; Fan, Z.; Wei, T.; Zhang, L. High-performance supercapacitor electrodes based on highly corrugated graphene sheets. Carbon 2012, 50, 2179–2188. [Google Scholar] [CrossRef]
- Liu, C.; Yu, Z.; Neff, D.; Zhamu, A.; Jang, B.Z. Graphene-Based Supercapacitor with an Ultrahigh Energy Density. Nano Lett. 2010, 10, 4863–4868. [Google Scholar] [CrossRef]
- Peng, Y.-Y.; Liu, Y.-M.; Chang, J.-K.; Wu, C.-H.; Ger, M.-D.; Pu, N.-W.; Chang, C.-L. A facile approach to produce holey graphene and its application in supercapacitors. Carbon 2015, 81, 347–356. [Google Scholar] [CrossRef]
- Kim, T.; Jung, G.; Yoo, S.; Suh, K.S.; Ruoff, R.S. Activated Graphene-Based Carbons as Supercapacitor Electrodes with Macro- and Mesopores. ACS Nano 2013, 7, 6899–6905. [Google Scholar] [CrossRef] [PubMed]
- Tran, T.S.; Tripathi, K.M.; Kim, B.N.; You, I.K.; Park, B.J.; Han, Y.H.; Kim, T. Three-dimensionally assembled Graphene/α-MnO2 nanowire hybrid hydrogels for high performance supercapacitors. Mater. Res. Bull. 2017, 96, 395–404. [Google Scholar] [CrossRef]
- Tran, T.S.; Dutta, N.K.; Choudhury, N.R. Poly(ionic liquid)-Stabilized Graphene Nanoinks for Scalable 3D Printing of Graphene Aerogels. ACS Appl. Nano Mater. 2020, 3, 11608–11619. [Google Scholar] [CrossRef]
- Luo, J.; Jang, H.D.; Sun, T.; Xiao, L.; He, Z.; Katsoulidis, A.P.; Kanatzidis, M.G.; Gibson, J.M.; Huang, J. Compression and Aggregation-Resistant Particles of Crumpled Soft Sheets. ACS Nano 2011, 5, 8943–8949. [Google Scholar] [CrossRef]
- Usachov, D.; Vilkov, O.; Gruneis, A.; Haberer, D.; Fedorov, A.; Adamchuk, V.K.; Preobrajenski, A.B.; Dudin, P.; Barinov, A.; Oehzelt, M.; et al. Nitrogen-doped graphene: Efficient growth, structure, and electronic properties. Nano Lett. 2011, 11, 5401–5407. [Google Scholar] [CrossRef] [PubMed]
- Zhao, L.; He, R.; Rim, K.T.; Schiros, T.; Kim, K.S.; Zhou, H.; Gutiérrez, C.; Chockalingam, S.P.; Arguello, C.J.; Pálová, L.; et al. Visualizing Individual Nitrogen Dopants in Monolayer Graphene. Science 2011, 333, 999–1003. [Google Scholar] [CrossRef]
- Li, J.; Li, X.; Xiong, D.; Wang, L.; Li, D. Enhanced capacitance of boron-doped graphene aerogels for aqueous symmetric supercapacitors. Appl. Surf. Sci. 2019, 475, 285–293. [Google Scholar] [CrossRef]
- Niu, L.; Li, Z.; Hong, W.; Sun, J.; Wang, Z.; Ma, L.; Wang, J.; Yang, S. Pyrolytic synthesis of boron-doped graphene and its application as electrode material for supercapacitors. Electrochimica Acta 2013, 108, 666–673. [Google Scholar] [CrossRef]
- Jeong, H.M.; Lee, J.W.; Shin, W.H.; Choi, Y.J.; Shin, H.J.; Kang, J.K.; Choi, J.W. Nitrogen-Doped Graphene for High-Performance Ultracapacitors and the Importance of Nitrogen-Doped Sites at Basal Planes. Nano Lett. 2011, 11, 2472–2477. [Google Scholar] [CrossRef]
- Śliwak, A.; Grzyb, B.; Díez, N.; Gryglewicz, G. Nitrogen-doped reduced graphene oxide as electrode material for high rate supercapacitors. Appl. Surf. Sci. 2017, 399, 265–271. [Google Scholar] [CrossRef]
- Staudenmaier, L. Verfahren zur Darstellung der Graphitsäure. Eur. J. Inorg. Chem. 1898, 31, 1481–1487. [Google Scholar] [CrossRef]
- Youh, M.-J.; Huang, Y.-R.; Peng, C.-H.; Lin, M.-H.; Chen, T.-Y.; Chen, C.-Y.; Liu, Y.-M.; Pu, N.-W.; Liu, B.-Y.; Chou, C.-H.; et al. Using Graphene-Based Composite Materials to Boost Anti-Corrosion and Infrared-Stealth Performance of Epoxy Coatings. Nanomaterials 2021, 11, 1603. [Google Scholar] [CrossRef]
- Fang, D.-L.; Chen, Z.-D.; Liu, X.; Wu, Z.-F.; Zheng, C.-H. Homogeneous growth of nano-sized β-Ni(OH)2 on reduced graphene oxide for high-performance supercapacitors. Electrochimica Acta 2012, 81, 321–329. [Google Scholar] [CrossRef]
- Pu, N.-W. Hydrothermal Synthesis of N-Doped Graphene/Fe2O3 Nanocomposite for Supercapacitors. Int. J. Electrochem. Sci. 2018, 13, 6812–6823. [Google Scholar] [CrossRef]
- Bai, Y.; Rakhi, R.B.; Chen, W.; Alshareef, H.N. Effect of pH-induced chemical modification of hydrothermally reduced graphene oxide on supercapacitor performance. J. Power Sources 2013, 233, 313–319. [Google Scholar] [CrossRef]
- Zheng, C.; Zhou, X.; Cao, H.; Wang, G.; Liu, Z. Synthesis of porous graphene/activated carbon composite with high packing density and large specific surface area for supercapacitor electrode material. J. Power Sources 2014, 258, 290–296. [Google Scholar] [CrossRef]
- Hao, P.; Zhao, Z.; Leng, Y.; Tian, J.; Sang, Y.; Boughton, R.I.; Wong, C.P.; Liu, H.; Yang, B. Graphene-based nitrogen self-doped hierarchical porous carbon aerogels derived from chitosan for high performance supercapacitors. Nano Energy 2015, 15, 9–23, 2015. [Google Scholar] [CrossRef]
- Yan, J.; Shen, J.; Li, L.; Ma, X.-K.; Cui, J.-H.; Wang, L.-Z.; Zhang, Y. Template-like N, S and O tri-doping activated carbon derived from helianthus pallet as high-performance material for supercapacitors. Diam. Relat. Mater. 2020, 102, 107693. [Google Scholar] [CrossRef]


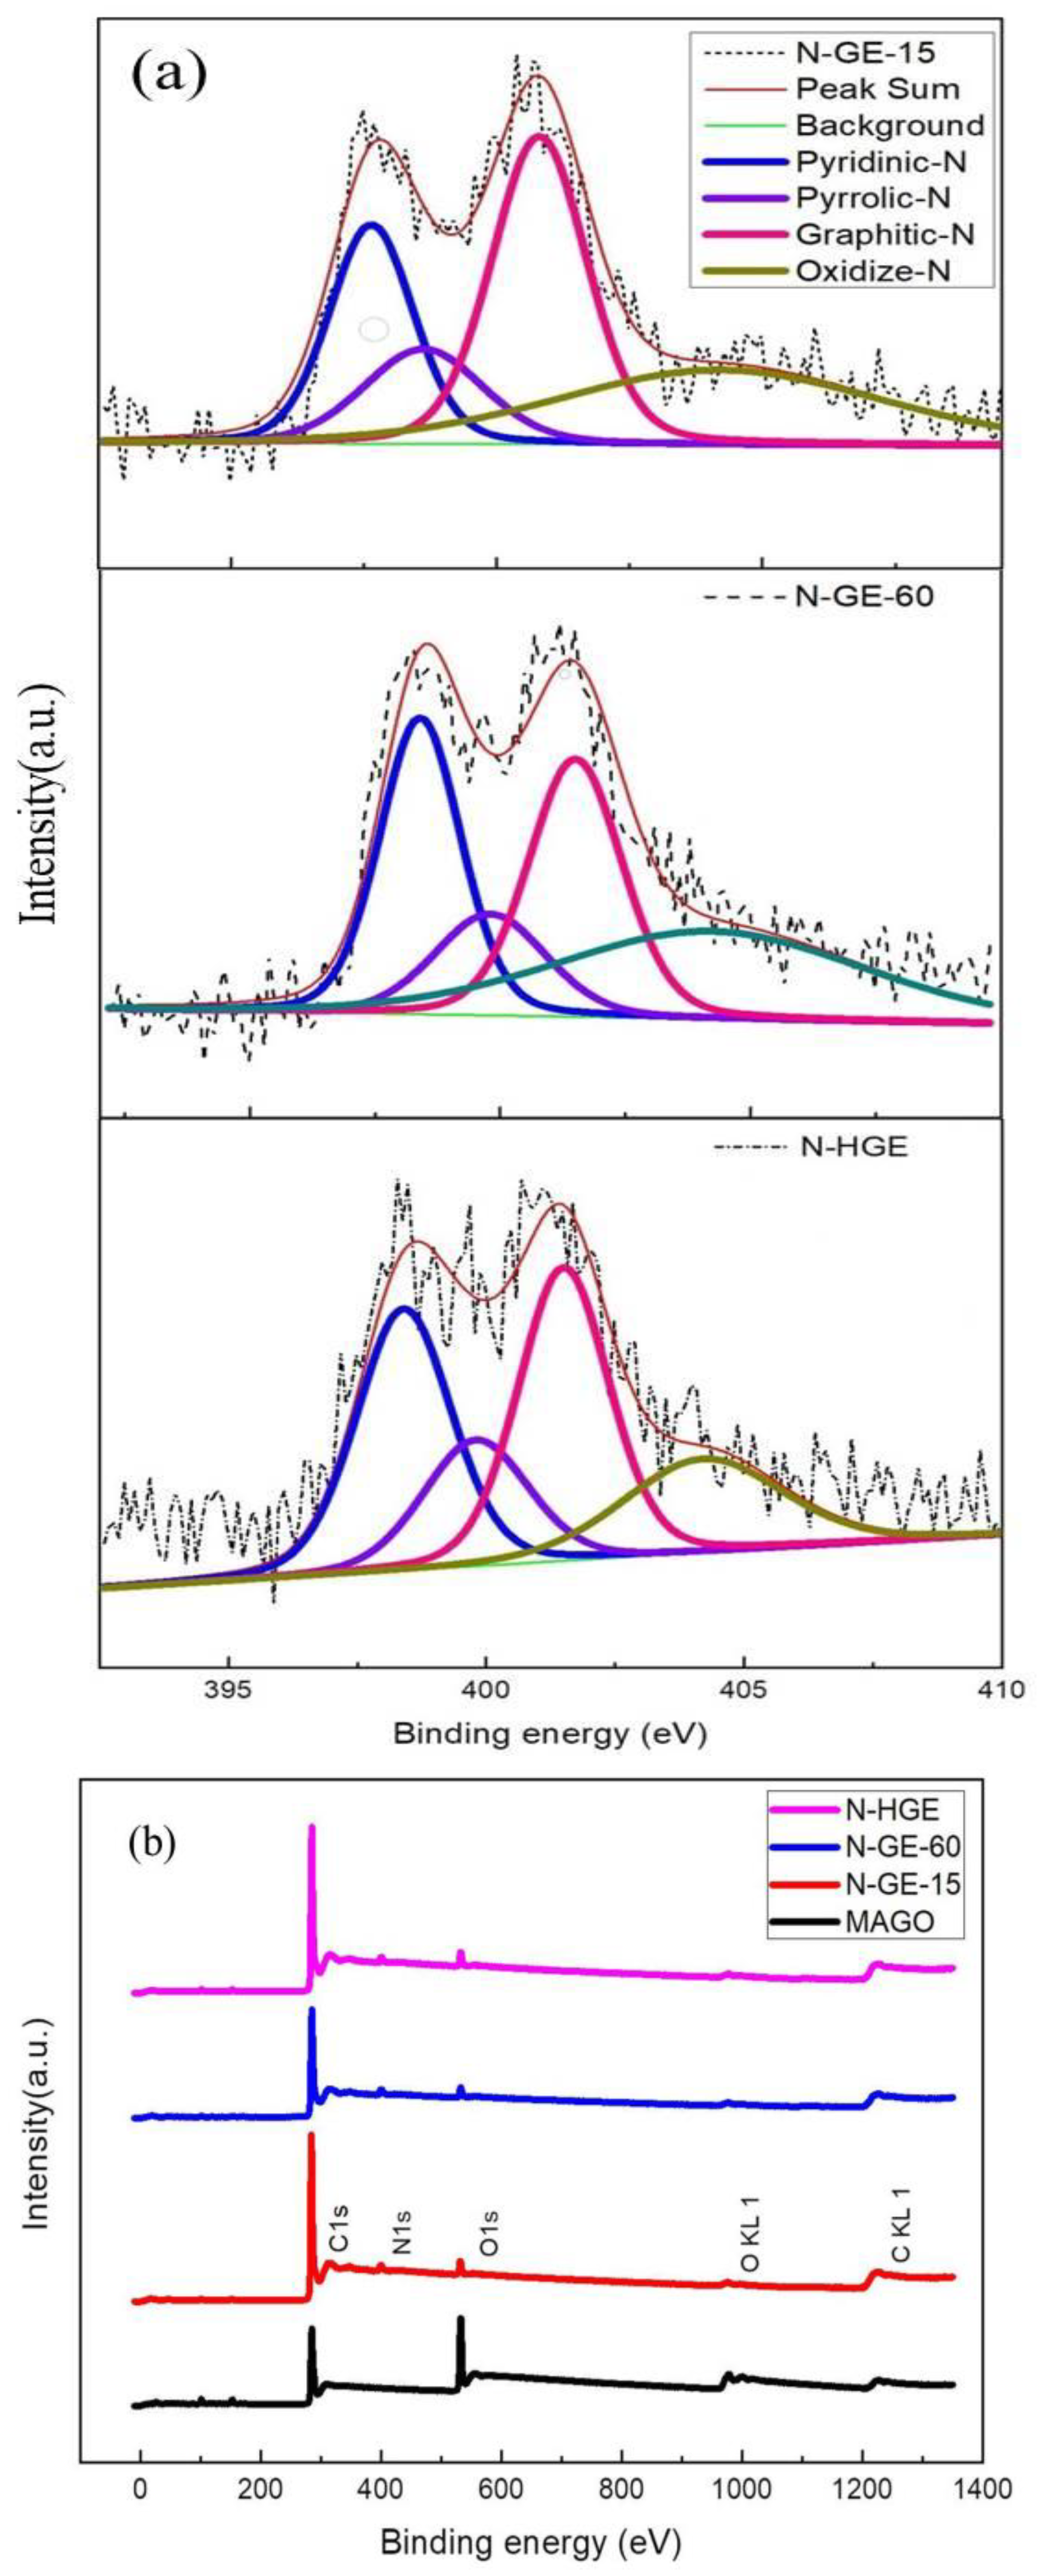
| Sample | C (at.%) | N (at.%) | O (at.%) |
|---|---|---|---|
| N-GE-15 | 92.3% | 3.5% | 4.1% |
| N-GE-60 | 90.9% | 4.5% | 4.4% |
| N-HGE | 92.1% | 3.4% | 4.4% |
| Sample | Layer Thickness (µm) | Layer Weight (mg) | Film Density (g/cm3) | Current Density | |||
|---|---|---|---|---|---|---|---|
| 0.5 A/g | 20 A/g | 0.5 A/g | 20 A/g | ||||
| Volumetric Capacitance (F/cm3) | Gravimetric Capacitance (F/g) | ||||||
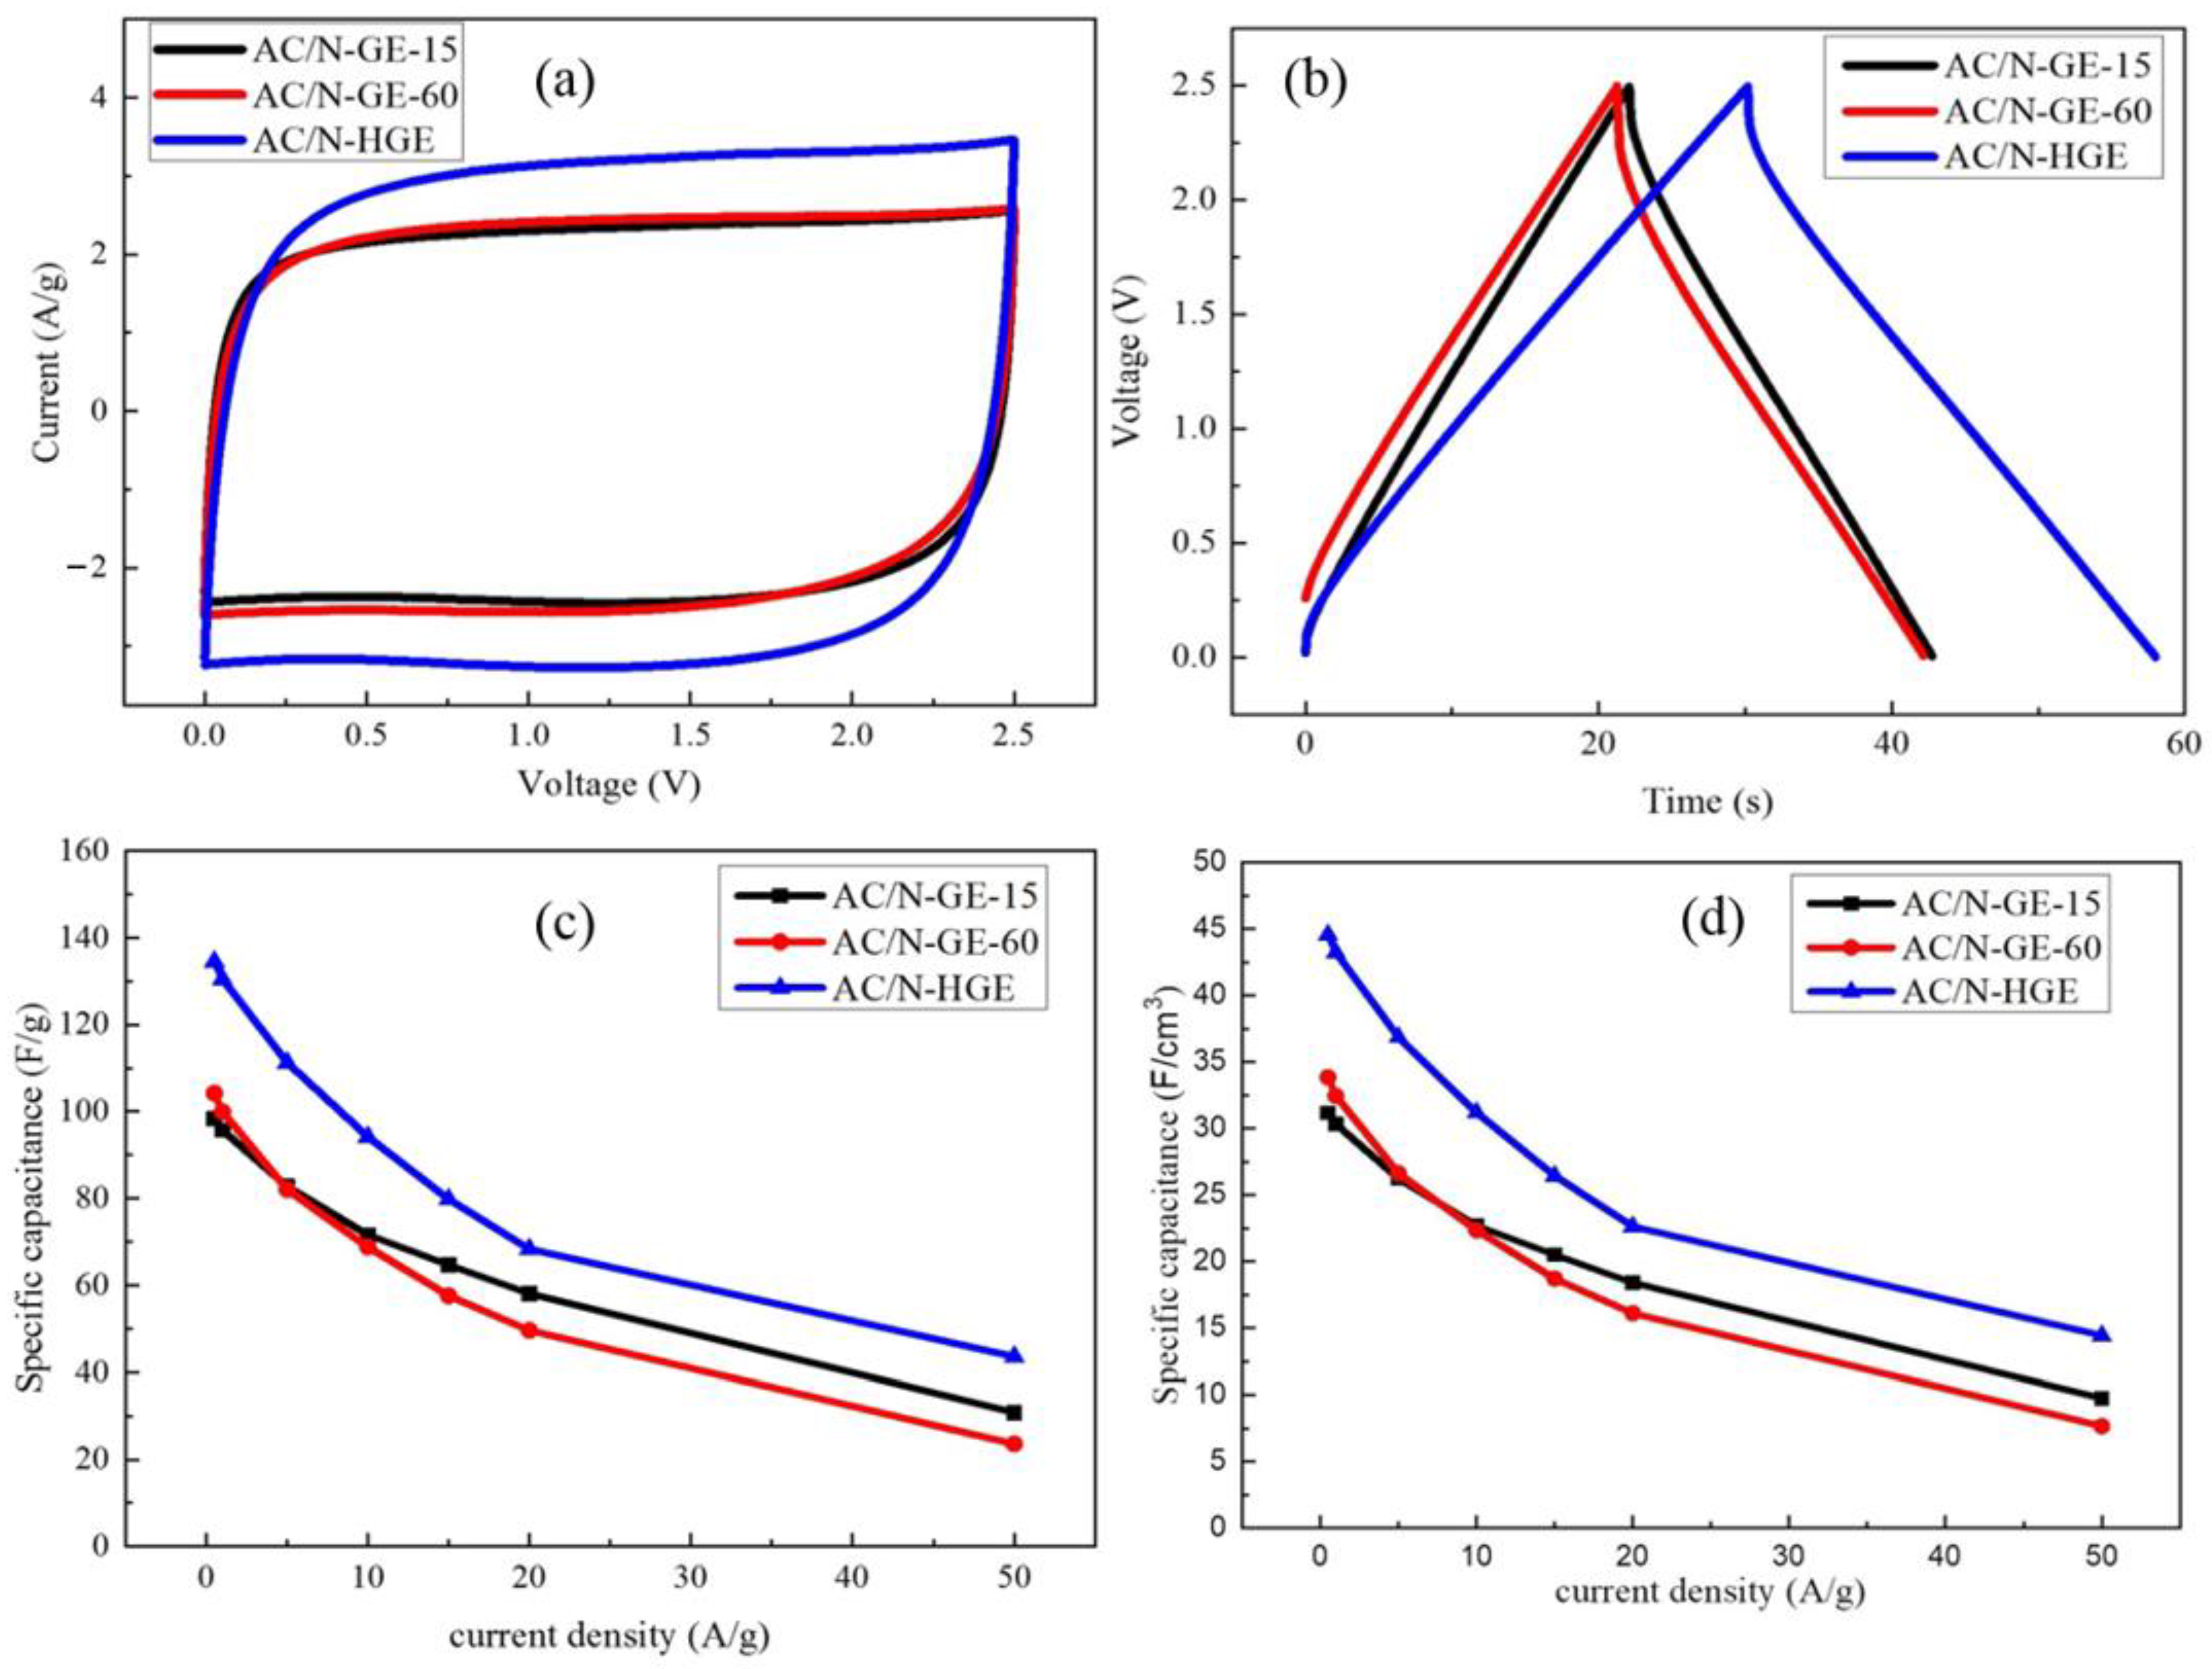
| AC/N-GE-15 | 25 | 1.22 | 0.317 | 31 | 18 | 98 | 58 |
| AC/N-GE-60 | 28 | 1.4 | 0.324 | 33 | 16 | 104 | 49 |
| AC/N-HGE | 24 | 1.02 | 0.331 | 44 | 22 | 134 | 68 |
| Sample | Rs (Ω) | Rct (Ω) |
|---|---|---|
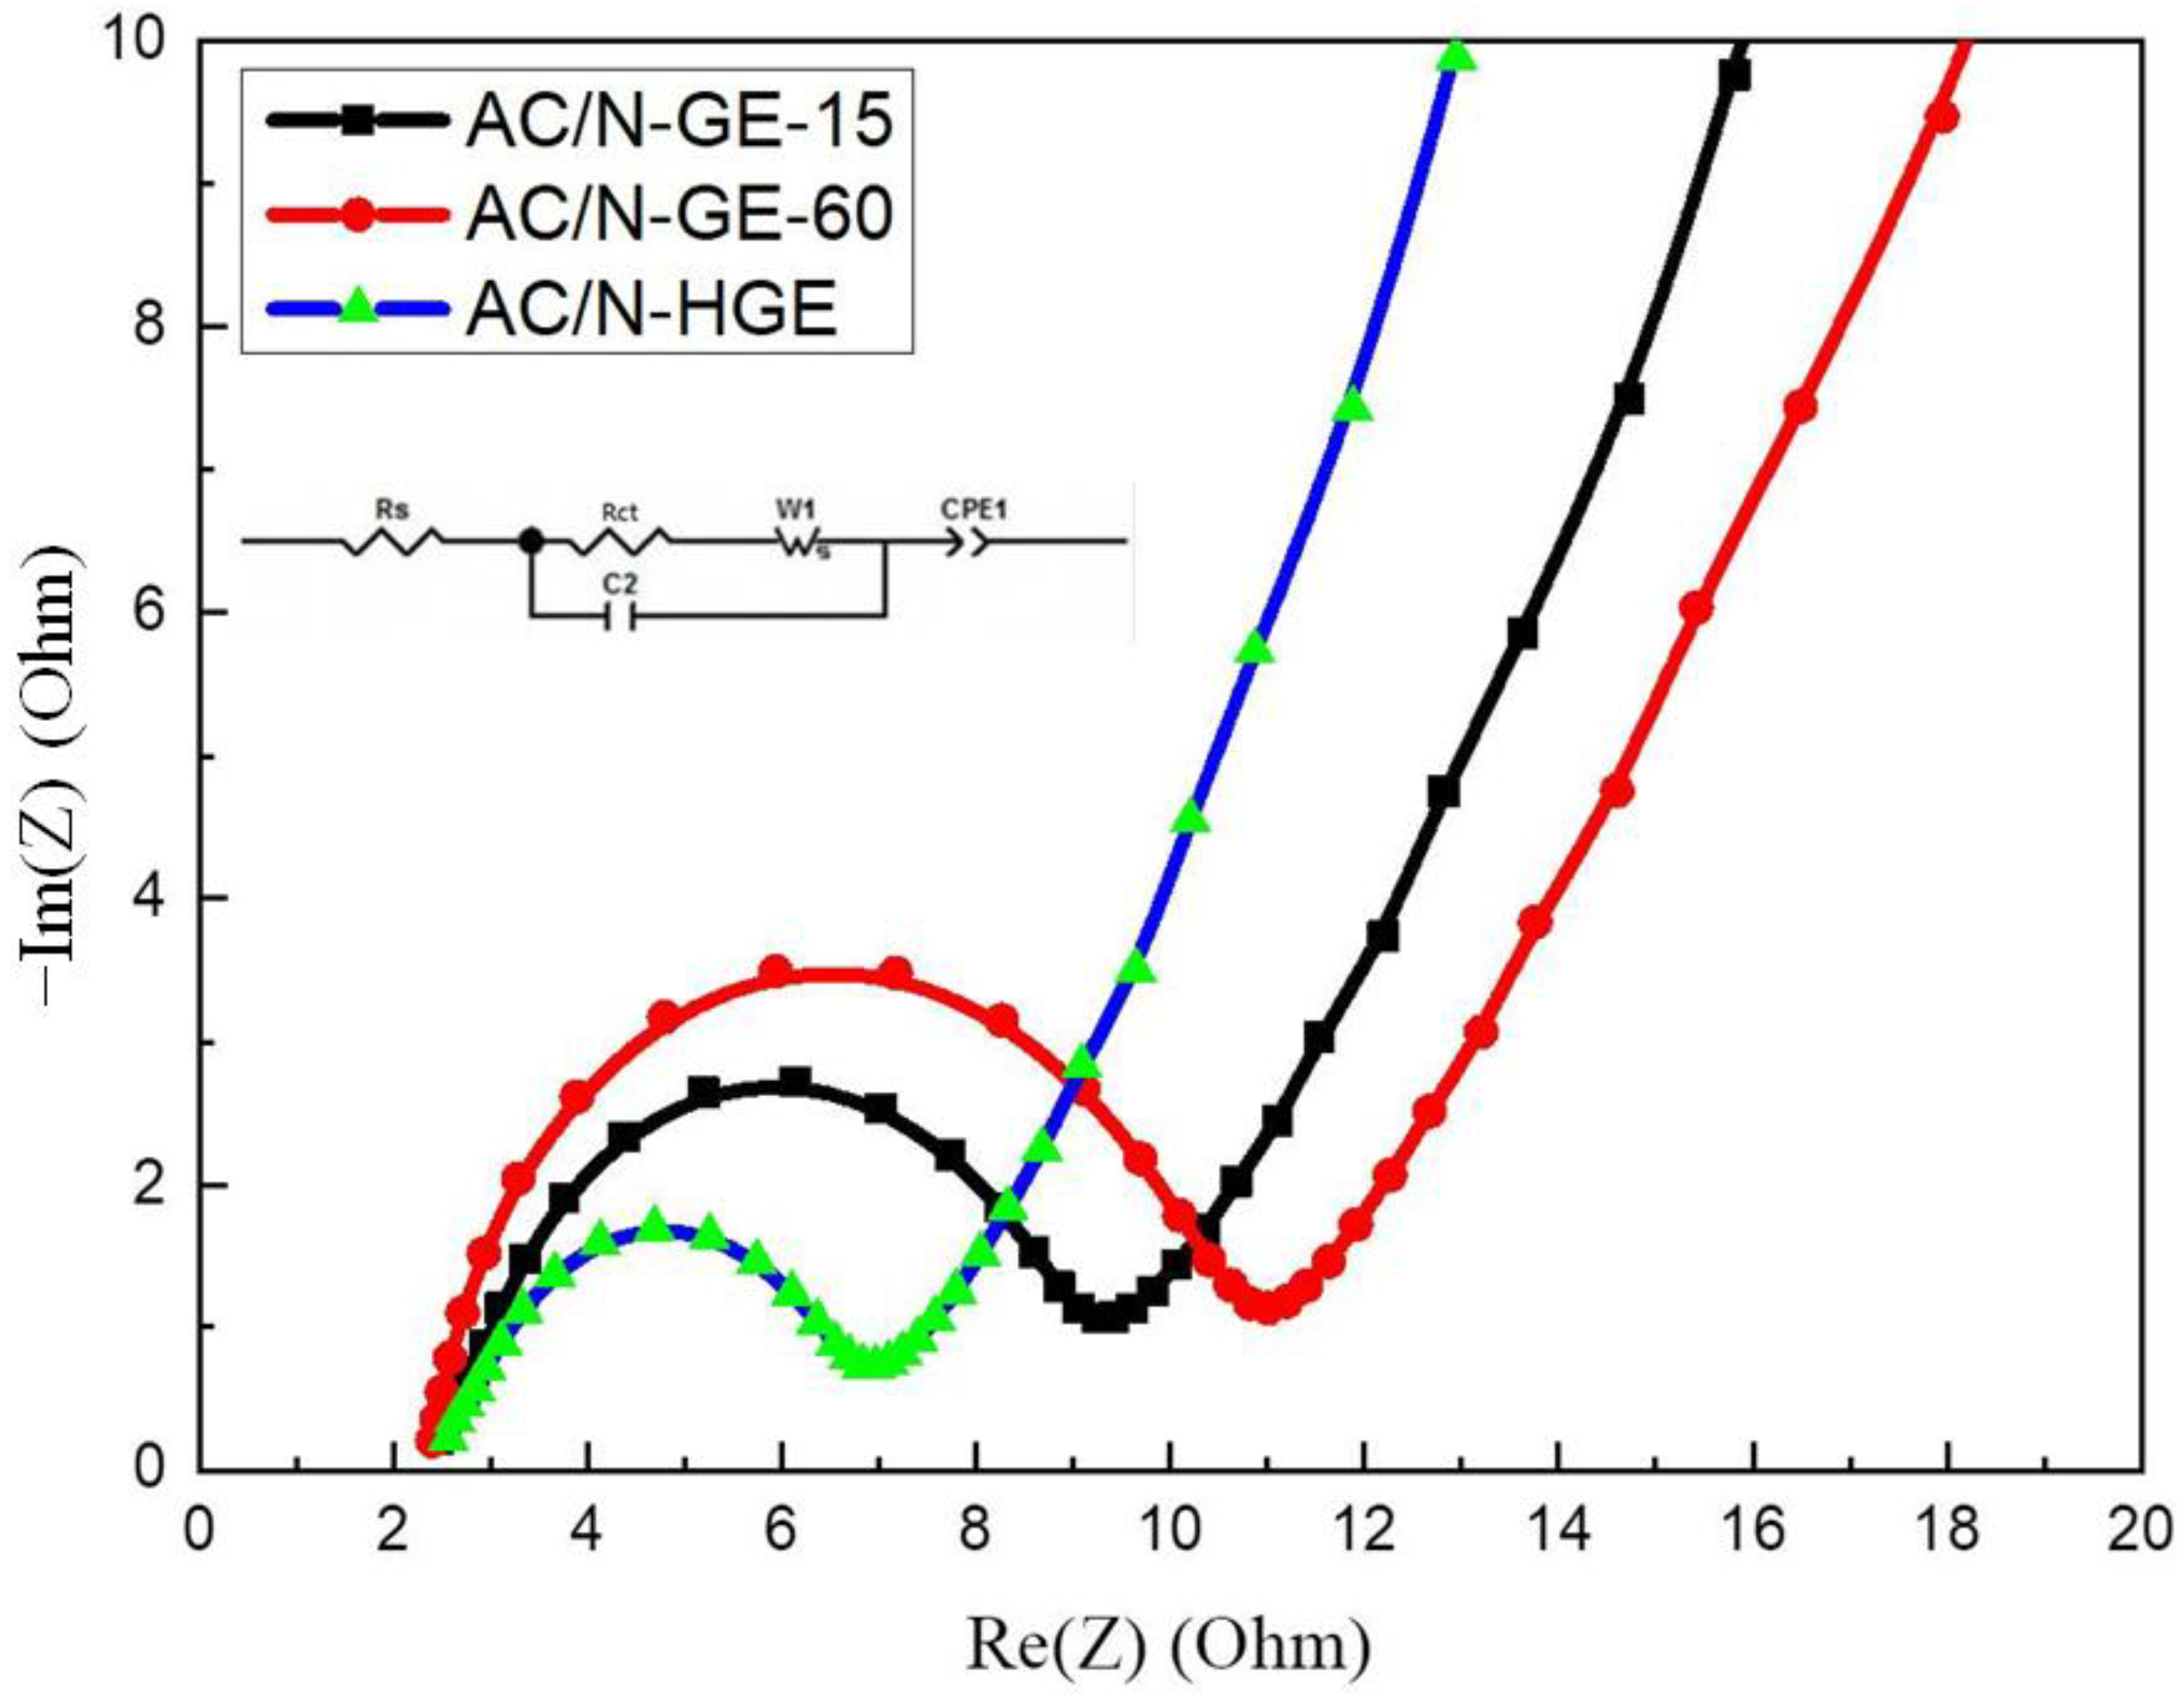
| AC/N-GE-15 | 2.45 | 6.78 |
| AC/N-GE-60 | 2.40 | 8.60 |
| AC/N-HGE | 2.56 | 4.39 |
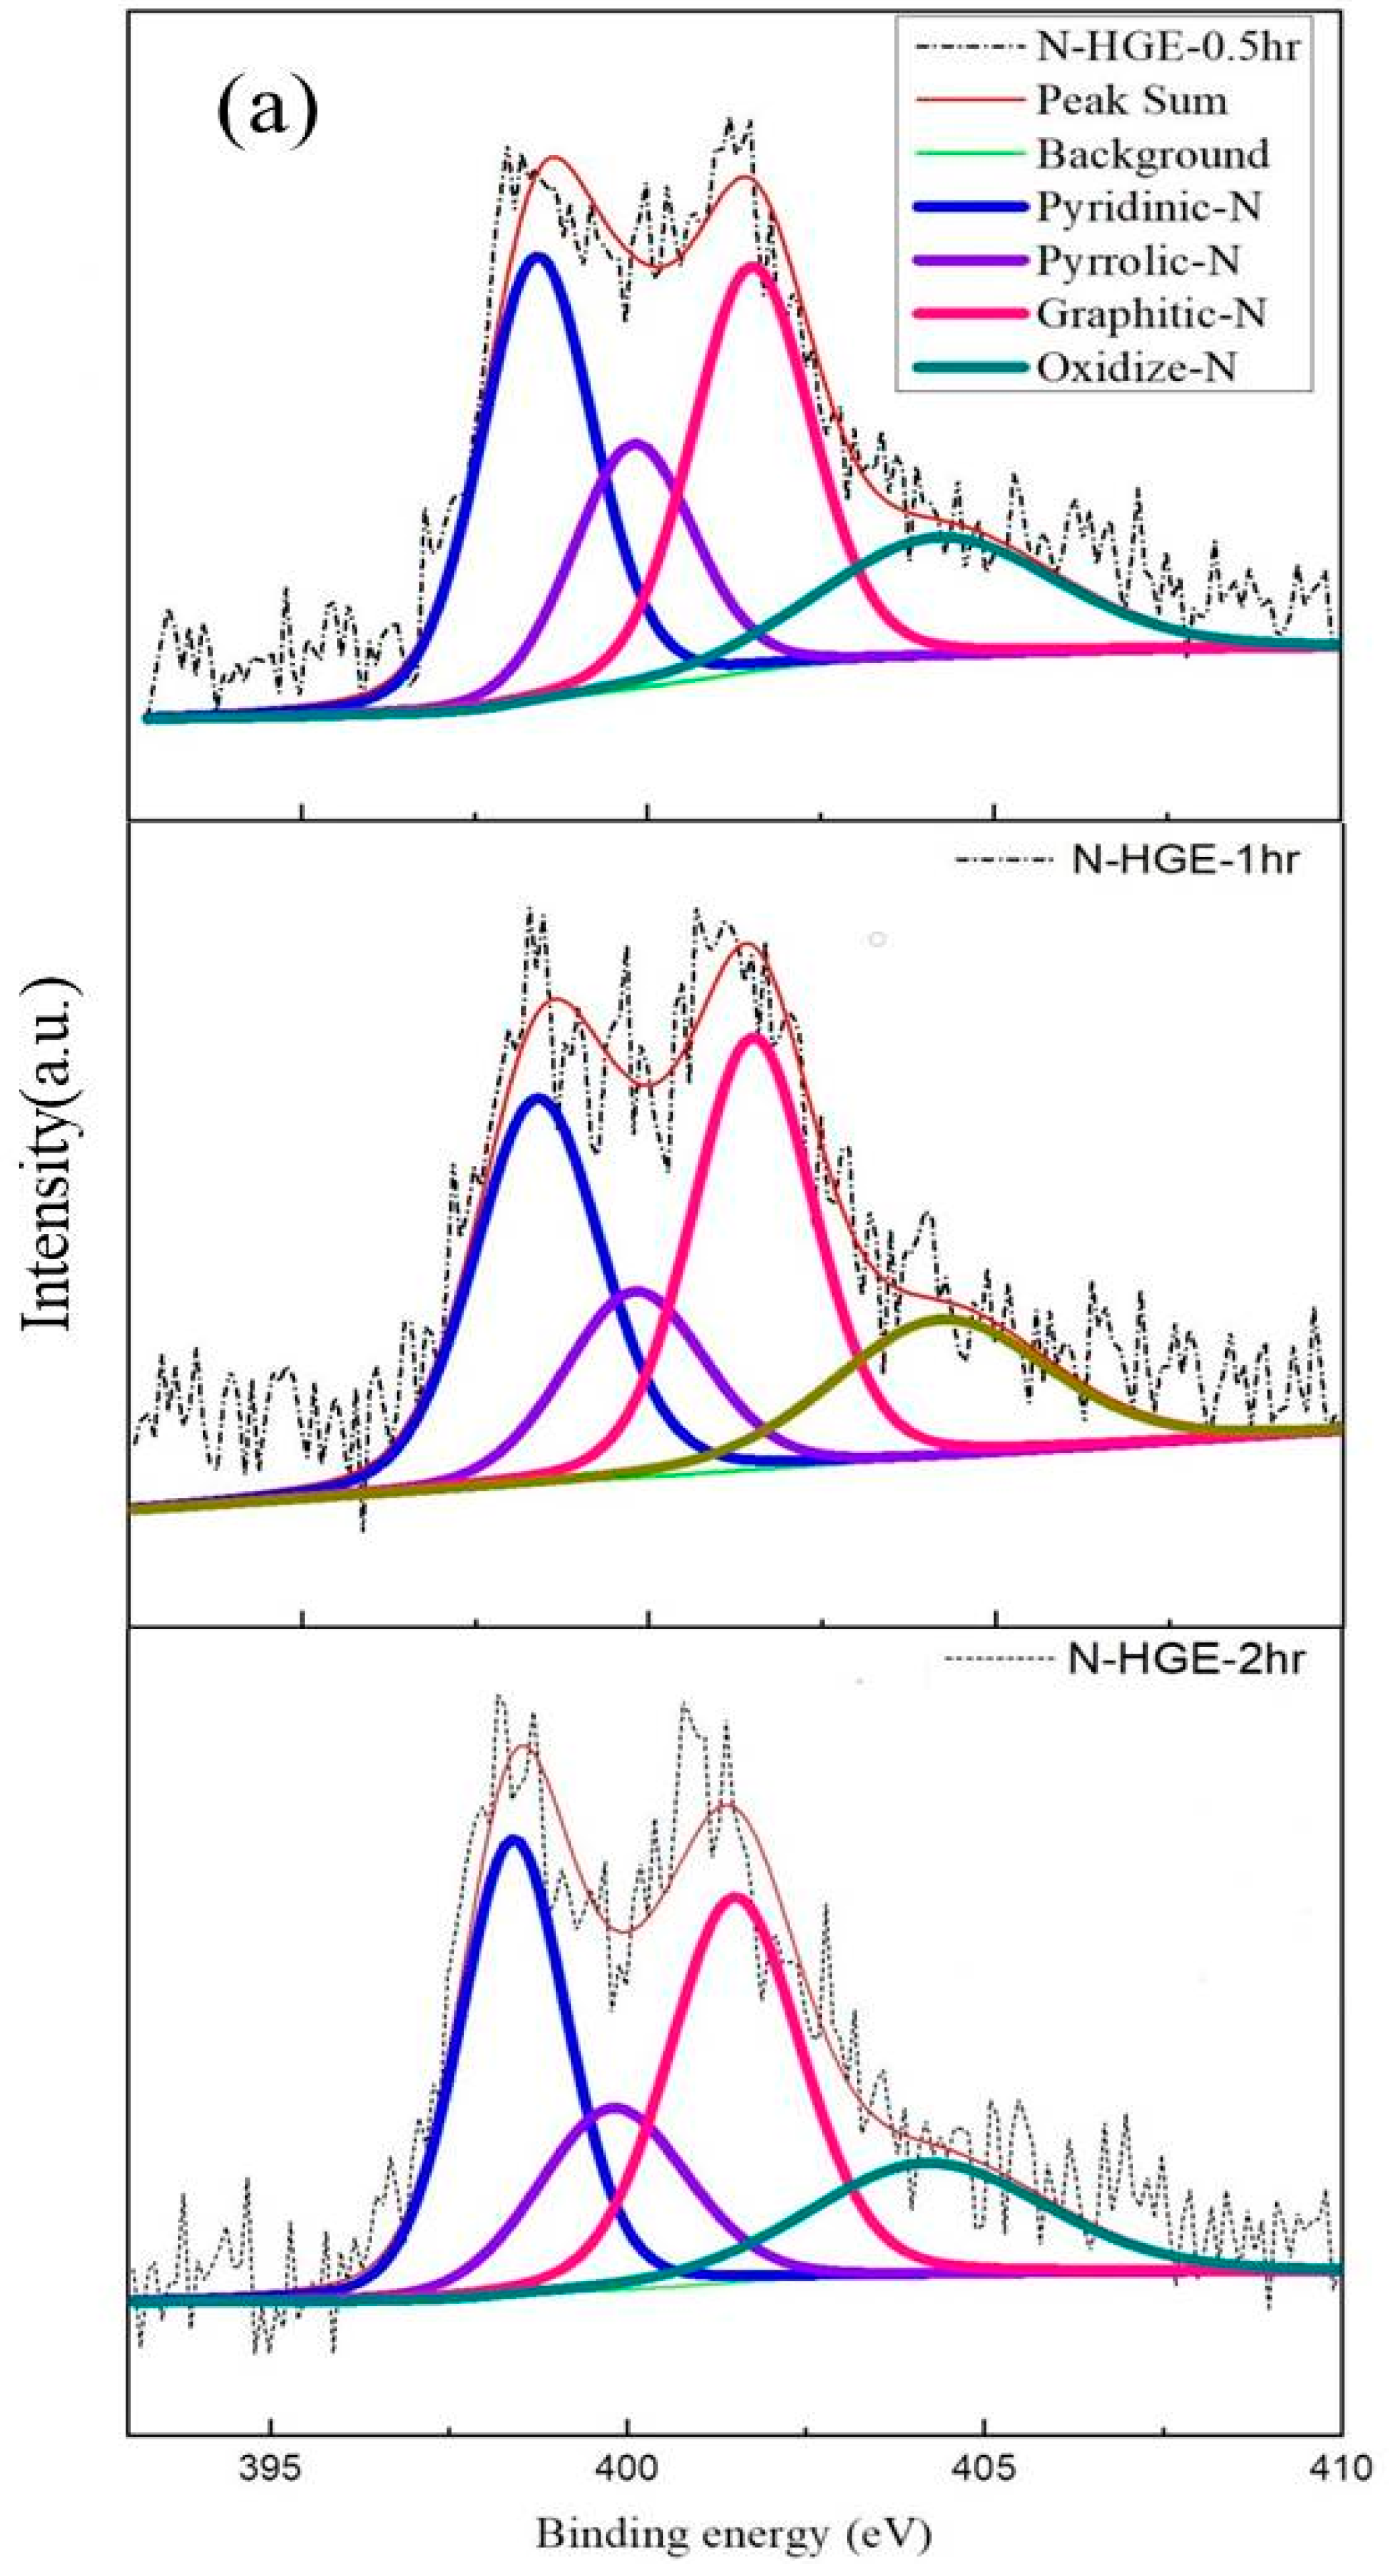
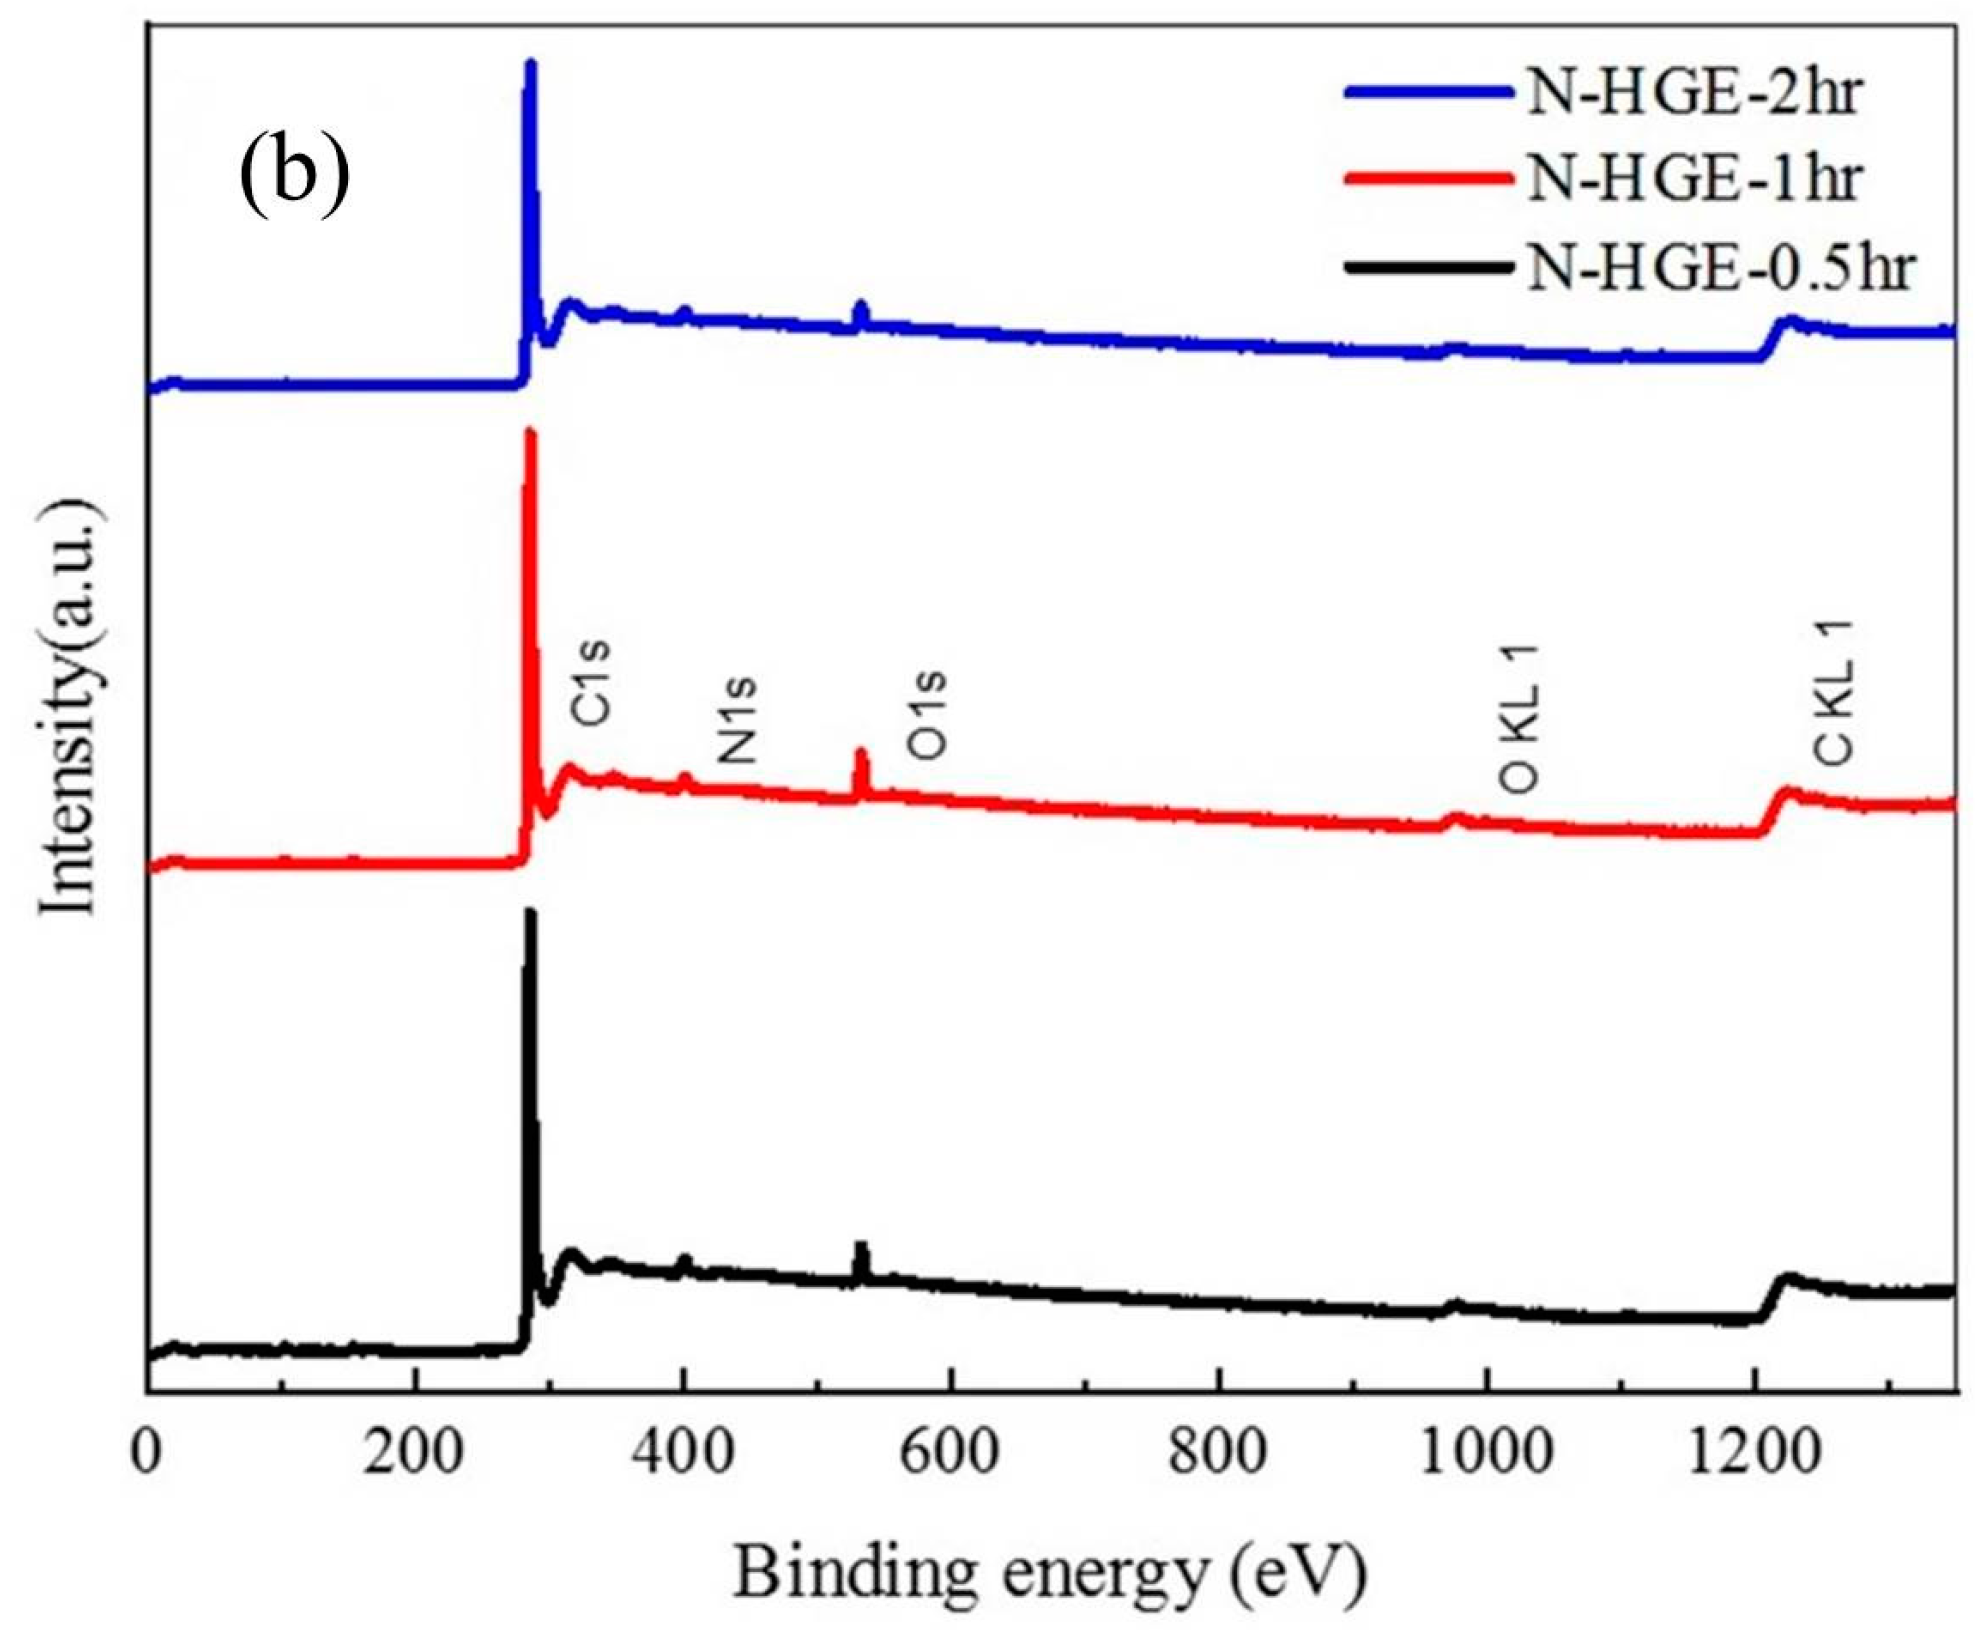
| Sample | C (at.%) | N (at.%) | O (at.%) |
|---|---|---|---|
| N-HGE-0.5hr | 92.0% | 3.6% | 4.3% |
| N-HGE-1hr | 92.4% | 3.2% | 4.2% |
| N-HGE-2hr | 93.2% | 2.9% | 3.8% |
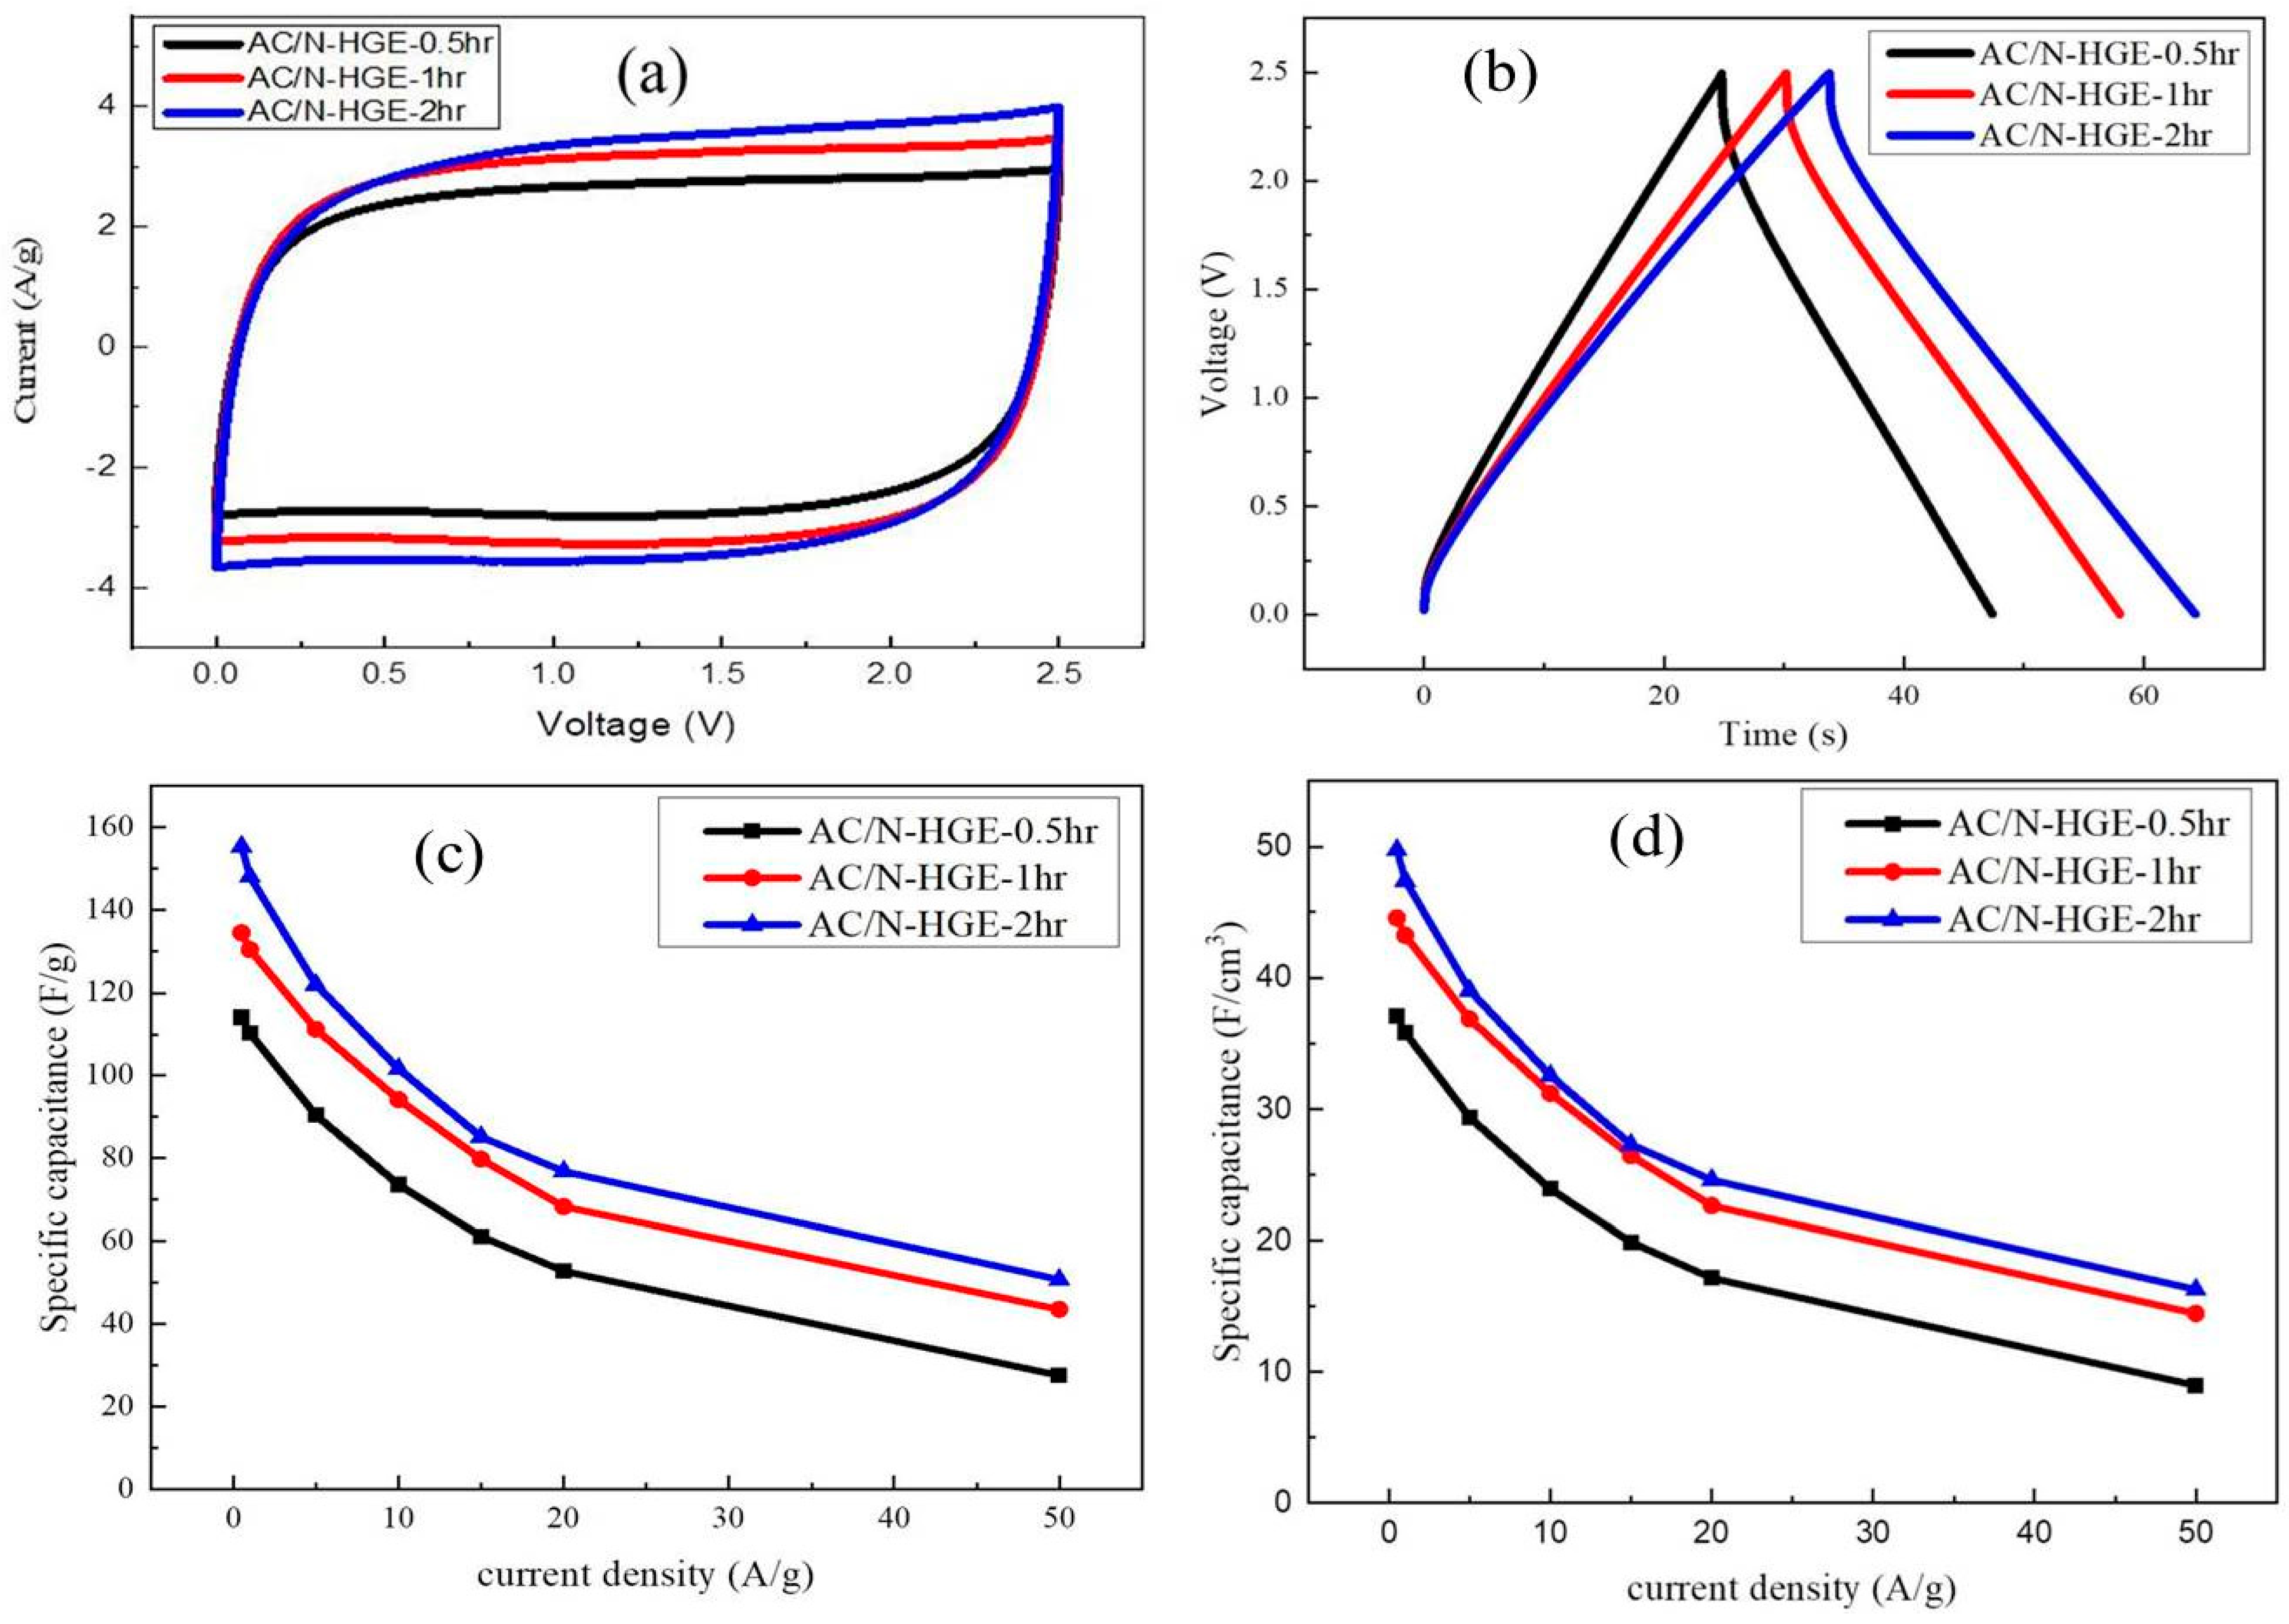
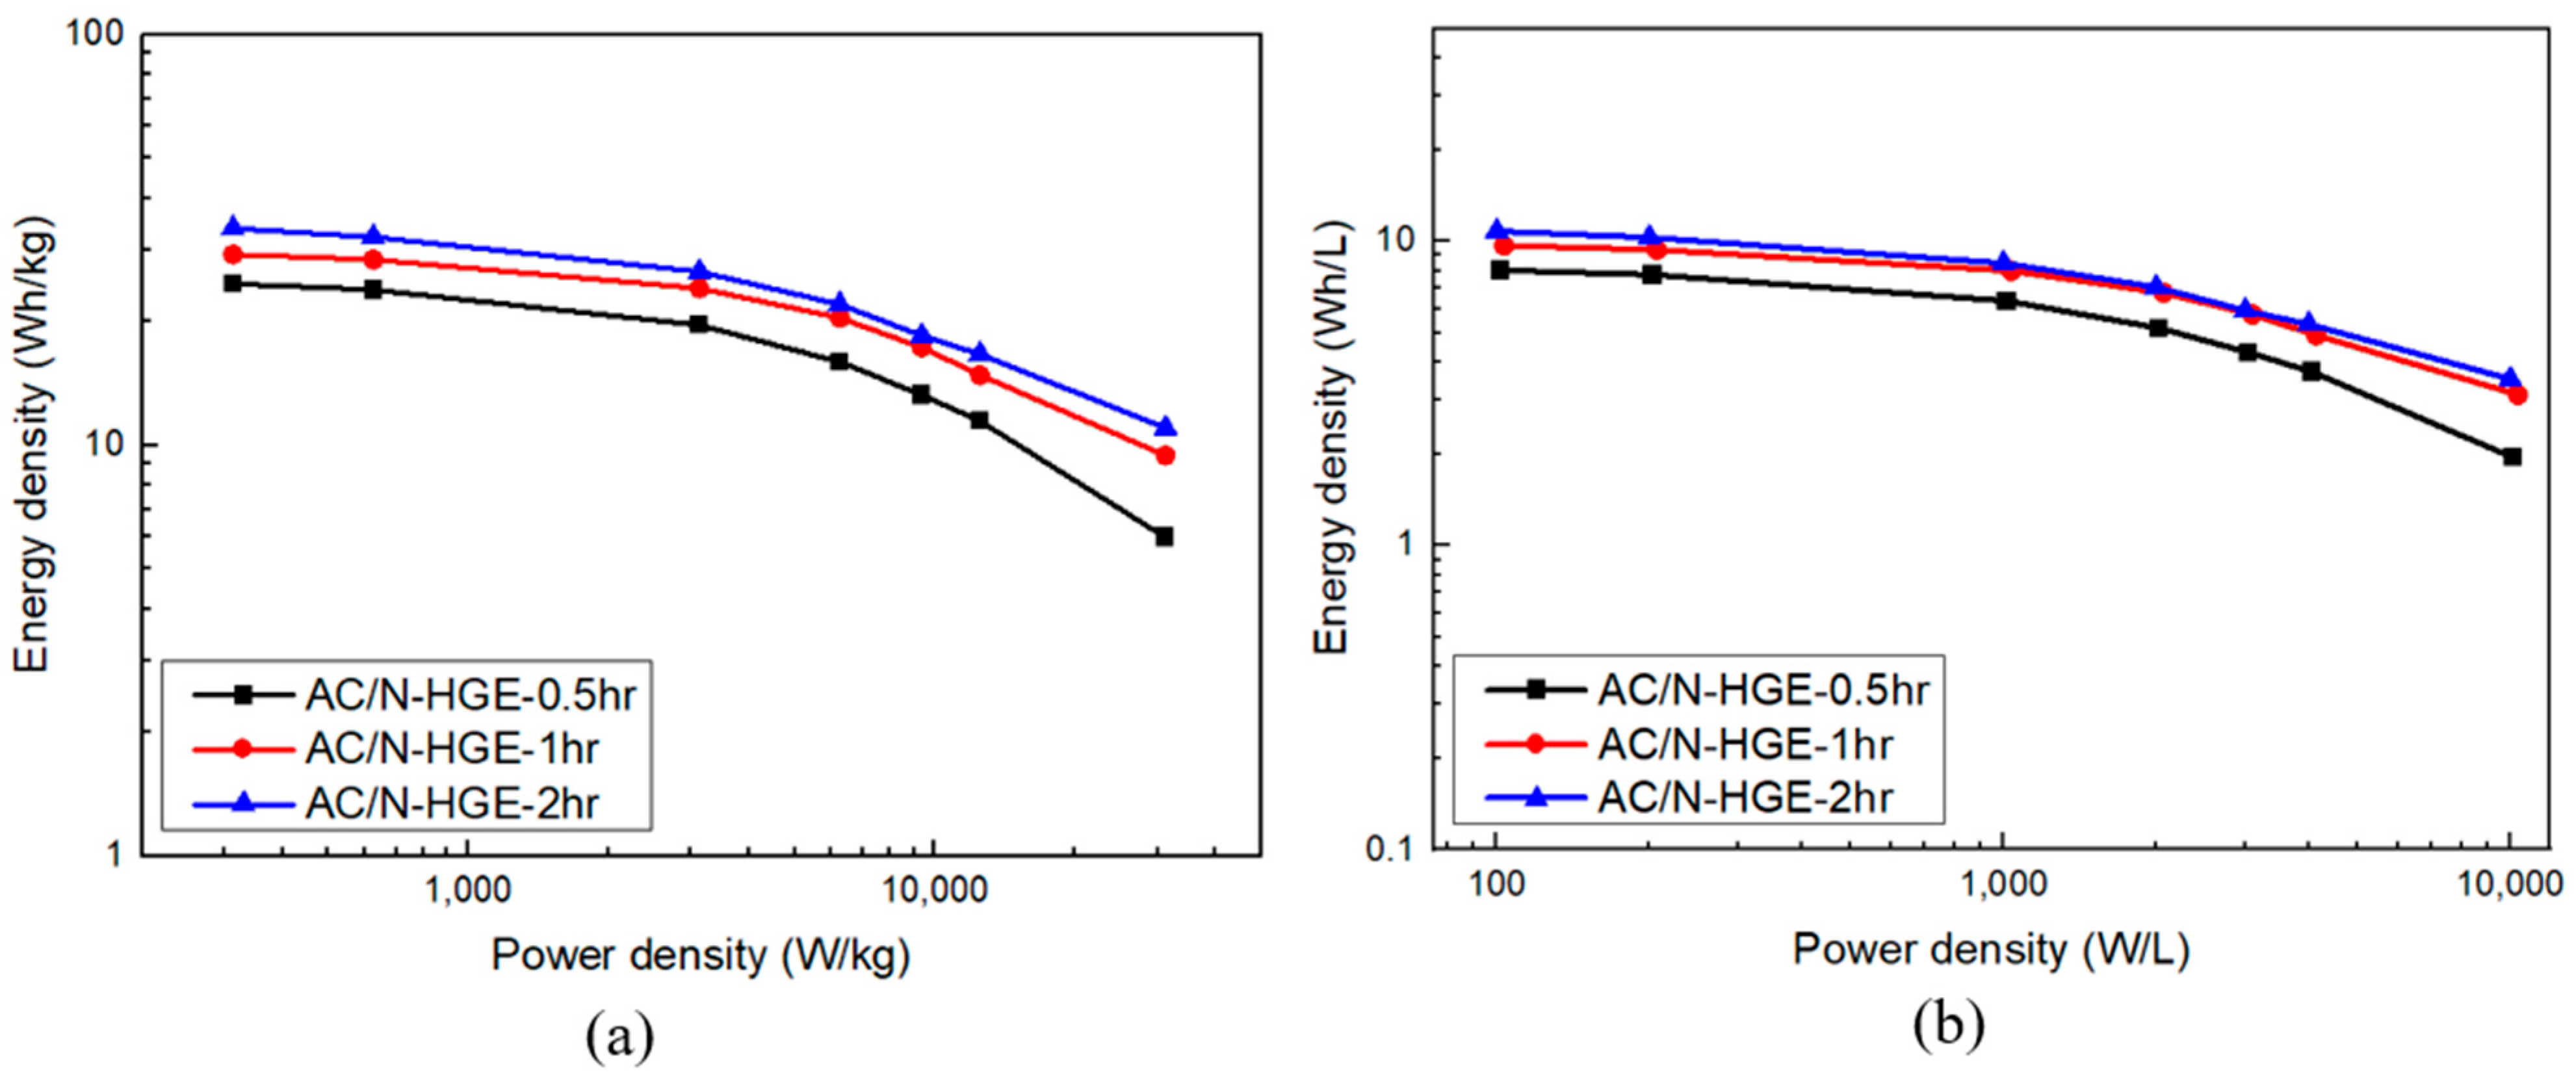
| Sample | Layer Thickness (µm) | Layer Weight (mg) | Film Density (g/cm3) | Current Density | |||
|---|---|---|---|---|---|---|---|
| 0.5 A/g | 20 A/g | 0.5 A/g | 20 A/g | ||||
| Volumetric Capacitance (F/cm3) | Gravimetric Capacitance (F/g) | ||||||
| AC/N-HGE-0.5hr | 24 | 1.2 | 0.324 | 36 | 16 | 114 | 52 |
| AC/N-HGE-1hr | 24 | 1.02 | 0.331 | 44 | 22 | 134 | 68 |
| AC/N-HGE-2hr | 24 | 1.38 | 0.329 | 49 | 24 | 155 | 76 |
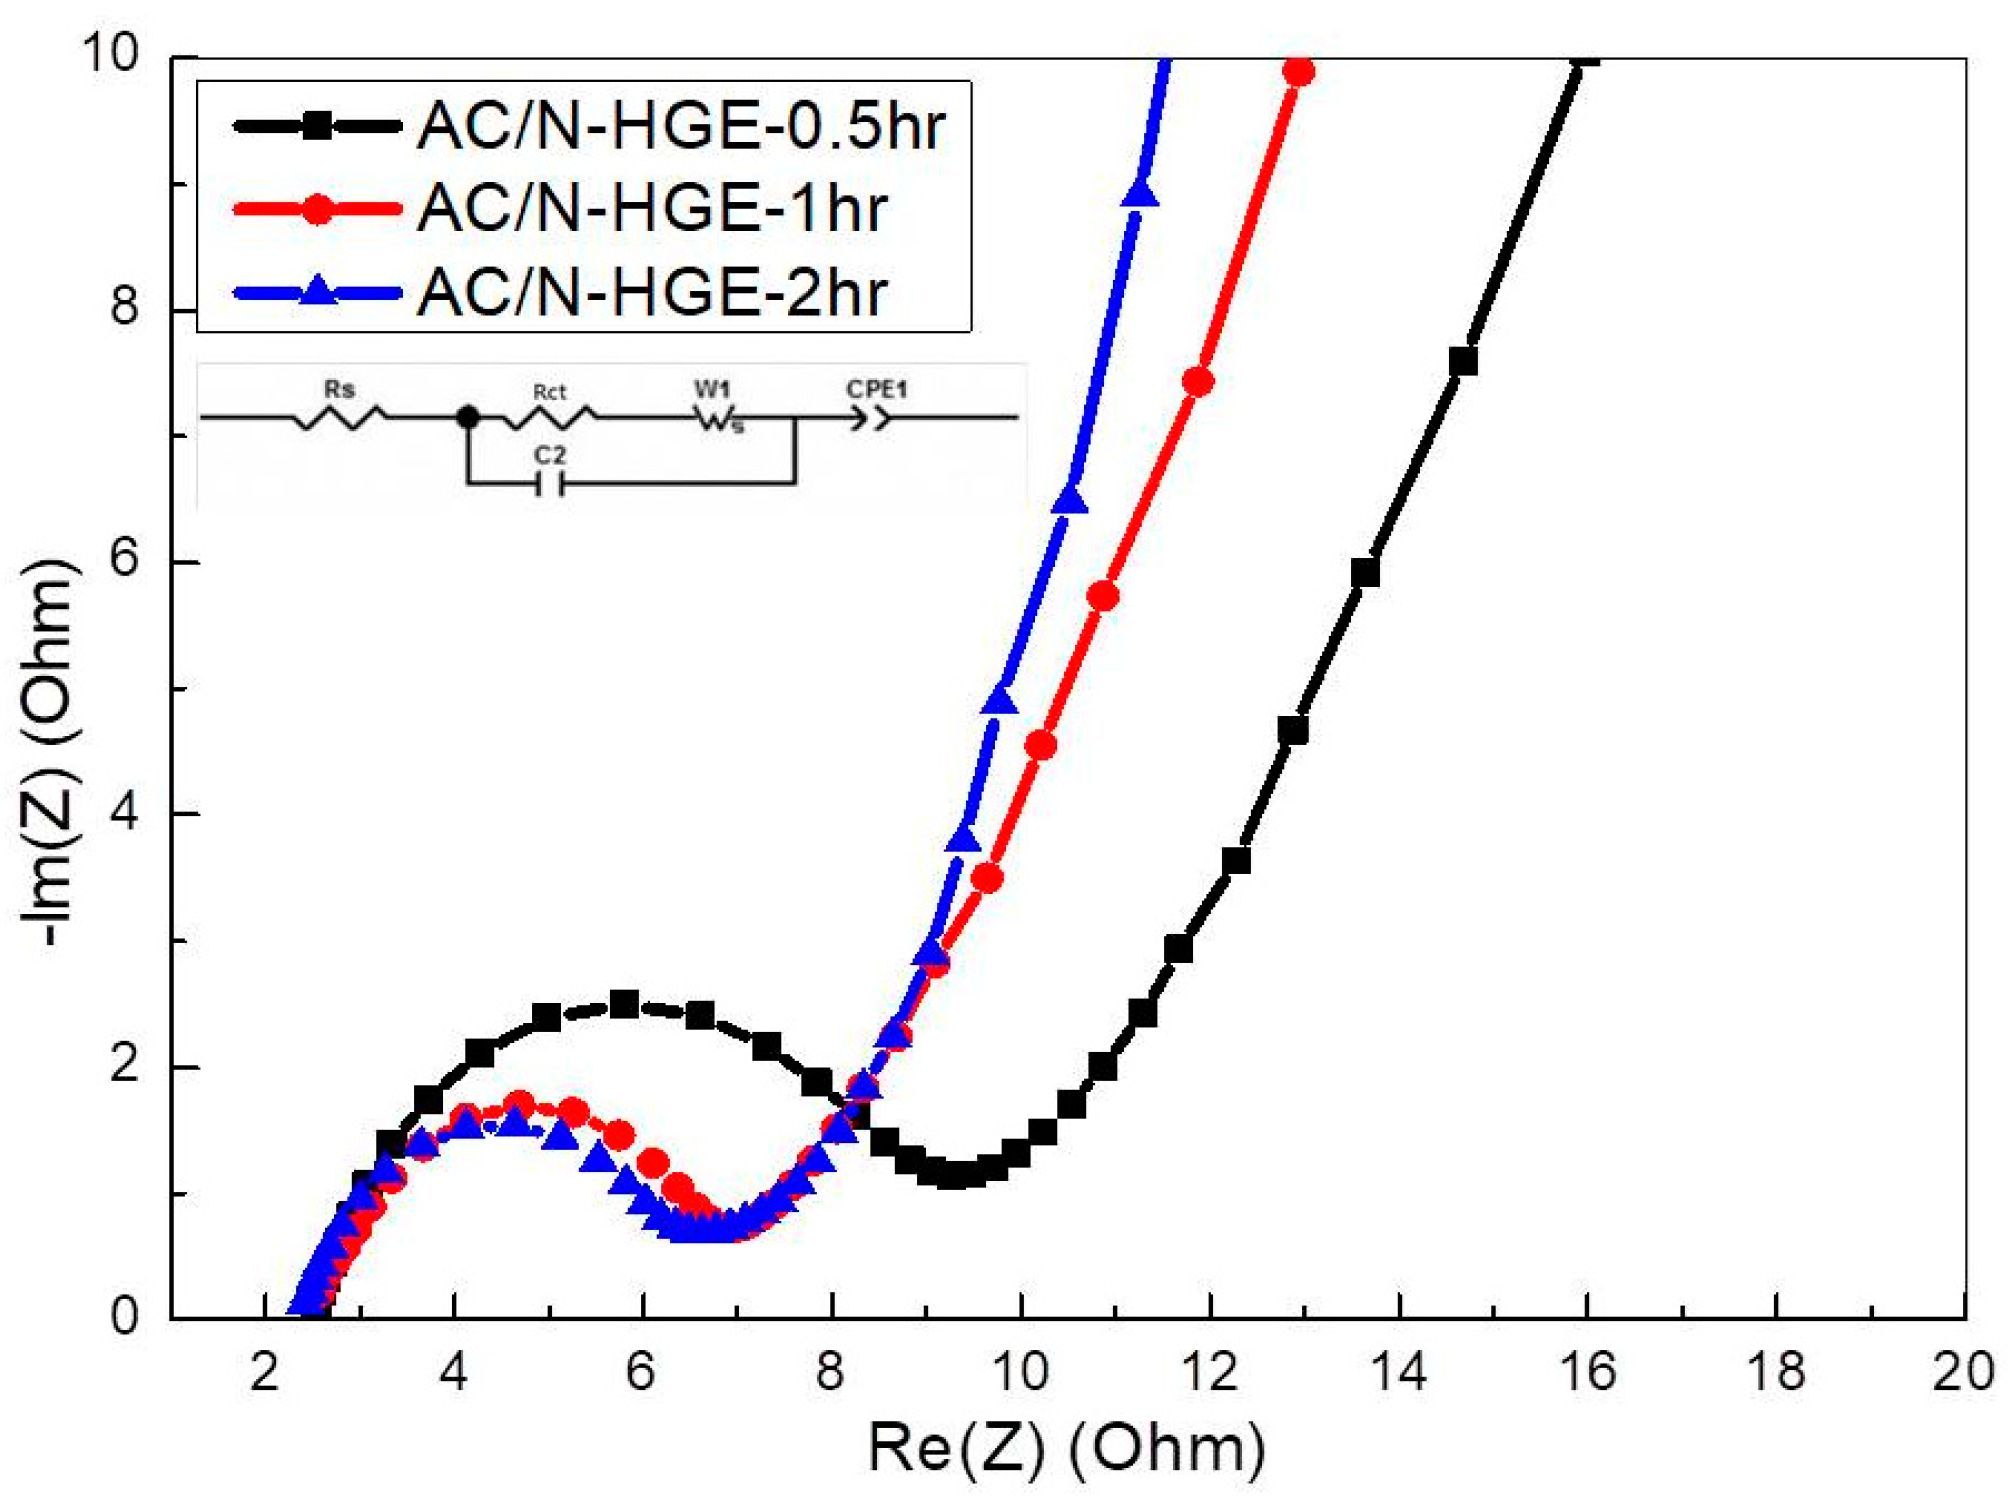
| Sample | Rs (Ω) | Rct (Ω) |
|---|---|---|
| AC/N-HGE-0.5hr | 2.53 | 6.72 |
| AC/N-HGE-1hr | 2.56 | 4.39 |
| AC/N-HGE-2hr | 2.42 | 4.19 |
Disclaimer/Publisher’s Note: The statements, opinions and data contained in all publications are solely those of the individual author(s) and contributor(s) and not of MDPI and/or the editor(s). MDPI and/or the editor(s) disclaim responsibility for any injury to people or property resulting from any ideas, methods, instructions or products referred to in the content. |
© 2023 by the authors. Licensee MDPI, Basel, Switzerland. This article is an open access article distributed under the terms and conditions of the Creative Commons Attribution (CC BY) license (https://creativecommons.org/licenses/by/4.0/).
Share and Cite
Huang, Y.-R.; Pu, N.-W.; Wu, G.-M.; Liu, Y.-M.; Lin, M.-H.; Kwong, Y.-L.; Li, S.-C.; Chang, J.-K.; Ger, M.-D. Study on the Application of Nitrogen-Doped Holey Graphene in Supercapacitors with Organic Electrolyte. Nanomaterials 2023, 13, 1640. https://doi.org/10.3390/nano13101640
Huang Y-R, Pu N-W, Wu G-M, Liu Y-M, Lin M-H, Kwong Y-L, Li S-C, Chang J-K, Ger M-D. Study on the Application of Nitrogen-Doped Holey Graphene in Supercapacitors with Organic Electrolyte. Nanomaterials. 2023; 13(10):1640. https://doi.org/10.3390/nano13101640
Chicago/Turabian StyleHuang, Yu-Ren, Nen-Wen Pu, Guan-Min Wu, Yih-Ming Liu, Ming-Hsien Lin, Yi-Le Kwong, Siou-Cheng Li, Jeng-Kuei Chang, and Ming-Der Ger. 2023. "Study on the Application of Nitrogen-Doped Holey Graphene in Supercapacitors with Organic Electrolyte" Nanomaterials 13, no. 10: 1640. https://doi.org/10.3390/nano13101640
APA StyleHuang, Y.-R., Pu, N.-W., Wu, G.-M., Liu, Y.-M., Lin, M.-H., Kwong, Y.-L., Li, S.-C., Chang, J.-K., & Ger, M.-D. (2023). Study on the Application of Nitrogen-Doped Holey Graphene in Supercapacitors with Organic Electrolyte. Nanomaterials, 13(10), 1640. https://doi.org/10.3390/nano13101640