Abstract
Background: The exceptional characteristics of cerium oxide (CeO2) and aluminum oxide (Al2O3) nanoscales have inspired significant attention to those nanocomposites as possible electroactive resources for applications of sensing and biosensing. Methods: In this research, an innovative new factionalized CeO2/Al2O3 nanocomposite membrane sensor was presented to assess tramadol hydrochloride (TRD) in marketable products. Results: Tramadol-phosphomolybdate (TRD-PM) was formed by mixing tramadol hydrochloride and phosphomolybdic acid (PMA) in the attendance of polymeric matrix and o-nitrophenyloctyl ether solvent mediator. With 1.0 × 10⁻¹⁰–1.0 × 10⁻² mol L−1 as a range of linearity and EmV = (57.567 ± 0.2) log [TRD] + 676.29 as a regression equation, the functionalized sensor using TRD-PM-CeO2/Al2O3 nanocomposite showed great selectivity and sensitivity for the discriminating and measurement of TRD. Using the regression equation EmV = (52.143 ± 0.4) log [TRD] + 431.45, the unmodified coated wire sensor of TRD-PM, on the other hand, showed a Nernstian response between 1.0 × 10⁻⁶ and 1.0 × 10⁻² mol L−1, Using the methodology’s specified guidelines, the proposed improved potentiometric system was validated against several criteria. Conclusion: The suggested method is suitable for the determination of TRD in its products.
1. Introduction
The evolution of modified sensing and biosensing probes has been aided by advances in nanoscience technologies and nanomaterial engineering, which have opened up new fields in scientific inquiry. The recent research has concentrated on the creation of nanocomposites rather than single nanoparticles. Because of their interfacial interactions, these nanocomposites frequently have various nanoscale domains, which produce synergistic effects [1]. Chemical resistance, high conductivity, biocompatibility, and flexibility are just a few of the advantages that nanocomposites have over traditional polymers [2]. Recent advancements in scientific domains such as Recent advancements in scientific domains, such as industry [3], biology [4], and material science [5] need the creation of innovative sensing knowledge that associates low power consumption, compactness, and high tangible sensitivity.
Nanocomposite is a high-activity nanostructure that offers a wide range of engineering and combining options. Their potential is so great that can be effectively utilized in a diversity of sensing and biosensing approaches [6], due to their expanding requirement and speedy inquiry to be in the fabrication of sensors; indeed, they have emerged as viable options for addressing the disadvantages of micro composites. Additionally, these materials have exceptional structures and optical properties which are not seen in traditional types [7]. Furthermore, nanocomposite production is regarded as a critical step in the formation of a huge number of electronics [8,9], systems of drug targeting [10,11], medicinal, and immunosensing probes [12].
Metal oxides, such as aluminum oxide (Al2O3), copper oxide (CuO), nickel oxide (NiO), and others, are currently the subject of various investigations. Furthermore, the use of cerium oxide (CeO2) in different fields such as antibacterial agents [13], catalysis [14], food packaging [15], sensors [16], agriculture [17], and medicine [18] has received greater attention. The development of aluminium oxide nanoparticles (Al2O3NPs) with a high specific surface area and outstanding optical, catalytic, and thermal stability properties for progressive engineering and industrial applications has recently gained attention [19,20,21,22]. Few studies suggested the use of CeO2/Al2O3 nanocomposite in sensing applications such as Naik et al. [23] described a successful synthesis of CeO2/Al2O3 nanocomposite using the solution combustion method. The gas sensing characteristics of synthesized CeO2/Al2O3 nanocomposite have been studied for NO2 under various temperature and concentrations conditions; moreover, Krishnan et al. [24] studied the cathodic potential of the Ni-P sensor for analysis of alkaline water by the catalytic activity of CeO2-Al2O3 nanocomposite. Another study was developed by Avramova et al. [25], which employed the chemical deposition of CeO2-Al2O3 nanocomposite on stainless steel electrodes. Different microscopic and spectroscopic procedures, including scanning electron microscope (SEM) and X-ray photoelectron spectroscopy (XPS), were employed to examine the thickness of the coating layer and the chemical constituents with respect to the loading ceria. In recent studies, sol-gel, microwave-assisted, electrochemical deposition methods have all been applied for the synthesis of CeO2NPs and Al2O3NPs [26,27,28,29,30,31].
The potentiometric systems are more dependable and cost-effective for various biomedical aspects [32,33,34,35]. These approaches are also fast with respect to the duration of analysis [36]. Several biosensing electrodes have been functionalized with metallic oxides to improve their sensitivity and detection limitations [37,38]. Potentiometric sensors usually comprise membranes developed from polyvinyl chloride (PVC) with high molecular weight, plasticizers such as dioctyl sebacate (DOS), dioctyl phthalate (DOP), dibutyl sebacate (DBS), dibutyl phthalate (DBP), and o-nitrophenyl octyl ether (o-NPOE) as a solvent mediator, and dibutyl These membranes can also be made of lipophilic ions or molecules, which operate as active materials to induce specific analyte interactions in the membrane locations, allowing for the pre-detection of the sensor selectivity [39].
Potentiometric wire-based sensors are often made of metal wire of a high conductivity such as copper, iron, silver, aluminum, and platinum. The selective membrane’s active spots are coated on a polymeric cocktail that is applied to the metal wire as a substrate. Phosphomolybdic acid (PMA) is a yellow-green powder that has the ability to dissolve in water and alcohol. When combined with an appropriate ion-pair complex, it can also catalyze the process of ion-exchange process via the hydrophobic membranes’ interfaces [40].
Tramadol hydrochloride is a pain relief compound that is utilized to treat pain in a moderate-to-severe sense (Figure 1).

Figure 1.
Chemical structure of tramadol hydrochloride.
Tramadol’s extended-release pills and capsules are only prescribed for those who are likely to require pain relief 24 h a day; it belongs to the opiate (narcotic) analgesics class of drugs [41].
Several analytical approaches, such as spectroscopic [42], chromatographic separation [43,44,45], and electrochemical methods [46,47], have previously been used to assess and quantify TRD. Although these previously published methods had good sensitivity and selectivity for TRD detection, the reminder had some drawbacks, such as requiring a long analytical time, a high level of operating skills, and the use of huge volumes of solvents.
The goal of this research was to develop a modified metal oxide (CeO2/Al2O3) nanocomposite coated wire sensor that could detect TRD in commercial items with high sensitivity and selectivity. To improve the sensitivity and selectivity of the potentiometric modified sensor, a new technique based on utilizing the exceptional physical, chemical, optical, and conductive features of the chosen metal oxides has been proposed. The integration of CeO2/Al2O3 in a polymeric matrix will have an impact on the suggested sensor’s sensitivity and selectivity for the selected drug. Method validation follows ICH criteria [48] to confirm the indicated method’s analytical appropriateness. In addition, a comparison was made between the CeO2/Al2O3 nanocomposite coated membrane sensor proposed and the normally built kind.
2. Materials and Methods
2.1. Chemicals and Reagents
Amyria Pharmaceuticals (Alexandria, Egypt) provided pure grade opioid pain medicine tramadol hydrochloride and Tramadol® capsules (50 mg/capsule). Sigma Aldrich, Hamburg, Germany, provided ortho-nitrophenyloctyl ether (o-NPOE), acetone 99.9%, methanol 99.9%, ethanol 99.9%, tetrahydrofuran (THF) 97.0%, hydrochloric acid 37%, and high molecular weight PVC, among other analytical chemicals and solvents. BDH yielded 99.0% cerium nitrate, 99.9% aluminum nitrate nonahydrate, phosphomolybdic acid (PMA), and 99.9% sodium hydroxide (Poole, UK).
2.2. Instruments
The designed potentiometric system included a manufactured standard tramadol hydrochloride-phosphomolybdate (TRD-PM) or functionalized TRD-PM-CeO2/Al2O3 nanocomposite coated wire sensor, as well as a reference silver/silver chloride (Ag/AgCl) sensor (JEOL Ltd., Tokyo, Japan). Furthermore, the presence of Ce, Al, and O elements in the synthesized nanomaterials was detected using Energy-Dispersive X-ray Spectroscopy (EDX) analysis combined with EDX-8100 (Shimadzu, Kyoto, Japan). Different spectroscopic and microscopic methods were applied to characterize the synthesized metal oxide nanoparticles and nanocomposite, including UV-2450 spectrophotometer (Shimadzu Corporation, Kyoto, Japan), the Fourier-Transform Infrared spectroscopy (FT-IR) Spectrum BX spectrometer (Shimadzu Corporation, Kyoto, Japan), and the UV-2450 spectrophotometer (Shimadzu Corporation, Kyoto, Japan (PerkinElmer, Waltham, Massachusetts, United States). Shimadzu XRD-6000 diffractometer (Shimadzu, Kyoto, Japan), JSM-7610F scanning, and transmission electron microscopes (SEM-JEOL and TEM-JEM-2100F Ltd., Tokyo, Japan) were used for microscopic investigations. Furthermore, Energy-Dispersive X-ray Spectroscopy (EDX) analysis utilizing the (EDX-8100, Shimadzu, Kyoto, Japan) was utilized for elemental analysis.
2.3. Preparation of TRD-PM Electroactive Material
The electroactive complex TRD-PM was made by combining similar volumes (50 mL) of aqueous TRD and PMA solution with an equimolar concentration (1.0 × 10⁻² mol L−1) of TRD. A greenish TRD-PM precipitate was formed. The precipitate was cleaned with Milli Q water and kept to dry overnight after being filtered with Whatman filter paper No. 41.
2.4. Synthesis of CeO2 and Al2O3 Nanoparticles
CeO2NPs were synthesized by the preparation of 50 mL of 0.5 mol L−1 of cerium nitrate hexahydrate in Milli Q water as a precursor solution. With constant stirring and at ambient temperature, 2.0 mol L−1 of NaOH was dripped slowly. The addition was performed within 30 min. The mixture was centrifuged at 2500 rpm for 10 min. The precipitate was collected using Whatman filter paper No. 1, then rinsed thoroughly with Milli Q water. The formed CeO2NPs were dried for 6 h at 100 °C. To evaporate the water, the formed nanoparticles were calcinated in a furnace oven at 600 °C for 4 h.
A sol-gel method was used to synthesize Al2O3NPs by mixing 50 mL of aluminum nitrate (2.0 mol L−1) with 20 mL of citric acid and the mixture was stirred at 250 rpm for 30 min. The prepared solution was heated under magnetic stirring at 60 °C for a further 30 min until the formation of while gel. The formed gel was heated to 80 °C under continuous stirring until a transparent gel was formed. The resulting nanoparticles were filtered after 10 min centrifugation at 2500 rpm. The collected Al2O3NPs were washed three times with Milli-Q water, oven-dried at 90 °C for 12 h, and thereafter sintered for 4 h at 600 °C.
2.5. Preparation of Polymeric TRD-PM-CeO2/Al2O3 Nanocomposite
The polymeric functionalized solution of CeO2/Al2O3 nanocomposite was formed by suspending approximately 5 mg of each pre-synthesized CeO2 and Al2O3 nanoparticles with 10 mg TRD-PM complex, 190 mg of polymeric materials (PVC), and 0.35 mL of o-nitrophenyloctyl ether in 7 mL of THF. Under constant magnetic stirring to produce a polymeric solution of TRD-PM-CeO2/Al2O3 nanocomposite. Then it was utilized to functionalize the surface of the designed modified TRD-PM-CeO2/Al2O3 nanocomposite sensor.
2.6. Preparation of Standard TRD Solution
A TRD standard solution (0.1 mol L−1) was made by adding 2.998 g of TRD authentic powder to deionized water (100 mL). The analytical testing samples were diluted in the range of 1.0 × 1.0−10–1.0 × 10⁻² mol L−1 using the same solvent.
2.7. Sensor Design and Membrane Composition
A Typical (TRD-PM) sensor was designed using mixing-electroactive substances (TRD-PM, 10 mg), (PVC, 190 mg), and o-NPOE, 0.35 mL plasticizer in 5 mL of THF. The resulting cocktail was placed into a rounded dish and allowed to gently evaporate at room temperature. Deionized water, followed by acetone, was used to polish and clean the aluminum wire’s tip. The wire’s tip had been cleaned. The cleaned tip of the wire was submerged in the polymeric membrane solution (TRD-PM) many times until a coated membrane formed on its surface. Additional clean Al wire was dipped three times in the polymeric solution of CeO2/Al2O nanocomposite to generate a thin layer membrane on its surface for the modified sensor. After allowing the sensor to dry, it was dipped multiple times in the aforementioned polymeric (TRD-PM) solution until it formed a homogenous covered membrane. The cell assembly: Al wire/coated membrane/test solution/Ag/AgCl reference electrode was used in both constructed sensors. The potentiometric system and the functionalized TRD-PM-CeO2/Al2O3 nanocomposite sensor were illustrated, as shown in Figure 2.
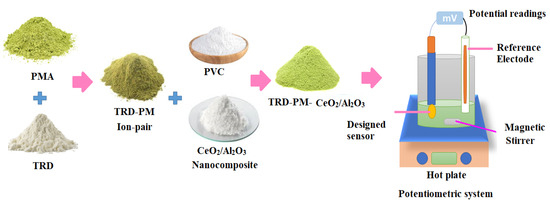
Figure 2.
Preparation of TRD-PM-CeO2/Al2O3 electroactive complex and the potentiometric system employed for TRD determination.
2.8. Calibration Graph
The potential readings (mV) of (TRD-PM) and (TRD-PM-CeO2/Al2O3) nanocomposite sensors were measured and graphed versus -logarithm TRD concentrations (mol L−1). The linearity was estimated separately using TRD standard solutions (50 mL) in the concentration range 1.0 × 10⁻¹⁰–1.0 × 10⁻² mol L−1 and the constructed functional TRD-PM or TRD-PM-CeO2/Al2O3 sensors were used and the applied reference one was (Ag/AgCl) electrode. The membrane surface should be cleaned using Milli-Q water and dried with soft paper before each measurement.
2.9. Optimization of Analytical Conditions
The pH of the examined solutions can have a substantial impact on the potential response of the coated wire sensors that have been designed. The suitable pH range using TRD (1.0 × 10⁻⁵ mol L−1) solution was measured using TRD-PM and modified TRD-PM-CeO2/Al2O3 nanocomposite sensors were measured. The acidity and alkalinity of the test sample were adjusted using 0.1 mol L−1 of hydrochloric acid and sodium hydroxide. The pH graphs were created by plotting the change in potential vs. pH.
Selectivity of the studied TRD sensors was monitored by exploiting a separate solution approach [49]. The selectivity coefficient of each sensor for TRD and various foreign substances and additives such cations (Na+, K+, Ag+, Mg2+, Ca2+, Zn2+, and Fe3+), sugars (lactose, Fructose, and starch), amino acids (histidine, glycine, lysine, and tryptophan) have been tested. The selectivity of the suggested sensors was measured using 1.0 × 10⁻³ mol L−1 solution of TRD and interferent species, separately. The tolerable value (KpotTRD+) was estimated from the previously reported equation [49].
The response time was determined by recording the dynamic sensors response of the investigated TRD solution, using a TRD working concentration range.
2.10. Quantification of Tramadol Hydrochloride® Capsules
The content of 10 tramadol hydrochloride® capsules (50 mg/capsules) was mixed well and weighed. A precise amount (0.2998 g in 50 mL Milli-Q water) was centrifuged (5 min at 1500 rpm), and the co-formulated components were removed by filtering. Deionized water was used to complete the clear solution to be 100 mL. The same solvent was used to dilute the resulting TRD solution (1.0 × 10⁻² mol L−1) to prepare the working samples in the range of 1.0 × 10⁻⁵–1.0 × 10⁻² and 1.0 × 10⁻¹⁰–1.0 × 10⁻² mol L−1. The investigated drug was quantified in commercial capsules using the developed TRD-PM and functionalized TRD-PM-CeO2/Al2O3 nanocomposite sensors independently.
3. Results and Discussion
3.1. Characterization of CeO2/Al2O3 Nanocomposite
Various spectroscopic investigations such as XRD, UV-Vis, FT-IR, and EDX were performed to characterize and confirm the formation of the synthesized CeO2/Al2O3 nanocomposite. The UV-Vis analysis is one of the top appropriate and helpful ways for principal validation of the form, size, and stability of designed nanoparticles in their aqueous suspensions. The optical absorbance spectra of CeO2, Al2O3, and CeO2/Al2O3 nanocomposite were measured at 200–600 nm and exhibited three large absorption peaks at 320, 240, and 402 nm for CeO2NPs, Al2O3NPs, and CeO2/Al2O3 nanocomposite, respectively (Figure 3).
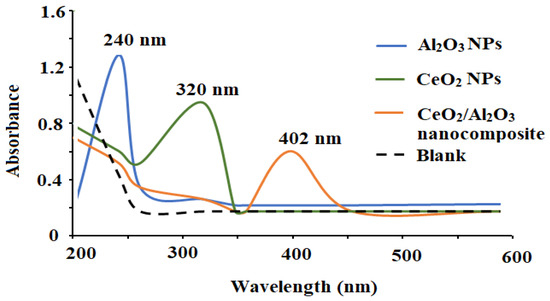
Figure 3.
The optical spectra of the synthesized CeO2NPs, Al2O3NPs, and CeO2/Al2O3 nanocomposite measured at wavelength 200–600 nm.
The produced bandgaps of the metal oxide nanoparticles were determined obeying the formula:
where h, c, and λ are Planck’s constant, light velocity, and absorption wavelength, respectively. On applying the Tauc plot function, the estimated optical bandgaps energy of CeO2NPs, Al2O3NPs, and CeO2/Al2O3 nanocomposite were found to be 3.36, 3.68, and 2.70 eV, respectively [50,51] (Figure 4a–c). Because of redshift, the bandgap energy difference between CeO2NPs and CeO2/Al2O3 nanocomposite was 0.66 eV, while the gap energy difference between Al2O3NPs and CeO2/Al2O3 nanocomposite was 0.97 eV. The decrease in bandgap energy in CeO2/Al2O3 nanocomposite improves the electron active sites to the entire movement on the Al2O3 surface, and their interaction might speed up the oxidation process. The surface plasmon resonance improves radiation penetration, creates scattering probability, and supplies the surface with a reduction form. These activities entail the formation of holes and the separation of electrons on the surface, which improves the oxidation process. Furthermore, changes in the dielectric matrix have been shown to influence the position of the SPR’s absorbance peak. The effective dielectric function of the matrix is known to have a direct relationship with the refractive index. A rise in the refractive index is promoted by the crystallization of CeO2NPs (n = 2.20) to (n = 3.54), and AL2O3NPs (n = 1.33) to (n = 1.76). This adjustment causes a red shift in the absorbance peak due to an increase in the dielectric function values [52].
Eg = hυ = hc/λ
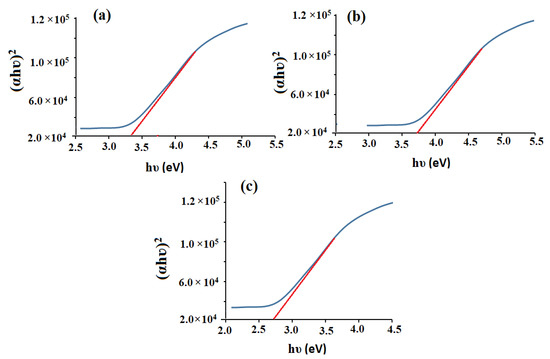
Figure 4.
Bandgaps of the pre-synthesized (a) CeO2NPs, (b) Al2O3NPs, and (c) CeO2/Al2O3NPs.
The pre-synthesized CeO2NPs, Al2O3NPs, and CeO2/Al2O3 nanocomposite FT-IR spectra were measured in the 400–4000 cm−1 region. CeO2NPs’ FT-IR spectrum (Figure 5a) revealed absorption bands at 3400 cm−1 (O-H stretching vibration), 1626 cm−1 (O-H bending vibration of absorbed water), and 488 cm−1 (Ce-O-Ce) stretching vibration and 555 cm−1 (formation of Ce-O stretching bond). The obtaining results are consistent with prior findings [53]. The FT-IR spectrum of the Al2O3NPs is described in Figure 5b.
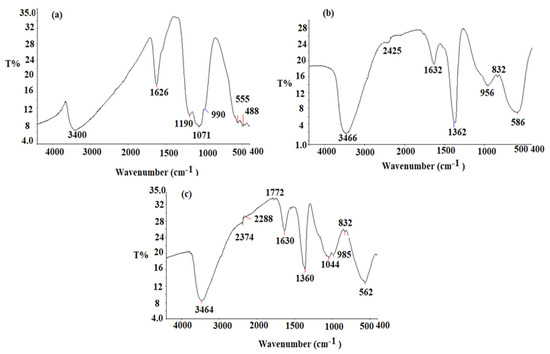
Figure 5.
FT-IR spectrum of pre-synthesized (a) CeO2NPs, (b) Al2O3NPs, (c) CeO2/Al2O3 nanocomposite measured at wavenumber 400–4000 cm−1.
The broad absorption bands, appeared at 3466 cm−1 and 1632 cm−1, resulted from stretching and bending O-H vibration of absorbed water, respectively. The stretching vibration of Al-OH bond appeared to correspond another band observed at 1362 cm−1. The peaks at 832 cm−1 and 586 cm−1 correspond to the Al-O bond [54]. The CeO2/Al2O3 nanocomposite spectrum displayed various absorption bands at 3464 cm−1 (O-H), 2374 cm−1 (O=C=O of the carbon dioxide), and 1630 cm−1 (O-H vibration mode of water). The formation of CeO2/Al2O3 nanocomposite was confirmed by the appearance of stretching vibration peaks at 562 and 832 cm−1 (Figure 5c). The shift of the peaks in the nanocomposite spectrum to 562 and 832 cm−1 indicating the incorporation of CeO2 nanoparticles on the surface of Al2O3 nanoparticles.
The XRD patterns of CeO2NPs, Al2O3NPs, and CeO2/Al2O3 nanocomposite were scanned from 10–80 degrees with a 2θ min-1 scan rate. The XRD pattern of CeO2NPs showed different intensity peaks corresponding to crystal planes at 28.41° (1 1 1), 33.62° (2 0 0), 48.38° (2 2 0), 57.74° (3 1 1), 59.03° (2 2 2), 69.37° (4 0 0), 76.69° (3 3 1), and 79.09° (4 2 0) crystal planes (Figure 6a) and these results are matched those previously reported as in JCPDS Card No.-34-0394 [54]. The XRD pattern of CeO2NPs revealed the formation of pure crystalline cubic fluorite in shape. The XRD pattern of Al2O3 nanoparticles showed cubic and symmetric crystals with face-centered lattice (Figure 6b). The obtained 2θ values were found at 32.5° (2 2 0), 35.1° (3 1 1), 38.7° (2 2 2), 46.5° (4 0 0), 62.4° (4 2 2), 67.2° (4 4 0), 78.4° (6 2 0). These values were in agreement with JCPDS Card No. 79-1558 [55]. However, the XRD pattern of CeO2/Al2O3 nanocomposite showed distinctive peaks for CeO2NPs at 33.62° (2 0 0), 48.38° (2 2 0), and 69.37° (4 0 0) indicating the formation of CeO2/Al2O3 nanocomposite (Figure 6c). Moreover, the Scherer equation was used to calculate the average size of CeO2NPs, Al2O3NPs, and CeO2/Al2O3 nanocomposite by obeying:
where D, λ, β, and θ represent crystallite size, wavelength, the half-width of the diffraction peak, and the diffraction angle of the highest peak, respectively [56]. The average crystallite size obtained for CeO2NPs, Al2O3NPs, and CeO2/Al2O3 nanocomposite was found to be 17.35 nm, 18.80 nm, and 21.66 nm, respectively.
D = 0.9λ/βCosθ
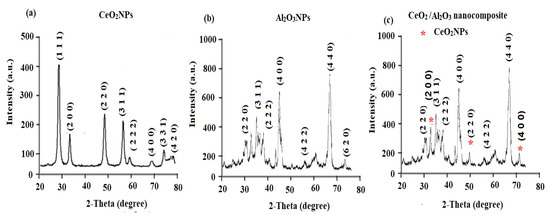
Figure 6.
XRD patterns of (a) CeO2NPs, (b) Al2O3NPs, and (c) CeO2/Al2O3 nanocomposite measured in the range of 2θ degree between 20–80°.
The dislocation density (δ) is identified as the length of dislocation lines per unit volume of the crystal, which reflects number of defects in the sample and is estimated using the following equation [57].
where the crystallite size is donated by D. The dislocation density of CeO2NPs and Al2O3NPs at room temperature was found to be 6.94 × 10⁻³ and 1.31 × 10⁻³ (nm)−2, respectively. The equation [58] was used to calculate the length of Ce-O and Al-O bond.
δ = 1/D2
The values in the above equation expressed as ‘’u’’ the potion in the wurtzite shape and can be determined by measuring the displacement of the atom with respect to the next atom along the axis ‘’c’’.
Where u is the positional parameter in the wurtzite structure and is a measure of the amount by which each atom is displaced according to the next along the ‘c’ axis. ‘u’ is given by the equation:
The Ce-O and Al-O bond lengths were calculated to be 1.869Å and 1.987Å, respectively. The estimated values matched the unit cell of Ce-O and Al-O bond lengths [59,60].
The dynamic light scattering (DLS) method was applied to measure the mean size-average diameter (d.nm) and the size distribution by the intensity of the synthesized CeO2NPs and Al2O3NPs. The particle size distribution of CeO2NPs and Al2O3NPs was measured using a particle size analyzer Zetasizer Ultra (Malvern Panalytical Ltd., Malvern, UK). As demonstrated in Figure 7a,b, the particle size distribution of CeO2NPs and Al2O3NPs was about 93.6 ± 2.4 and 104.5 ± 0.6 nm, respectively.
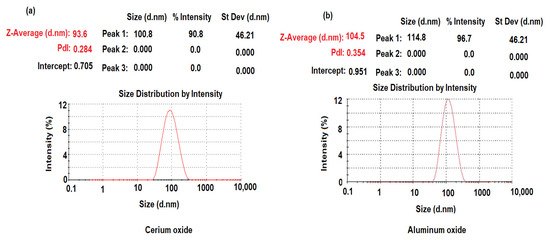
Figure 7.
Dynamic light scattering of pre-synthesized (a) CeO2NPs and (b) Al2O3NPs.
The size distribution profiles of CeO2NPs and Al2O3NPs exhibited one remarkable peak for each with intensities 90.8%, 96.7%, respectively, with a polydispersity index (PdI) 0.284 and 0.354 for CeO2NPs and Al2O3NPs, respectively, suggesting that the synthesized nano metal oxides had a little agglomeration [61]. The zeta potential of pre-synthesized CeO2NPs and Al2O3NPs with negative values of about −25.5 and −17.6 mV indicated a strong negative charge (Figure 8a,b). The negative surface zeta potential of CeO2NPs and Al2O3NPs suggests their reduction in metal oxide nanoparticles.
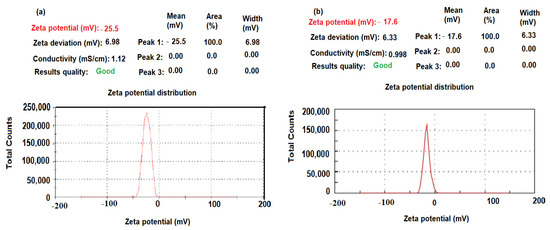
Figure 8.
Zeta potential of pre-synthesized (a) CeO2NPs and (b) Al2O3NPs.
The surface morphology, and elemental presence in the pre-synthesized CeO2NPs, Al2O3NPs, and CeO2/Al2O3 nanocomposite was visualized by SEM coupled with EDX (Figure 9a–c). The images of SEM showed that most of the synthesized CeO2NPs were cubic fluorite in shape (Figure 9a), whereas, the SEM images of the pre-synthesized Al2O3NPs revealed quasi-spherical shape in (Figure 9b); however, in the synthesized CeO2/Al2O3 nanocomposite, the surface of Al2O3 was clustered by CeO2NPs, the shape was changed to the lattice arrangement of the nanocomposite (Figure 9c). Thus, CeO2/Al2O3 nanocomposite was rounded in shape with an average of size 100 nm. The elemental composition of CeO2NPs, Al2O3NPs, and CeO2/Al2O3 nanocomposite measured by EDX showed the presence of Ce with a weight percentage 80.42% and atomic percentage 33.35% and O with 19.58% and 66.65%, respectively.
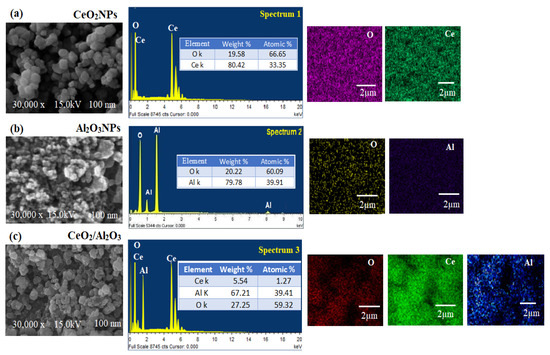
Figure 9.
SEM, EDX and elemental mapping of (a) CeO2NPs, (b) Al2O3NPs, and (c) CeO2/Al2O3 nanocomposite.
The EDX spectrum of Al2O3NPs confirmed the presence of weight % (79.78% and 20.22%) and atomic % (39.91% and 60.09%) for Al and O, respectively; however, CeO2/Al2O3 nanocomposite spectrum showed the presence of Ce, Al, and O elements with weights of 5.54%, 67.21%, and 27.25%, atomic percentage of 1.27%, 39.41%, and 59.32%, respectively. The atomic arrangement of pre-synthesized CeO2NPs, Al2O3NPs, and CeO2/Al2O3 nanocomposite was evaluated by EDX mapping analysis. Figure 9a also showed the mapping of CeO2NPs, where Ce ions are spread over the O, while the mapping images of Al2O3NPs showed mutual spreading of Al and O (Figure 9b); however, CeO2/Al2O3 nanocomposite mapping spectrum exhibited the content of Al was higher than Ce and O (Figure 9c). Furthermore, the decoration of Ce with Al and O atoms was noticed in the mapping analysis of CeO2/Al2O3 nanocomposite.
3.2. Performance Response of the Suggested Sensors
TRD interacts with PMA to form the TRD-PM complex, which is extremely stable and soluble in THF. THF was used to combine the membrane cocktail to create the conventional TRD-PM and functionalized coated wire TRD-PM-CeO2/Al2O3NPs nanocomposite sensors. The application of (o-NPOE, = 24) with a high dielectric constant increases membrane complex uniform solubility and computability with the polymeric phase of the membrane; it also improves the sensor’s selectivity coefficient by providing a mechanical property for the covered membrane [62]. The potential responses of TRD-PM and TRD-PM-CeO2/Al2O3NPs nanocomposite were described in Table 1. The achieved data indicated that the developed sensors demonstrated Nernstian behavior with slopes of EmV = (52.143 ± 0.5) log [TRD] + 431.45 and EmV = (57.567 ± 0.2) log [TRD] + 676.29 for the above-mentioned sensors, respectively, with linearity ranges of 1.0 × 10⁻⁶–1.0 × 10⁻² mol L−1 (r2 = 0.9996) and 1.0 × 10⁻¹⁰–1.0 × 10⁻² mol L−1 (r2 = 0.9997 (Figure 10a,b). The addition of CeO2/Al2O3 nanocomposite to the traditional TRD-MP sensor improved to design new functionalized system (TRD-MP-CeO2/Al2O3 nanocomposite) developed sensor’s potential response to a larger linear detection range with increased sensitivity concerning the TRD solution detection. Those data could result from the huge surface area of the additional nanoparticles that enhanced the conductivity of surface of the planned functionalized sensor. Furthermore, the high dielectric permittivity values of CeO2NPs (~23) and Al2O3NPs (~7.8–11.1) at ambient temperature may account for the better detection results achieved with the functionalized sensor [63,64].

Table 1.
Performance response characteristics of designed conventional (TRD-PM) and functionalized TRD-PM-CeO2/Al2O3 nanocomposite sensors.
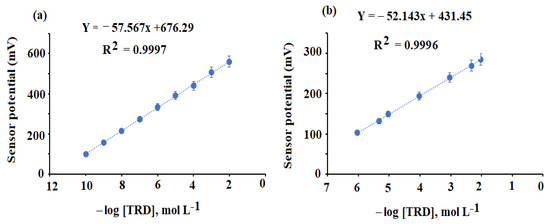
Figure 10.
Calibration graphs of the constructed TRD-PM (a) and functionalized TRD-PM- CeO2/Al2O3 nanocomposite (b).
The dynamic responsiveness of the created TRD-PM conventional and functionalized TRD-PM-CeO2/Al2O3NPs nanocomposite sensors was examined under ideal experimental environments to identify differences between the time of instant potential and the value of its steady-state (1 mV). The above-mentioned conventional and functionalized sensors had dynamic responses of 60 and 35 s, respectively. The sensor enhanced with metal oxide nanocomposite has a faster response time and more mechanical stability than the standard sensor. The electrical conductivity of the modified sensor towards detection of TRD in the sample is improved by the functionalization of the membrane with metal oxides nanocomposite (high surface area: volume ratio) and their new advanced features. Furthermore, when nanoparticles are utilized as conductive materials in sensing systems, the nanocomposite’s remarkable electrical and capacity features, including significant charge transfer at nanomaterial interfaces, are critical [65].
The hydrogen ion concentration has a significant impact on the membrane sensor’s potential response. Thus, determining the appropriate pH range where hydrogen ions have no effect on the coated membrane sensor’s potential response is critical. The results revealed that the response of TRD-PM and TRD-PM-CeO2/Al2O3NPs nanocomposite sensors are unaffected in the pH range 2–7, and that can be easily predicted using the developed sensors in this pH range (Figure 11). The protonated ion-pair complex was formed at high [H+] in an acidic medium (pH 2), and the sensor potential readings were marginally augmented as a result of low responsiveness to TRD ions; meanwhile, in alkaline medium (pH > 7) where [OH−] is high, the potential readings were progressively reduced due to the competition between TRD ions and OH- ions. Consequently, this decreases interactions between the investigated drug ions and sites of ion-pair on the sensor membrane [66].

Figure 11.
Effect of hydrogen ion concentration (pH) on the potential readings of the conventional and functionalized metal oxide nanocomposite sensors using 1.0 × 10⁻⁴ mol L−1 TRD solution.
A separate solution approach [67] was employed to assess the effect of interference of several foreign constituents on the coefficient of selectivity of the developed TRD sensors. The functionalized TRD-PM-CeO2/Al2O3 nanocomposite sensor exhibited high selectivity towards the detection of TRD. The extraordinary physicochemical properties of the produced CeO2/Al2O3NPs, as well as their large interfacial area, improve the conductivity of the modified sensor and therefore its selectivity for TRD ions. Furthermore, the free energy transfer of ions (TRD+) created between the active sites in the membrane and the working solution is referred to by the TRD coated membrane selectivity. The evaluated cations, sugars, and amino acids caused no interference. As a result, using the modified TRD sensor for TRD determination provided high selectivity and tolerance (Table 2).
Table 2.
Outcomes of tolerable values (KpotTRD+) of some interferents determined by the suggested TRD-PM and functionalized TRD-PM-CeO2/Al2O3 nanocomposite coated wire sensors using separate solution approach.
3.3. Quantification of TRD in Bulk Form
The TRD drug was determined in its authentic samples using the designed conventional TRD-PM and TRD-PM-CeO2/Al2O3 sensors, and the findings were expressed as 98.80 ± 0.9% and 99.81 ± 0.2%, respectively (Table 3). The use of functionalized TRD-PM-CeO2/Al2O3 sensor containing CeO2NPs (~23) and Al2O3NPs (~7.8–11.1) improved the dynamic detection of the TRD solution.
Table 3.
The obtained results of the determination of TRD in its authentic samples using conventional and functionalized TRD-PM and TRD-PM-CeO2/Al2O3 nanocomposite coated wire sensors.
3.4. Validation of the Suggested Method
The guideline of the International Council for Harmonization of Technical Requirements for Pharmaceuticals (ICH) [48] was obeyed to prove the validity and suitability of the designed potentiometric systems for the determination of TRD. The suggested TRD-PM and TRD-PM-CeO2/Al2O3 nanocomposite exserted linear relationships with least square regression equations EmV = (52.143 ± 0.2) log [TRD] + 431.45 (r2 = 0.9997) and EmV = (57.25 ± 0.4) log [TRD] + 676.29 (r2 = 0.9998) over the TRD concentration ranges 1.0 × 10⁻⁶–1.0 × 10⁻² and 1.0 × 10⁻¹⁰–1.0 × 10⁻² mol L−1. Also, the suggested TRD-PM and TRD-PM-CeO2/Al2O3 nanocomposite sensors displayed detection limits of 5.0 × 10⁻⁷ and 5.0 × 10⁻¹¹ mol L−1, respectively.
To study the accuracy of designed sensors, 9 authentic TRD concentrations in the range of 1.0 × 10⁻⁶–1.0 × 10⁻² and 1.0 × 10⁻¹⁰–1.0 × 10⁻² mol L−1 were used. The accuracy of the suggested potentiometric approach was expressed as mean percentage recoveries of 98.56 ± 0.8% and 99.85 ± 0.2% for TRD-PM and TRD-PM-CeO2/Al2O3 nanocomposite, respectively (Table 4). Intermediate precision experiments were also used to investigate the precision of the suggested functionalized potentiometric TRD-PM-CeO2/Al2O3 nanocomposite system. For the two, the recorded data were found as a percentage relative standard deviation (% RSD) of 0.2% and 0.4%, for intra-day and inter-day assays, respectively (Table 5).
Table 4.
Accuracy results of the analysis of TRD samples using conventional and functionalized TRD-PM and TRD-PM-CeO2/Al2O3 nanocomposite coated wire sensors.
Table 5.
Precision (inter-day and intra-day assays) results for the determination of TRD samples by using conventional and functionalized TRD-PM and TRD-PM-CeO2/Al2O3 nanocomposite coated wire sensors.
The potentiometric system’s robustness was tested by altering the pH of working solutions to 7 ± 0.5, which was a minor change in the procedure parameter. The obtained percentage recoveries for the standard and functionalized TRD coated wire sensors were 98.35 ± 0.5% and 99.66 ± 0.3%, respectively (Table 1). To prove the ruggedness of the proposed technique, TRD samples were analyzed using a different pH-meter (Metrohm model-744) in another laboratory and by a different analyst. For the above designed TRD-PM and TRD-PM-CeO2/Al2O3 nanocomposite sensors, the mean percentage recoveries were found to be 98.83 ± 0.7 and 99.72 ± 0.4 percent, respectively (Table 1). The results of technique validation were in suitable accordance with those obtained using the suggested system, with no notable variations.
3.5. Estimation of TRD in Tramadol hydrochloride® Capsules
The examined TRD was determined utilizing the designed TRD-PM and TRD-PM-CeO2/Al2O3 nanocomposite in its marketed capsules tramadol hydrochloride® (50 mg/ capsule). The % recoveries of TRD were obtained by the regression equations using the potential readings of the working solutions 1.0 × 10⁻⁶–1.0 × 10⁻² and 1.0 × 10⁻¹⁰–1.0 × 10⁻² mol L−1. For the above-mentioned sensors, the recorded results were 98.77 ± 0.8% and 99.63 ± 0.5%, respectively. The obtained findings were compared to the approach provided by Shawish et al. [68] using the Student’s t-test and F-test [69] and revealed that the developed sensor had outstanding sensitivity and selectivity for the determination of TRD (Table 6).
Table 6.
The obtained results of the determination of TRD in its commercial capsules (50 mg/capsule) using conventional and functionalized TRD-PM and TRD-PM-CeO2/Al2O3 nanocomposite coated wire sensors.
The dielectric constant is an important criterion for determining a material’s ability to hold charges [70]. Electronics and sensors frequently use metal oxides with a high dielectric constant. They allow for the exertion of an electrostatic field and hence the storage of charges because they do not allow for the flow of charges through them [71]. The electrical, optical, and conductive capabilities of the functionalized sensor might all be improved by combining metal oxide nanoparticles with a polymeric medium in nanocomposites. Changes in the shape and size of the particles have a big impact on these qualities. As previously addressed, nanoparticles can act as a conductive connection between the polymeric chains, resulting in an increase in the composites’ electrical conductance [72,73]. The efficiency of the designed functionalized TRD-PM-CeO2/Al2O3 nanocomposite sensor was compared to that of previously constructed sensors [69,73,74] (Table 7). The modified sensor had a higher sensitivity than the published sensors for detecting TRD, with a detection range of 1.0 × 10⁻¹⁰–1.0 × 10⁻² and a LOD of 5.0 × 10⁻¹¹ mol L−1. The most significant component in developing ultrasensitive sensors with required features is the choice of nanostructured materials and sensor design method. The surface-to-volume ratio, which is a critical component in enhancing contact reactions on the overall electrical conductivity of nanomaterials, is determined by the shape and size of the nanoparticles utilized. Thus, due to the great chemical stability of these nanomaterials, the nanoscale morphology will affect not only the sensitivity of the sensor but also the dynamic responsiveness and long-term stability of the sensor. The molecular structure and polymeric media, such as crystallinity and long-chain polymer, may influence the electrical conductivity of metal oxide nanocomposite-fabricated sensors [75].
Table 7.
Comparative results between the suggested conventional and functionalized TRD-PM and TRD-PM-CeO2/Al2O3 nanocomposite coated wire sensors.
4. Conclusions
The current study describes a simple and ultrasensitive functionalized TRD-PM-CeO2/Al2O3 nanocomposite potentiometric sensor for determining TRD in authentic powder and commercial formulations that was successfully built. The modified sensor had a large surface area-to-volume ratio, which gave it excellent sensitivity in the detection of TRD with linear relationships in the concentration ranges 1.0 × 10⁻⁶–1.0 × 10⁻² and 1.0 × 10⁻¹⁰–1.0 × 10⁻² mol L−1, and low detection limits of 5.0 × 10⁻⁶ and 5.0 × 10⁻¹¹ mol L−1 for the conventional and functionalized sensors, respectively, with least square regression equations EmV = (52.143 ± 0.4) log [TRD] + 431.45 and EmV = (57.567 ± 0.2) log [TRD] +676.29 for the above described TRD sensors, respectively. The results of the proposed method were statistically assessed and compared to those of sensors that had previously been reported. The modified TRD-PM-CeO2/Al2O3 nanocomposite was shown to have a substantially greater potential response than the standard kind. Furthermore, coating the sensor’s surface with a modified layer of metal oxide nanocomposite polymeric membrane improves the sensor’s electroconductivity and quantification of the tested TRD in capsules, with a mean percentage recovery of 99.63 ± 0.5 percent for the TRD-PM-CeO2/Al2O3 nanocomposite sensor, indicating high sensitivity and selectivity. As a result, the use of metal oxide nanocomposite in the construction of polymeric sensors opens up a promising avenue for the development of unique modified potentiometric sensors.
Author Contributions
Visualization, formal analysis, methodology S.S.A.; validation, writing—original draft, and writing review and editing M.F.E.-T. All authors have read and agreed to the published version of the manuscript.
Funding
This research was funded by Researchers Supporting Project in King Saud University and the code number is (RSP-2021/195).
Institutional Review Board Statement
Not applicable.
Informed Consent Statement
Not applicable.
Data Availability Statement
The collected data from the current study was included in the text.
Acknowledgments
The authors gratefully acknowledge the financial support from Researchers Supporting Project number (RSP-2021/195), King Saud University, Riyadh, Saudi Arabia.
Conflicts of Interest
The author informed that no conflict of interest associated with this study.
References
- Hornyak, G.L.; Tibbals, H.F.; Dutta, J.; Moore, J.J. Introduction to Nanoscience and Nanotechnology; CRC Press: Boca Raton, FL, USA, 2008. [Google Scholar] [CrossRef]
- Omanovic-Miklicanin, E.; Badnjevic, A.; Kazlagic, A.; Hajlovac, M. Nanocomposites: A brief review. Health Technol. 2020, 10, 51–59. [Google Scholar] [CrossRef]
- Bet-Moushoul, E.; Mansourpanah, Y.; Farhadi, K.; Tabatabaei, M. TiO2 nanocomposite based polymeric membranes: A review on performance improvement for various applications in chemical engineering processes. Chem. Eng. J. 2016, 283, 29–46. [Google Scholar] [CrossRef]
- Sharma, R.; Jafari, S.M.; Sharma, S. Antimicrobial bio-nanocomposites and their potential applications in food packaging. Food Control 2020, 112, 107086. [Google Scholar] [CrossRef]
- Ma, D.; Esmaeili, A.; Sbarufatti, C.; Giglio, M.; Manes, A. A method for determining the distribution of carbon nanotubes in nanocomposites by electric conductivity. Procedia Struct. Integr. 2022, 37, 105–114. [Google Scholar] [CrossRef]
- Stephanie, R.; Kim, M.W.; Kim, S.H.; Kim, J.K.; Park, C.Y.; Park, T.J. Recent advances of bimetallic nanomaterials and its nanocomposites for biosensing applications. TrAC Trends Anal. Chem. 2021, 135, 116159. [Google Scholar] [CrossRef]
- Dhatarwal, P.; Sengwa, R.J. Investigation on the optical properties of (PVP/PVA)/Al2O3 nanocomposite films for green disposable optoelectronics. Phys. B Condens. Matter 2021, 613, 412989. [Google Scholar] [CrossRef]
- Salauddin, M.; Rana, S.S.; Sharifuzzaman, M.; Rahman, M.T.; Park, C.; Cho, H.; Maharjan, P.; Bhatta, T.; Park, J.Y. A Novel MXene/Ecoflex Nanocomposite-coated Fabric as a highly negative and stable friction layer for high-output triboelectric nanogenerators. Adv. Energy Mater. 2021, 11, 2002832. [Google Scholar] [CrossRef]
- Choi, S.; Han, S.I.; Kim, D.; Hyeon, T.; Kim, D.H. High-performance stretchable conductive nanocomposites: Materials, processes, and device applications. Chem. Soci. Rev. 2019, 48, 1566–1595. [Google Scholar] [CrossRef]
- Javanbakht, S.; Pooresmaeil, M.; Namazi, H. Green one-pot synthesis of carboxymethylcellulose/Zn-based metal-organic framework/graphene oxide bio-nanocomposite as a nanocarrier for drug delivery system. Carbohydr. Polym. 2019, 208, 294–301. [Google Scholar] [CrossRef]
- Barkhordari, S.; Alizadeh, A.; Yadollahi, M.; Namazi, H. One-pot synthesis of magnetic chitosan/iron oxide bio-nanocomposite hydrogel beads as drug delivery systems. Soft Mater. 2021, 19, 373–381. [Google Scholar] [CrossRef]
- Kalyani, T.; Sangili, A.; Nanda, A.; Prakash, S.; Kaushik, A.; Jana, S.K. Bio-nanocomposite based highly sensitive and label-free electrochemical immunosensor for endometriosis diagnostics application. Bioelectrochemistry 2021, 139, 107740. [Google Scholar] [CrossRef] [PubMed]
- Maleki, P.; Nemati, F.; Gholoobi, A.; Hashemzadeh, A.; Sabouri, Z.; Darroudi, M. Green facile synthesis of silver-doped cerium oxide nanoparticles and investigation of their cytotoxicity and antibacterial activity. Inorg. Chem. Commun. 2021, 131, 108762. [Google Scholar] [CrossRef]
- Song, G.; Cheng, N.; Zhang, J.; Huang, H.; Yuan, Y.; He, X.; Luo, Y.; Huang, K. Nanoscale cerium oxide: Synthesis, biocatalytic mechanism, and applications. Catalysts 2021, 11, 1123. [Google Scholar] [CrossRef]
- Kızılkonca, E.; Torlak, E.; Erim, F.B. Preparation and characterization of antibacterial nano cerium oxide/chitosan/hydroxyethylcellulose/polyethylene glycol composite films. Int. J. Biol. Macromol. 2021, 177, 351–359. [Google Scholar] [CrossRef] [PubMed]
- Kumar, S.; Tripathy, S.; Singh, O.K.; Singh, S.G. Cerium oxide nanofiber based electroanalytical sensor for TNF-α detection: Improved interfacial stability with Nafion. Bioelectrochemistry 2021, 138, 107725. [Google Scholar] [CrossRef] [PubMed]
- Prakash, V.; Peralta-Videa, J.; Tripathi, D.K.; Ma, X.; Sharma, S. Recent insights into the impact, fate and transport of cerium oxide nanoparticles in the plant-soil continuum. Ecotoxicol. Environ. Saf. 2021, 221, 112403. [Google Scholar] [CrossRef]
- Casals, G.; Perramon, M.; Casals, E.; Portoles, I.; Fernandez-Varo, G.; Morales-Ruiz, M.; Puntes, V.; Jimenez, W. Cerium oxide nanoparticles: A new therapeutic tool in liver diseases. Antioxidants 2021, 10, 660. [Google Scholar] [CrossRef]
- Sharma, P.; Sharma, N. Optical Properties of Aluminium Oxide Nanoparticles Synthesized by Leaf Extract of Ocimum Sanctum. J. Nanosci. Technol. 2019, 5, 817–819. [Google Scholar] [CrossRef]
- Channappagoudra, M. Influence of the aluminium oxide (Al2O3) nanoparticle additive with biodiesel on the modified diesel engine performance. Int. J. Ambient Energy 2021, 42, 1776–1784. [Google Scholar] [CrossRef]
- Menni, Y.; Chamkha, A.J.; Massarotti, N.; Ameur, H.; Kaid, N.; Bensafi, M. Hydrodynamic and thermal analysis of water, ethylene glycol and water-ethylene glycol as base fluids dispersed by aluminum oxide nano-sized solid particles. Int. J. Numer. Method. Heat Fluid Flow 2020, 30, 4349–4386. [Google Scholar] [CrossRef]
- Hassan, M.; Faisal, A.; Bhatti, M.M. Interaction of aluminum oxide nanoparticles with flow of polyvinyl alcohol solutions base nanofluids over a wedge. Appl. Nanosci. 2018, 8, 53–60. [Google Scholar] [CrossRef] [Green Version]
- Naik, M.C.; Bamane, S.R.; Pakhare, K.S.; Potdar, S.S.; Patil, U.M. Synthesis of CeO2-Al2O3 nanocomposite by chemical combustion method for NO2 gas-sensing application. J. Mater. Sci. Mater. Electron. 2021, 32, 19925–19937. [Google Scholar] [CrossRef]
- Krishnan, A.; Sha, M.A.; Basheer, R.; Riyas, A.H.; Shibli, S.M.A. Vacancy mediated improvement in electrocatalytic HER on Nano-CeO2-Al2O3 incorporated Ni-P electrode. Mater. Sci. Semicond. Process. 2020, 116, 105138. [Google Scholar] [CrossRef]
- Avramova, I.; Stefanov, P.; Nicolova, D.; Stoychev, D.; Marinova, T. Characterization of nanocomposite CeO2–Al2O3 coatings electrodeposited on stainless steel. Compos. Sci. Technol. 2005, 65, 1663–1667. [Google Scholar] [CrossRef]
- Yulizar, Y.; Juliyanto, S.; Apriandanu, D.O.B.; Surya, R.M. Novel sol-gel synthesis of CeO2 nanoparticles using Morinda citrifolia L. fruit extracts: Structural and optical analysis. J. Mol. Struct. 2021, 1231, 129904. [Google Scholar] [CrossRef]
- Tabesh, S.; Davar, F.; Loghman-Estarki, M.R. Preparation of γ-Al2O3 nanoparticles using modified sol-gel method and its use for the adsorption of lead and cadmium ions. J. Alloys Compd. 2018, 730, 441–449. [Google Scholar] [CrossRef]
- Al-Shawafi, W.M.; Salah, N.; Alshahrie, A.; Ahmed, Y.M.; Moselhy, S.S.; Hammad, A.H.; Hussain, M.A.; Memic, A. Size controlled ultrafine CeO2 nanoparticles produced by the microwave assisted route and their antimicrobial activity. J. Mater. Sci. Mater. Med. 2017, 28, 1–10. [Google Scholar] [CrossRef]
- Hasanpoor, M.; Fakhr Nabavi, H.; Aliofkhazraei, M. Microwave-assisted synthesis of alumina nanoparticles using some plants extracts. J. Nanostruct. 2017, 7, 40–46. [Google Scholar] [CrossRef]
- Wang, T.; Sun, D.C. Preparation and characterization of nanometer-scale powders ceria by electrochemical deposition method. Mater. Res. Bull. 2008, 43, 1754–1760. [Google Scholar] [CrossRef]
- Pathania, D.; Katwal, R.; Kaur, H. Enhanced photocatalytic activity of electrochemically synthesized aluminum oxide nanoparticles. Int. J. Miner. Metall. and Mater. 2016, 23, 358–371. [Google Scholar] [CrossRef]
- Sudha, V.; Murugadoss, G.; Thangamuthu, R. Structural and morphological tuning of Cu-based metal oxide nanoparticles by a facile chemical method and highly electrochemical sensing of sulphite. Sci. Rep. 2021, 11, 1–12. [Google Scholar] [CrossRef] [PubMed]
- Zhou, X.; Pu, H.; Sun, D.W. DNA functionalized metal and metal oxide nanoparticles: Principles and recent advances in food safety detection. Crit. Rev. Food Sci. Nutr. 2021, 61, 2277–2296. [Google Scholar] [CrossRef] [PubMed]
- Dong, Q.; Ryu, H.; Lei, Y. Metal oxide based non-enzymatic electrochemical sensors for glucose detection. Electrochim. Acta 2021, 370, 137744. [Google Scholar] [CrossRef]
- Pragathiswaran, C.; Thulasi, G.; Al-Ansari, M.M.; Al-Humaid, L.A.; Saravanan, M. Experimental investigation and electrochemical characterization of titanium coated nanocomposite materials for biomedical applications. J. Mol. Struct. 2021, 1231, 129932. [Google Scholar] [CrossRef]
- Hua, R.; Hao, N.; Lu, J.; Qian, J.; Liu, Q.; Li, H.; Wang, K. A sensitive Potentiometric resolved ratiometric Photoelectrochemical aptasensor for Escherichia coli detection fabricated with non-metallic nanomaterials. Biosens. Bioelectron. 2018, 106, 57–63. [Google Scholar] [CrossRef] [PubMed]
- Singh, S.; Numan, A.; Somaily, H.H.; Dawsari, M.M.; Alqarni, M.H.S.; Alam, A.; Kumar, P. A novel, eco-friendly multi-walled carbon nanotubes functionalized copper metal-organic framework for ultrasensitive potentiometric detection of cadmium ions. J. Environ. Chem. Eng. 2021, 9, 106534. [Google Scholar] [CrossRef]
- Fazio, E.; Spadaro, S.; Corsaro, C.; Neri, G.; Leonardi, S.G.; Neri, F.; Lavanya, N.; Sekar, C.; Donato, N.; Neri, G. Metal-oxide based nanomaterials: Synthesis, characterization and their applications in electrical and electrochemical sensors. Sensors 2021, 21, 2494. [Google Scholar] [CrossRef]
- Khorshid, A.F. New analysis for itopride hydrochloride utilizing chemically modified carbon paste sensor in ganaton, garopride, bulk, human urine/plasma. Sens. Bio Sens. Res. 2022, 100479. [Google Scholar] [CrossRef]
- Zhu, Y.; Chen, C.; Wu, S.; Cheng, R.; Gao, J.; Yu, Y.; Zhou, W. Phosphomolybdic acid-decorated carbon nanotubes for low-power sensing of NH3 and NO2 at room temperature. ACS Appl. Nano Mater. 2021, 4, 1976–1984. [Google Scholar] [CrossRef]
- Vazzana, M.; Andreani, T.; Fangueiro, J.; Faggio, C.; Silva, C.; Santini, A.; Garcia, M.L.; Silva, A.M.; Souto, E.B. Tramadol hydrochloride: Pharmacokinetics, pharmacodynamics, adverse side effects, co-administration of drugs and new drug delivery systems. Biomed. Pharmacother. 2015, 70, 234–238. [Google Scholar] [CrossRef]
- Taghizade, M.; Ebrahimi, M.; Fooladi, E.; Yoosefian, M. Simultaneous spectrophotometric determination of the residual of ciprofloxacin, famotidine, and tramadol using magnetic solid phase extraction coupled with multivariate calibration methods. Microchem. J. 2021, 160, 105627. [Google Scholar] [CrossRef]
- Hamdy, M.M.; Abdel Moneim, M.M. HPLC-fluorescence detection for assay of tramadol binary mixtures with ibuprofen or chlorzoxazone in tablets and plasma: Analytical Eco-Scale and GAPI tools for green assessment. Acta Chromatogr. 2021, 34, 185–196. [Google Scholar] [CrossRef]
- Pereira, F.J.; Rodriguez-Cordero, A.; Lopez, R.; Robles, L.C.; Aller, A.J. Development and validation of an RP-HPLC-PDA method for determination of paracetamol, caffeine and tramadol hydrochloride in pharmaceutical formulations. Pharmaceuticals 2021, 14, 466. [Google Scholar] [CrossRef] [PubMed]
- Yoo, O.; Tang, E.K.Y.; Nguyen, M.N.; Salman, S.; Hua, A.J.; von Ungern Sternberg, B.S.; Lim, L.Y. HPLC-UV assay of tramadol and O-desmethyltramadol in human plasma containing other drugs potentially co-administered to participants in a paediatric population pharmacokinetic study. J. Chromatogr. B 2021, 1184, 122971. [Google Scholar] [CrossRef] [PubMed]
- Hojjati-Najafabadi, A.; Salmanpour, S.; Sen, F.; Asrami, P.N.; Mahdavian, M.; Khalilzadeh, M.A. A tramadol drug electrochemical sensor amplified by biosynthesized Au nanoparticle using mentha aquatic extract and ionic liquid. Top. Catal. 2021, 1–8. [Google Scholar] [CrossRef]
- Saichanapan, J.; Promsuwan, K.; Saisahas, K.; Soleh, A.; Chang, K.H.; Abdullah, A.F.L.; Limbut, W. Voltammetric Determination of Tramadol Using a Hierarchical Graphene Oxide Nanoplatelets Modified Electrode. J. Electrochem. Soci. 2021, 168, d117512. [Google Scholar] [CrossRef]
- Borman, P.; Elder, D. Q2 (R1) validation of analytical procedures. ICH Qual. Guidel. 2017, 5, 127–166. [Google Scholar]
- Egorov, V.V.; Zdrachek, E.A.; Nazarov, V.A. Improved separate solution method for determination of low selectivity coefficients. Anal. Chem. 2014, 86, 3693–3696. [Google Scholar] [CrossRef]
- Kusmierek, E. A CeO2 semiconductor as a photocatalytic and photoelectrocatalytic material for the remediation of pollutants in industrial wastewater: A review. Catalysts 2020, 10, 1435. [Google Scholar] [CrossRef]
- Abdollahifar, M.; Zamani, R.M.; Beiygie, E.; Nekouei, H. Synthesis of micro-mesopores flowerlike γ-Al2O3 nano-architectures. J. Serb. Chem. Soci. 2014, 79, 1007–1017. [Google Scholar] [CrossRef]
- Jana, J.; Ganguly, M.; Pal, T. Enlightening surface plasmon resonance effect of metal nanoparticles for practical spectroscopic application. RSC Adv. 2016, 6, 86174–86211. [Google Scholar] [CrossRef]
- Reddy, K.P.; Choi, H.; Kim, D.; Choi, M.; Ryoo, R.; Park, J.Y. The facet effect of ceria nanoparticles on platinum dispersion and catalytic activity of methanol partial oxidation. Chem. Commun. 2021, 57, 7382–7385. [Google Scholar] [CrossRef] [PubMed]
- Yue, X.; Zhang, T.; Yang, D.; Qiu, F.; Rong, J.; Xu, J.; Fang, J. The synthesis of hierarchical porous Al2O3/acrylic resin composites as durable, efficient and recyclable absorbents for oil/water separation. Chem. Eng. J. 2017, 309, 522–531. [Google Scholar] [CrossRef]
- Chelliah, M.; Rayappan, J.B.B.; Krishnan, U.M. Synthesis and characterization of cerium oxide nanoparticles by hydroxide mediated approach. J. Appl. Sci. 2012, 12, 1734–1737. [Google Scholar] [CrossRef] [Green Version]
- Fathi, M.H.; Hanifi, A. Evaluation and characterization of nanostructure hydroxyapatite powder prepared by simple sol-gel method. Mater. Lett. 2007, 61, 3978–3983. [Google Scholar] [CrossRef]
- Singh, R.D.; Koli, P.B.; Jagdale, B.S.; Patil, A.V. Effect of firing temperature on structural and electrical parameters of synthesized CeO2 thick films. SN Appl. Sci. 2019, 1, 1–9. [Google Scholar] [CrossRef] [Green Version]
- Pugachevskii, M.A.; Chibisov, A.N.; Kuzmenko, A.P.; Fedorov, A.S. Theoretical and experimental studies of structural defects in CeO2 nanoparticles. Solid State Phenom. 2020, 312, 68–73. [Google Scholar] [CrossRef]
- Sun, C.; Xue, D. Size-dependent oxygen storage ability of nano-sized ceria. Phys. Chem. Chem. Phys. 2013, 15, 14414–14419. [Google Scholar] [CrossRef]
- Young, M.J.; Bedford, N.M.; Yanguas-Gil, A.; Letourneau, S.; Coile, M.; Mandia, D.J.; Aoun, B.; Cavanagh, A.S.; George, S.M.; Elam, J.W. Probing the atomic-scale structure of amorphous aluminum oxide grown by atomic layer deposition. ACS Appl. Mater. Inter. 2020, 12, 22804–22814. [Google Scholar] [CrossRef]
- Talbot, D.; Queiros Campos, J.; Checa-Fernandez, B.L.; Marins, J.A.; Lomenech, C.; Hurel, C.; Godeau, G.D.; Raboisson-Michel, M.; Verger-Dubois, G.; Obeid, L.; et al. Adsorption of organic dyes on magnetic iron oxide nanoparticles. Part I: Mechanisms and adsorption-induced nanoparticle agglomeration. ACS Omega 2021, 6, 19086–19098. [Google Scholar] [CrossRef]
- Keskin, B.; Zeytuncu-Gokoglu, B.; Koyuncu, I. Polymer inclusion membrane applications for transport of metal ions: A critical review. Chemosphere 2021, 279, 130604. [Google Scholar] [CrossRef] [PubMed]
- Santha, N.I.; Sebastian, M.T.; Mohanan, P.; Alford, N.M.; Sarma, K.; Pullar, R.C.; Kamba, S.; Pashkin, A.; Samukhina, P.; Petzelt, J. Effect of doping on the Dielectric properties of Cerium Oxide in the Microwave and Far-Infrared Frequency Range. J. Am. Ceram. Soci. 2004, 87, 1233–1237. [Google Scholar] [CrossRef]
- Acharya, J.; Wilt, J.; Liu, B.; Wu, J. Probing the dielectric properties of ultrathin Al/Al2O3/Al trilayers fabricated using in situ sputtering and atomic layer deposition. ACS Appl. Mater. Interf. 2018, 10, 3112–3120. [Google Scholar] [CrossRef] [PubMed]
- Isa, I.M.; Sohaimi, N.M.; Hashim, N.; Kamari, A.; Mohamed, A.; Ahmad, M.; Ghani, S.A. Determination of salicylate ion by potentiometric membrane electrode based on zinc aluminium layered double hydroxides-4 (2, 4-dichlorophenoxy) butyrate nanocomposites. Int. J. Electrochem. Sci. 2013, 8, 2112–2121. [Google Scholar]
- Grady, T.; Cadogan, A.; McKittrick, T.; Harris, S.J.; Diamond, D.; McKervey, M.A. Sodium-selective electrodes based on triester monoacid derivatives of p-tert-butylcalix [4] arene. Comparison with tetraester calix [4] arene ionophores. Anal. Chim. Acta 1992, 336, 1–12. [Google Scholar] [CrossRef]
- Bakker, E. Evaluation of Egorov’s improved separate solution method for determination of low selectivity coefficients by numerical simulation. Anal. Chem. 2014, 86, 8021–8024. [Google Scholar] [CrossRef]
- Shawish, H.M.A.; Saadeh, S.M.; Al-Dalou, A.R.; Ghalwa, N.A.; Abou Assi, A.A. Optimization of tramadol–PVC membrane electrodes using miscellaneous plasticizers and ion-pair complexes. Mater. Sci. Eng. C 2011, 31, 300–306. [Google Scholar] [CrossRef]
- De Winter, J.C. Using the Student’s t-test with extremely small sample sizes. Pract. Assess. Res. Eval. 2013, 18, 10. [Google Scholar] [CrossRef]
- Tawade, B.V.; Apata, I.E.; Singh, M.; Das, P.; Pradhan, N.; Al-Enizi, A.M.; Karim, A.; Raghavan, D. Recent developments in the synthesis of chemically modified nanomaterials for use in dielectric and electronics applications. Nanotechnol. 2021, 32, 142004. [Google Scholar] [CrossRef]
- Mohaisen, A.; Hamad, Z. Fabrication and characterization of polymer blend doped with metal carbide nanoparticles for humidity sensors. J. Nanostruct. 2019, 9, 340–348. [Google Scholar] [CrossRef]
- Shrivastava, S.; Jadon, N.; Jain, R. Next-generation polymer nanocomposite-based electrochemical sensors and biosensors: A review. TrAC Trend. Anal. Chem. 2016, 82, 55–67. [Google Scholar] [CrossRef]
- Shawish, H.M.A.; Al-Dalou, A.R.; Ghalwa, N.A.; Assi, A.A.A. Potentiometric sensor for determination of tramadol hydrochloride in pharmaceutical preparations and biological fluids. Pharm. Anal. Acta 2010, 1, 1000103. Available online: https://scholar.alaqsa.edu.ps/id/eprint/571 (accessed on 20 March 2022). [CrossRef] [Green Version]
- Shawish, H.M.A.; Ghalwa, N.A.; Al-Dalou, A.R.; Zaggout, F.R.; Saadeh, S.M.; Abou Assi, A.A. Effect of plasticizers and ion-exchangers on the detection limit of tramadol-PVC membrane electrodes. Eur. J. Anal. Chem. 2011, 6, 70–83. [Google Scholar]
- Zare, E.N.; Makvandi, P.; Ashtari, B.; Rossi, F.; Motahari, A.; Perale, G. Progress in conductive polyaniline-based nanocomposites for biomedical applications: A review. J. Med. Chem. 2019, 63, 1–22. [Google Scholar] [CrossRef]
Publisher’s Note: MDPI stays neutral with regard to jurisdictional claims in published maps and institutional affiliations. |
© 2022 by the authors. Licensee MDPI, Basel, Switzerland. This article is an open access article distributed under the terms and conditions of the Creative Commons Attribution (CC BY) license (https://creativecommons.org/licenses/by/4.0/).