
Superconducting Properties of YBa2Cu3O7−δ with a Multiferroic Addition Synthesized by a Capping Agent-Aided Thermal Treatment Method

 , , ,
, , ,  ,
,
Abstract
1. Introduction
2. Materials and Methods
3. Results and Discussion
3.1. X-ray Diffraction
3.2. Alternating Current Susceptibility (ACS) Analysis
3.3. Field Emission Scanning Electron Microscopy (FESEM) Analysis
3.4. Energy Dispersive X-ray (EDX) Analysis
4. Conclusions
Author Contributions
Funding
Data Availability Statement
Conflicts of Interest
References
- Miryala, S. Prospects of Superconducting Magnet Technology in the Medical Field: A New Paradigm on the Horizon? In Superconductivity; Springer: Cham, Germany, 2020; pp. 353–360. [Google Scholar]
- Lee, H.W.; Kim, K.C.; Lee, J. Review of Maglev Train Technologies. IEEE Trans. Magn. 2006, 42, 1917–1925. [Google Scholar]
- Ginzburg, V.L.; Andryushin, E.A. Superconductivity (Revised Edition); World Scientific: Singapore, 2004. [Google Scholar]
- Crisan, A.; Sarkar, A.; Mikheenko, P.; Dang, V.S.; Kechik, M.M.A.; Abell, J.S. Improvement of Pinning Force and Critical Current Density in Thick YBa2Cu3O7− δ Films Grown on SrTiO3 Substrates Decorated with LaNiO3 Nanodots. J. Supercond. Nov. Magn. 2009, 22, 631–636. [Google Scholar] [CrossRef]
- Lu, X.Y.; Yi, D.; Chen, H.; Nagata, A. Effect of SnO, MgO and Ag2O Mix-Doping on the Formation and Superconducting Properties of Bi-2223 Ag/tapes. Phys. Procedia 2016, 81, 129–132. [Google Scholar] [CrossRef]
- Ramli, A.; Halim, S.A.; Chen, S.K.; Kechik, M.M.A. The effect of Gd2O3 Nanoparticles Addition on Microstructural and Electrical Properties of YBCO Superconductor. J. Eng. Appl. Sci. 2016, 11, 13708–13715. [Google Scholar]
- Yusuf, N.N.M.; Kechik, M.M.A.; Baqiah, H.; Chen, S.K.; Lim, K.P.; Halim, S.A.; Abd-Shukor, R. Structural and Superconducting Properties of Thermal Treatment-Synthesised Bulk YBa2Cu3O7−δ Superconductor: Effect of Addition of SnO2 Nanoparticles. Materials 2019, 12, 92. [Google Scholar] [CrossRef]
- Naseri, M.G.; Saion, E.B.; Ahangar, H.A.; Hashim, M.; Halim, S.A. Synthesis and Characterization of Manganese Ferrite Nanoparticles by Thermal Treatment Method. J. Magn. Magn. 2011, 323, 1745–1749. [Google Scholar] [CrossRef]
- Zahari, R.M.; Shaari, A.H.; Abbas, Z.; Baqiah, H.; Chen, S.K.; Lim, K.P.; Kechik, M.M.A. Simple Preparation and Characterization of Bismuth Ferrites Nanoparticles by Thermal Treatment Method. J. Mater. Sci. Mater. Electron. 2017, 28, 17932–17938. [Google Scholar] [CrossRef]
- Mahto, C. Synthesis and Characterization of YBa2Cu3O7−x Superconductor. In Master Science; National Institute of Technology: Rourkela, India, 2015. [Google Scholar]
- Admaiai, L.F.; Grange, P.; Delmon, B.; Cassart, M.; Issi, J.P. Synthesis of Bulk and Film YBa2Cu3O7−x High-temperature Superconductor by the Sol-gel Method. J. Mater. Sci. 1994, 29, 5817–5825. [Google Scholar] [CrossRef]
- Pramanik, P.; Biswas, S.; Singh, C.; Bhattacharya, D.; Dey, T.K.; Sen, D.; Ghatak, S.K.; Chopra, K.L. Coprecipitation Method for Preparation of Superconducting YBa2Cu3Ox Compounds. Mater. Res. Bull. 1988, 23, 1693–1698. [Google Scholar] [CrossRef]
- Dihom, M.M.; Halim, S.A.; Baqiah, H.; Chen, S.K.; Azis, R.S.; Abd-Shukor, R.; Al-Hada, N.M.; Kechik, M.M.A.; Talib, Z.A. Calcium-substituted Y3Ba5Cu8O18 Ceramics Synthesized via Thermal Treatment Method: Structural and Superconducting Properties. J. Supercond. Nov. Magn. 2019, 32, 1875–1883. [Google Scholar] [CrossRef]
- Koczkur, K.M.; Mourdikoudis, S.; Polavarapu, L.; Skrabalak, S.E. Polyvinylpyrrolidone (PVP) in Nanoparticle Synthesis. Dalton Trans. 2015, 44, 17883–17905. [Google Scholar] [CrossRef] [PubMed]
- Mellekh, A.; Zouaoui, M.; Azzouz, F.B.; Annabi, M.; Salem, M.B. Nano-Al2O3 Particle Addition Effects on YBa2Cu3Oy Superconducting Properties. Solid State Commun. 2006, 140, 318–323. [Google Scholar] [CrossRef]
- Khalid, N.A.; Kechik, M.M.A.; Baharuddin, N.A.; Chen, S.K.; Baqiah, H.; Yusuf, N.N.M.; Halim, S.A.; Hashim, A.; Talib, Z.A. Impact of Carbon Nanotubes Addition on Transport and Superconducting Properties of YBa2Cu3O7−δ ceramics. Ceram. Int. 2018, 44, 9568–9573. [Google Scholar] [CrossRef]
- Kong, W.; Abd-Shukor, R. Enhanced Electrical Transport Properties of Nano NiFe2O4-added (Bi1.6Pb0 4)Sr2Ca2Cu3O10 Superconductor. J. Supercond. Nov. Magn. 2010, 23, 257–263. [Google Scholar] [CrossRef]
- Abd-Ghani, S.N.; Abd-Shukor, R.; Kong, W. Effects of Fe3O4 Nano Particles Addition in High Temperature Superconductor YBa2Cu3O7-δ. Adv. Mat. Res. 2012, 501, 309–313. [Google Scholar]
- Tranquada, J.M.; Heald, S.M.; Moodenbaugh, A.R.; Xu, Y. Mixed Valency, Hole Concentration and Tc in YBa2Cu3O6+x. Phys. Rev. B 1988, 38, 8893. [Google Scholar] [CrossRef] [PubMed]
- Inoue, K.; Sakai, N.; Murakami, M.; Hirabayashi, I. Effect of Potassium Addition on YBa2Cu3Ox Superconductors. Phys. C Supercond. Appl. 2006, 445, 128–132. [Google Scholar] [CrossRef]
- Howe, B.A. Crystal Structure and Superconductivity of YBa2Cu3O7–x; Minnesota State University: Mankato, MN, USA, 2014. [Google Scholar]
- Monshi, A.; Foroughi, M.R.; Monshi, M.R. Modified Scherrer Equation to Estimate more Accurately Nano-crystallite Size using XRD. World J. Nano Sci. Eng. 2012, 2, 160. [Google Scholar] [CrossRef]
- Serquis, A.; Zhu, Y.T.; Peterson, E.J.; Coulter, J.Y.; Peterson, D.E.; Mueller, F.M. Effect of Lattice Strain and Defects on the Superconductivity of MgB2. Appl. Phys. Lett. 2001, 79, 4399–4401. [Google Scholar] [CrossRef]
- Hassanzadeh-Tabrizi, S.A.; Mazaheri, M.; Aminzare, M.; Sadrnezhaad, S.K. Reverse Precipitation Synthesis and Characterization of CeO2 Nanopowder. J. Alloys Compd. 2010, 491, 499–502. [Google Scholar] [CrossRef]
- Rammah, Y.S.; Salama, A.H.; Elkhatib, M. MagneticMmoment and its Correlation with the Critical Temperature in YBCO. Interceram 2019, 68, 34–41. [Google Scholar]
- Zelati, A.; Amirabadizadeh, A.; Kompany, A.; Salamati, H.; Sonier, J. Effects of Dy2O3 Nanoparticle Addition on Structural and Superconducting Properties of BSCCO. Indian J. Sci Technol. 2014, 7, 123. [Google Scholar] [CrossRef]
- Ramli, A.; Halim, S.A.; Baqiah, H.; Chen, S.K.; Kechik, M.M.A.; Talib, Z.A. Role of Nd2O3 Nanoparticles Addition on Microstructural and Superconducting Properties of YBa2Cu3O7−δ ceramics. J. Rare Earths 2016, 34, 895–900. [Google Scholar] [CrossRef]
- Özdaş, E.; First, T. Influence of the Hole Concentration on Tc in 110K BiPbSrCaCuO Superconductors: The Intergrain and Intragrain Effects. In Physics and Materials Science of High Temperature Superconductors; Springer: Dordrecht, Germany, 1992; pp. 381–393. [Google Scholar]
- Rani, P.; Jha, R.; Awana, V.P.S. AC Susceptibility Study of Superconducting YBa2Cu3O7: Agx Bulk Composites (x = 0.0–0.20): The Role of Intra and Intergranular Coupling. J. Supercond. Nov. Magn. 2013, 26, 2347–2352. [Google Scholar] [CrossRef]
- Singh, R.K.; Varshney, D.; Khaskalam, A.K. Effect of Oxygen Deficiency (δ) on Transition Temperature of Yttrium Cuprate Superconductors. Bull. Mater. Sci. 1996, 19, 737–747. [Google Scholar] [CrossRef]
- Benzi, P.; Bottizzo, E.; Rizzi, N. Determination from Cell Dimensions in YBCO Superconductors. J. Cryst. Growth Oxyg. 2004, 269, 625–629. [Google Scholar] [CrossRef]
- Bean, C.P. Magnetization of Hard Superconductors. Phys. Rev. Lett. 1962, 8, 250. [Google Scholar] [CrossRef]
- Zhang, N.; Ye, C.; Yan, H.; Li, L.; He, H.; Wang, D.; Li, Y. Single-atom Site Catalysts for Environmental Catalysis. Nano Res. 2020, 13, 3165–3182. [Google Scholar] [CrossRef]
- Bahboh, A.; Halim, S.A.; Baqiah, H.; Chen, S.K.; Kechik, M.M.A.; Talib, Z.A.; Dihom, M.M. Effect of Sol-gel Synthesized BiFeO3 Nanoparticle Addition in YBa2Cu3O7–δ (Y123) Superconductor Synthesized by Standard Solid State Reaction Method. Solid State Phenom. 2019, 290, 245–251. [Google Scholar] [CrossRef]
- Attaf, S.; Mosbah, M.F.; Vecchione, A.; Fittipaldi, R. The influence of Doping with Ca and Mg in YBa2Cu3O7−δ Ceramic. EDP Sci. 2019, 29, 00003. [Google Scholar]
- Jongprateep, O.; Chansuriya, A.; Rugthaichareoncheep, S. Composition and Particle Size of ReBa2Cu3O7−X Superconductor Powders Synthesized by Solid State Reactions. Suranaree. J. Sci. Technol. 2013, 19, 155–160. [Google Scholar]
- Boston, R.; Awaya, K.; Nakayama, T.; Ogasawara, W.; Hall, S.R. Formation of Superconducting Yttrium Barium Copper Oxide using Sulphur-containing Templates. RSC Adv. 2014, 4, 26824–26828. [Google Scholar] [CrossRef]


| Y-123 + x wt.% BiFeO3 | Weight Percentage (%) | |||
|---|---|---|---|---|
| YBa2Cu3O7 | Y2BaCuO5 | BiFeO3 | YBaCuFeO5 | |
| 0.0 | 90.30 | 9.70 | 0.00 | 0.00 |
| 0.2 | 94.65 | 4.88 | 0.47 | 0.00 |
| 1.0 | 97.10 | 2.89 | 0.00 | 0.00 |
| 1.5 | 92.33 | 4.68 | 0.00 | 2.99 |
| 2.0 | 88.82 | 6.98 | 0.00 | 4.20 |
| Y-123 + x wt.% BiFeO3 | Crystallite Size (Å) | Lattice Strain (%) | Lattice Parameter | Unit Cell Volume (Å3) | Orthorhombicity | Full Width at Half Maximum (FWHM) | ||
|---|---|---|---|---|---|---|---|---|
| a (Å) | b (Å) | c (Å) | ||||||
| 0.0 | 1166 | 0.163 | 3.8178 ± 0.0001 | 3.8837 ± 0.0001 | 11.6796 ± 0.0004 | 173.164 | 0.009 | 0.1185 |
| 0.2 | 1035 | 0.178 | 3.8223 ± 0.0002 | 3.8874 ± 0.0002 | 11.6770 ± 0.0003 | 173.507 | 0.008 | 0.1297 |
| 1.0 | 739 | 0.229 | 3.8281 ± 0.0002 | 3.8895 ± 0.0003 | 11.6740 ± 0.0005 | 173.818 | 0.008 | 0.1568 |
| 1.5 | 910 | 0.196 | 3.8303 ± 0.0002 | 3.8832 ± 0.0003 | 11.6717 ± 0.0006 | 173.603 | 0.007 | 0.1413 |
| 2.0 | 618 | 0.264 | 3.8385 ± 0.0005 | 3.8739 ± 0.0005 | 11.6984 ± 0.0016 | 173.956 | 0.005 | 0.1838 |
| Y-123 + x wt.% BiFeO3 | Tp (K) | Tc-onset (K) | Tp/Tc-onset | Tcj (K) | Io (A) | Oxygen Deficiency δ |
|---|---|---|---|---|---|---|
| 0.0 | 89.35 | 90.19 | 0.99 | 90.09 | 12.8 × 10⁻⁵ | 0.07 |
| 0.2 | 89.91 | 89.41 | 0.97 | 88.95 | 27.3 × 10⁻⁵ | 0.06 |
| 1.0 | 87.01 | 90.81 | 0.95 | 87.74 | 4.22 × 10⁻⁵ | 0.04 |
| 1.5 | 89.15 | 91.91 | 0.97 | 89.94 | 6.73 × 10⁻⁵ | 0.03 |
| 2.0 | 86.43 | 91.38 | 0.95 | 89.04 | 5.60 × 10⁻⁵ | 0.18 |
| Y-123 + x wt.% BiFeO3 | Cross-Section Area of Sample, a × b (cm2) | Tp (K) | Jcm (A/cm2) |
| 0.0 | 0.149 × 0.296 | 89.35 | 3.88 |
| 0.2 | 0.170 × 0.274 | 89.91 | 3.54 |
| 1.0 | 0.128 × 0.196 | 87.01 | 4.17 |
| 1.5 | 0.151 × 0.254 | 89.15 | 3.90 |
| 2.0 | 0.128 × 0.196 | 86.43 | 4.17 |
| Y-123 + x wt.% BiFeO3 | Average Grain Size (μm) |
|---|---|
| 0.0 | 5.00 ± 0.6 |
| 0.2 | 4.16 ± 0.2 |
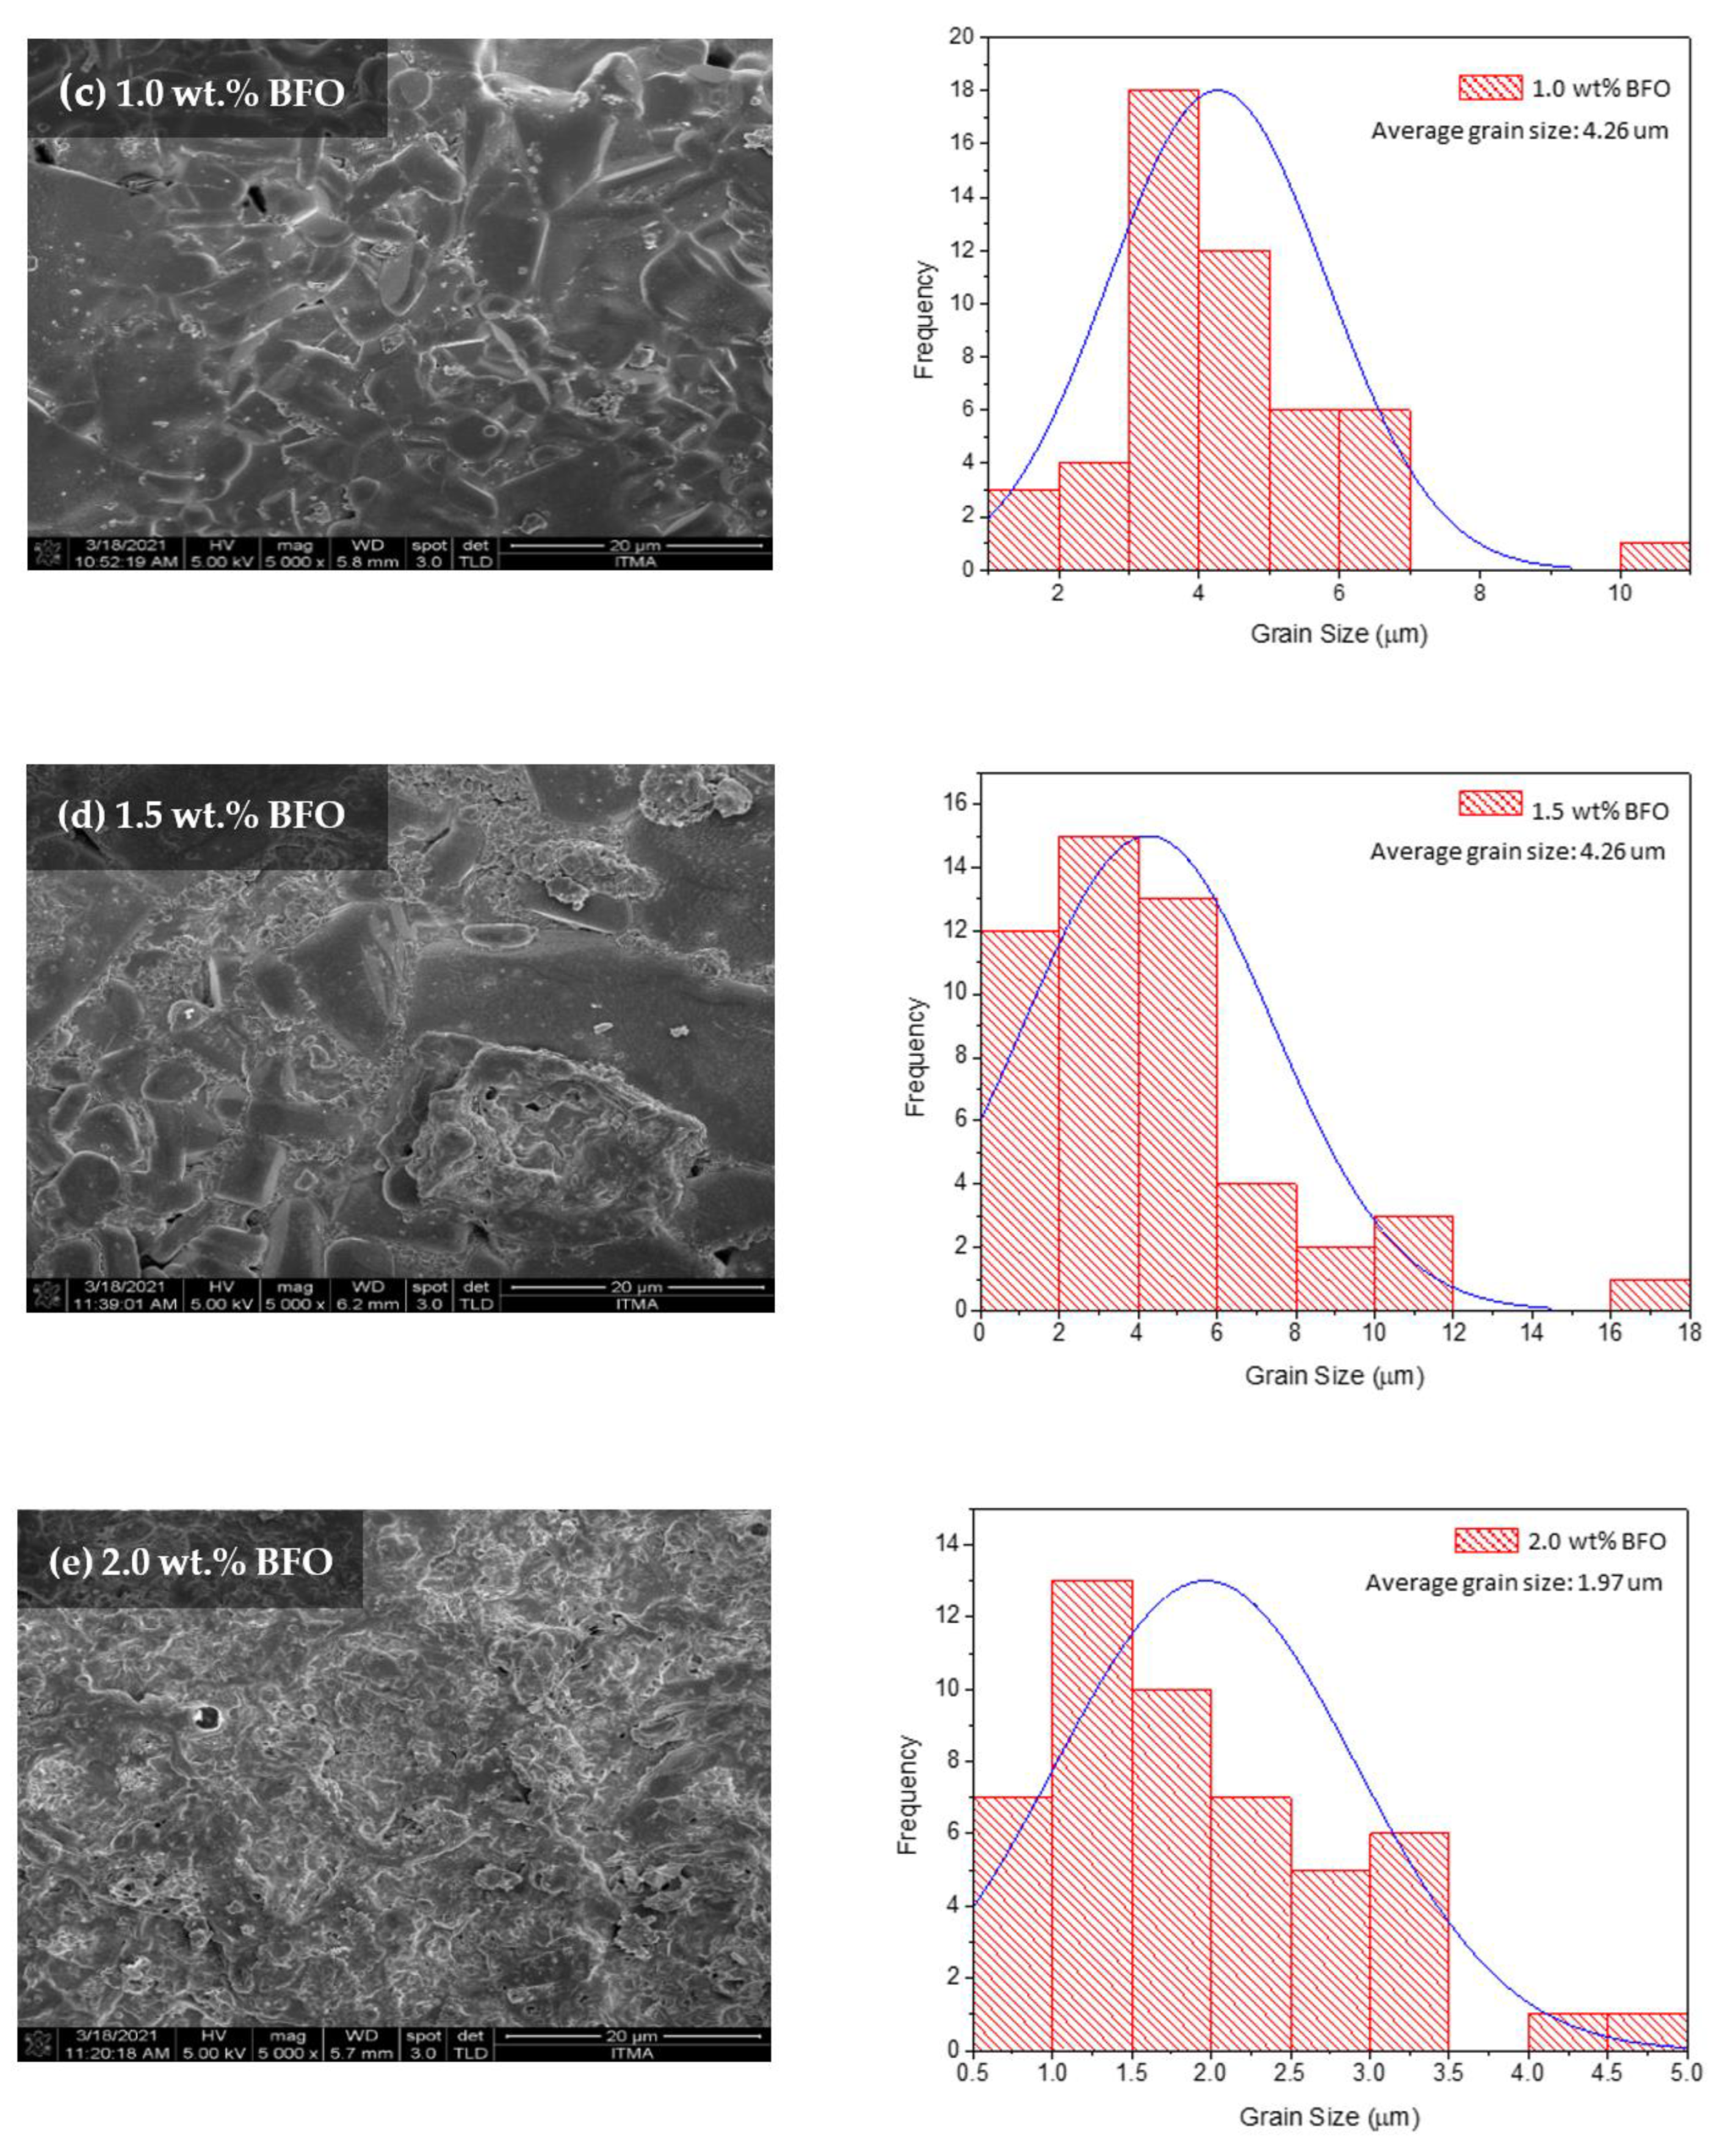
| 1.0 | 4.26 ± 0.2 |
| 1.5 | 4.26 ± 0.4 |
| 2.0 | 1.97 ± 0.1 |
| Y-123 + x wt.% BiFeO3 | Atomic % | Atomic Ratio Y:Ba:Cu:O | |||
|---|---|---|---|---|---|
| Y | Ba | Cu | O | ||
| 0.0 | 4.61 | 13.68 | 17.32 | 53.28 | 1:2.9:3.7:11.6 |
| 0.2 | 6.18 | 16.06 | 16.86 | 48.95 | 1:2.6:2.7:7.9 |
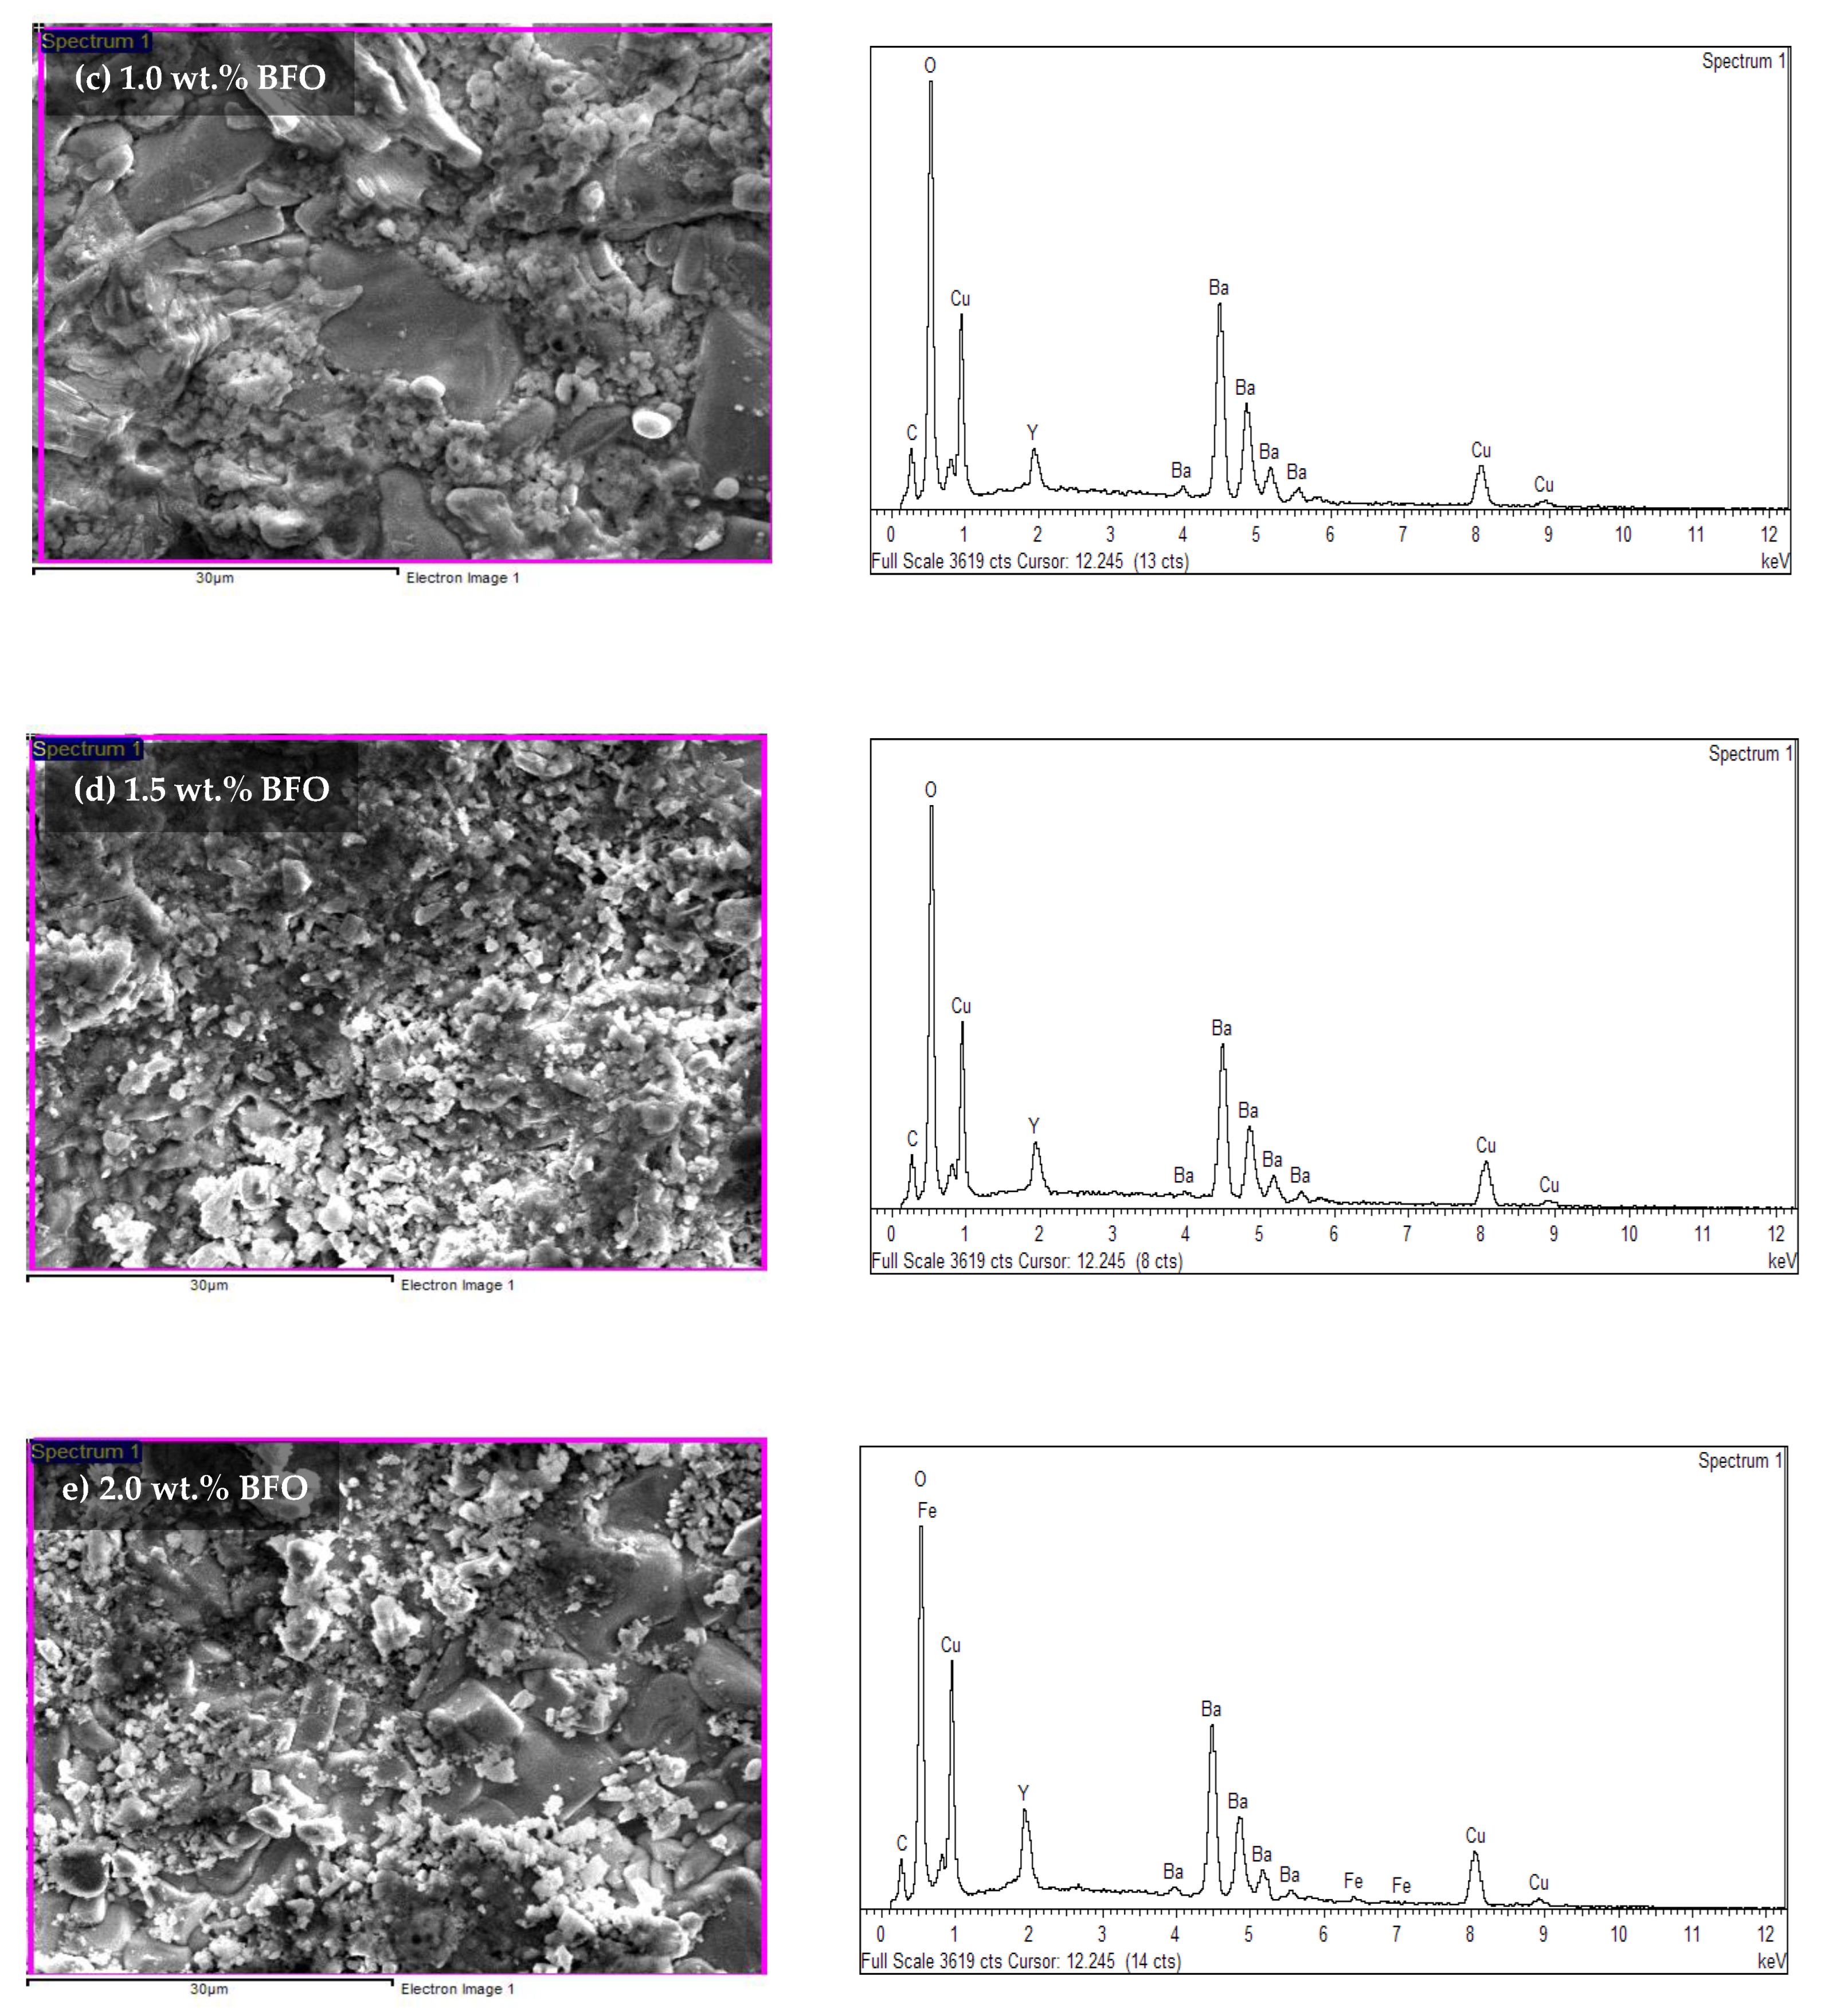
| 1.0 | 3.36 | 12.69 | 15.84 | 49.74 | 1:3.7:4.7:14.8 |
| 1.5 | 2.21 | 11.77 | 12.75 | 53.33 | 1:5.3:5.8:24.1 |
| 2.0 | 1.77 | 14.23 | 12.93 | 51.75 | 1:8:7.3:29.2 |
Publisher’s Note: MDPI stays neutral with regard to jurisdictional claims in published maps and institutional affiliations. |
© 2022 by the authors. Licensee MDPI, Basel, Switzerland. This article is an open access article distributed under the terms and conditions of the Creative Commons Attribution (CC BY) license (https://creativecommons.org/licenses/by/4.0/).
Share and Cite
Dzul-Kifli, N.A.C.; Kechik, M.M.A.; Baqiah, H.; Shaari, A.H.; Lim, K.P.; Chen, S.K.; Sukor, S.I.A.; Shabdin, M.K.; Karim, M.K.A.; Shariff, K.K.M.; et al. Superconducting Properties of YBa2Cu3O7−δ with a Multiferroic Addition Synthesized by a Capping Agent-Aided Thermal Treatment Method. Nanomaterials 2022, 12, 3958. https://doi.org/10.3390/nano12223958
Dzul-Kifli NAC, Kechik MMA, Baqiah H, Shaari AH, Lim KP, Chen SK, Sukor SIA, Shabdin MK, Karim MKA, Shariff KKM, et al. Superconducting Properties of YBa2Cu3O7−δ with a Multiferroic Addition Synthesized by a Capping Agent-Aided Thermal Treatment Method. Nanomaterials. 2022; 12(22):3958. https://doi.org/10.3390/nano12223958
Chicago/Turabian StyleDzul-Kifli, Nur Athirah Che, Mohd Mustafa Awang Kechik, Hussein Baqiah, Abdul Halim Shaari, Kean Pah Lim, Soo Kien Chen, Safia Izzati Abd Sukor, Muhammad Kashfi Shabdin, Muhammad Khalis Abdul Karim, Khairul Khaizi Mohd Shariff, and et al. 2022. "Superconducting Properties of YBa2Cu3O7−δ with a Multiferroic Addition Synthesized by a Capping Agent-Aided Thermal Treatment Method" Nanomaterials 12, no. 22: 3958. https://doi.org/10.3390/nano12223958
APA StyleDzul-Kifli, N. A. C., Kechik, M. M. A., Baqiah, H., Shaari, A. H., Lim, K. P., Chen, S. K., Sukor, S. I. A., Shabdin, M. K., Karim, M. K. A., Shariff, K. K. M., & Miryala, M. (2022). Superconducting Properties of YBa2Cu3O7−δ with a Multiferroic Addition Synthesized by a Capping Agent-Aided Thermal Treatment Method. Nanomaterials, 12(22), 3958. https://doi.org/10.3390/nano12223958