Article

Breakdown Performance and Partial Discharge Development in Transformer Oil-Based Metal Carbide Nanofluids

by
Konstantinos N. Koutras
1,*,
Sokratis N. Tegopoulos
2,
Vasilios P. Charalampakos
3,
Apostolos Kyritsis
2,
Ioannis F. Gonos
4 and
Eleftheria C. Pyrgioti
1
1
High Voltage Laboratory, Department of Electrical & Computer Engineering, University of Patras, GR 26500 Patras, Greece
2
School of Applied Mathematics & Physical Sciences, National Technical University of Athens, GR 15780 Athens, Greece
3
Department of Electrical & Computer Engineering, University of the Peloponnese, GR 26334 Patras, Greece
4
School of Electrical & Computer Engineering, National Technical University of Athens, GR 15780 Athens, Greece
*
Author to whom correspondence should be addressed.
Nanomaterials 2022, 12(2), 269; https://doi.org/10.3390/nano12020269
Submission received: 20 December 2021 / Revised: 10 January 2022 / Accepted: 12 January 2022 / Published: 14 January 2022
(This article belongs to the Special Issue New Frontiers in Nanofluids)

Abstract

:
In this work, the influence of semi-conductive SiC nanoparticles on the AC breakdown voltage and partial discharge development in natural ester oil FR3 is examined. Primarily, the dielectric constant and the electrical conductivity of the nanoparticles are measured following the broadband dielectric spectroscopy technique. The nanoparticles are added into the matrix following the ultrasonication process in three weight percentage ratios in order for their effect to be evaluated as a function of their concentration inside the base oil. The processing of the results reveals that the nanofluid containing SiC nanoparticles at 0.004% w/w demonstrates the highest AC dielectric strength improvement and shows the greatest resistance to the appearance of partial discharge activity. The mechanisms behind the aforementioned results are discussed in detail and confirmed by the broadband dielectric spectroscopy technique, which reveals that this particular nanofluid sample is characterized by lower dielectric constant and electrical conductivity than the one with double the weight percentage ratio.

1. Introduction

One of the major issues that need to be solved in the context of the smart grid of the future is to ensure the transmission and distribution of electricity taking into account the stringent regulations along with environmental protection [1]. At these levels, the continuous operation of the power transformer is an urgent need, while its cost is calculated to be about 60% of the total substation cost [2,3]. Statistics have shown that the major aspects that lead to the limitation of the power transformer lifespan, and ultimately its failure, are based on insulation, which is mainly made of a combination of dielectric liquid and insulating paper impregnated in it [4,5,6,7]. In contrast to the mineral oils used conventionally, natural ester oils (NEO) are characterized by unique and preferable properties from the industry side, such as rapid biodegradability, high moisture tolerance, less flammability and increased lifetime in comparison to mineral oils [8,9,10,11,12]. Apart from that, their higher relative permittivity is also very important, as it can match that of solid insulation in order to limit electric stress in high loading situations [13].
On the other hand, there are serious drawbacks that still limit the widespread use of NEO as dielectric fluid in high-voltage (HV) equipment. Vegetable oils (VO) are characterized by high viscosity, which could lead to greater hotspot temperatures inside the HV equipment [14,15] and increased dielectric dissipation factor, which means augmented dielectric losses [16]. Therefore, for the sake of disregarding these suspensive factors and, in general, enhancing the dielectric and physicochemical characteristics of the NEOs, the focus of research is on the integration of a proper amount of nanoparticles (NPs) inside the NEO volume, with the resulting mixture called nanofluid (NF). NFs have also been used in other sectors [17,18,19], but in liquid insulation they are investigated in order to enhance the dielectric and physicochemical properties of the traditional oils [20,21,22,23,24,25,26,27,28,29,30,31,32]. NPs are classified based on their shape, size, type and electrical properties, namely conductive, semi-conductive and insulative.
With regard to their type, the influence of metal oxide NPs, i.e., TiO2, Al2O3, ZnO, Fe2O3 and Fe3O4, on the dielectric and thermal performance of biodegradable oils has been thoroughly investigated [8,11,12,21,22,23,24,25,26]. Olmo et al. [21] reported that the addition of TiO2 NPs (10–20 nm size) resulted in AC breakdown voltage (AC BDV) enhancement by 33.2% at a volume percentage ratio of 0.5 kg/m3, while in different concentrations the enhancement ranged from 7.6 to 30.4%. Khaled and Beroual [22] found that the addition of conductive Fe3O4 NPs with a diameter of 50 nm in synthetic ester oil (SEO) can lead to an increment in terms of AC BDV up to 48%. The same authors [23] reported that the integration of the same kinds of NPs in NEO can lead to a 7.51% maximum enhancement of negative lightning impulse breakdown voltage (LI BDV) at 0.2 g/L concentration. Du et al. [24] studied transformer mineral oil-based nanofluids containing TiO2 rutile nanoparticles, silicon oil (SO)-treated TiO2 and octadecanoic acid (ODA)-treated TiO2. The nanoparticles used had an average size of less than 20 nm at concentrations ranging from 0.003 to 0.05 g/mL. They discovered that the optimum concentrations for improving AC BDV depended on nanoparticle surface treatment. The most significant improvement was found in octadecanoic acid-treated TiO2 suspensions at a concentration of 0.01 g/mL, which improved by 52.9%. Jin et al. [25] investigated the breakdown voltage features of mineral oil containing dispersed SiO2 NPs in two mass fractions and two humidity ranges. The moisture content of the samples had a substantial impact on the BDV values, according to their findings. In the case of samples with higher humidity, an increase in NP concentration raised BDV by 19% and 27% for NP concentrations of 0.01% and 0.02% w/w, respectively. The BDV augmentation was also detected in materials with a reduced humidity level, but the effect of the NPs was 12 times lower. Saenkhumwong et al. [26] used ZnO nanoparticles of diameter less than 100 nm in two NEOs and CTAB as the surfactant to increase the insulating characteristics. For both types of natural oils, they created five samples with concentrations ranging from 0.01–0.20 g/L. They reported that both types of nanofluids were characterized by increasing BDV values as the concentration of nanoparticles increased. The largest improvements were 47% and 38% for 0.15 g/L (soybean ester) and 0.20 g/L (palm ester), respectively.
Furthermore, another study proved that a small amount (0.001% vol.) of magnetic NPs can lead to significant partial discharge (PD) activity delay [27]. From the aspect of physicochemical properties, Jacob et al. [28] reported a 14.6% thermal conductivity increment after the addition of Al2O3 NPs into the matrix. Moreover, Fontes et al. [15] noticed a 25% increase in viscosity upon adding diamond NPs, while Ilyas et al. [29] concluded that the dynamic viscosity of alumina NFs decreases with the rise in temperature.
In terms of the mechanisms activated by the suspended NPs under the influence of an external electric field, a variety of models have been proposed [30,31,32,33]. Most of them consider the charged NPs as electron traps caused by the higher permittivity or conductivity of the colloidal suspensions with respect to the base liquid [31]. Consequently, it has been proposed that conductive NPs are more efficient; however, recent studies have demonstrated that semi-conductive or even dielectric NPs can indeed influence the streamer propagation significantly [11,34,35].
Contrary to the number of published research articles on the influence of metal oxide NPs on the aforementioned properties, the effect of metal carbide ones has not been extensively addressed, although it is well known that they are identified by great resistance to oxidation. Consequently, in this study, the influence of commercially obtained SiC NPs on the AC BDV and partial discharge inception voltage (PDIV) of NEO FR3TM is examined. The NPs are integrated in three weight percentage ratios, namely 0.002%, 0.004% and 0.008% w/w. These concentration levels span a capable range to allow exploring the concentration in the context of optimum AC dielectric strength of the NF. Before the production of uniform colloidal suspensions, the real and imaginary parts of relative permittivity of the NPs have been measured in accordance with the broadband dielectric spectroscopy (BDS) technique. Furthermore, AC BDV and PDIV of the NF samples are measured, processed and compared to the respective ones of the pure base oil. The processing of the results proves that the maximum AC BDV and PDIV enhancement relative to the corresponding ones of the matrix is obtained for the NF filled with 0.004% w/w SiC NPs by 37.3% and 55.5%, respectively. The theory of electron trapping is utilized analytically in order to explain the BDV improvement, and the results of the BDS technique for the NF samples are adopted to prove that at the highest concentration the dielectric strength is reduced due to an increase in the dielectric constant of the corresponding NF probably because of the existence of quickly generated agglomerates.

2. Materials and Methods

This section includes the procedure followed for the dielectric measurements of the under-study NPs and base oil, as well as the synthesis of NFs along with the conduction of experiments of dielectric properties for the NF and matrix samples.

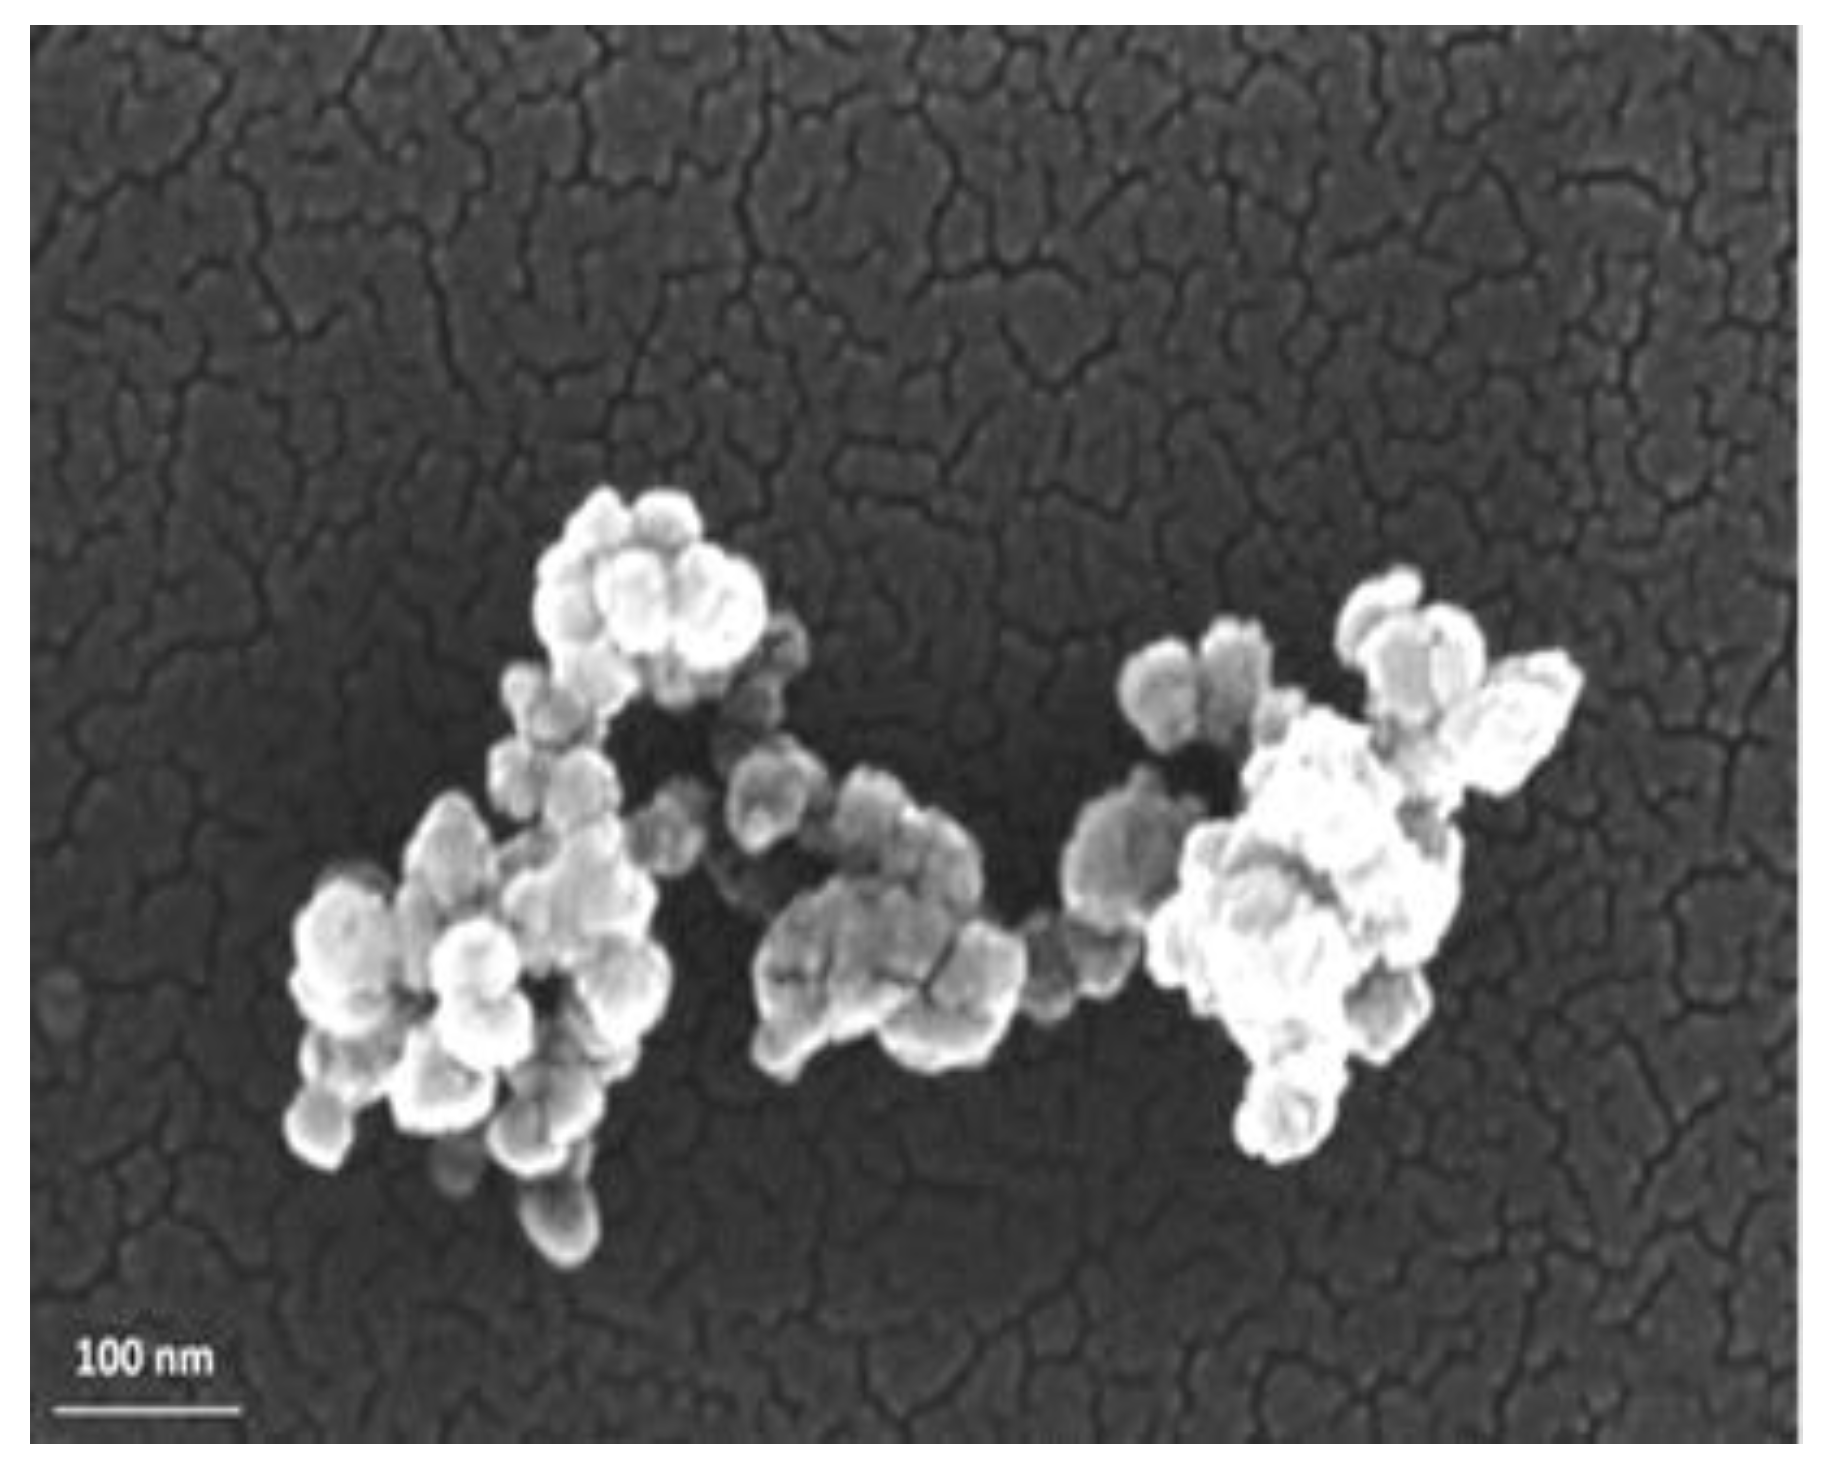
2.1. Characterization of the Used Chemicals

NEO FR3TM, obtained by Cargill (Wilmington, DE, USA), is picked as the base liquid. It is readily biodegradable and defined by a density of 0.92 g/mL at 25 °C and good flame resistance as its fire point is greater than 300 °C. The SiC NPs were acquired by NanoAmor in the form of nanopowder with an average nominal diameter in the range of 50 nm and a thermal conductivity of approximately 350 W∙m−1/°C at 25 °C. The nominal size of the NPs was ascertained by employing the field emission scanning electron microscopy (FE-SEM) (Zeiss SUPRA 35VP, Oberkochen, Germany) technique, where the NPs were drop-casted by ethanol dispersion onto Si substrates. The FE-SEM depiction of the SiC powder is illustrated in Figure 1, where it is revealed that they indeed have a nominal size.
Concerning the measurements of the relative permittivity εr and electrical conductivity σ for the above chemicals, the BDS technique is exploited [36]. Each sample is put in a cylindrical capacitor. Then, the liquid sample cell is mounted into the standard Novocontrol sample cell (16 mm diameter) and an AC voltage of 1 V rms is applied for the calculation of relative permittivity εr in complex form as indicated by Equation (1), from a Novocontrol Alpha analyzer (Novocontrol Technologies GmbH & Co., Frankfurt, Germany) for a frequency range of 0.1 Hz to 1 MHz:
ε r = ε r j ε r  
where εr is the real part of relative permittivity expressing the dielectric constant and εr is the imaginary part, which expresses the dielectric losses contributed by the leakage current and dielectric polarization.
On account of the electrical conductivity, it is calculated from the imaginary part of relative permittivity from Equation (2):
σ = ω · ε 0 · ε r  
where ω is the angular frequency in rad/s and ε0 is the permittivity of vacuum in F/m.
The real and imaginary parts of relative permittivity as a function of frequency for the matrix and NPs are presented in Figure 2 and Figure 3, respectively. Figure 4 depicts the electrical conductivity of base oil and the SiC NPs accordingly. For the measurement of the dielectric dissipation factor at 90 °C, the samples are evidenced isothermally, with the temperature controlled by a Quatro system within ±0.2 °C.

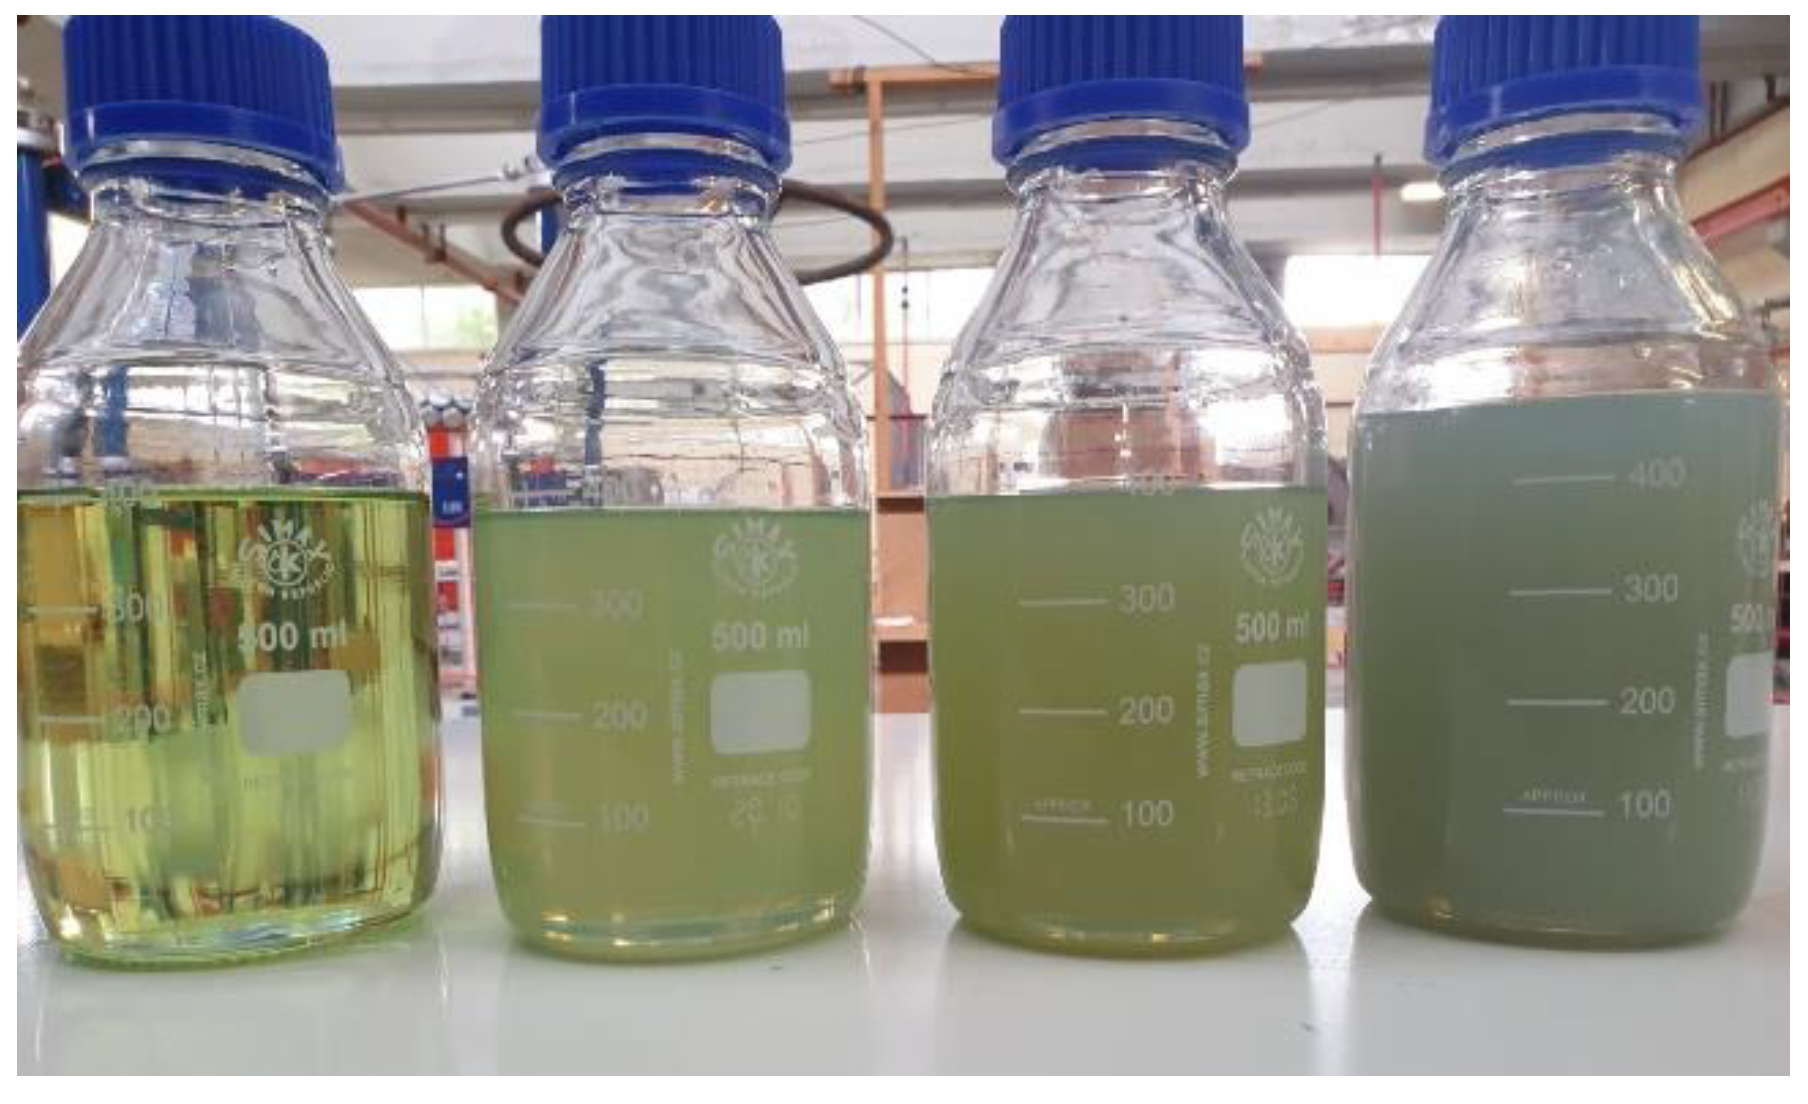
2.2. Preparation and Synthesis of Nanofluid Samples

A 450 mL volume of NEO is decided to be the base for the synthesis of the three NF samples. In order to eliminate the negative effects of impurities and moisture on BDV, each sample is filtered and dried in a hot air oven at 120 °C for 24 h. The Karl–Fischer titration method is used to confirm that the remaining moisture is within the recommended limits [37,38]. The moisture level is measured with Mitsubishi Chemicals Co. (Tokyo, Japan) CA-100 moisture meter (Tokyo, Japan), and it is confirmed by Metrohm KF Coulometer 831 that it is below 200 ppm according to the ASTM D1533-00 standard [39]. Afterwards, appropriate amounts of SiC powder are immersed in the base to obtain the desired 0.002%, 0.004% and 0.008% w/w concentrations, respectively. The identification of the samples in question is exhibited in Table 1.
Due to the high surface areas of NPs per unit volume, the colloidal suspensions inside the host liquid tend to agglomerate shortly after their addition, under the influence of van der Waals interaction forces forming clusters [11,12,18,37,38,40]. Hence, in order to ensure the distribution of uniform colloidal suspensions, the three NF samples are subjected to ultrasonication for 1.5 h in total at the ultrasonic cleaner Elmasonic S 40 H (Frankfurt, Germany) purchased by Elma (Frankfurt, Germany). Specifically, the water inside the ultrasonic bath is replaced every 30 min to prevent the samples from overheating. This cycle is repeated two times for each sample to establish a uniform dispersion of the colloidal suspensions, as indicated in Figure 5, where the samples are depicted shortly after their homogeneous synthesis. In the same figure, a base oil sample is also presented as long as it is stressed under the same experiments for the sake of comparison. The color difference between the matrix and the NF samples is obvious, as well as the color difference among the NF samples as we proceed from the NF with the lowest to the one with the highest NP weight percentage ratio.

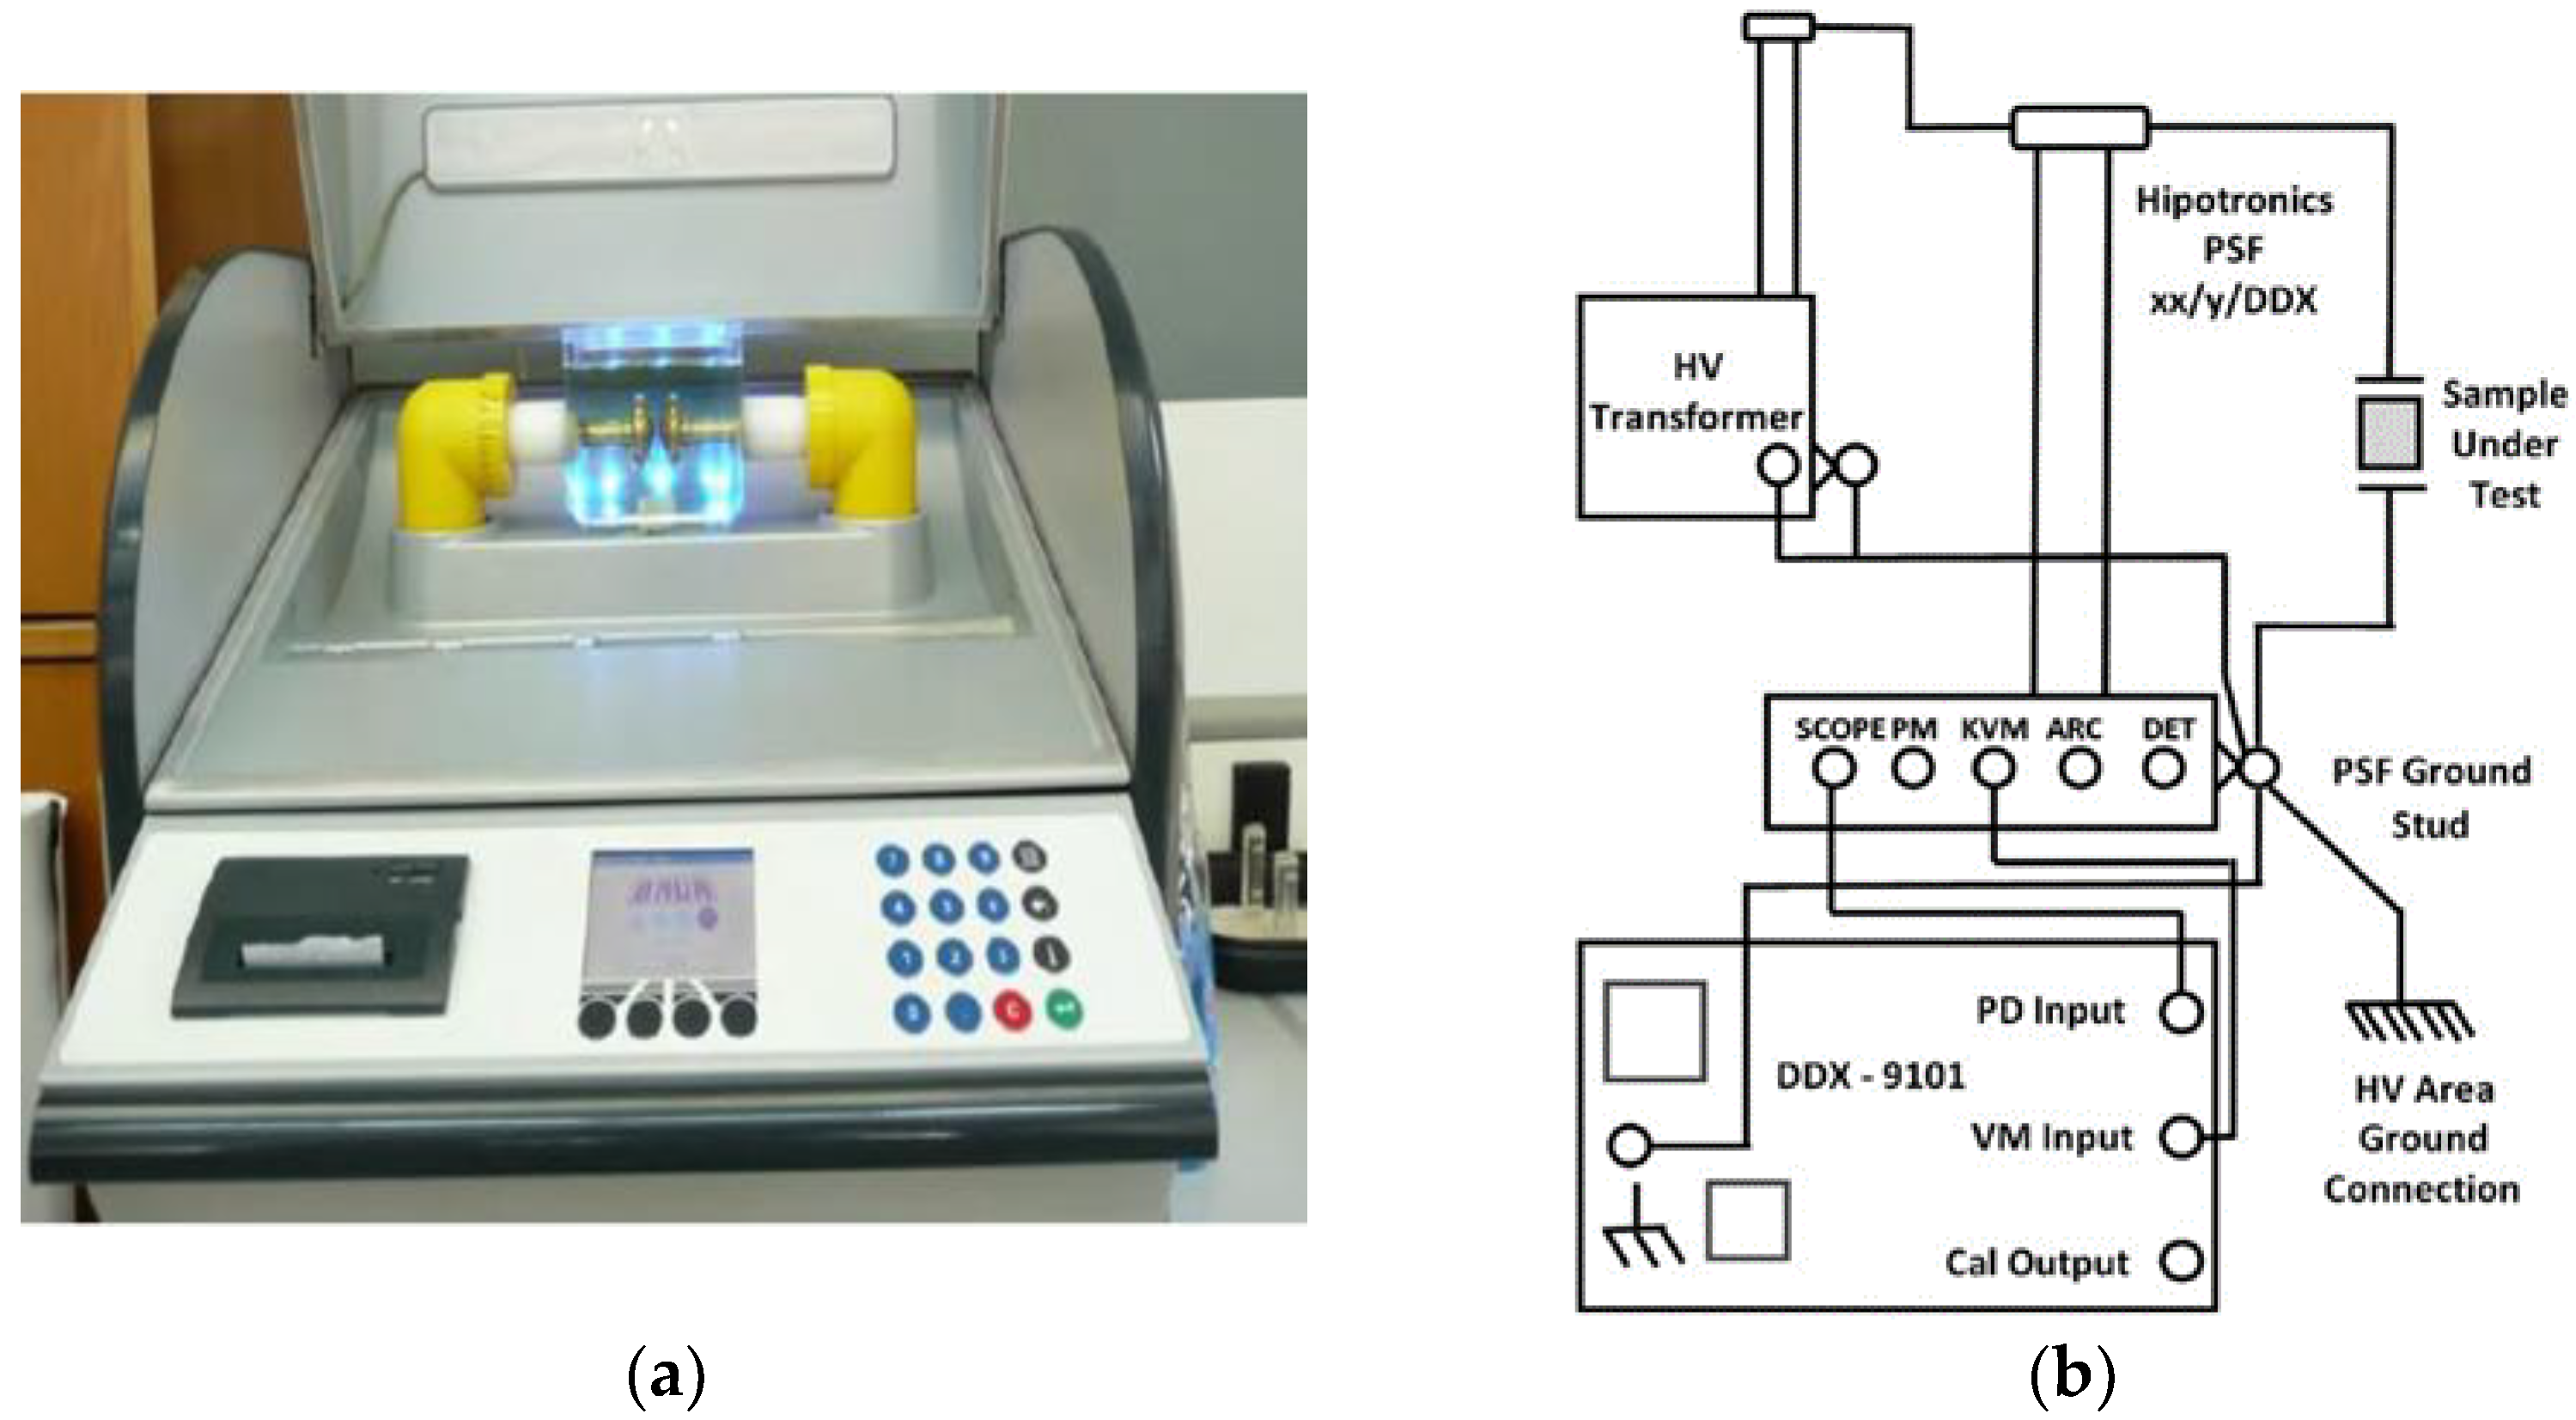
2.3. Experimental Procedure

The freshly produced NF samples, along with a base oil sample, are stressed under AC voltage in order for their AC BDV to be determined. The AC BDV experiment is the most important destructive dielectric test, as it measures the ability of the dielectric liquid to withstand AC electric stress, considering that the power transformer regularly operates under AC voltage. It is well known that the particle concentration inside the base may differ significantly over time owing to the colloids’ aggregation and finally sedimentation effects [11,41]. For this reason, the experiments take place shortly (within the first 48 h) after the preparation of the samples in order to eliminate the influence of NPs’ agglomeration over time on our results.
For the conduction of the AC BDV measurements, each one of the four samples is stressed under increasing AC voltage using a Baur DTA 100 C generator (Figure 6a) in consonance with the IEC 60156 standard. A transformer increases the voltage level up to 100 kV with a rate of 2 kV/s, until breakdown occurs between two Rogowski electrodes of 13 mm diameter, with their gap fixed at 2.5 mm. In total, 36 breakdown events are collected for each sample and their mean AC BDV, and consequently their dielectric strength, is estimated. As long as the BDV is a random variable, the results are also fit to the Weibull distribution to assess their BDV in significant probability levels for the reliability of the insulation and, by extension, the power transformer [11,22,35,42].
Furthermore, the efficiency of the combination of oil-paper insulation is evaluated with the non-destructive PD test. Beyond that, defining the PD activity in dielectric fluids is very important to retain suitable kinds of NPs inside the liquid insulation to suppress the PD activity and therefore delay the aging process of the oil [43,44]. The paper impregnation lasted about 5 min and took place at a temperature range of 20–25 °C, a humidity of about 10 g/m3 and atmospheric pressure approximately equal to 758 mm Hg. Regarding the conduction of the experiment, a High Voltage test transformer (HIGH VOLT GmbH Transformer PEOI 40/100 100kV) is used, with a TETTEX Instruments PD Detector DDX-9101 PD detector measuring the apparent charge to a HIPOTRONICS capacitor PSF 100-1 nominal capacitor (Figure 6b). The test cell consists of two plate electrodes with the gap between them set at 0.75 mm. Nomex® DupontTM insulating paper of 0.75 mm thickness impregnated with the base and NF samples is placed in the gap and stressed under AC voltage with an increasing rate of 0.1 kV/s. As for PDIV, it is regarded as the level of voltage that is characterized by an apparent charge accumulation greater than the threshold value of 10 pC [11,40,41]. Each experiment is repeated four times to increase the reliability of the obtained results and the mean value is considered for the performance analysis.

3. Results

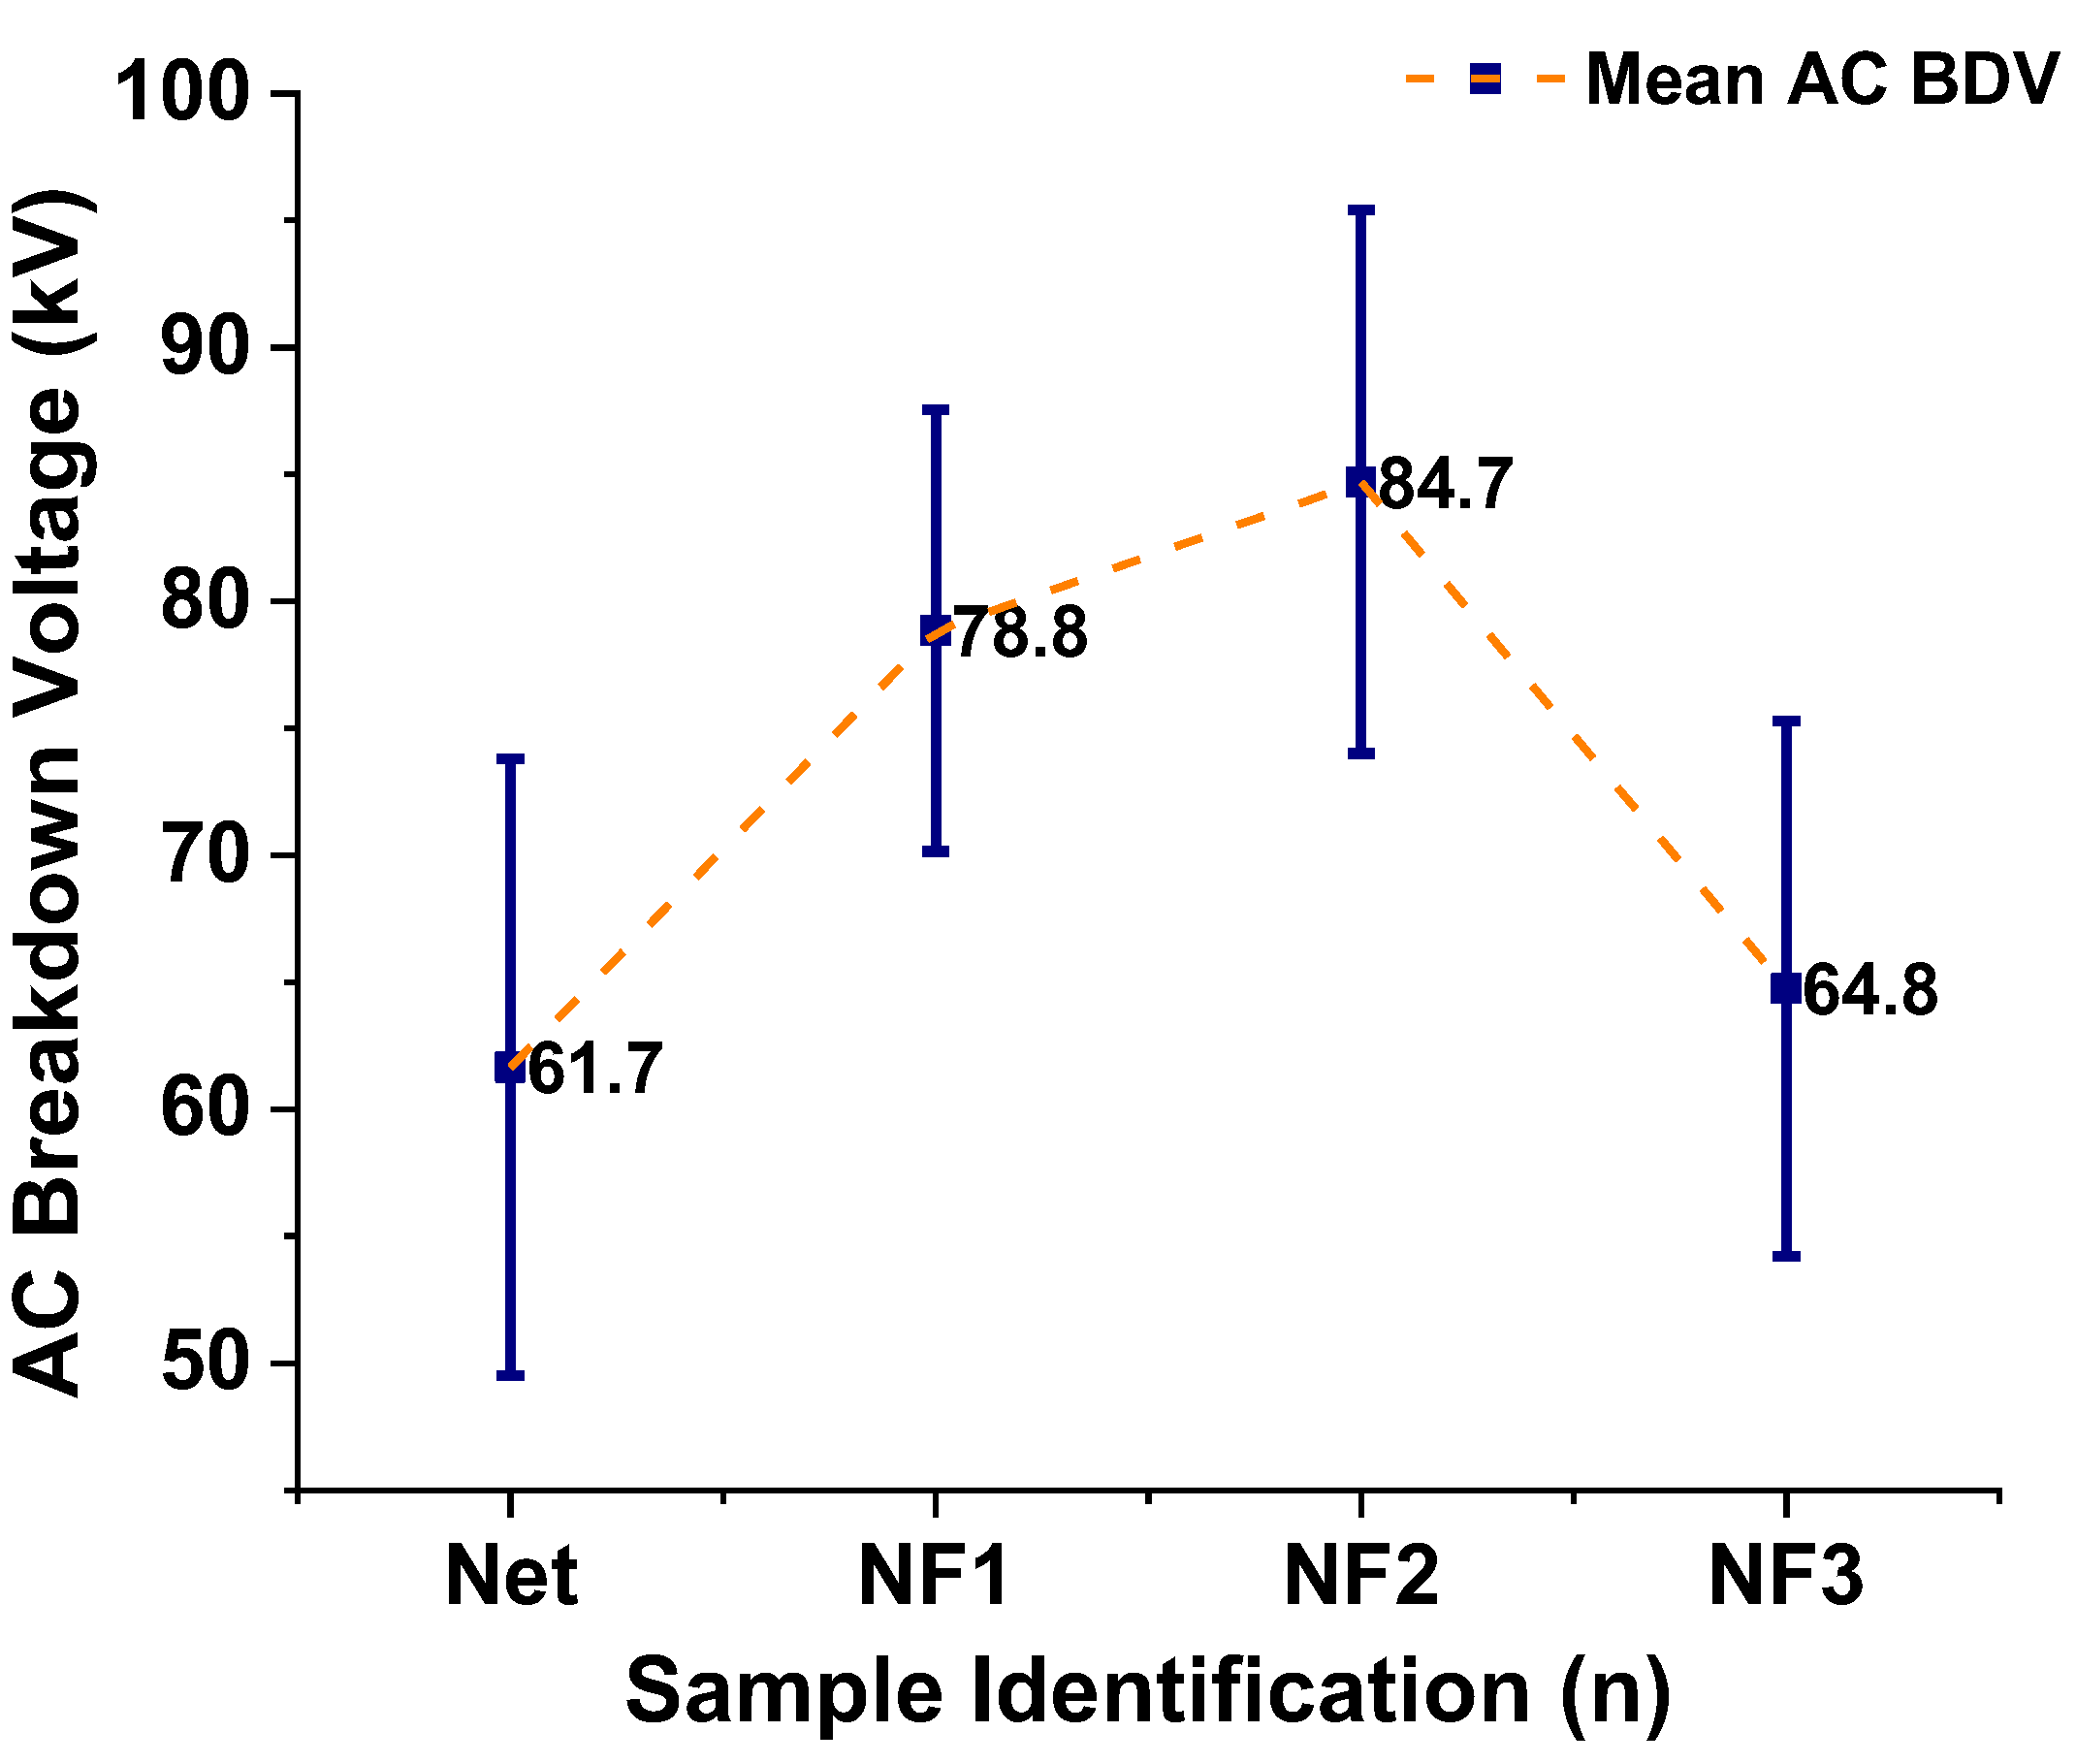
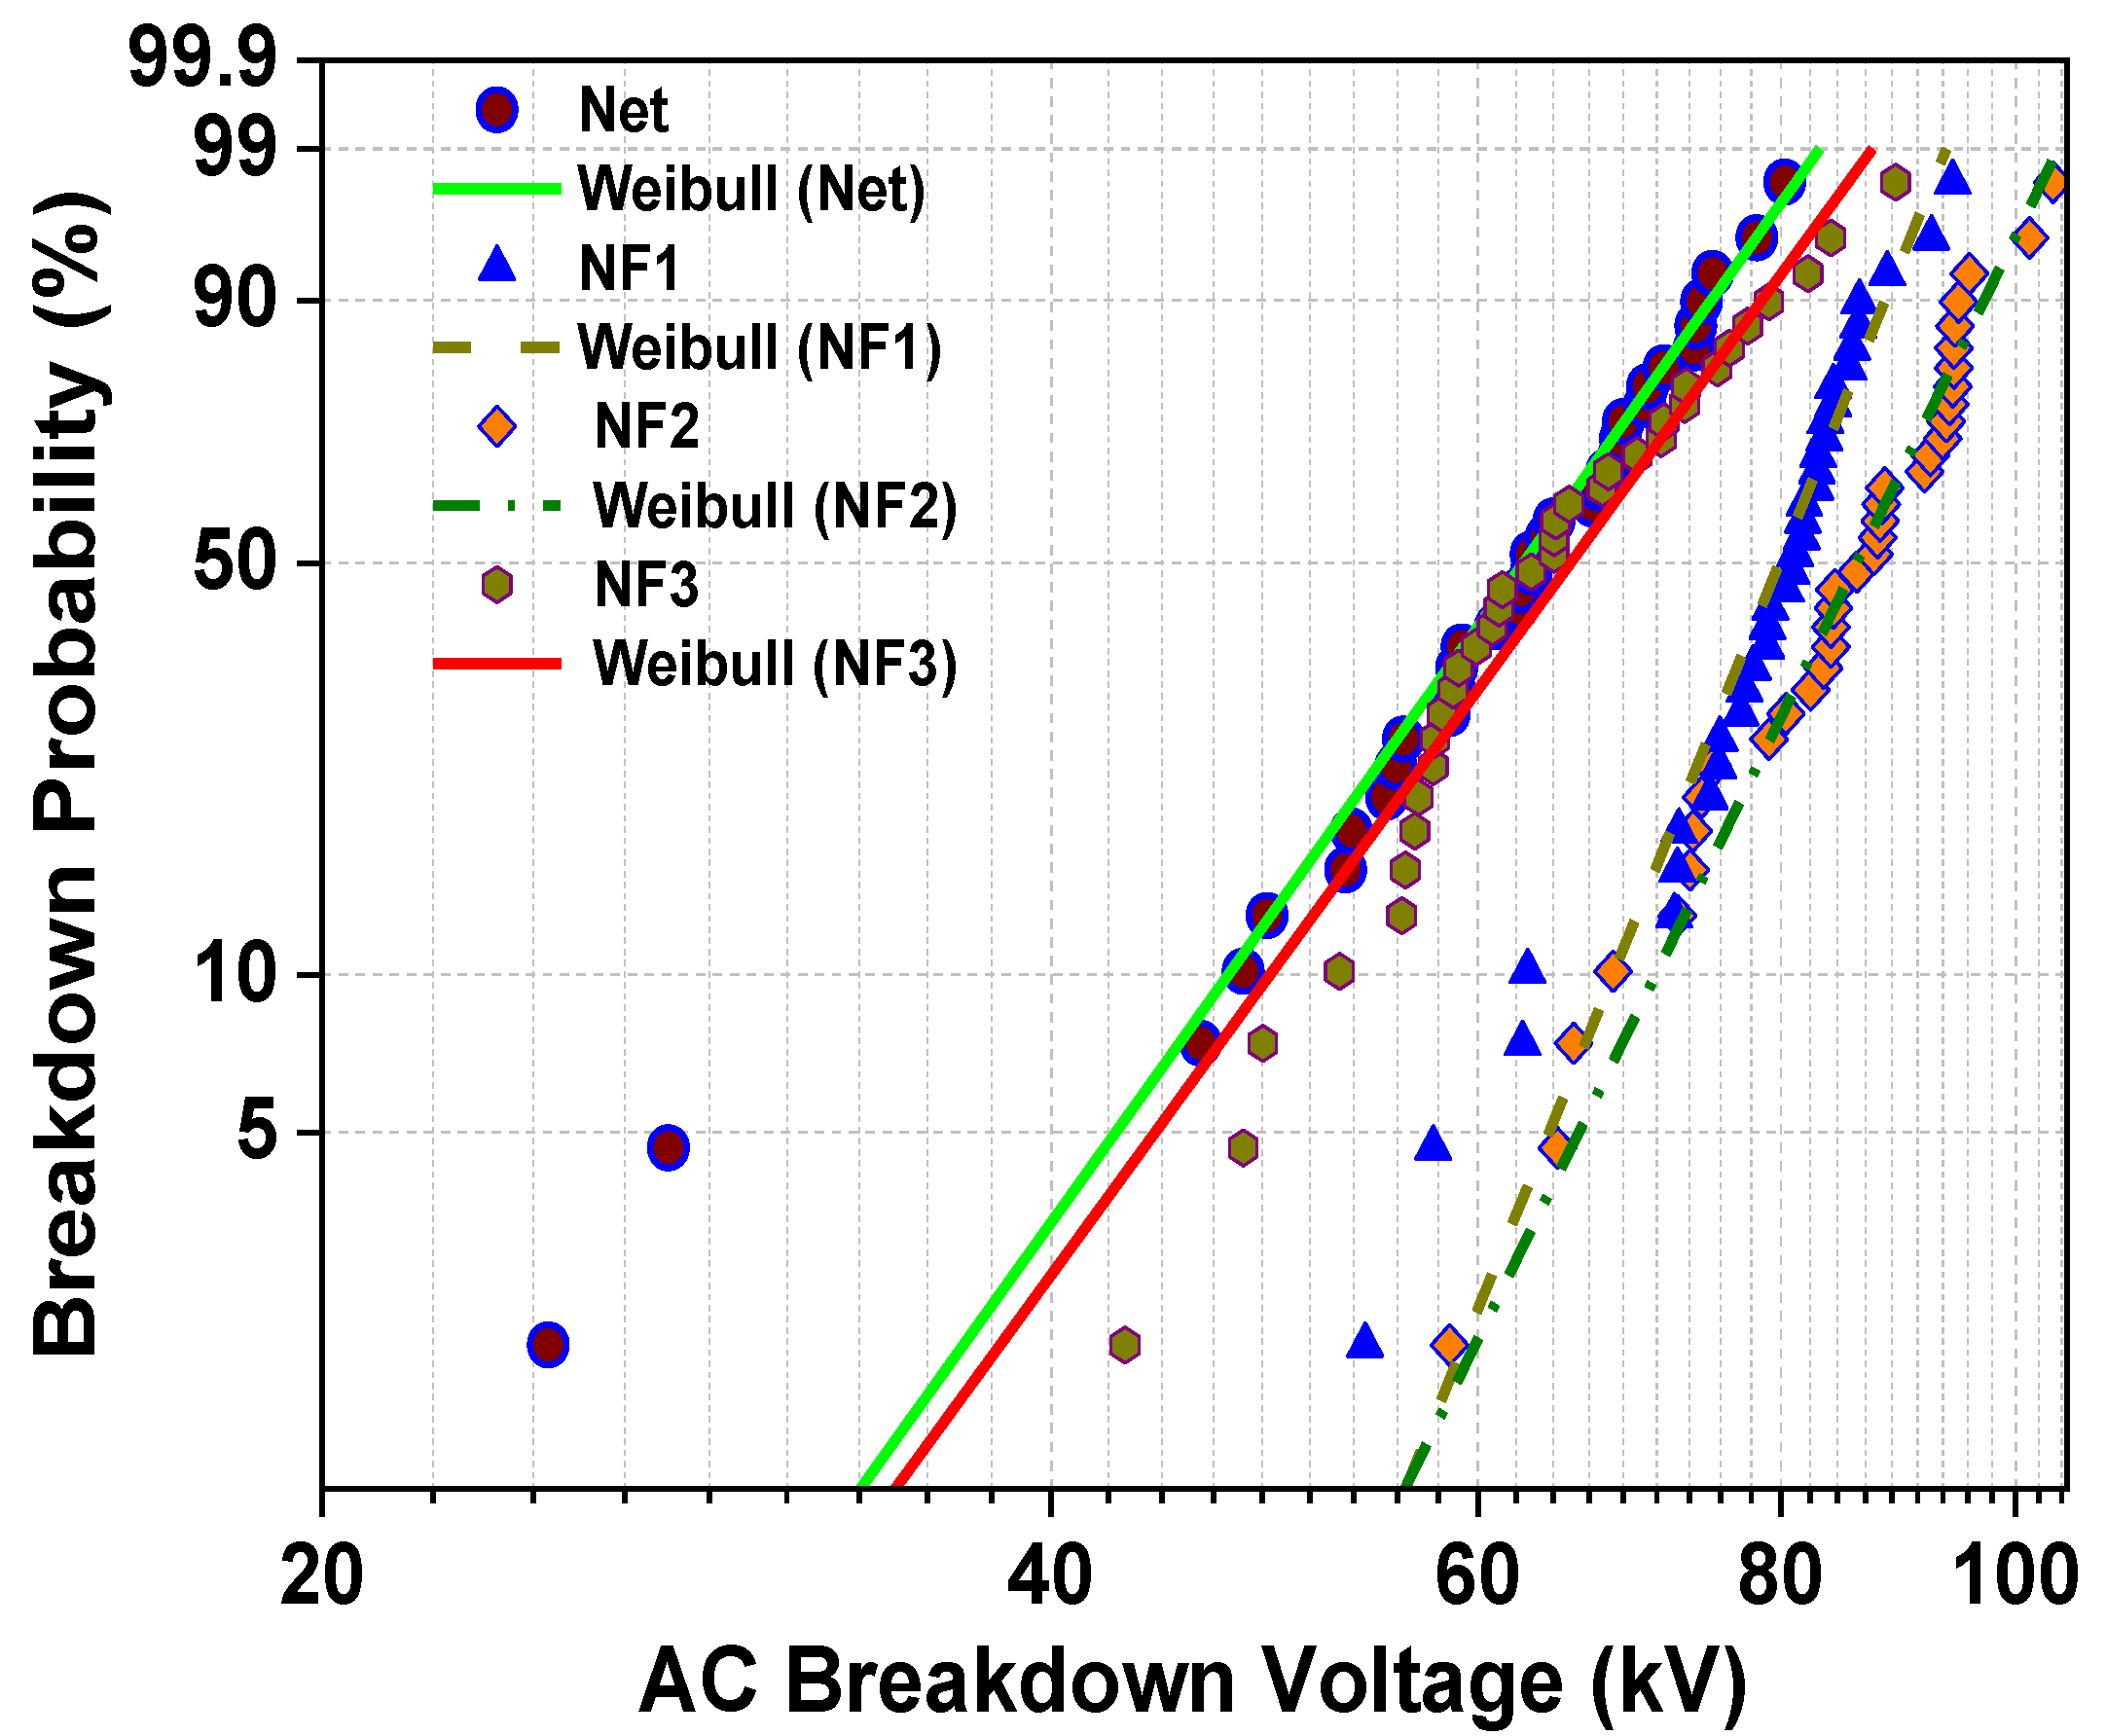
3.1. AC Breakdown Voltage

Based on the collected 36 BD events for each sample stressed under AC voltage, the mean value of them (mean AC BDV) and the standard deviation of the results are calculated and presented in Table 2 and graphically in Figure 7. It is obvious that the dielectric strength increases with an increase in the NP loading until the 0.004% w/w level (NF2 sample), where the highest improvement with respect to the NEO is noticed, by 37.3%. From this point, doubling the NP concentration (NF3 sample) results in a rapid decrease in the BD performance, which becomes similar to the base oil sample’s performance.
In order for the failure probabilities in specific important levels to be estimated, the Anderson–Darling goodness-of-fit test is performed to check if the data follow the Weibull distribution. The Weibull distribution is a popular statistical law to adjust the experimental AC BDV results because it does not make assumptions on skewness and kurtosis [22,35]. The cumulative distribution function (CDF) of the Weibull distribution is expressed by Equation (3):
F ( x ) = 1 e ( x λ ) k  
where x is the AC BDV, λ is the scale parameter and k is the shape parameter. The p-value, utilizing the Anderson–Darling test, is calculated as follows: Firstly, the Anderson–Darling (AD) statistic is calculated from Equation (4):
A D = n 1 n i = 1 n ( 2 i 1 ) [ l n F ( x i ) + ln ( 1 F ( X n i + 1 ) ) ]
where n is the number of measurements, F(x) is the CDF of the Weibull distribution and i is the ith measurement, calculated when the data are sorted in ascending order. After calculating the AD statistic, the p-value can be estimated from (5), depending on the AD value.
p value = { exp ( 1.2937 5.709 ( A D ) + 0.0186 ) ( A D ) 2 ) ,   A D 0.60 exp ( 0.9177 4.279 ( A D ) 1.38 ( A D ) 2 ) ,   0.34 < A D < 0.60 1 exp ( 8.318 + 42.796 ( A D ) 59.938 ( A D ) 2 ) ,   0.20 < A D < 0.34 1 exp ( 13.436 + 101.14 ( A D ) 223.73 ( A D ) 2 ) ,   A D 0.20
According to statistics, if the p-value is higher than the significance level, there is not enough evidence to reject the hypothesis that the data follow a distribution. For this reason, a significance level α is picked (α = 0.05), and from the Anderson–Darling test, the p-value for the Weibull distribution is calculated in terms of the obtained results of all the samples and compared to the significance level (Table 3). As is apparent from Table 3, the p-value is higher than the significance level for all occasions, and consequently the whole data obey the Weibull distribution. In Figure 8, the probability density plot is depicted, where it is shown how the breakdown events are fit to the corresponding Weibull line. To produce this plot, the scale and shape parameters are necessary and are also presented in Table 1. The slope of the linear fit characteristic is revealed by the shape value, whereas the scale value indicates the BDV with a failure probability of 63.2% and in units of kV.
From this plot, the BDV at failure probabilities of 1%, 10% and 50% are calculated and presented in Table 4. The choice of these levels corresponds to their importance for the operation of the HV equipment. U50% is an indication of the expected BDV, U10% provides an indication of the lowest possible BDV, and therefore provides information on the reliability of the insulation [11,12,22,34,35,37,38], while U1% corresponds to the limit of voltage for safety and continuous operation of the transformer [11,22], a critical parameter for the insulation coordination of power systems under lightning and surge events [45,46].
From the processing described above, it is clear that the addition of SiC NPs in weight percentage ratio until a concentration level of 0.004% can lead not only to the expected AC BDV augmentation but also to an improvement of U10% and U1% with a maximum increase of 50.1% and 65.2%, respectively, a fact that could ensure more reliable operation of the power transformer due to the delay of the streamer initiation and transition to faster modes [22,34,35,47].

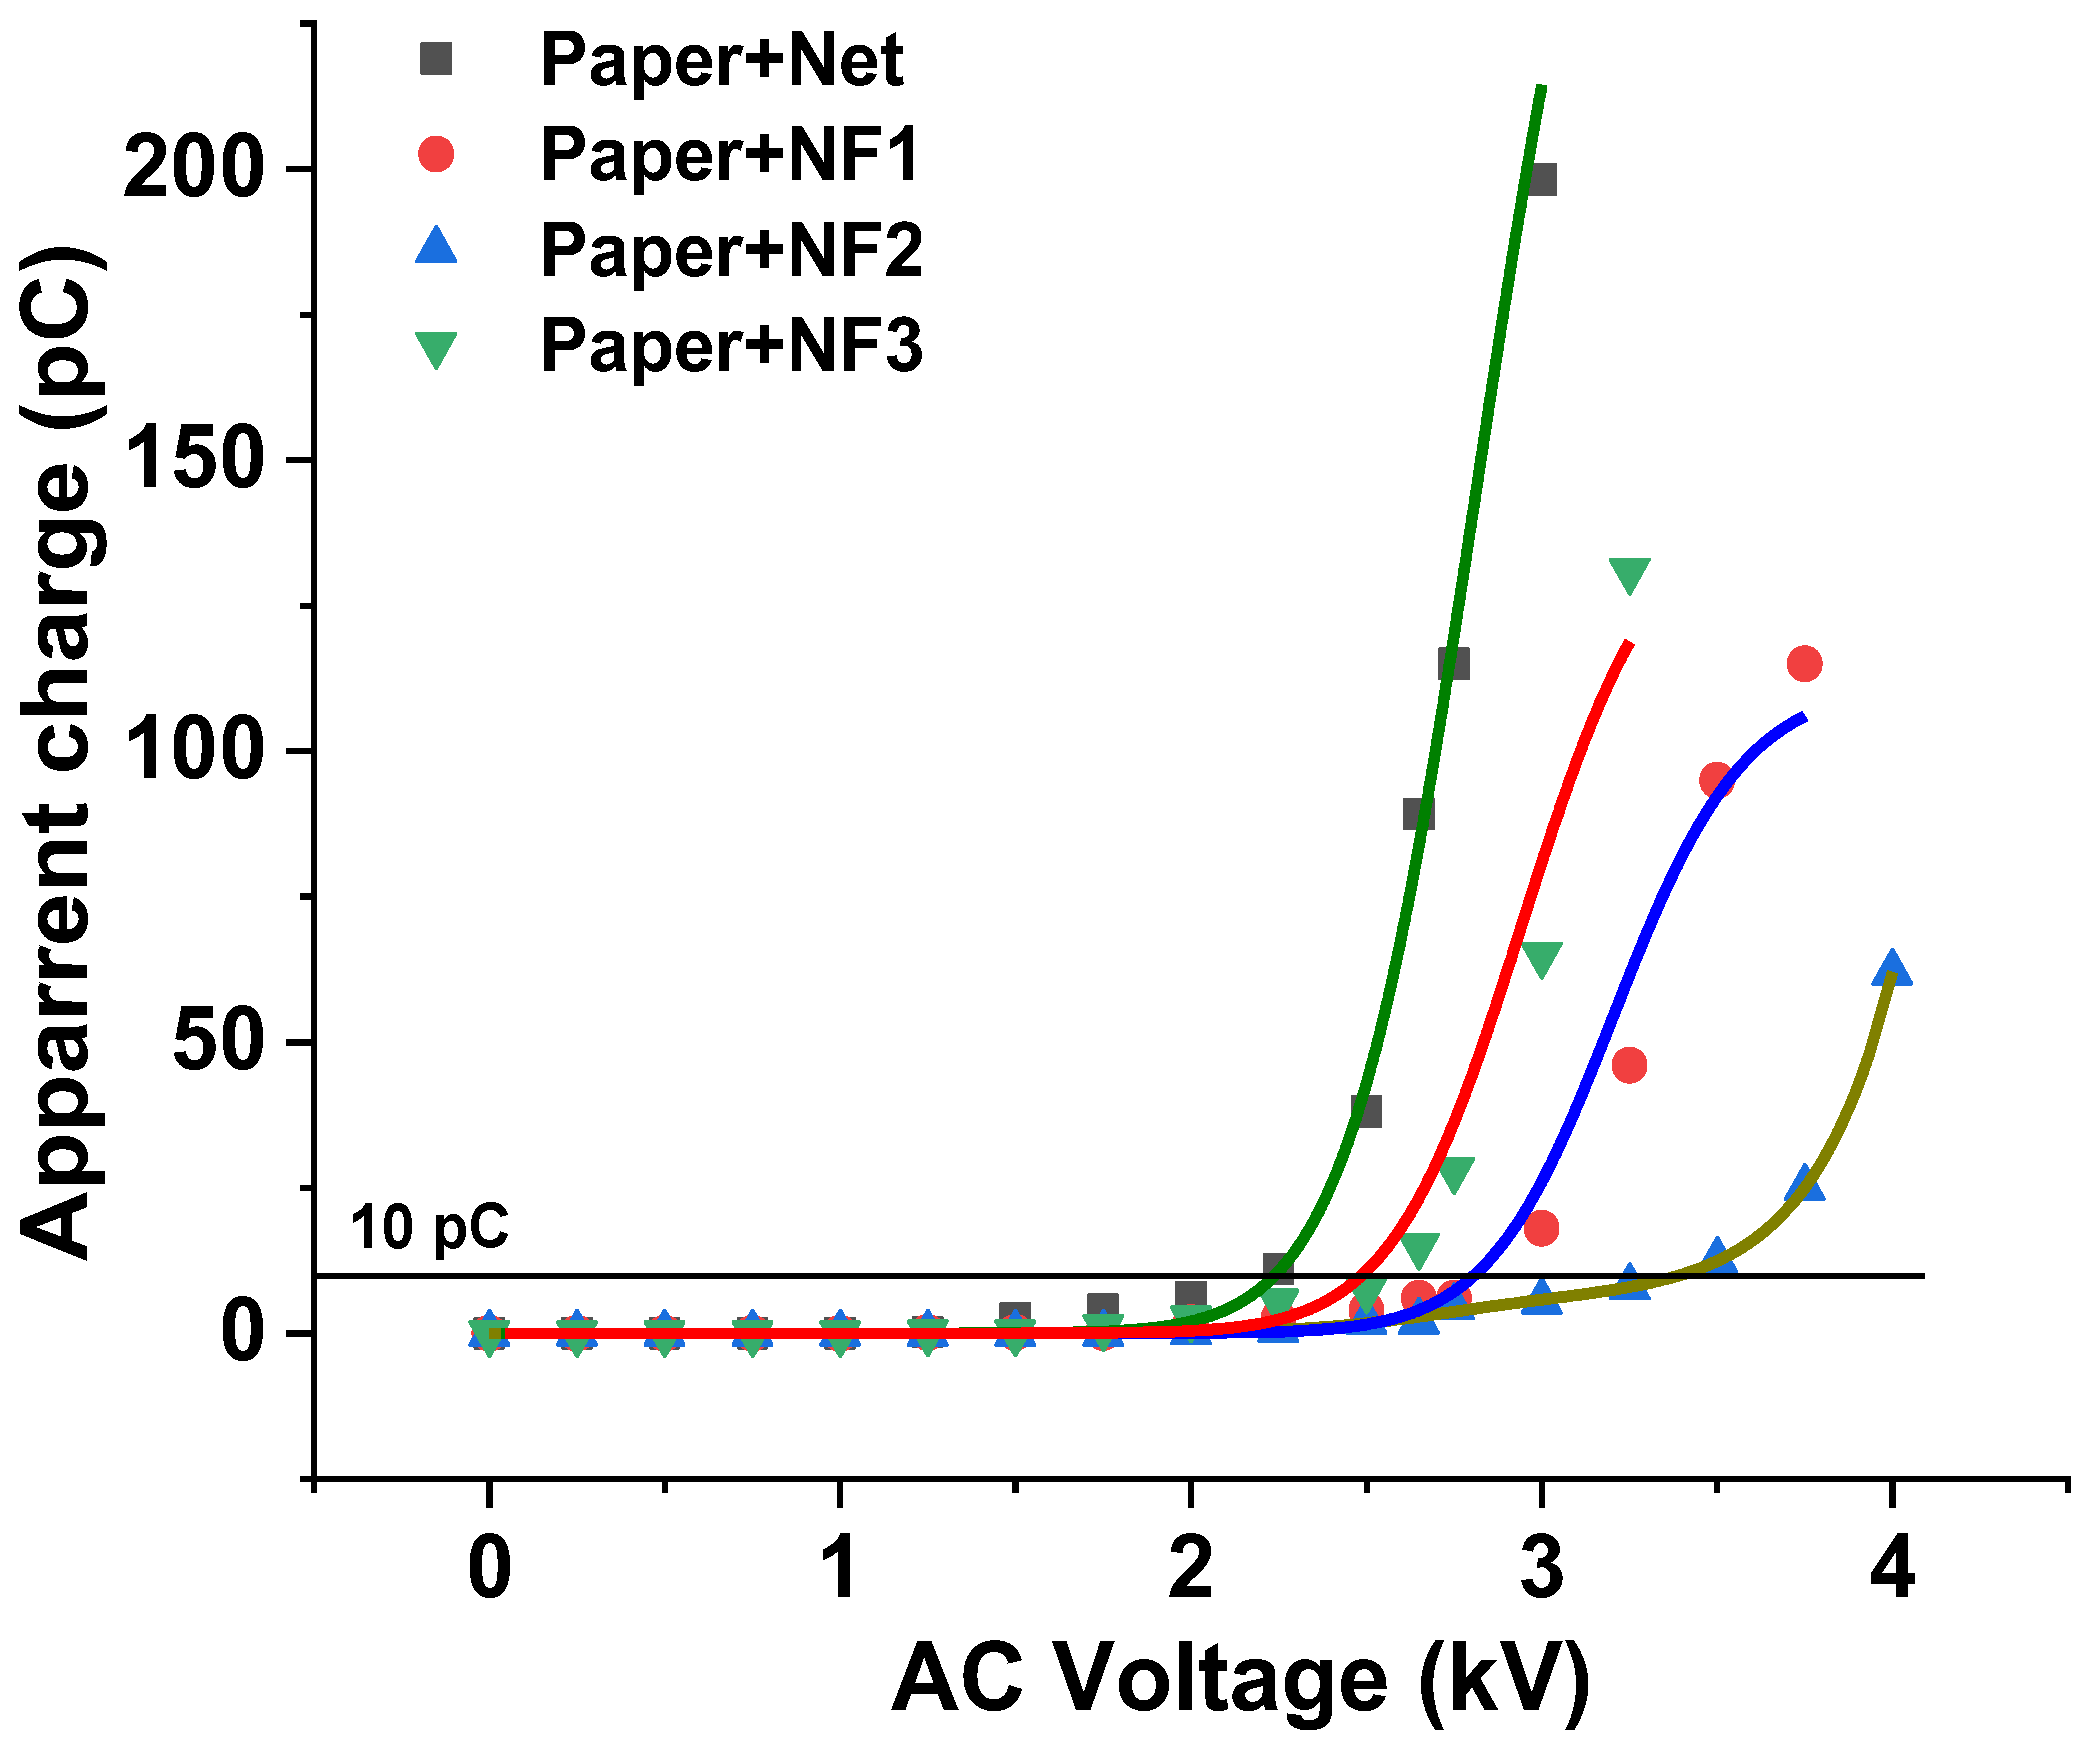
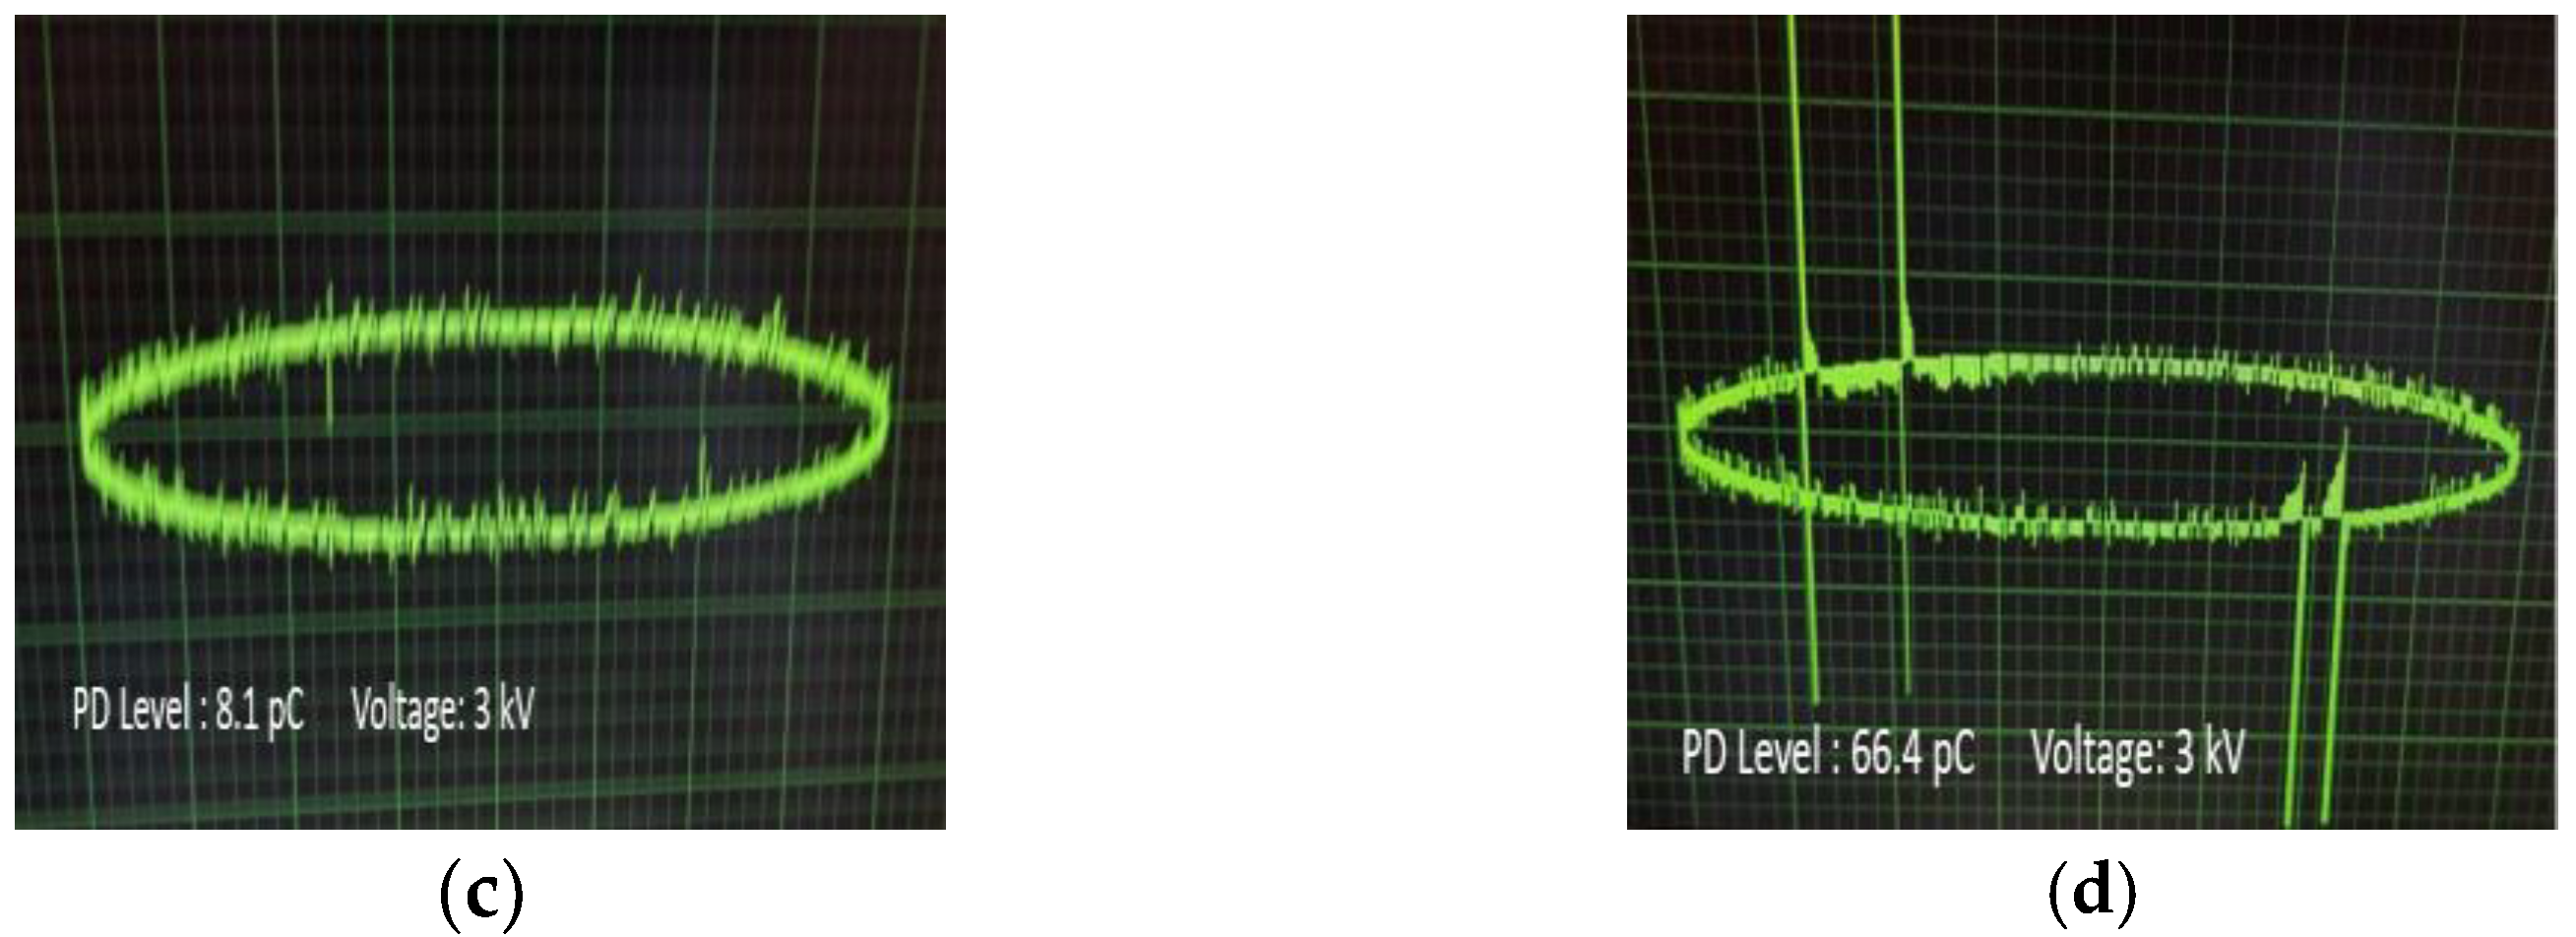
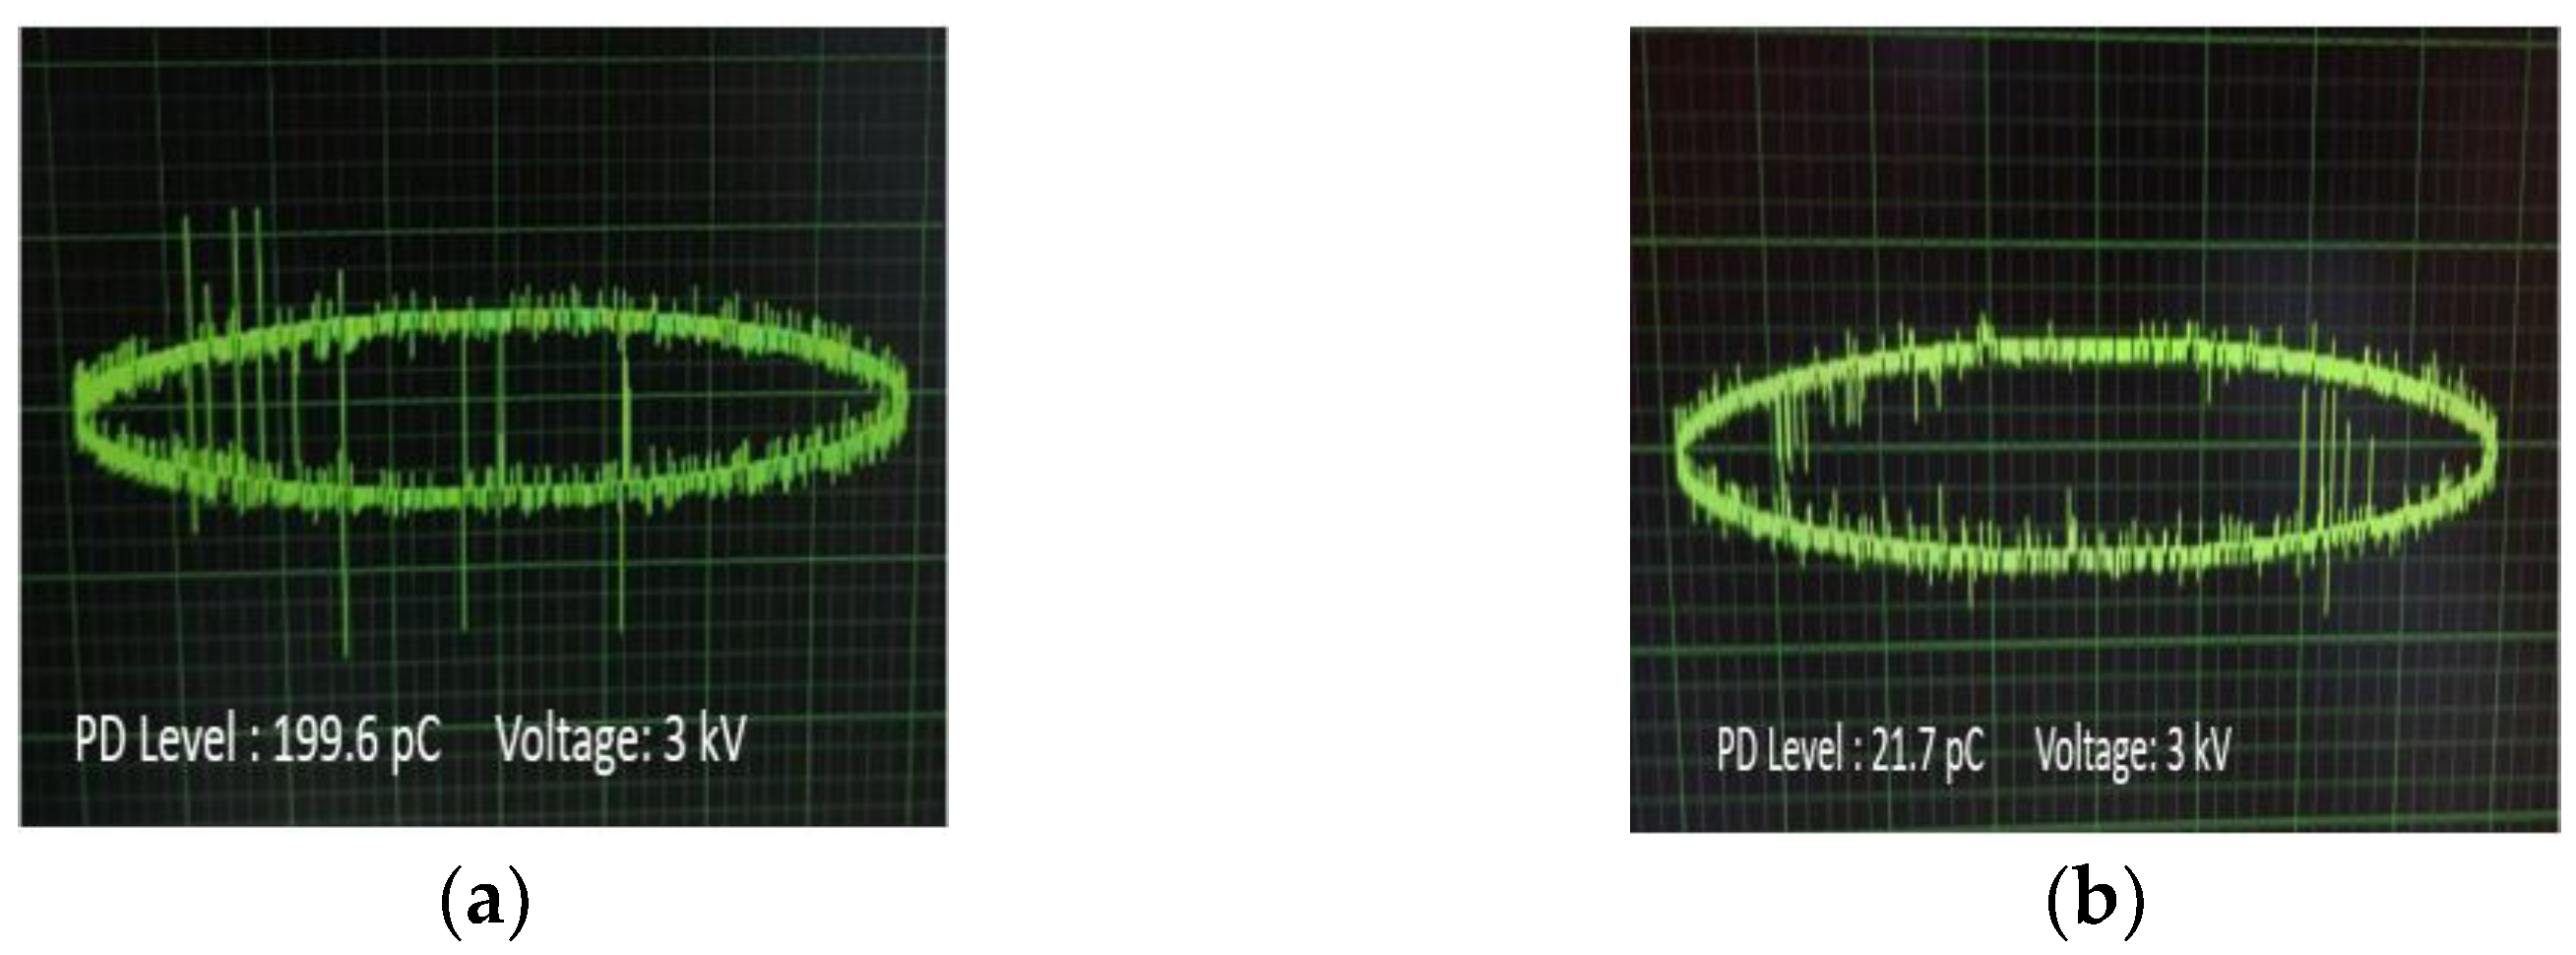
3.2. Partial Discharge Test

The change in the accumulated apparent charge versus the applied AC voltage for the insulating paper impregnated with the under-study samples is demonstrated in Figure 9 for an AC voltage rate, showing that the apparent charge accumulation does not exceed the value of 200 pC. Each symbol corresponds to the value of the apparent charge at a specific voltage level, which is the mean value of the four -times repeated experiment at the same voltage level. The threshold value of 10 pC, where the PDIV is considered, is also indicated in the same figure. By means of this depiction, the PDIV of the paper impregnated with NF2 shows an enhancement of 55.5% with respect to the paper impregnated with the Net sample. Furthermore, as observed with the AC BDV experiment, the resistance to the appearance of PD of the combination of Nomex® DupontTM insulating paper and the NF3 sample is similar to that of the paper impregnated with the matrix.
In Figure 10a–d, the PD levels in the form of pulses are demonstrated for each occasion at the same level of AC voltage (3 kV) versus the phase of the applied AC voltage, where it is obvious that the peak charge in the impregnated papers to Net and NF3 is higher than the corresponding ones of impregnated papers to NF1 and NF2. The multiple pulses of irregular form, as are obvious for the Net and NF3 impregnated insulating paper, indicate the presence of voids in their vicinity, which could be an indication of a faster aging process.

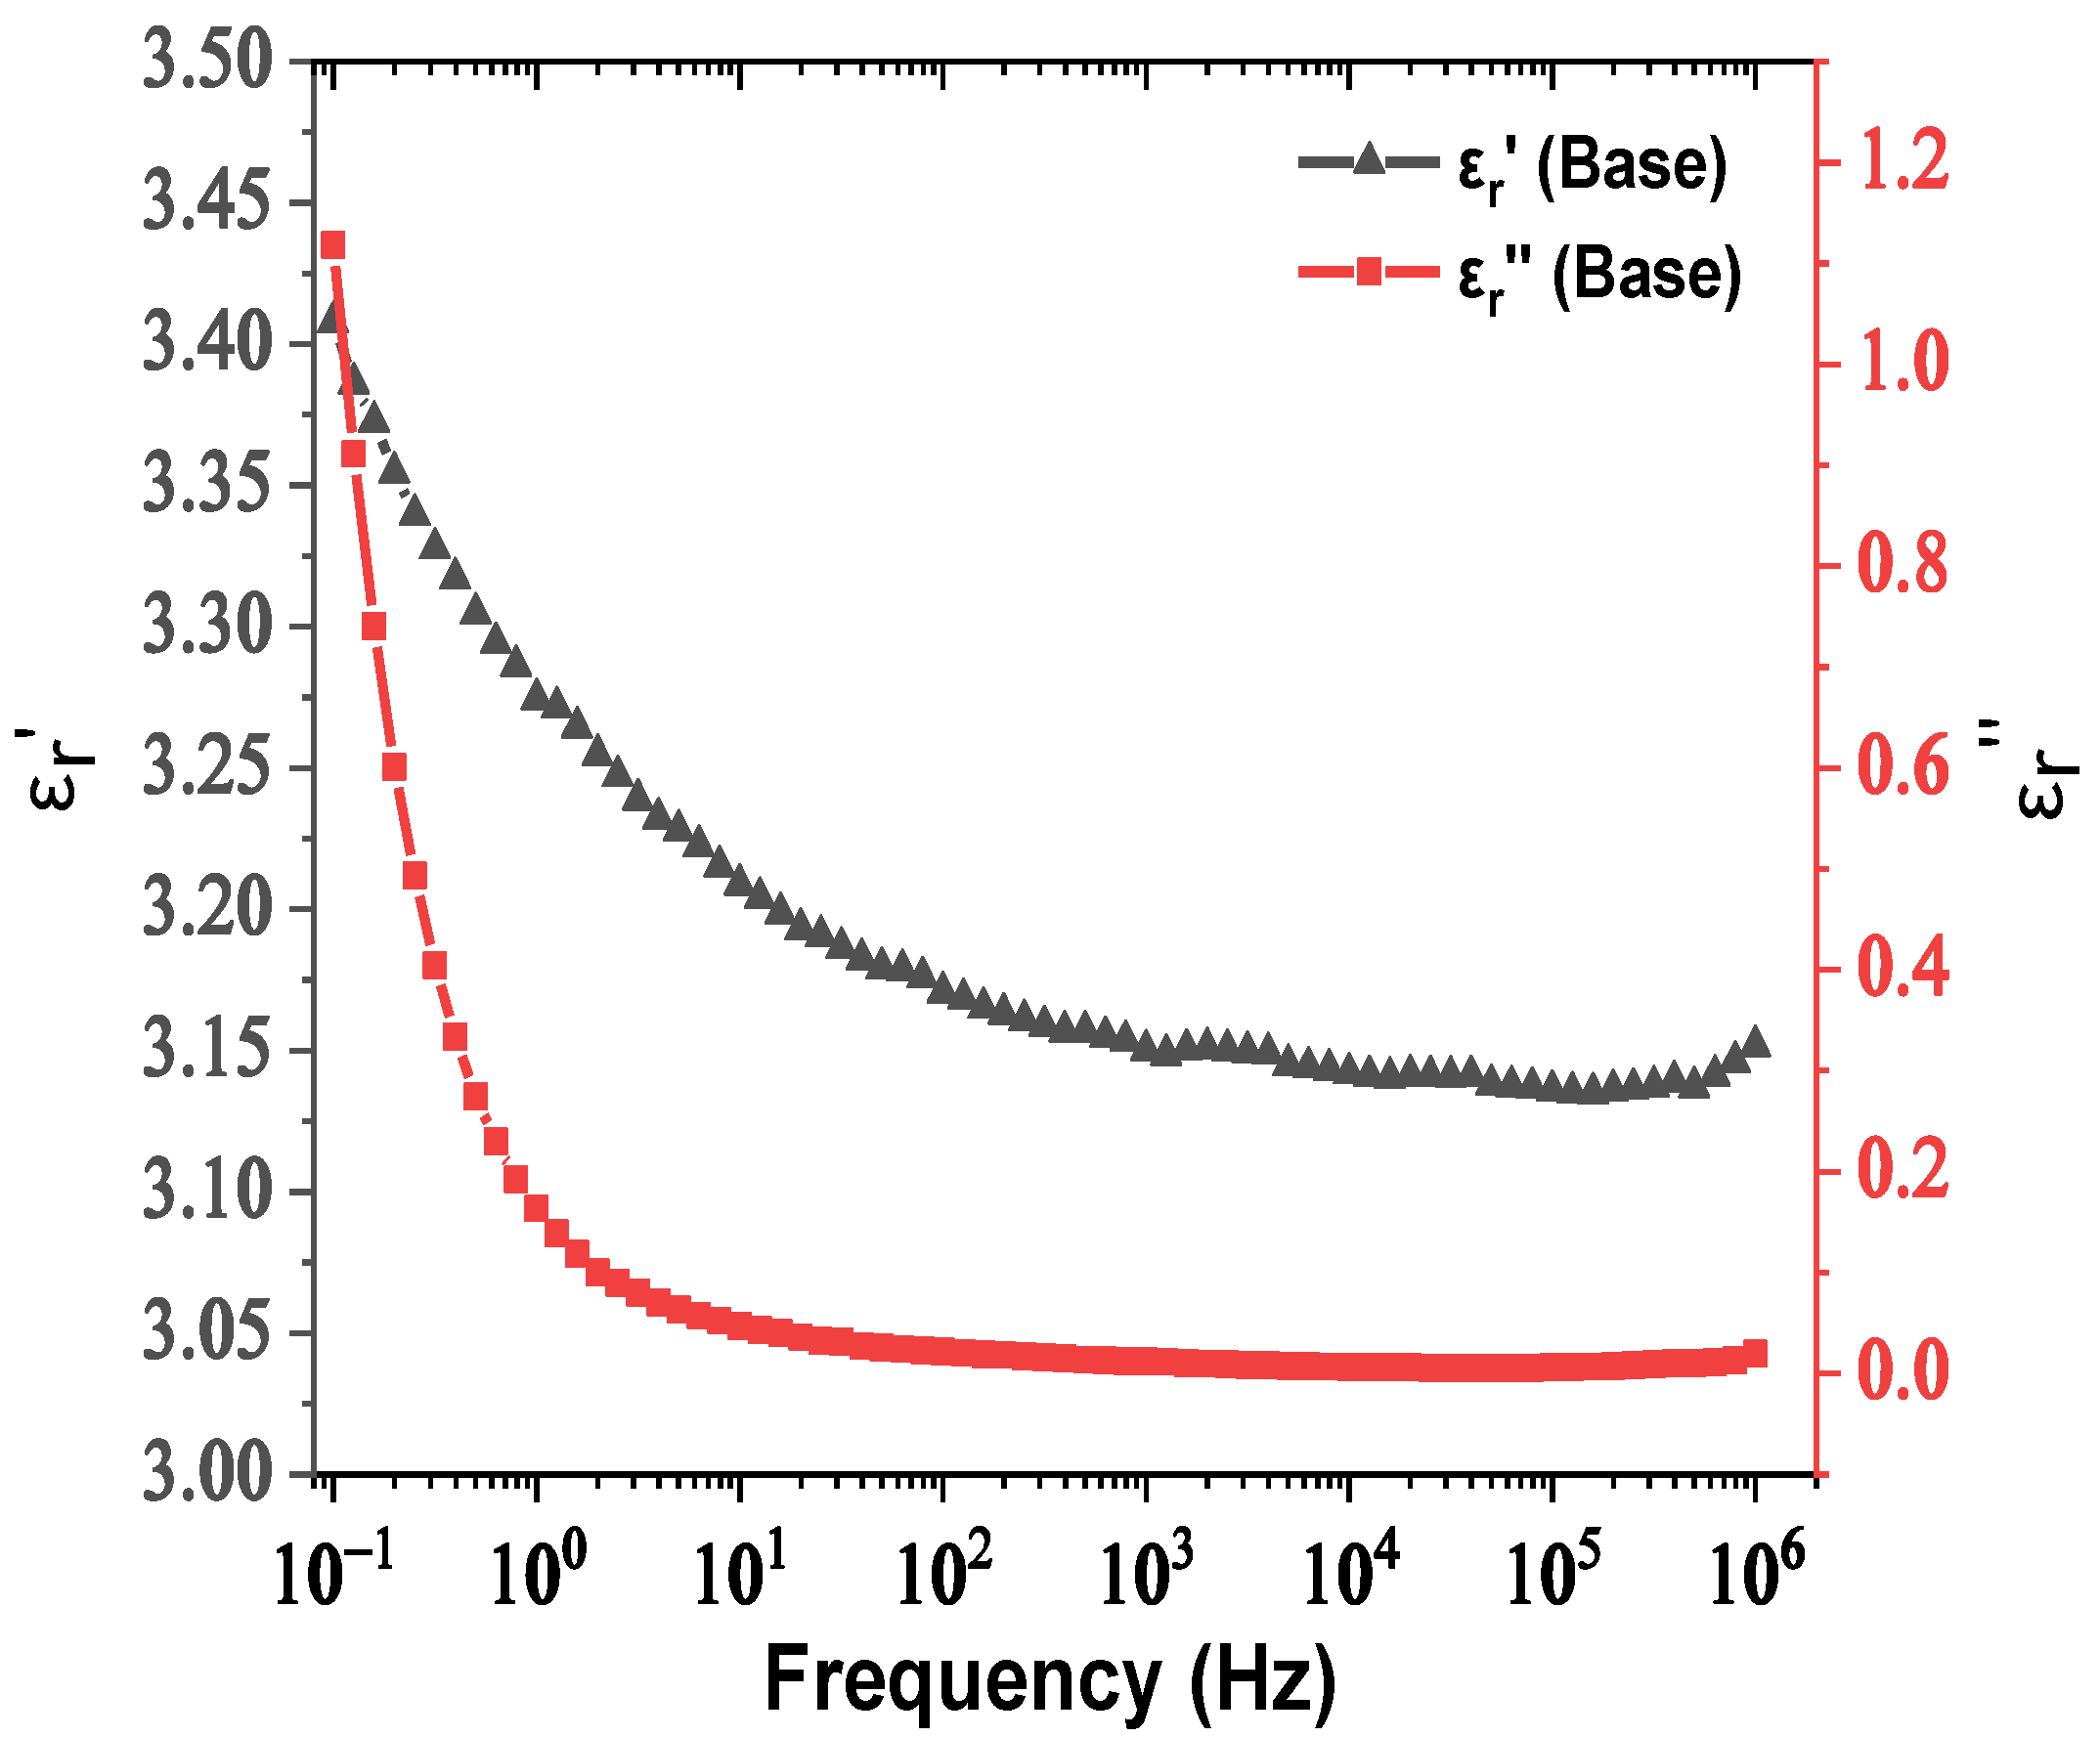
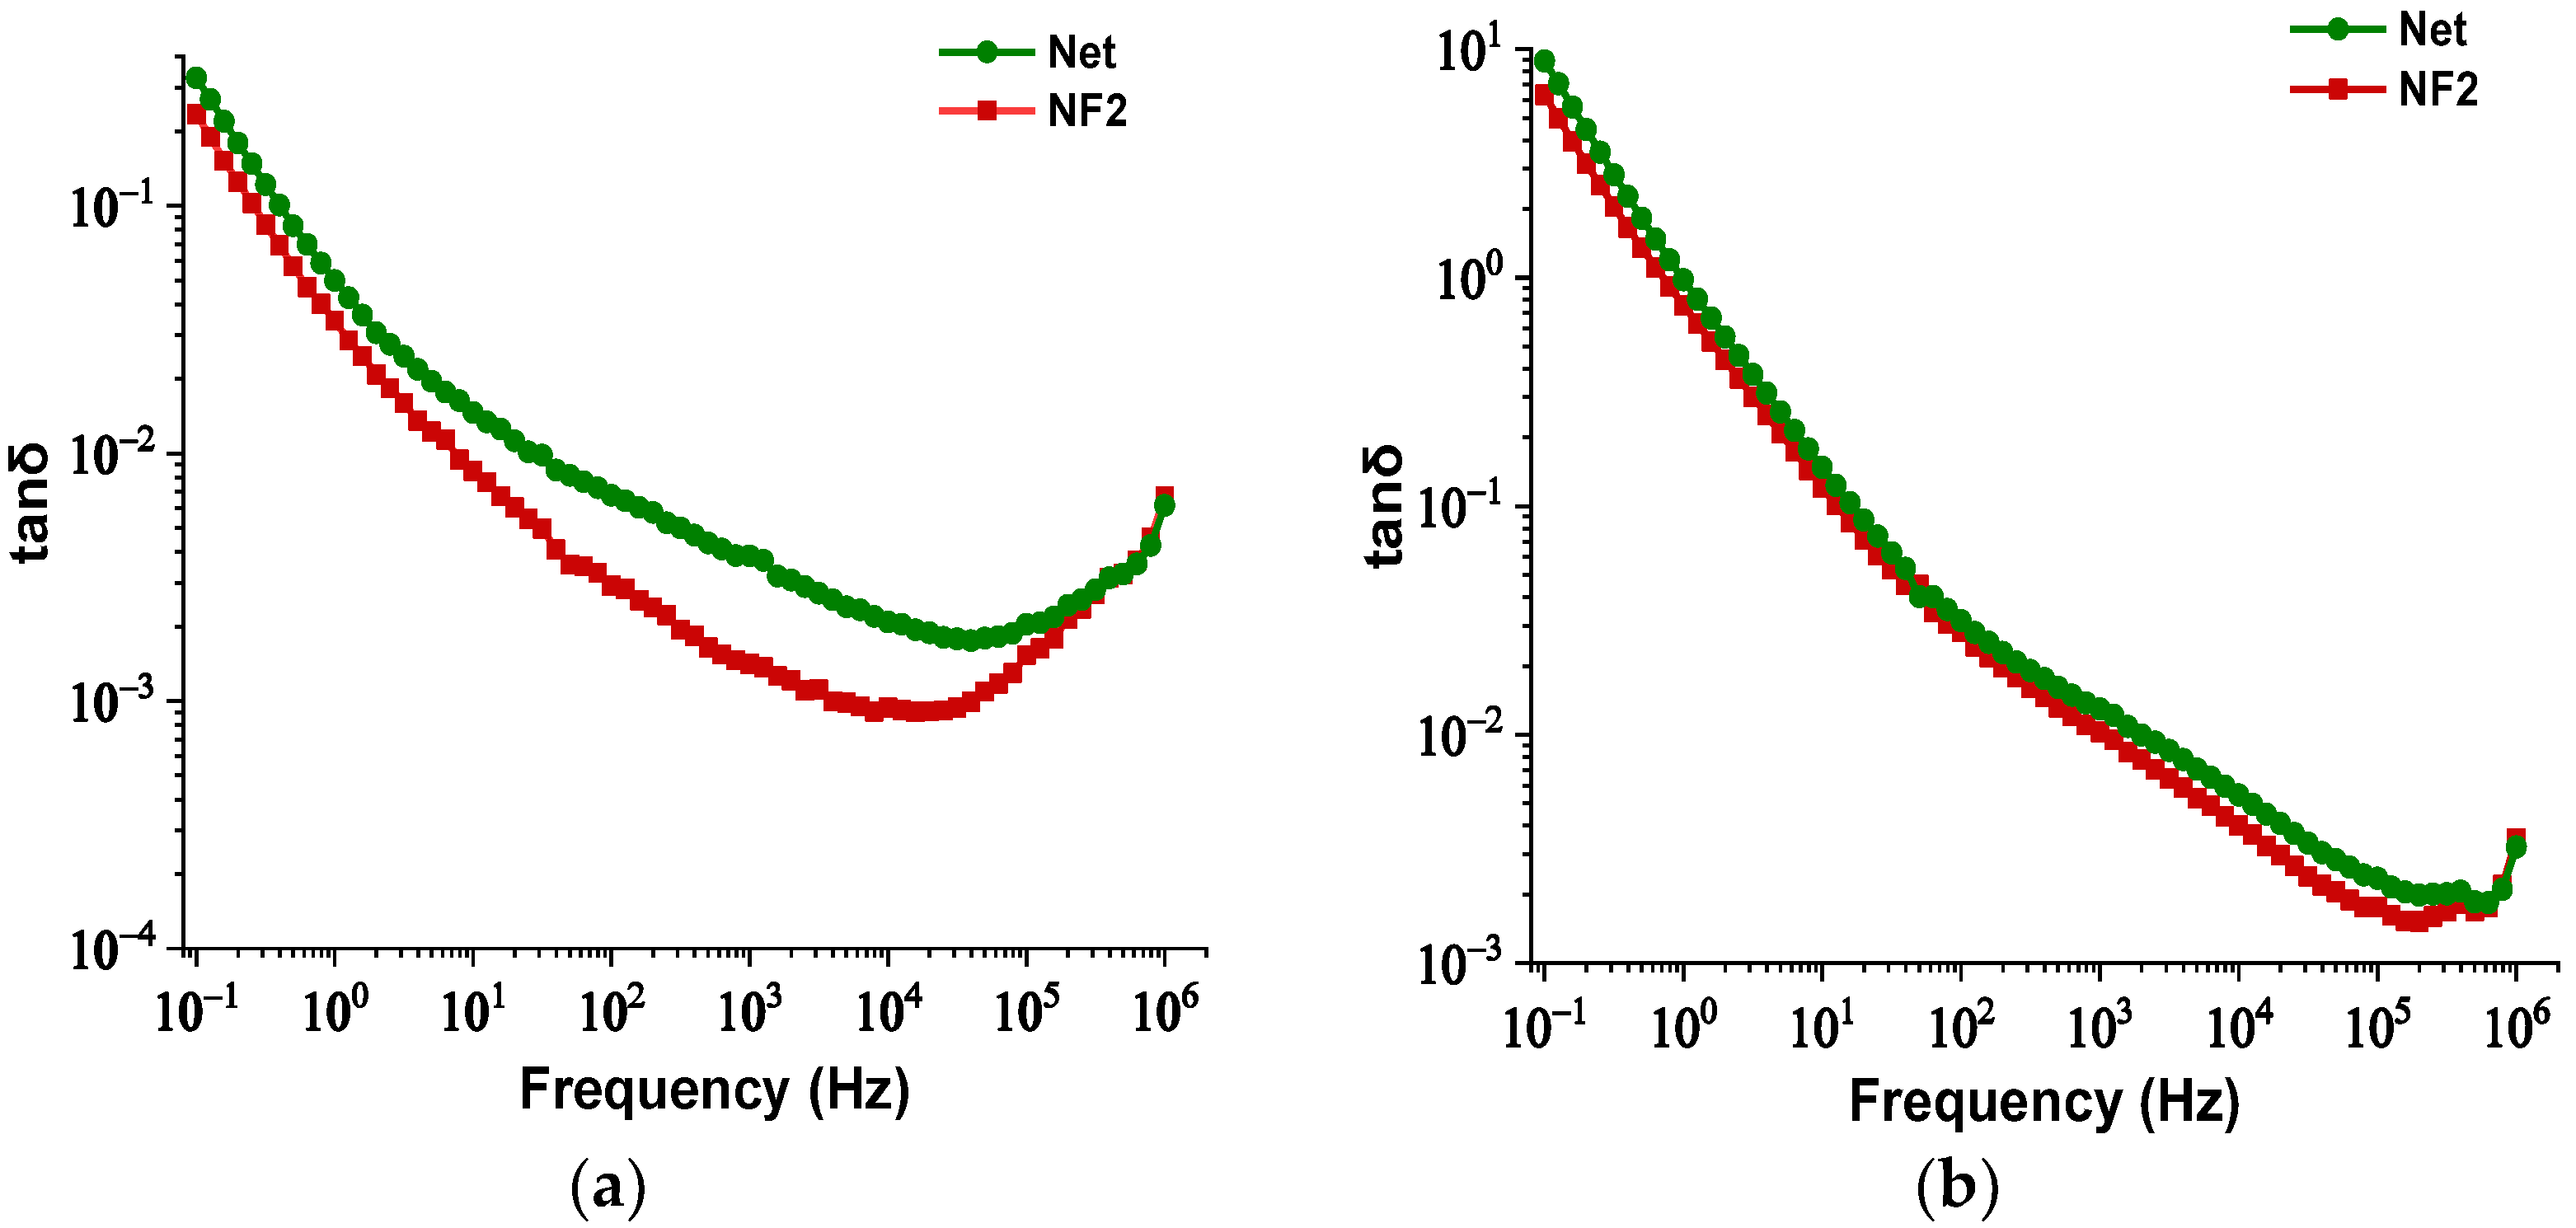
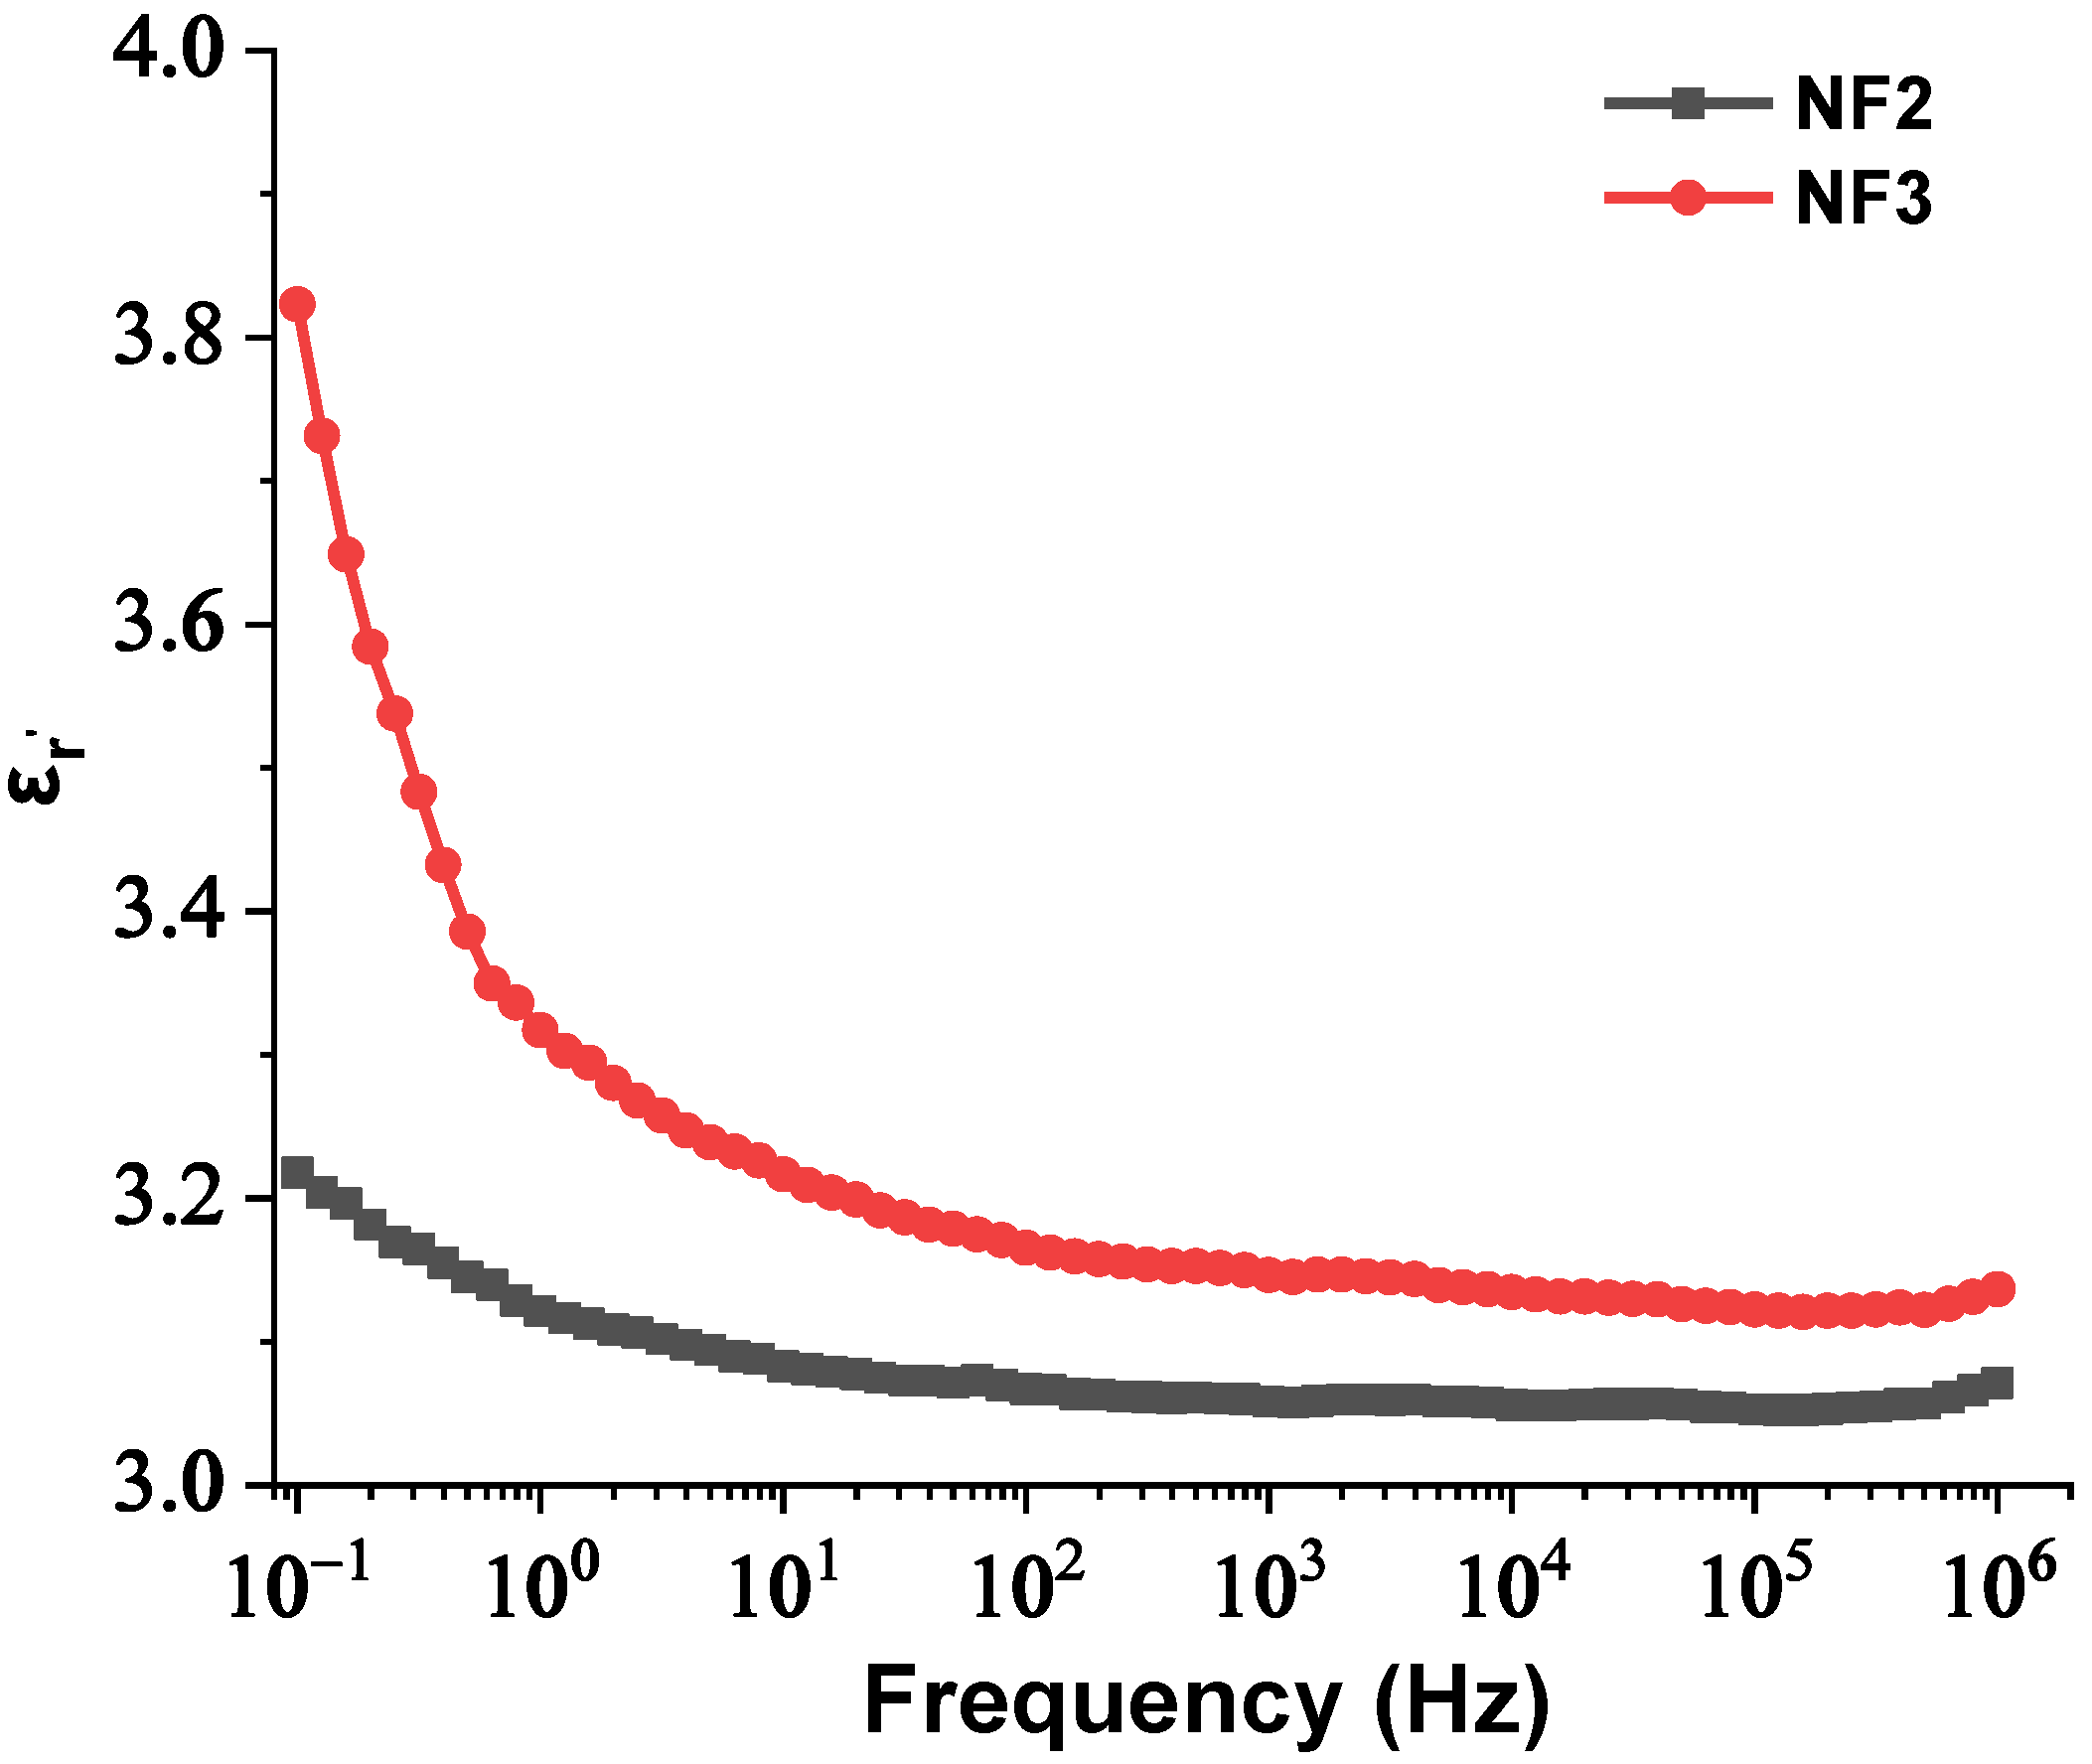
3.3. Comparison of Dielectric Dissipation Factor

As discussed in the Section 1, one of the disadvantages of the VO is the increased dielectric dissipation factor (tanδ). Therefore, it is of major importance to monitor this electrical parameter for the NF containing the optimal NP concentration, in terms of AC BDV and PDIV maximization. In Figure 11a,b, the change of tanδ is illustrated as a function of frequency for both samples at 25 °C and 90 °C, respectively. It is evident that the integration of this kind of NPs leads to a reduction of this factor under both temperature conditions, which is an indication of lower dielectric losses in comparison to the bulk.

4. Discussion

Based on the mean AC BDV data, it has been shown that adding semi-conducting SiC NPs to the matrix improves the mean AC BDV, with NF2 having the highest maximization, and that doubling the NP’s loading decreases the AC BDV. Many other published studies in the field [11,12,13,22,34,47] have discovered a similar pattern. The influence of these semi-conductive carbide NPs on the increase of AC BDV up to an optimal concentration can be explained by the fact that the NPs up to this weight percentage ratio could boost the shallow trap density in the NF, causing streamer propagation to be delayed due to electron trapping and de-trapping in shallow traps [30,31,32,33].
The shallow trapping model will be employed to clarify the mechanisms activated by the NPs to trap the fast electrons at the tip of the streamer and slow down its propagation between the electrodes. According to [30,31], under the influence of an external applied electric field, if there is reasonable discrepancy in the real part of relative permittivity between the integrated NP and base oil, then induced or polarized charges are generated at their interface. These charges result in the production of a potential well that can trap the fast electrons at the tip of the streamer in shallow traps and slow down its propagation; consequently, a higher electric field value should be applied in order for the electrons to be released and bridge the gap. With reference to the SiC NPs, because of their characterization as semiconductors, the potential well is developed due to polarization [31] and is expressed by Equation (6) for the electric field direction:
φ S i C ( r ) = ε 2 ε 1 2 ε 1 + ε 2 R 3 E 0 1 r 2 ,   r R  
where ε1′, ε2′ are the real parts of the permittivities of the base and NPs in F∙m−1, respectively, R is the radius of the suspended NPs and E0 is the value of the external electric field in V∙m−1.
Moreover, the deposited charge in each suspended NP due to the formation of the above potential well is expressed as Equation (7):
Q ( t ) = Q s S i C t τ p c 1 + t τ p c  
where t is the time of charging, Q s S i C is the total charge that can be captured by each charged NP, i.e., the saturation charge, and is calculated for this case from Equation (8) [31]:
Q s S i C = 12 π ε 1 Ε 0 R 2 ε 2 2 ε 1 + ε 2  
and τpc is the time constant for NP charging, which is expressed by Equation (9):
τ p c = 4 ε 1 ρ e μ e  
where ρe is the electron uniform charge density and μe is the electron mobility.
In our case, based on the results of Figure 3, the SiC NPs have dielectric constant equal to 26.6 at a rated frequency of 50 Hz, contrary to the matrix, which is characterized by a dielectric constant of 3.2 at 50 Hz according to Figure 2. The important divergence in their relative permittivities leads to the formation of a potential well as a function of the distance from their surface, which is described by Equation (3) and depicted in Figure 12a for electric field strength E0 = 20 kV∙mm−1. From this depiction, it is obvious that the high potential well distribution, especially as we approach the NPs’ surface, is able to catch the charge carriers, especially electrons, due to their higher mobility. The electron trapping takes place at a fast rate, as shown in Figure 12b, where it appears that half of the saturation charge per NP is deposited in about 1.1 ns in shallow traps, obtained by using Equation (4), a fact that explains the increased dielectric performance with the integration of these kinds of NPs. This mechanism leads to an enhancement of AC BDV, because of the much slower mobility of NPs with respect to electrons. In terms of (7), the saturation charge of each suspended SiC NP is −1.08×10⁻¹⁷ C (67 e). Therefore, each SiC NP under the influence of an external electric field of 20 kV∙mm−1 can trap about 67 electrons at a very fast rate and thus modify the fundamental electrohydrodynamics of the streamer propagation, leading to improved AC BDV.
In an effort to explain the negative effect on AC BDV regarding NF3, the Derjaguin–Landau–Verwey–Overbeek (DLVO) theory is considered [34]. Under the influence of an increasing external electric field, like the one in the AC BDV test, the oil molecules can lose electrons due to impact ionization through collisions with the highly energetic electrons injected from the electrodes. In this way, these oil molecules become positively charged and are called positive ions. Subsequently, some of the free electrons in the vicinity of the liquid are attached to neutral oil molecules, charging them negatively. These negatively charged molecules are called negative ions. When the colloids are charged in the base oil, they attract the positive ions, namely counter-ions, which form a rigorous layer around each colloid; this layer of counter-ions is known as the Stern layer [34]. Besides, the negative ions (namely co-ions) along with additional positive ions are repelled by the negative colloid and the Stern layer respectively. Both kinds of ions form a second layer around the Stern layer, until reaching equilibrium, which is called the diffuse layer [34]. Both layers compose the model of the formation of the electrical double layer (EDL) around each charged NP.
According to the DLVO theory, the total interaction between two NPs added in a liquid medium is the combination of the van der Waals attraction force and the electrostatic repulsion force caused by their EDLs. The van der Waals attraction force, considering the NPs as spherical with the same radius R at the time of their integration into the matrix, is expressed by Equation (10):
W ( D ) = A R 12 D  
where A is the Hamaker constant and D is the separation distance between them.
Hence, with an increase in the NPs’ concentration from 0.004% to 0.008% w/w, the separation distance of them declined, which resulted in overlap of some of the NPs’ EDLs due to extremely augmented van der Waals forces. The rapid aggregation could have led to the formulation of conductive bridges between the electrodes and hence a reduction in the AC BDV. In order for this theory to be verified, the BDS technique was used to measure the dielectric constant and electrical conductivity of the NF2 and NF3 samples just after their preparation. The change in their dielectric constants and electrical conductivities versus frequency is depicted in Figure 13 and Figure 14, respectively. It is evident that at 50 Hz frequency, NF2 has a lower dielectric constant and a much lower electrical conductivity than NF3. The increase in electrical conductivity of NF3 can be attributed to the mechanism described above in detail. So, the results of the BDS technique confirm the AC BDV results and consequently the developed theory.
The results of the performed PD test also verify the hypothesis that the NPs’ agglomeration is the main cause for the existence of an optimal concentration in terms of AC BDV performance. It was found that the resistance to the appearance of PD is maximized when the paper impregnated with the NF2 sample is stressed and then it falls when the combination of solid insulation with NF3 is tested. According to [43], two factors affect the resistance to PD: firstly, the ability of the SiC NPs to act as electron traps, based on the shallow trapping theory as explained before. The EDL plays a pivotal role as well; however, in our case the PD experiment is performed in the insulating paper impregnated with the samples; therefore, the influences of the EDL and its diffuse layer are neglected.

5. Conclusions

In this paper, the influence of SiC NPs on the AC BDV and PDIV of NEO FR3 was investigated. The NPs were added in three weight percentage ratios, namely 0.002%, 0.004% and 0.008% w/w, synthesizing the NF1, NF2 and NF3 samples respectively. The processing of the results indicated that the highest AC BDV and PDIV improvement in comparison to the base oil’s characteristics was obtained for the NF2 sample, by 37.3% and 55.5%, respectively. The statistical analysis confirmed that the same sample also demonstrated increased BDV at the 10% probability level after fitting to the Weibull distribution, by 50.1% with respect to the matrix. This increase was attributed to the ability of the SiC NPs to trap the charge carriers through the production of a potential well on their interface caused by polarized surface charges. The BDS technique was adopted to show that the dielectric constant and electrical conductivity of NF3 had been augmented to prove that the overlapping of the NPs’ EDLs due to reduction of their separation distance creating conductive paths was responsible for the existence of an optimal concentration.
In addition, the improved behavior of the insulating paper impregnated with NF2 has been attributed to the ability of the SiC NPs to operate as electron traps and finally increase the resistance to the appearance of PD. Last but not least, the NF containing this amount of NPs demonstrated a decreased dielectric dissipation factor for a frequency range of 0.1 Hz–1 MHz at both 25 and at 90 °C.

Author Contributions

Conceptualization, K.N.K., V.P.C., I.F.G. and E.C.P.; methodology, K.N.K., S.N.T. and E.C.P.; validation, V.P.C., A.K. and I.F.G.; formal analysis, K.N.K. and V.P.C.; investigation, K.N.K. and S.N.T.; resources, A.K., I.F.G. and E.C.P.; data curation, S.N.T. and I.F.G.; writing—original draft preparation, K.N.K., S.N.T. and V.P.C.; writing—review and editing, A.K., I.F.G. and E.C.P.; supervision, A.K. and E.C.P. All authors have read and agreed to the published version of the manuscript.

Funding

This research received no external funding.

Informed Consent Statement

Not applicable.

Data Availability Statement

The data presented in this study are available from the corresponding author upon request. The data are not publicly available due to privacy.

Acknowledgments

The authors want to express their gratitude to Aimilia Barmpaki and other staff of the Condensed Matter Division, Department of Physics, University of Patras, for the assistance in the conduction of measurements of permittivity and electrical conductivity of the NPs and Spyros Yannopoulos from the Foundation for Research and Technology Hellas, Institute of Chemical Engineering Sciences, for the assistance in the preparation of nanofluid samples.

Conflicts of Interest

The authors declare no conflict of interest.

References

  1. Šárpataky, M.; Kurimský, J.; Rajňák, M. Dielectric Fluids for Power Transformers with Special Emphasis on Biodegradable Nanofluids. Nanomaterials 2021, 11, 2885. [Google Scholar] [CrossRef]
  2. Islam, M.M.; Lee, G.; Hettiwatte, S.N. A review of condition monitoring techniques and diagnostic tests for lifetime estimation of power transformers. Electr. Eng. 2017, 100, 581–605. [Google Scholar] [CrossRef]
  3. Rafiq, M.; Shafique, M.; Azam, A.; Ateeq, M. Transformer oil-based nanofluid: The application of nanomaterials on thermal, electrical and physicochemical properties of liquid insulation—A review. Ain Shams Eng. J. 2021, 12, 555–576. [Google Scholar] [CrossRef]
  4. Kulkarni, S.V.; Khaparde, S.A. Transformer Engineering Design, Technology, and Diagnostics; CRC Press: Boca Raton, FL, USA, 2013; ISBN 9788578110796. [Google Scholar]
  5. Rafiq, M.; Shafique, M.; Azam, A.; Ateeq, M.; Khan, I.A.; Hussain, A. Sustainable, Renewable and Environmental-Friendly Insulation Systems for High Voltages Applications. Molecules 2020, 25, 3901. [Google Scholar] [CrossRef] [PubMed]
  6. Rafiq, M.; Shafique, M.; Azam, A.; Ateeq, M. The impacts of nanotechnology on the improvement of liquid insulation of transformers: Emerging trends and challenges. J. Mol. Liq. 2020, 302, 112482. [Google Scholar] [CrossRef]
  7. Ibrahim, A.; Nasrat, L.; Elnoby, A.; Eldebeiky, S. Thermal ageing study of ZnO nanofluid–cellulose insulation. IET Nanodielectr. 2020, 4, 124–130. [Google Scholar] [CrossRef]
  8. Fernández, I.; Valiente, R.; Ortiz, F.; Renedo, C.J.; Ortiz, A. Effect of TiO2 and ZnO Nanoparticles on the Performance of Dielectric Nanofluids Based on Vegetable Esters During Their Aging. Nanomaterials 2020, 10, 692. [Google Scholar] [CrossRef] [Green Version]
  9. Salama, M.M.M.; Mansour, D.A.; Daghrah, M.; Abdelkasouda, S.M.; Abbasa, A.A. Thermal performance of transformers filled with environmentally friendly oils under various loading conditions. Int. J. Electr. Power Energy Syst. 2020, 118, 105743. [Google Scholar] [CrossRef]
  10. Daghrah, M.; Wang, Z.; Liu, Q.; Hilker, A.; Gyore, A. Experimental study of the influence of different liquids on the transformer cooling performance. IEEE Trans. Power Deliv. 2019, 34, 588–595. [Google Scholar] [CrossRef] [Green Version]
  11. Koutras, K.N.; Naxakis, I.A.; Antonelou, A.E.; Charalampakos, V.P.; Pyrgioti, E.C.; Yannopoulos, S.N. Dielectric strength and stability of natural ester oil based TiO2 nanofluids. J. Mol. Liq. 2020, 316, 113901. [Google Scholar] [CrossRef]
  12. Duzkaya, H.; Beroual, A. Statistical Analysis of AC Dielectric Strength of Natural Ester-Based ZnO Nanofluids. Energies 2021, 14, 99. [Google Scholar] [CrossRef]
  13. Thomas, P.; Hudedmani, N.; Prasath, R.T.A.R.; Roy, N.K.; Mahato, S.N. Synthetic Ester Oil Based High Permittivity CaCu3Ti4O12 (CCTO) Nanofluids an Alternative Insulating Medium for Power Transformer. IEEE Trans. Dielectr. Electr. Insul. 2019, 26, 314–321. [Google Scholar] [CrossRef]
  14. Yao, W.; Huang, Z.; Li, J.; Wu, L.; Xiang, C. Enhanced Electrical Insulation and Heat Transfer Performance of Vegetable Oil Based Nanofluids. J. Nanomater. 2018, 2018, 4504208. [Google Scholar] [CrossRef] [Green Version]
  15. Fontes, D.H.; Ribatski, G.; Filho, E.P.B. Experimental evaluation of thermal conductivity, viscosity and breakdown voltage AC of nanofluids of carbon nanotubes and diamond in transformer oil. Diam. Relat. Mater. 2015, 58, 115–121. [Google Scholar] [CrossRef]
  16. Jaroszewski, M.; Beroual, A.; Golebiowski, D. Effect of Temperature on Dielectric Loss Factor of Biodegradable Transformer Oil. In Proceedings of the 2018 IEEE International Conference on High Voltage Engineering and Application (ICHVE 2018), Athens, Greece, 10−13 September 2018; pp. 1–4. [Google Scholar]
  17. Reddy, P.S.; Sreedevi, P.; Chamkha, A.J.; Al-Mudhaf, A.F. Heat and mass transfer boundary-layer flow over a vertical cone through porous media filled with a Cu–water and Ag–water nanofluid. Heat Transf. Res. 2018, 49, 119–143. [Google Scholar] [CrossRef]
  18. Reddy, P.S.; Sreedevi, P.; Rao, K.V.S. Impact of heat generation/absorption on heat and mass transfer of nanofluid over rotating disk filled with carbon nanotubes. Int. J. Numer. Methods Heat Fluid Flow 2020, 31, 2962–2985. [Google Scholar] [CrossRef]
  19. Sreedevi, P.; Reddy, P.S. Entropy generation and heat transfer analysis of alumina and carbon nanotubes based hybrid nanofluid inside a cavity. Phys. Scr. 2021, 96, 085210. [Google Scholar] [CrossRef]
  20. Fal, J.; Mahian, O.; Żyła, G. Nanofluids in the Service of High Voltage Transformers: Breakdown Properties of Transformer Oils with Nanoparticles, a Review. Energies 2018, 11, 2942. [Google Scholar] [CrossRef] [Green Version]
  21. Olmo, C.; Méndez, C.; Ortiz, F.; Delgado, F.; Ortiz, A. Titania Nanofluids Based on Natural Ester: Cooling and Insulation Properties Assessment. Nanomaterials 2020, 10, 603. [Google Scholar] [CrossRef] [Green Version]
  22. Khaled, U.; Beroual, A. AC Dielectric Strength of Synthetic Ester Based Fe3O4, Al2O3 and SiO2 Nanofluids—Conformity with Normal and Weibull Distributions. IEEE Trans. Dielectr. Electr. Insul. 2019, 26, 625–633. [Google Scholar] [CrossRef]
  23. Beroual, A.; Khaled, U. Statistical Investigation of Lightning Impulse Breakdown Voltage of Natural and Synthetic Ester Oils-Based Fe3O4, Al2O3 and SiO2 Nanofluids. IEEE Access 2020, 8, 112615–112623. [Google Scholar] [CrossRef]
  24. Du, Y.F.; Lv, Y.Z.; Wang, F.C.; Li, X.X.; Li, C.R. Effect of TiO2 nanoparticles on the breakdown strength of transformer oil. In Proceedings of the Conference Record of the 2010 IEEE International Symposium on Electrical Insulation (ISEI), San Diego, CA, USA, 6–9 June 2010; pp. 1–3. [Google Scholar]
  25. Jin, H.; Andritsch, T.; Tsekmes, I.; Kochetov, R.; Morshuis, P.; Smit, J. Properties of mineral oil based silica nanofluids . IEEE Trans. Dielectr. Electr. Insul. 2014, 21, 1100–1108. [Google Scholar]
  26. Saenkhumwong, W.; Suksri, A. The improved dielectric properties of natural ester oil by using ZnO and TiO2 nanoparticles. Eng. Appl. Sci. Res. 2017, 44, 148–153. [Google Scholar]
  27. Kurimský, J.; Rajňák, M.; Šárpataky, M.; Čonka, Z.; Paulovičová, K. Electrical and Acoustic Investigation of Partial Discharges in Two Types of Nanofluids. J. Mol. Liq. 2021, 341, 117444. [Google Scholar] [CrossRef]
  28. Jacob, J.; Preetha, P.; Sindhu, T.K. Stability Analysis and Characterization of Natural Ester Nanofluids for Transformers. IEEE Trans. Dielectr. Electr. Insul. 2020, 27, 1715–1723. [Google Scholar] [CrossRef]
  29. Ilyas, S.U.; Pendyala, R.; Narahari, M.; Susin, L. Stability, rheology and thermal analysis of functionalized alumina- thermal oil-based nanofluids for advanced cooling systems. Energy Convers. Manag. 2017, 142, 215–229. [Google Scholar] [CrossRef]
  30. Hwang, J.G.; Zahn, M.; O’Sullivan, F.M.; Pettersson, L.A.A.; Hjortstam, O.; Liu, R. Effects of nanoparticle charging on streamer development in transformer oil-based nanofluids. J. Appl. Phys. 2010, 107, 014310. [Google Scholar] [CrossRef] [Green Version]
  31. Sima, W.; Shi, J.; Yang, Q.; Huang, S.; Cao, X. Effects of Conductivity and Permittivity of Nanoparticle on Transformer Oil Insulation Performance: Experiment and Theory. IEEE Trans. Dielectr. Electr. Insul. 2015, 22, 380–390. [Google Scholar] [CrossRef]
  32. Miao, J.; Dong, M.; Ren, M.; Wu, X.; Shen, L.; Wang, H. Effect of nanoparticle polarization on relative permittivity of transformer oil-based nanofluids. J. Appl. Phys. 2013, 113, 204103. [Google Scholar] [CrossRef]
  33. Du, Y.; Lv, Y.; Li, C.; Chen, M.; Zhong, Y.; Zhou, J.; Li, X.; Zhou, Y. Effect of semiconductive nanoparticles on insulating performances of transformer oil. IEEE Trans. Dielectr. Electr. Insul. 2012, 19, 770–776. [Google Scholar]
  34. Atiya, E.G.; Mansour, D.A.; Khattab, R.M. Dispersion behavior and breakdown strength of transformer oil filled with TiO2 nanoparticles. IEEE Trans. Dielectr. Electr. Insul. 2015, 22, 2463–2472. [Google Scholar] [CrossRef]
  35. Khaled, U.; Beroual, A. AC dielectric strength of mineral oil-based Fe3O4 and Al2O3 nanofluids. Energies 2018, 11, 3505. [Google Scholar] [CrossRef] [Green Version]
  36. Emara, M.M.; Peppas, G.D.; Polykrati, A.D.; Tegopoulos, S.; Pyrgioti, E.C.; Chronopoulos, D.D.; Kyritsis, A.; Gonos, I.F. Thermal and Electrical Conductivities for Ester Oil Based Graphene Nana-sheets. In Proceedings of the 2020 IEEE International Conference on High Voltage Engineering and Application (ICHVE), Beijing, China, 6−10 September 2020; pp. 1–4. [Google Scholar]
  37. Charalampakos, V.P.; Peppas, G.D.; Pyrgioti, E.C.; Bakandritsos, A.; Polykrati, A.D.; Gonos, I.F. Dielectric Insulation Characteristics of Natural Ester Fluid Modified by Colloidal Iron Oxide Ions and Silica Nanoparticles. Energies 2019, 12, 3259. [Google Scholar] [CrossRef] [Green Version]
  38. Koutras, K.N.; Naxakis, I.A.; Pyrgioti, E.C.; Charalampakos, V.P.; Gonos, I.F.; Antonelou, A.E.; Yannopoulos, S.N. The Influence of Nanoparticles’ Conductivity and Charging on Dielectric Properties of Ester Oil Based Nanofluid. Energies 2020, 13, 6540. [Google Scholar] [CrossRef]
  39. ASTM D1533-00(2005) standard. Stand. Test Method Water Insul. Liq. By Coulom. Karl Fischer Titration, 2005.
  40. Koutras, K.; Pyrgioti, E.; Naxakis, I.; Charalampakos, V.; Peppas, G. AC Breakdown Performance of A12O3 and SiC Natural Ester Based Nanofluids. In Proceedings of the 2020 IEEE International Conference on Environment and Electrical Engineering and 2020 IEEE Industrial and Commercial Power Systems Europe (EEEIC/I&CPS Europe), Madrid, Spain, 9−12 June 2020; pp. 1–5. [Google Scholar]
  41. Primo, V.A.; Pérez-Rosa, D.; García, B.; Cabanelas, J.C. Evaluation of the Stability of Dielectric Nanofluids for Use in Transformers under Real Operating Conditions. Nanomaterials 2019, 9, 143. [Google Scholar] [CrossRef] [PubMed] [Green Version]
  42. Martin, D.; Wang, Z.D. Statistical analysis of the AC breakdown voltages of ester based transformer oils. IEEE Trans. Dielectr. Electr. Insul. 2008, 15, 1044–1050. [Google Scholar] [CrossRef]
  43. Atiya, E.G.; Mansour, D.A.; Izzuralab, M. Partial Discharge Development in Oil-Based Nanofluids: Inception, Propagation and Time Transition. IEEE Access 2020, 8, 181028–181035. [Google Scholar] [CrossRef]
  44. Mohamad, N.A.; Azis, N.; Jasni, J.; Kadir, M.Z.A.A.; Yunus, R.; Yaakub, Z. Experimental Study on the Partial Discharge Characteristics of Palm Oil and Coconut Oil Based Al2O3 Nanofluids in the Presence of Sodium Dodecyl Sulfate. Nanomaterials 2021, 11, 786. [Google Scholar] [CrossRef]
  45. IEC 60071-1 standard: Insulation co-ordination—Part 1: Definitions, principles and rules.
  46. IEC 60071-2 standard: Insulation co-ordination—Part 2: Application guidelines.
  47. Khaled, U.; Beroual, A. Statistical Investigation of AC Breakdown Voltage of Natural Ester with Electronic Scavenger Additives. IEEE Trans. Dielectr. Electr. Insul. 2019, 26, 2012–2018. [Google Scholar] [CrossRef]
Figure 1. FE-SEM image of SiC NPs at high magnification.
Nanomaterials 12 00269 g001
Figure 2. Change in the real and imaginary parts of relative permittivity versus frequency for natural ester oil.
Nanomaterials 12 00269 g002
Figure 3. Change in the real and imaginary parts of relative permittivity versus frequency for the SiC nanoparticles.
Nanomaterials 12 00269 g003
Figure 4. Change in electrical conductivity versus frequency: (a) for the matrix sample and (b) for the SiC nanoparticles.
Nanomaterials 12 00269 g004
Figure 5. The samples immediately after their production, from left to right: Net, NF1, NF2 and NF3 samples.
Nanomaterials 12 00269 g005
Figure 6. AC BDV and PD experimental devices: (a) The BAUR DTA generator with the testing cell; (b) the schematic diagram of the PD setup.
Nanomaterials 12 00269 g006
Figure 7. Mean values of the AC BDV along with error bars for the samples in question.
Nanomaterials 12 00269 g007
Figure 8. Probability density plot of the BD events with conformity to the Weibull line.
Nanomaterials 12 00269 g008
Figure 9. Apparent charge versus the applied AC voltage for the insulating paper impregnated with the Net and NF samples.
Nanomaterials 12 00269 g009
Figure 10. Waveforms of PD pulses at 3 kV AC voltage for the insulating paper impregnated with: (a) Net; (b) NF1; (c) NF2; (d) NF3 samples.
Nanomaterials 12 00269 g010aNanomaterials 12 00269 g010b
Figure 11. Change in dielectric dissipation factor versus frequency of the Net and NF2 samples: (a) at 25°C and (b) at 90 °C.
Nanomaterials 12 00269 g011
Figure 12. (a) Potential well distribution versus the distance from the SiC NP surface for E0= 20 kV∙mm−1; (b) deposited charge in each SiC NP versus time for E0= 20 kV∙mm−1.
Nanomaterials 12 00269 g012
Figure 13. Change in the real part of relative permittivity versus frequency of the NF2 and NF3 samples.
Nanomaterials 12 00269 g013
Figure 14. Change in electrical conductivity versus frequency of the NF2 and NF3 samples.
Nanomaterials 12 00269 g014
Table 1. Identification of the samples.
Sample (n)NP Concentration (% w/w)
Net (Base)0
NF1NF with 0.002% SiC NPs
NF2NF with 0.004% SiC NPs
NF3NF with 0.008% SiC NPs
Table 2. Descriptive statistics of the liquid samples under investigation.
Sample (n)Mean AC BDV (kV)Standard Deviation (kV)Scale (kV)Shape
Net61.712.166.16.7
NF178.88.782.411.9
NF284.710.789.29.9
NF364.810.569.26.6
Table 3. Anderson–Darling goodness-of-fit test for the Weibull distribution.
Sample (n)p-Value
Net0.25
NF10.13
NF20.25
NF30.18
Table 4. Withstand voltages at 1, 10 and 50% failure probability levels with fitting to the Weibull distribution.
Sample (n)U50% (kV)U10% (kV)U1% (kV)
Net62.647.333.9
NF180.569.958.7
NF285.971.056.0
NF365.549.334.5
Publisher’s Note: MDPI stays neutral with regard to jurisdictional claims in published maps and institutional affiliations.

