
Dispersion State and Damage of Carbon Nanotubes and Carbon Nanofibers by Ultrasonic Dispersion: A Review


Abstract
1. Introduction
2. Dispersion
2.1. Overview of Dispersion Methods
2.1.1. Short Overview of Dispersion Methods Other Than Ultrasonication
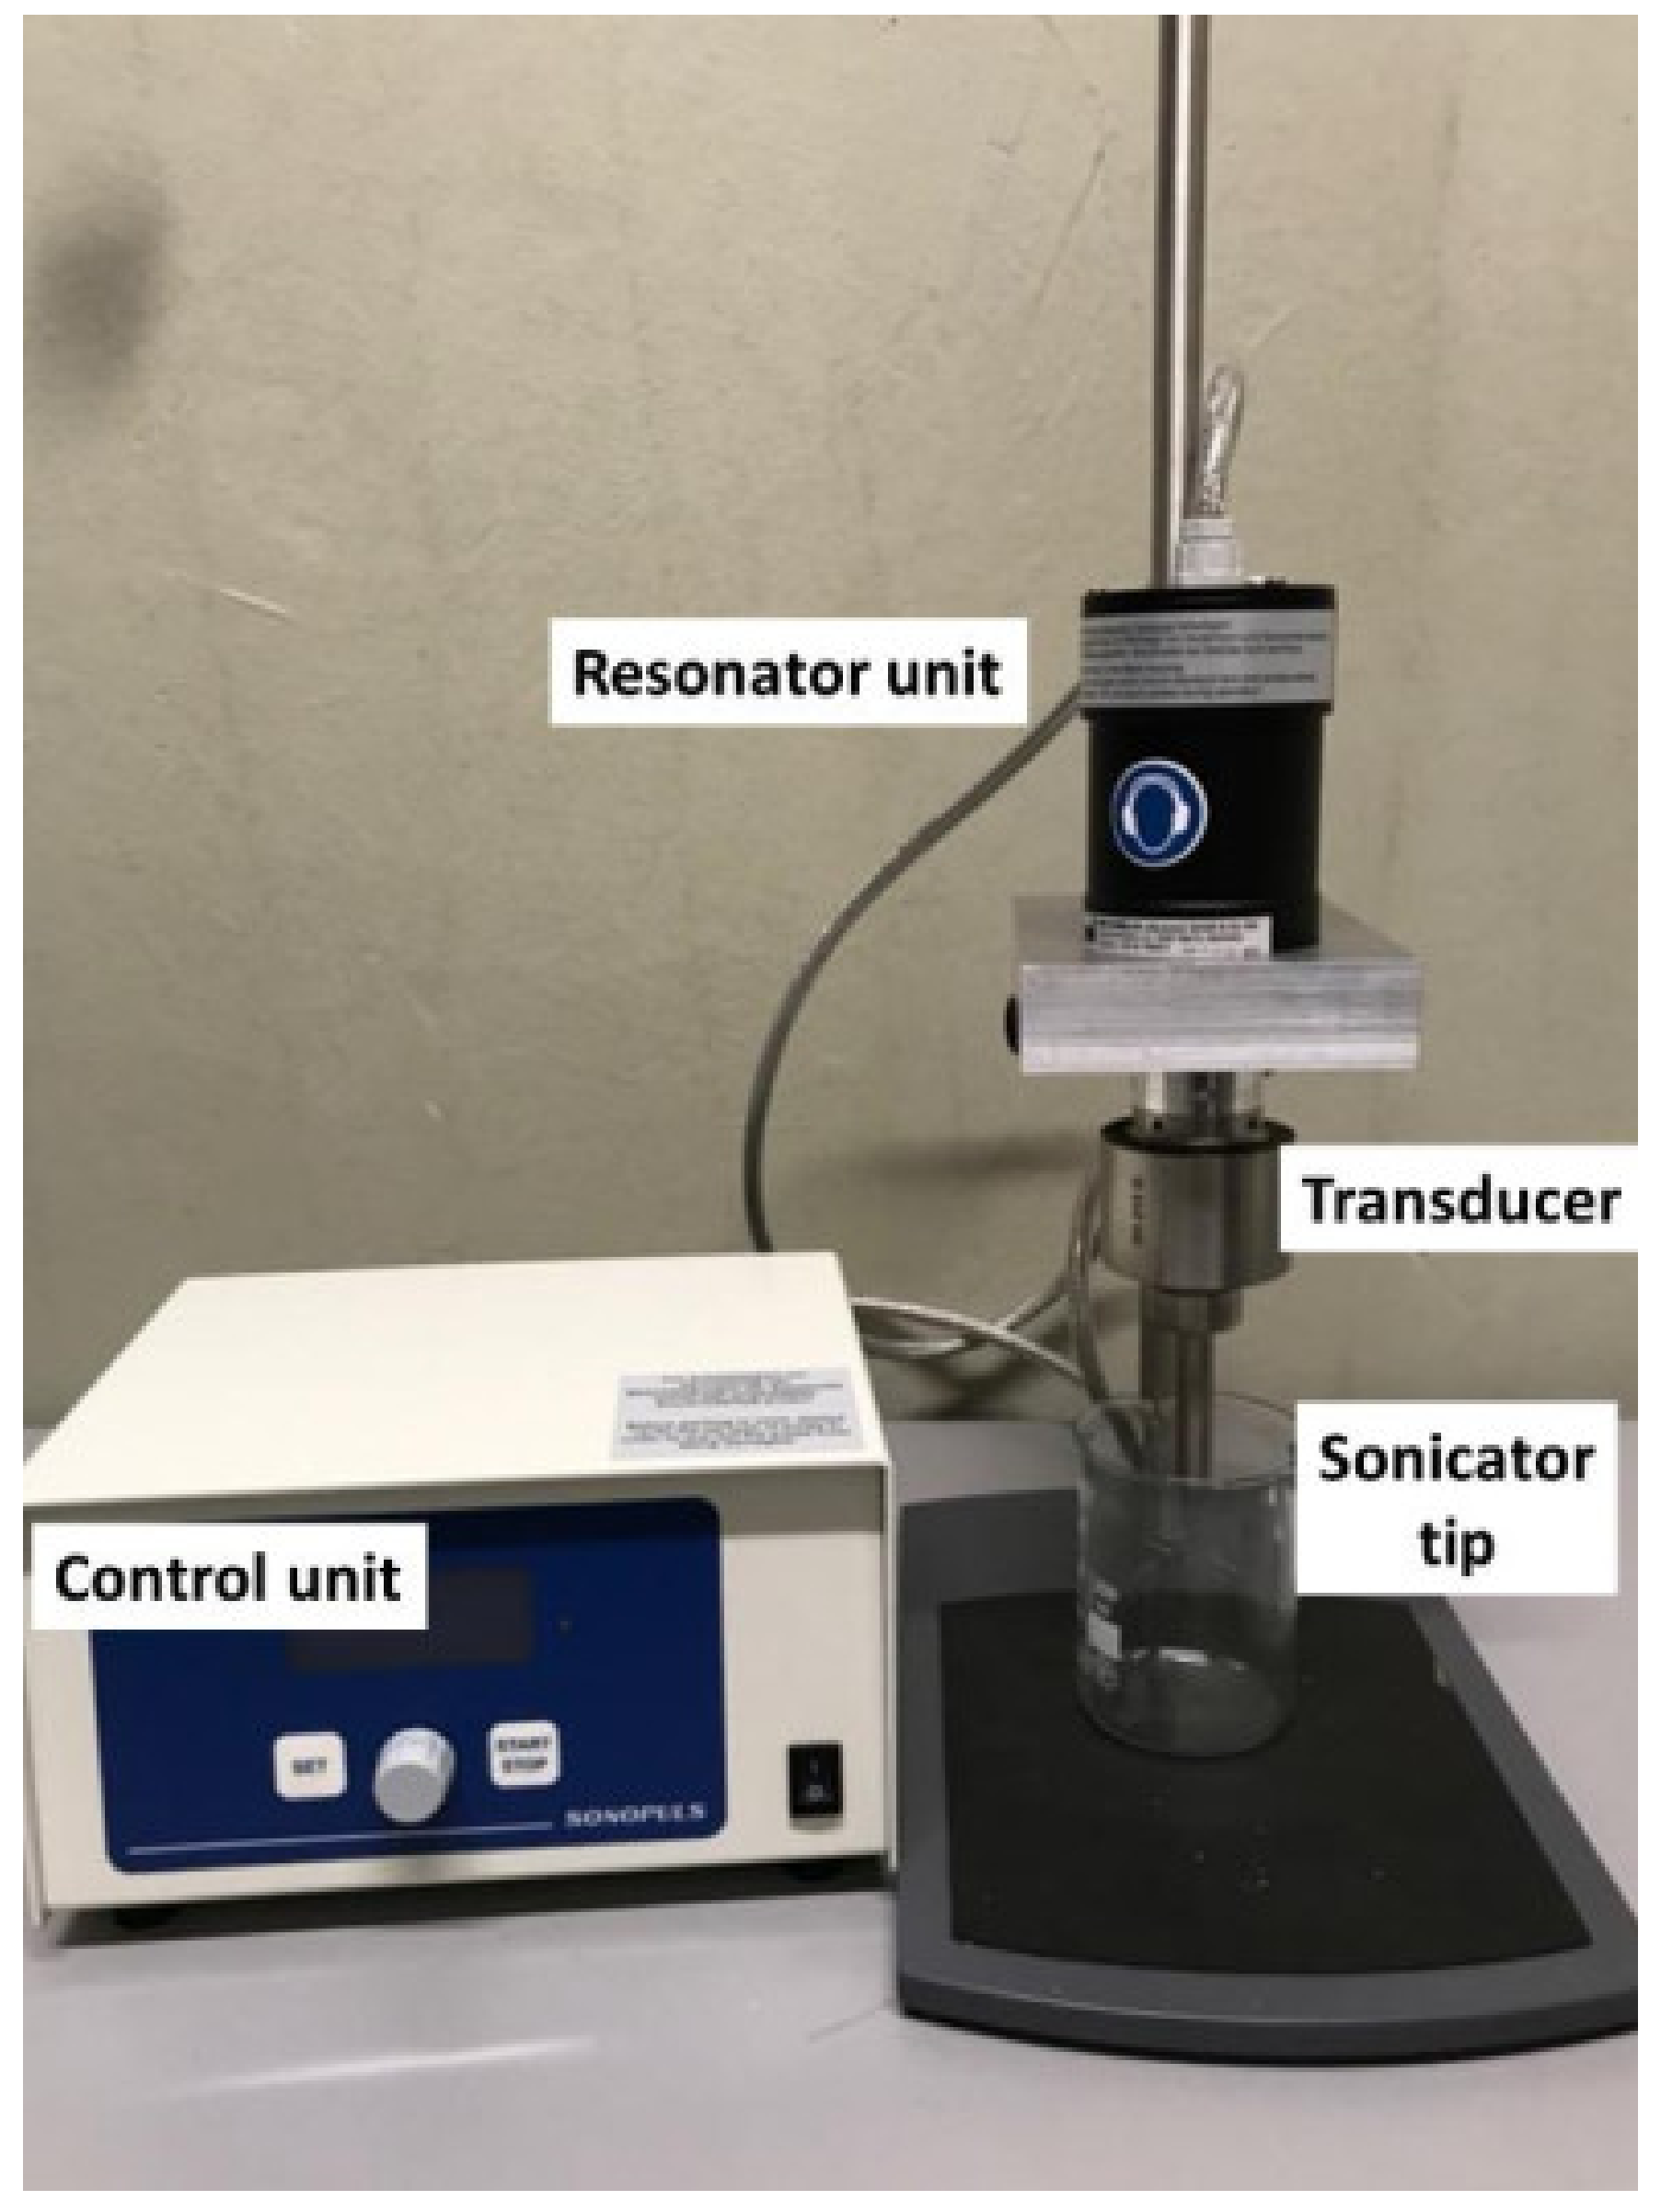
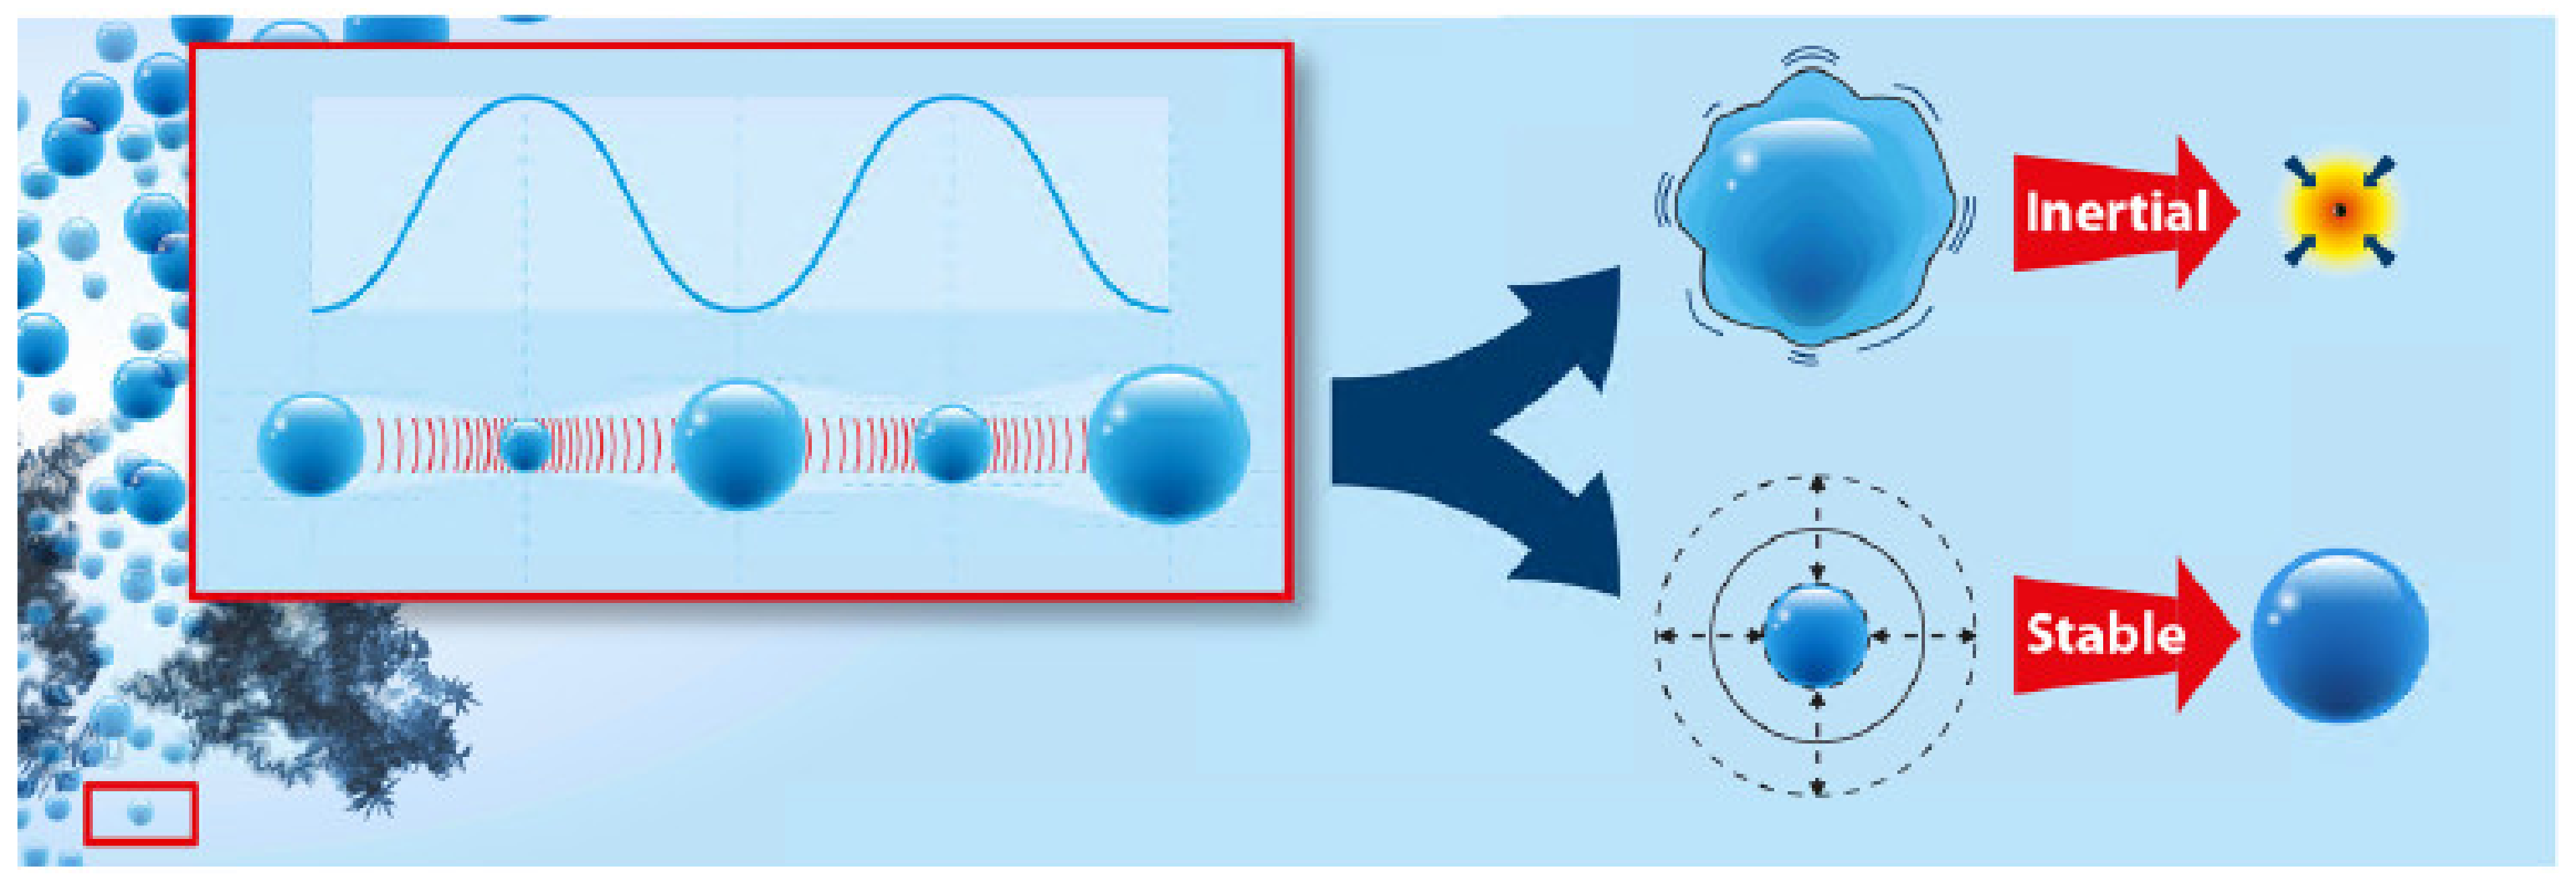
2.1.2. Ultrasonication—Basic Considerations
2.2. Effects of Ultrasonication
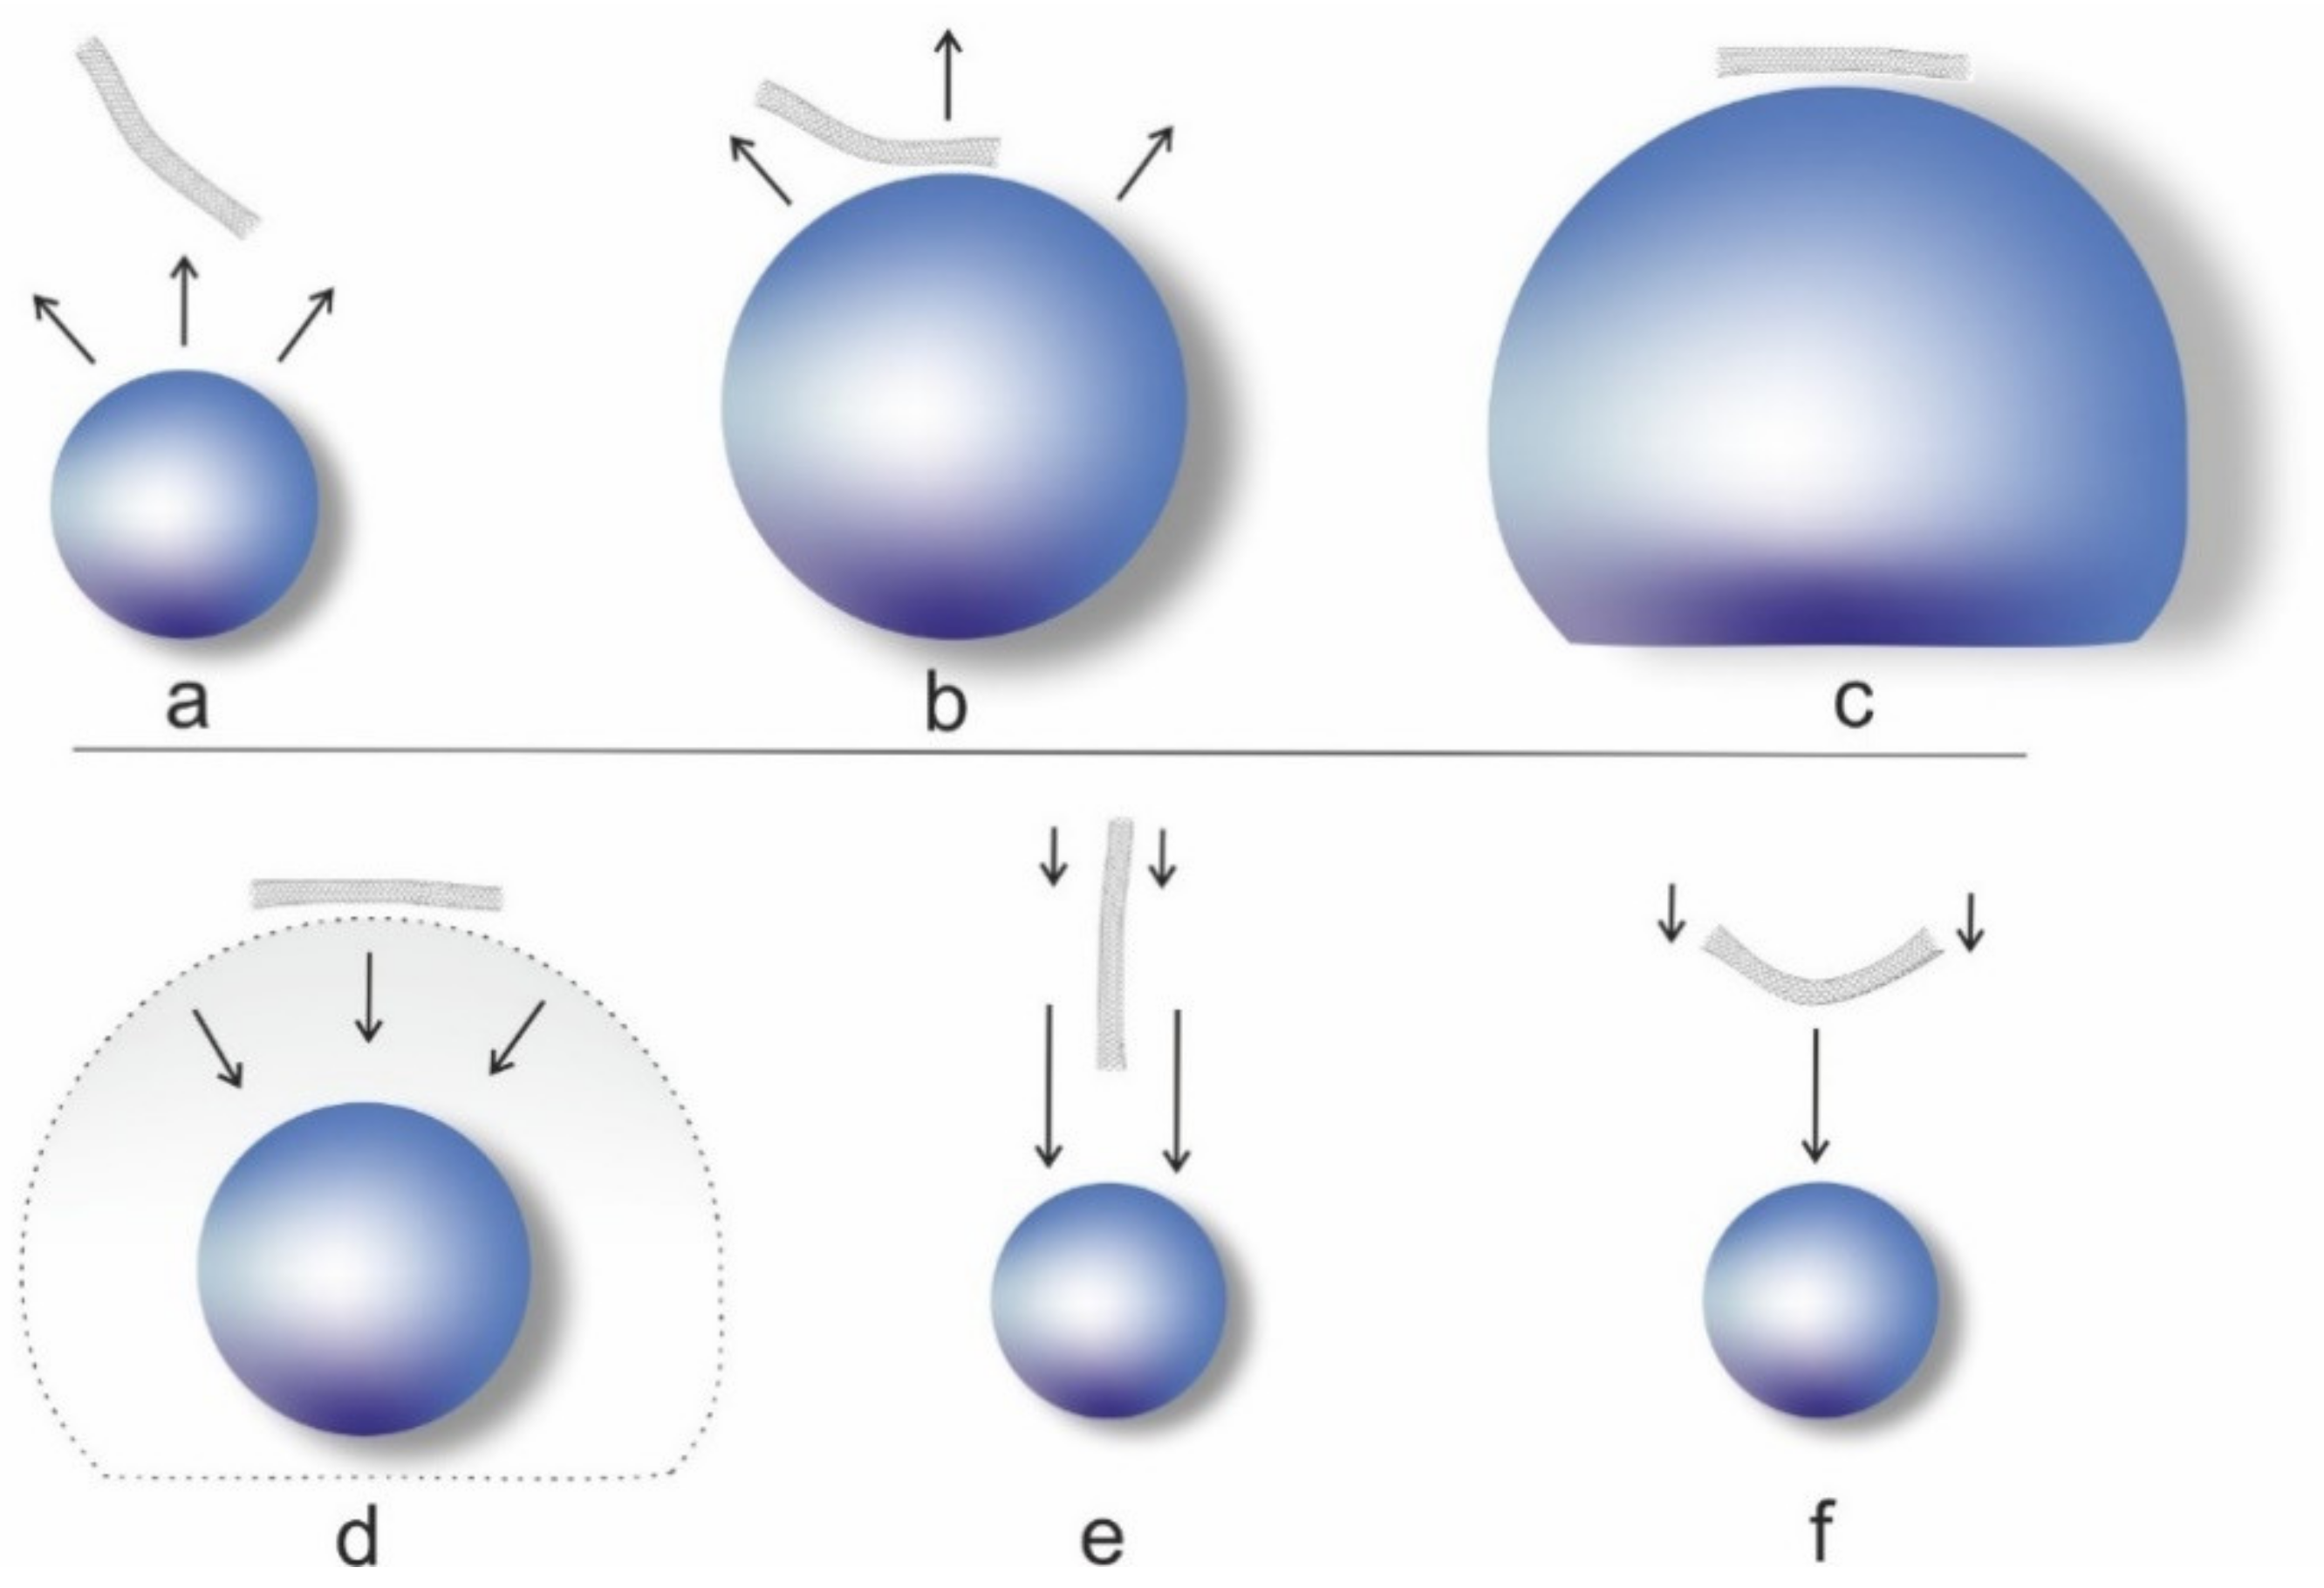
2.2.1. Damage Mechanism
2.2.2. Methods for Monitoring Damage
2.2.3. Methods for Monitoring the Dispersion State
2.3. Effects of Ultrasonication Documented in Literature
2.3.1. Reported Shortening of Nano-Fillers
2.3.2. Reported Defects and Changes in Surface Chemistry
2.3.3. Monitoring the Dispersion State of CNT
3. Discussion
3.1. General Remarks
- If and what damage is done to the nano particles (i.e., surface change or scission) and to what extent this happened.
- In this context, it might be considered if a better dispersion/break-up of agglomerates is perhaps partly caused by breaking the entangled fibers. These shorter and likely disentangled fiber fragments could easily be moved from the agglomerate, thus contributing to a better dispersion.
- Subsequently, it will be important to investigate if a change in material properties of a final product (e.g., a composite) is caused solely by better dispersion (i.e., smaller agglomerates and more well-dispersed nano-fibers) or if a shortening of a considerable number of nano-fibers has an additional effect on the results.
3.2. Perspectives
4. Conclusions
Author Contributions
Funding
Institutional Review Board Statement
Informed Consent Statement
Data Availability Statement
Acknowledgments
Conflicts of Interest
References
- Aamir, M.; Tolouei-Rad, M.; Giasin, K.; Nosrati, A. Recent advances in drilling of carbon fiber–reinforced polymers for aerospace applications: A review. Int. J. Adv. Manuf. Technol. 2019, 105, 2289–2308. [Google Scholar] [CrossRef]
- Sun, Q.; Zhou, G.; Meng, Z.; Jain, M.; Su, X. An integrated computational materials engineering framework to analyze the failure behaviors of carbon fiber reinforced polymer composites for lightweight vehicle applications. Compos. Sci. Technol. 2021, 202, 108560. [Google Scholar] [CrossRef] [PubMed]
- Al-Lami, A.; Hilmer, P.; Sinapius, M. Eco-efficiency assessment of manufacturing carbon fiber reinforced polymers (CFRP) in aerospace industry. Aerosp. Sci. Technol. 2018, 79, 669–678. [Google Scholar] [CrossRef]
- Sharma, K.; Shukla, M. Three-Phase Carbon Fiber Amine Functionalized Carbon Nanotubes Epoxy Composite: Processing, Characterisation, and Multiscale Modeling. J. Nanomater. 2014, 2014, 837492. [Google Scholar] [CrossRef]
- Nguyen-Tran, H.-D.; Hoang, V.-T.; Do, V.-T.; Chun, D.-M.; Yum, Y.-J. Effect of Multiwalled Carbon Nanotubes on the Mechanical Properties of Carbon Fiber-Reinforced Polyamide-6/Polypropylene Composites for Lightweight Automotive Parts. Materials 2018, 11, 429. [Google Scholar] [CrossRef]
- Dydek, K.; Latko-Durałek, P.; Boczkowska, A.; Sałaciński, M.; Kozera, R. Carbon Fiber Reinforced Polymers modified with thermoplastic nonwovens containing multi-walled carbon nanotubes. Compos. Sci. Technol. 2019, 173, 110–117. [Google Scholar] [CrossRef]
- Du, J.; Zhang, H.; Geng, Y.; Ming, W.; He, W.; Ma, J.; Cao, Y.; Li, X.; Liu, K. A review on machining of carbon fiber reinforced ceramic matrix composites. Ceram. Int. 2019, 45, 18155–18166. [Google Scholar] [CrossRef]
- Yadav, D.; Amini, F.; Ehrmann, A. Recent advances in carbon nanofibers and their applications–a review. Eur. Polym. J. 2020, 138, 109963. [Google Scholar] [CrossRef]
- Assi, L.; Alsalman, A.; Bianco, D.; Ziehl, H.; El-Khatib, J.; Bayat, M.; Hussein, F.H. Multiwall Carbon Nanotubes (MWCNTs) Dispersion & Mechanical Effects in OPC Mortar & Paste: A review. J. Build. Eng. 2021, 43, 102512. [Google Scholar] [CrossRef]
- Kundalwal, S.I.; Rathi, A. Improved mechanical and viscoelastic properties of CNT-composites fabricated using an innovative ultrasonic dual mixing technique. J. Mech. Behav. Mater. 2020, 29, 77–85. [Google Scholar] [CrossRef]
- Guadagno, L.; De Vivo, B.; Di Bartolomeo, A.; Lamberti, P.; Sorrentino, A.; Tucci, V.; Vertuccio, L.; Vittoria, V. Effect of functionalization on the thermo-mechanical and electrical behavior of multi-wall carbon nanotube/epoxy composites. Carbon 2011, 49, 1919–1930. [Google Scholar] [CrossRef]
- Gu, B.; Zhang, H.; Wang, B.; Zhang, X.; Feng, X.-Q. Mode-I pullout model of nanofibers with surface effects. Eng. Fract. Mech. 2015, 150, 115–125. [Google Scholar] [CrossRef]
- Shakil, U.A.; Hassan, S.B.A.; Yahya, M.Y.; Nauman, S. Mechanical properties of electrospun nanofiber reinforced/interleaved epoxy matrix composites—A review. Polym. Composite. 2020, 41, 2288–2315. [Google Scholar] [CrossRef]
- Abu Al-Rub, R.K.; Ashour, A.I.; Tyson, B.M. On the aspect ratio effect of multi-walled carbon nanotube reinforcements on the mechanical properties of cementitious nanocomposites. Constr. Build. Mater. 2012, 35, 647–655. [Google Scholar] [CrossRef]
- Tian, R.; Liang, S.; Li, G.; Zhang, Y.; Shi, L. Comparatively studying the ultrasound present in a mild two-stage approach on the content of functional groups in modified MWCNT. Chem. Phys. Lett. 2016, 650, 11–15. [Google Scholar] [CrossRef]
- Zhou, W.; Sasaki, S.; Kawasaki, A. Effective control of nanodefects in multiwalled carbon nanotubes by acid treatment. Carbon 2014, 78, 121–129. [Google Scholar] [CrossRef]
- Singer, G.; Siedlaczek, P.; Sinn, G.; Rennhofer, H.; Mičušík, M.; Omastová, M.; Unterlass, M.M.; Wendrinsky, J.; Milotti, V.; Fedi, F.; et al. Acid Free Oxidation and Simple Dispersion Method of MWCNT for High-Performance CFRP. Nanomaterials 2018, 8, 912. [Google Scholar] [CrossRef]
- Wang, S.; Liang, R.; Wang, B.; Zhang, C. Load-transfer in functionalized carbon nanotubes/polymer composites. Chem. Phys. Lett. 2008, 457, 371–375. [Google Scholar] [CrossRef]
- Ma, P.-C.; Zheng, Q.-B.; Mäder, E.; Kim, J.-Y. Behavior of load transfer in functionalized carbon nanotube/epoxy nanocomposites. Polymer 2012, 53, 6081–6088. [Google Scholar] [CrossRef]
- Ma, P.C.; Siddiqui, N.A.; Marom, G.; Kim, J.-Y. Dispersion and functionalization of carbon nanotubes for polymer-based nanocomposites: A review. Compos. Part. A Appl. Sci. 2010, 41, 1345–1367. [Google Scholar] [CrossRef]
- Yoon, H.; Yamashita, M.; Ata, S.; Futaba, D.N.; Yamada, T.; Hata, K. Controlling exfoliation in order to minimize damage during dispersion of long SWCNTs for advanced composites. Sci. Rep. 2014, 4, 1–8. [Google Scholar] [CrossRef] [PubMed]
- Thostenson, E.T.; Chou, T.W. Processing-structure-multi-functional property relationship in carbon nanotube/epoxy composites. Carbon 2006, 44, 3022–3029. [Google Scholar] [CrossRef]
- Singer, G.; Siedlaczek, P.; Sinn, G.; Kirner, P.H.; Schuller, R.; Wan-Wendner, R.; Lichtenegger, H.C. Vacuum Casting and Mechanical Characterization of Nanocomposites from Epoxy and Oxidized Multi-Walled Carbon Nanotubes. Molecules 2019, 24, 510. [Google Scholar] [CrossRef] [PubMed]
- Zanghellini, B.; Knaack, P.; Schörpf, S.; Semlitsch, K.-H.; Lichtenegger, H.C.; Praher, B.; Omastova, M.; Rennhofer, H. Solvent-Free Ultrasonic Dispersion of Nanofillers in Epoxy Matrix. Polymers 2021, 13, 308. [Google Scholar] [CrossRef]
- Blanch, A.J.; Lenehan, C.E.; Quinton, J.S. Parametric analysis of sonication and centrifugation variables for dispersion of single walled carbon nanotubes in aqueous solutions of sodium dodecylbenzene sulfonate. Carbon 2011, 49, 5213–5228. [Google Scholar] [CrossRef]
- Rio-Echevarria, I.M.; Ponti, J.; Urbán, P.; Gilliland, D. Vial sonication and ultrasonic immersion probe sonication to generate stable dispersions of multiwall carbon nanotubes for physico-chemical characterization and biological testing. Nanotoxicology 2019, 13, 923–937. [Google Scholar] [CrossRef]
- Ma, P.-C.; Mo, S.-Y.; Tang, B.-Z.; Kim, J.-Y. Dispersion, interfacial interaction and re-agglomeration of functionalized carbon nanotubes in epoxy composites. Carbon 2010, 48, 1824–1834. [Google Scholar] [CrossRef]
- Dehghan, M.; Al-Mahaidi, R.; Sbarski, I. Investigation of CNT Modification of Epoxy Resin in CFRP Strengthening Systems. Polym. Composite. 2016, 37, 1021–1033. [Google Scholar] [CrossRef]
- Larosa, C.; Patra, N.; Salerno, M.; Mikac, L.; Merijs Meri, R.; Ivanda, M. Preparation and characterization of polycarbonate/multiwalled carbon nanotube nanocomposites . Beilstein J. Nanotechnol. 2017, 8, 2026–2031. [Google Scholar] [CrossRef]
- Rezazadeh, V.; Pourhossaini, M.R.; Salimi, A. Effect of amine-functionalized dispersant on cure and electrical properties of carbon nanotube/epoxy nanocomposites. Prog. Org. Coat. 2017, 111, 389–394. [Google Scholar] [CrossRef]
- Kim, M.; Parl, Y.-B.; Okoli, O.I.; Zhang, C. Processing, characterization, and modeling of carbon nanotube-reinforced multiscale composites. Composite. Sci. Technol. 2009, 69, 335–342. [Google Scholar] [CrossRef]
- Cosmoiu, I.; Apostol, D.A.; Picu, C.R.; Constantinescu, D.M.; Sandu, M.; Sorohan, S. Influence of Filler Dispersion on the Mechanical Properties of Nanocomposites. Mater. Today Proc. 2016, 3, 953–958. [Google Scholar] [CrossRef]
- Tiwari, M.; Billing, B.K.; Bedi, H.S.; Agnihotri, P.K. Quantification of carbon nanotube dispersion and its correlation with mechanical and thermal properties of epoxy nanocomposites. J. Appl. Polym. Sci. 2020, 137, 48879. [Google Scholar] [CrossRef]
- Sabet, S.M.; Mahfuz, H.; Hashemi, J.; Nezakat, M.; Szpunar, J.A. Effects of sonication energy on the dispersion of carbon nanotubes in a vinyl ester matrix and associated thermo-mechanical properties. J. Mater. Sci. 2015, 50, 4729–4740. [Google Scholar] [CrossRef]
- Chen, S.J.; Zou, B.; Collins, F.; Zhao, X.L.; Majumber, M.; Duan, W.H. Predicting the influence of ultrasonication energy on the reinforcing efficiency of carbon nanotubes. Carbon 2014, 77, 1–10. [Google Scholar] [CrossRef]
- Hennrich, F.; Krupke, R.; Arnold, K.; Stütz, J.A.R.; Lebedkin, S.; Koch, T.; Schimmel, T.; Kappes, M.M. The mechanism of cavitation-induced scission of single-walled carbon nanotubes. J. Phys. Chem. B 2007, 111, 1932–1937. [Google Scholar] [CrossRef]
- Lucas, A.; Zakri, C.; Maugey, M.; Pasquali, M.; van der Schoot, P.; Poulin, P. Kinetics of Nanotube and Microfiber Scission under Sonication. J. Phys. Chem. C 2009, 113, 20599–20605. [Google Scholar] [CrossRef]
- Sesis, A.; Hodnett, M.; Memoli, G.; Wain, A.J.; Jurewicz, I.; Dalton, A.B.; Carey, J.D.; Hinds, G. Influence of Acoustic Cavitation on the Controlled Ultrasonic Dispersion of Carbon Nanotubes. J. Phys. Chem. B 2013, 117, 15141–15150. [Google Scholar] [CrossRef]
- Montazeri, A.; Chitsazzadeh, M. Effect of sonication parameters on the mechanical properties of multi-walled carbon nanotube/epoxy composites. Mater. Des. 2014, 56, 500–508. [Google Scholar] [CrossRef]
- De Siqueira, J.E.L.; Gleize, P.J.P. Effect of carbon nanotubes sonication on mechanical properties of cement pastes. Rev. Ibracon. Estrut. Mater. 2020, 13, 455–463. [Google Scholar] [CrossRef]
- Zou, B.; Chen, S.J.; Korayem, A.H.; Collins, F.; Wang, C.M.; Duan, W.H. Effect of ultrasonication energy on engineering properties of carbon nanotube reinforced cement pastes. Carbon 2015, 85, 212–220. [Google Scholar] [CrossRef]
- Olowojoba, G.; Sathyanarayana, S.; Caglar, B.; Kiss-Pataki, B.; Mikonsaari, I.; Hübner, C.; Elsner, P. Influence of process parameters on the morphology, rheological and dielectric properties of three-roll-milled multiwalled carbon nanotube/epoxy suspensions. Polymer 2013, 54, 188–198. [Google Scholar] [CrossRef]
- Jayaraman, D.J. Effect of High Energy Ball Milling on Reinforcement of MWCNTs in Magnesium Nano Composites. Int. J. Adv. Sci. Technol. 2020, 29, 4174–4179. [Google Scholar]
- Krause, B.; Villmow, T.; Boldt, R.; Mende, M.; Petzold, G.; Pötschke, P. Influence of dry grinding in a ball mill on the length of multiwalled carbon nanotubes and their dispersion and percolation behaviour in melt mixed polycarbonate composites. Compos. Sci. Technol. 2011, 71, 1145–1153. [Google Scholar] [CrossRef]
- Choi, H.J.; Shin, J.H.; Bae, D.H. The effect of milling conditions on microstructures and mechanical properties of Al/MWCNT composites. Compos. Part A Appl. Sci. 2012, 43, 1061–1072. [Google Scholar] [CrossRef]
- Awotunde, M.A.; Adegbenjo, A.O.; Ayodele, O.O.; Okoro, A.M.; Shongwe, M.B.; Olubambi, P.A. Influence of ball milling parameters on the dispersion characteristics and structural integrity of MWCNTs in nickel aluminide matrix powders. Particul. Sci. Technol. 2021, 39, 298–311. [Google Scholar] [CrossRef]
- Gorrasi, G.; Sarno, M.; Di Bartolomeo, A.; Sannino, D.; Ciambelli, P.; Vittoria, V. Incorporation of carbon nanotubes into polyethylene by high energy ball milling: Morphology and physical properties. J. Polym. Sci. Pol. Phys. 2007, 45, 597–606. [Google Scholar] [CrossRef]
- Naumov, A.V.; Tsyboulski, D.A.; Bachilo, S.M.; Weisman, R.B. Length-dependent optical properties of single-walled carbon nanotube samples. Chem. Phys. 2013, 422, 255–263. [Google Scholar] [CrossRef]
- Huang, A.; Wang, H.; Ellingham, T.; Peng, X.; Turng, L.-S. An improved technique for dispersion of natural graphite particles in thermoplastic polyurethane by sub-critical gas-assisted processing. Compo Sci. Technol. 2019, 182, 107783. [Google Scholar] [CrossRef]
- Yokozeki, T.; Iwahori, Y.; Ishibashi, M.; Yanagisawa, T.; Imai, K.; Arai, M.; Takahashi, T.; Enomoto, K. Fracture toughness improvement of CFRP laminates by dispersion of cup-stacked carbon nanotubes. Compos. Sci. Technol. 2009, 69, 2268–2273. [Google Scholar] [CrossRef]
- Huang, Y.Y.; Terentjev, E.M. Dispersion of Carbon Nanotubes: Mixing, Sonication, Stabilization, and Composite Properties. Polymers 2012, 4, 275–295. [Google Scholar] [CrossRef]
- Dehane, A.; Merouani, S.; Hamdaoui, O.; Alghyamah, A. A comprehensive numerical analysis of heat and mass transfer phenomenons during cavitation sono-process. Ultrason. Sonochem. 2021, 73, 105498. [Google Scholar] [CrossRef]
- Bhangu, S.K.; Ashokkumar, M. Theory of Sonochemistry; Springer International Publishing: Cham, Switzerland, 2017. [Google Scholar]
- Ashokkumar, M. The characterization of acoustic cavitation bubbles—An overview. Ultrason. Sonochem. 2011, 18, 864–872. [Google Scholar] [CrossRef] [PubMed]
- Betts, J.N.; Johnson, M.G.; Rygiewicz, P.T.; King, G.A.; Andersen, C.P. Potential for metal contamination by direct sonication of nanoparticle suspensions. Environ. Toxicol. Chem. 2013, 32, 889–893. [Google Scholar] [CrossRef] [PubMed]
- Dassios, K.G.; Alafogianni, P.; Antiohos, S.K.; Leptokaridis, C.; Nektaria-Marianthi Barkoula, N.-M.; Matikas, T.E. Optimization of Sonication Parameters for Homogeneous Surfactant-Assisted Dispersion of Multiwalled Carbon Nanotubes in Aqueous Solutions. J. Phys. Chem. C 2015, 119, 7506–7516. [Google Scholar] [CrossRef]
- Kim, G.M.; Kil, T.; Lee, H.K. A novel physicomechanical approach to dispersion of carbon nanotubes in polypropylene composites. Compos. Struct. 2021, 258, 113377. [Google Scholar] [CrossRef]
- Liu, L.Q.; Wagner, H.D. Rubbery and glassy epoxy resins reinforced with carbon nanotubes. Compos. Sci. Technol. 2005, 65, 1861–1868. [Google Scholar] [CrossRef]
- Chang, J.Y.; Wu, H.-Y.; Hwang, G.-L.; Su, T.-Y. Ultrasonication-assisted surface functionalization of double-walled carbon nanotubes with azobis-type radical initiators. J. Mater. Chem. 2008, 18, 3972–3976. [Google Scholar] [CrossRef]
- Han, S.; Meng, Q.; Araby, S.; Liu, T.; Memiral, M. Mechanical and electrical properties of graphene and carbon nanotube reinforced epoxy adhesives: Experimental and numerical analysis. Compos. Part A Appl. Sci. Manuf. 2019, 120, 116–126. [Google Scholar] [CrossRef]
- Ganapathi, J.I.; Lee, S.S.; Kalyon, D.M.; Fisher, F.T. Impact of ultrasonication on carbon nanotube demixing and damage in polymer nanocomposites. J. Appl. Polym. Sci. 2020, 137, 49370. [Google Scholar] [CrossRef]
- Pagani, G.; Green, M.J.; Poulin, P.; Pasquali, M. Competing mechanisms and scaling laws for carbon nanotube scission by ultrasonication. Pooc. Natl. Acad. Sci. USA 2012, 109, 11599–11604. [Google Scholar] [CrossRef] [PubMed]
- Taurozzi, J.S.; Hackley, V.A.; Wiesner, M. Preparation of nanoparticle dispersions from powdered material using ultrasonic disruption. NIST Spec. Publ. 2012, 1200, 1200–1202. [Google Scholar] [CrossRef]
- Chapkin, W.A.; Wenderott, J.K.; Green, P.F.; Taub, A.I. Length dependence of electrostatically induced carbon nanotube alignment. Carbon 2018, 131, 275–282. [Google Scholar] [CrossRef]
- Huang, Y.Y.; Knowles, T.P.J.; Terentjev, E.M. Strength of Nanotubes, Filaments, and Nanowires From Sonication-Induced Scission. Adv. Mater. 2009, 21, 3945–3948. [Google Scholar] [CrossRef]
- Jang, J.-W.; Lee, C.E.; Lee, C.J. Exponential decrease of scission length and low tensile strength of bamboo-shaped multi-walled carbon nanotubes under ultrasonication. Curr. Appl. Phys. 2017, 17, 507–512. [Google Scholar] [CrossRef]
- Fuge, R.; Liebscher, M.; Schröfl, C.; Oswald, S.; Leonhardt, A.; Büchner, B.; Mechtcherine, V. Fragmentation characteristics of undoped and nitrogen-doped multiwalled carbon nanotubes in aqueous dispersion in dependence on the ultrasonication parameters. Diam. Relat. Mater. 2016, 66, 126–134. [Google Scholar] [CrossRef]
- Islam, M.F.; Rojas, E.; Bergey, D.M.; Johnson, A.T.; Yodh, A.G. High weight fraction surfactant solubilization of single-wall carbon nanotubes in water. Nano Lett. 2003, 3, 269–273. [Google Scholar] [CrossRef]
- Yu, H.B.; Hermann, S.; Schulz, S.E.; Gessner, T.; Dong, Z.; Li, W.J. Optimizing sonication parameters for dispersion of single-walled carbon nanotubes. Chem. Phys. 2012, 408, 11–16. [Google Scholar] [CrossRef]
- Arrigo, R.; Teresi, R.; Gambarotti, C.; Parisi, F.; Lazzara, G.; Dintcheva, N.T. Sonication-Induced Modification of Carbon Nanotubes: Effect on the Rheological and Thermo-Oxidative Behaviour of Polymer-Based Nanocomposites. Materials 2018, 11, 383. [Google Scholar] [CrossRef]
- Lu, K.L.; Lago, R.M.; Chen, Y.K.; Green, M.L.H.; Harris, P.J.F.; Tsang, S.C. Mechanical damage of carbon nanotubes by ultrasound. Carbon 1996, 34, 814–816. [Google Scholar] [CrossRef]
- Le, C.M.Q.; Cao, X.T.; Lim, K.T. Ultrasound-promoted direct functionalization of multi-walled carbon nanotubes in water via Diels-Alder “click chemistry”. Ultrason. Sonochem. 2017, 39, 321–329. [Google Scholar] [CrossRef] [PubMed]
- Martín, O.; Gutierrez, H.R.; Maroto-Valiente, A.; Terrones, M.; Blanco, T.; Baselga, J. An efficient method for the carboxylation of few-wall carbon nanotubes with little damage to their sidewalls. Mater. Chem. Phys. 2013, 140, 499–507. [Google Scholar] [CrossRef]
- Siedlaczek, P. Charakterisierung Oxidierter und Funktionalisierter Carbon-Nanotubes für den Einsatz in Kohlenstofffaser-Kompositen. Master’s Thesis, Universität für Bodenkultur Wien, Vienna, Austria, 2018. [Google Scholar]
- Rausch, J.; Zhuang, R.C.; Mäder, E. Surfactant assisted dispersion of functionalized multi-walled carbon nanotubes in aqueous media. Compos. Part A Appl. Sci. Manuf. 2010, 41, 1038–1046. [Google Scholar] [CrossRef]
- Vichchulada, P.; Cauble, M.A.; Abdi, E.A.; Obi, E.I.; Zhang, Q.; Lay, M.D. Sonication Power for Length Control of Single-Walled Carbon Nanotubes in Aqueous Suspensions Used for 2-Dimensional Network Formation. J. Phys. Chem. 2010, 114, 12490–12495. [Google Scholar] [CrossRef]
- Njuguna, J.; Vanli, O.A.; Liang, R. A Review of Spectral Methods for Dispersion Characterization of Carbon Nanotubes in Aqueous Suspensions. J. Spectrosc. 2015, 2015, 463156. [Google Scholar] [CrossRef]
- Badaire, S.; Poulin, P.; Maugey, M.; Zakri, C. In situ measurements of nanotube dimensions in suspensions by depolarized dynamic light scattering. Langmuir 2004, 20, 10367–10370. [Google Scholar] [CrossRef]
- Potschke, P.; Fornes, T.D.; Paul, D.R. Rheological behavior of multiwalled carbon nanotube/polycarbonate composites. Polymer 2002, 43, 3247–3255. [Google Scholar] [CrossRef]
- Kim, J.A.; Seong, D.G.; Kang, T.J.; Youn, J.R. Effects of surface modification on rheological and mechanical properties of CNT/epoxy composites. Carbon 2006, 44, 1898–1905. [Google Scholar] [CrossRef]
- Song, Y.S. Rheological characterization of carbon nanotubes/poly(ethylene oxide) composites. Rheol. Acta 2006, 46, 231–238. [Google Scholar] [CrossRef]
- Wang, G.L.; Guo, B.; Xu, J.; Li, R. Rheology, Crystallization Behaviors, and Thermal Stabilities of Poly(butylene succinate)/Pristine Multiwalled Carbon Nanotube Composites Obtained by Melt Compounding. J. Appl. Polym. Sci. 2011, 121, 59–67. [Google Scholar] [CrossRef]
- Fan, Z.H.; Advani, S.G. Rheology of multiwall carbon nanotube suspensions. J. Rheol. 2007, 51, 585–604. [Google Scholar] [CrossRef]
- Chang, T.-E.; Kisliuk, A.; Rhodes, S.M.; Brittain, W.J.; Sokolov, A.P. Conductivity and mechanical properties of well-dispersed single-wall carbon nanotube/polystyrene composite. Polymer 2006, 47, 7740–7746. [Google Scholar] [CrossRef]
- Ali, S.S.; Shahabuddin, M.; Asif, M. In Situ Monitoring of Dispersion Dynamics of Carbon Nanotubes during Sonication Using Electrical Conductivity Measurements. J. Nanomater. 2015, 2015, 479053. [Google Scholar] [CrossRef]
- Tan, Y.Q.; Resasco, D.E. Dispersion of single-walled carbon nanotubes of narrow diameter distribution. J. Phys. Chem. B 2005, 109, 14454–14460. [Google Scholar] [CrossRef] [PubMed]
- Wu, Z.Q.; Mitra, S. Length reduction of multi-walled carbon nanotubes via high energy ultrasonication and its effect on their dispersibility. J. Nanopart. Res. 2014, 16, 2563. [Google Scholar] [CrossRef]
- Ruan, B.L.; Jacobi, A.M. Ultrasonication effects on thermal and rheological properties of carbon nanotube suspensions. Nanoscale Res. Lett. 2012, 7, 1–14. [Google Scholar] [CrossRef]
- Hilding, J.; Grulke, E.A.; Zhang, Z.G.; Lockwood, F. Dispersion of Carbon Nanotubes in Liquids. J. Disper. Sci. Technol. 2003, 24, 1–41. [Google Scholar] [CrossRef]
- Chun, J.; Choi, J.H.; Lee, N.; Shin, K.; Moon, J.-H.; Seo, Y.-S. Size Separation of Single-Wall Carbon Nanotubes by Flow-Field Flow Fractionation. Anal. Chem. 2008, 80, 2514–2523. [Google Scholar] [CrossRef]
- Jung, W.R.; Choi, J.H.; Lee, N.; Shin, K.; Moon, J.H.; Seo, Y.S. Reduced damage to carbon nanotubes during ultrasound-assisted dispersion as a result of supercritical-fluid treatment. Carbon 2012, 50, 633–636. [Google Scholar] [CrossRef]
- Cheng, Q.H.; Debnath, S.; Gregan, E.; Byrne, H.J. Ultrasound-Assisted SWNTs Dispersion: Effects of Sonication Parameters and Solvent Properties. J. Phys. Chem. C 2010, 114, 8821–8827. [Google Scholar] [CrossRef]
- Koh, B.; Cheng, W. The Impact of Sonication on the Surface Quality of Single-Walled Carbon Nanotubes. J. Pharm. Sci. 2015, 104, 2594–2599. [Google Scholar] [CrossRef][Green Version]
- Mukhopadhyay, K.; Dwivedi, C.D.; Mathur, G.N. Conversion of carbon nanotubes to carbon nanofibers by sonication. Carbon 2002, 40, 1373–1376. [Google Scholar] [CrossRef]


| Method | Application | Citation |
|---|---|---|
| TEM | CNT integrity, walls | [15,40,61,66,67] |
| SEM | Agglomerates, length, diameter, | [20,35,39,41,57,58,61,65,66] |
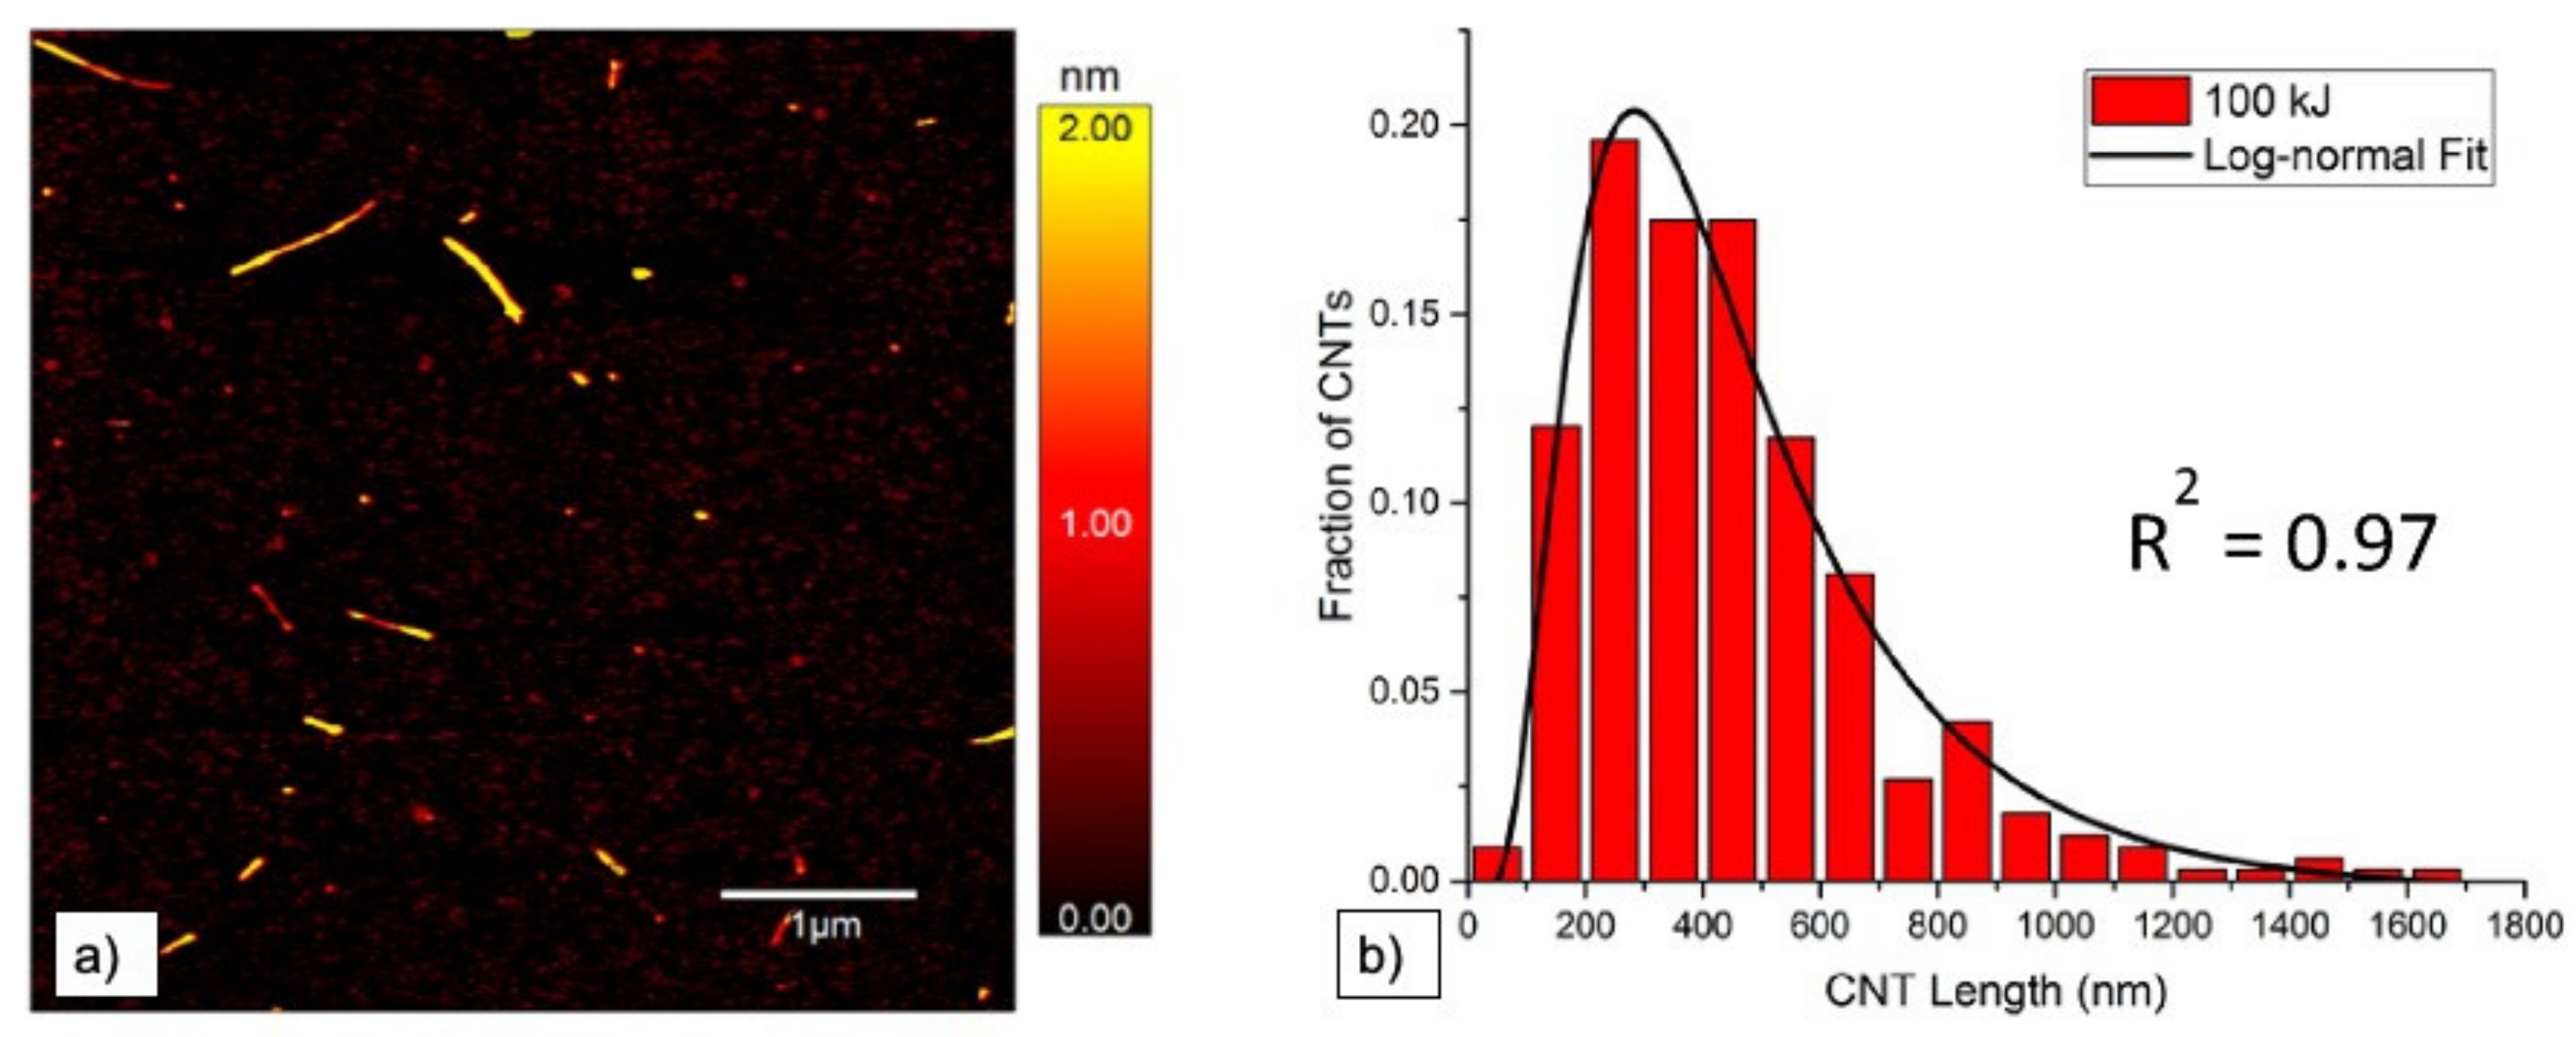
| AFM | Length diameter distribution | [25,36,48,64,68,69] |
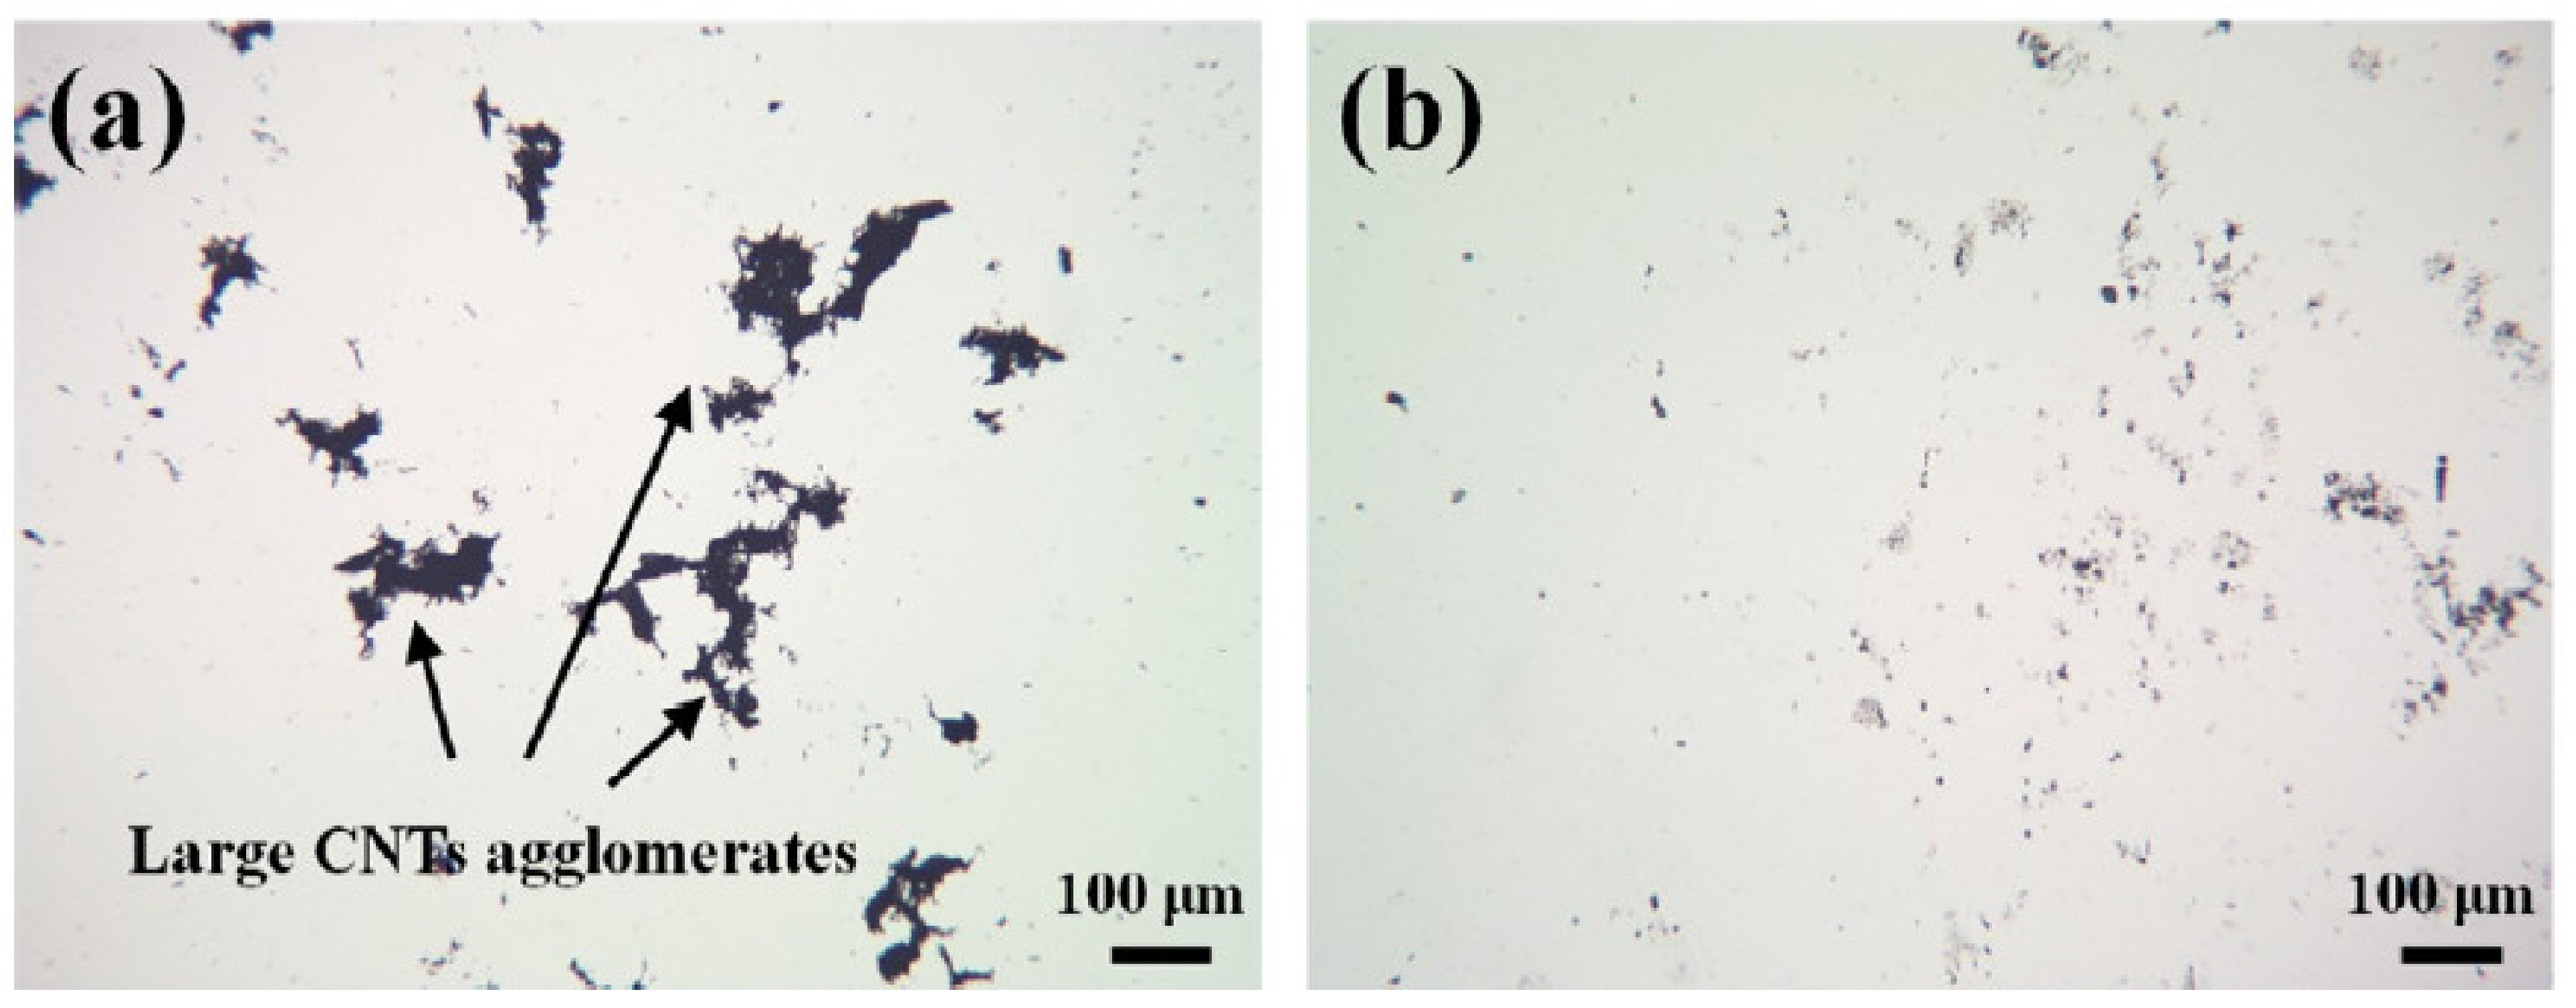
| LM | Agglomerate size | [20,24,41,61] |
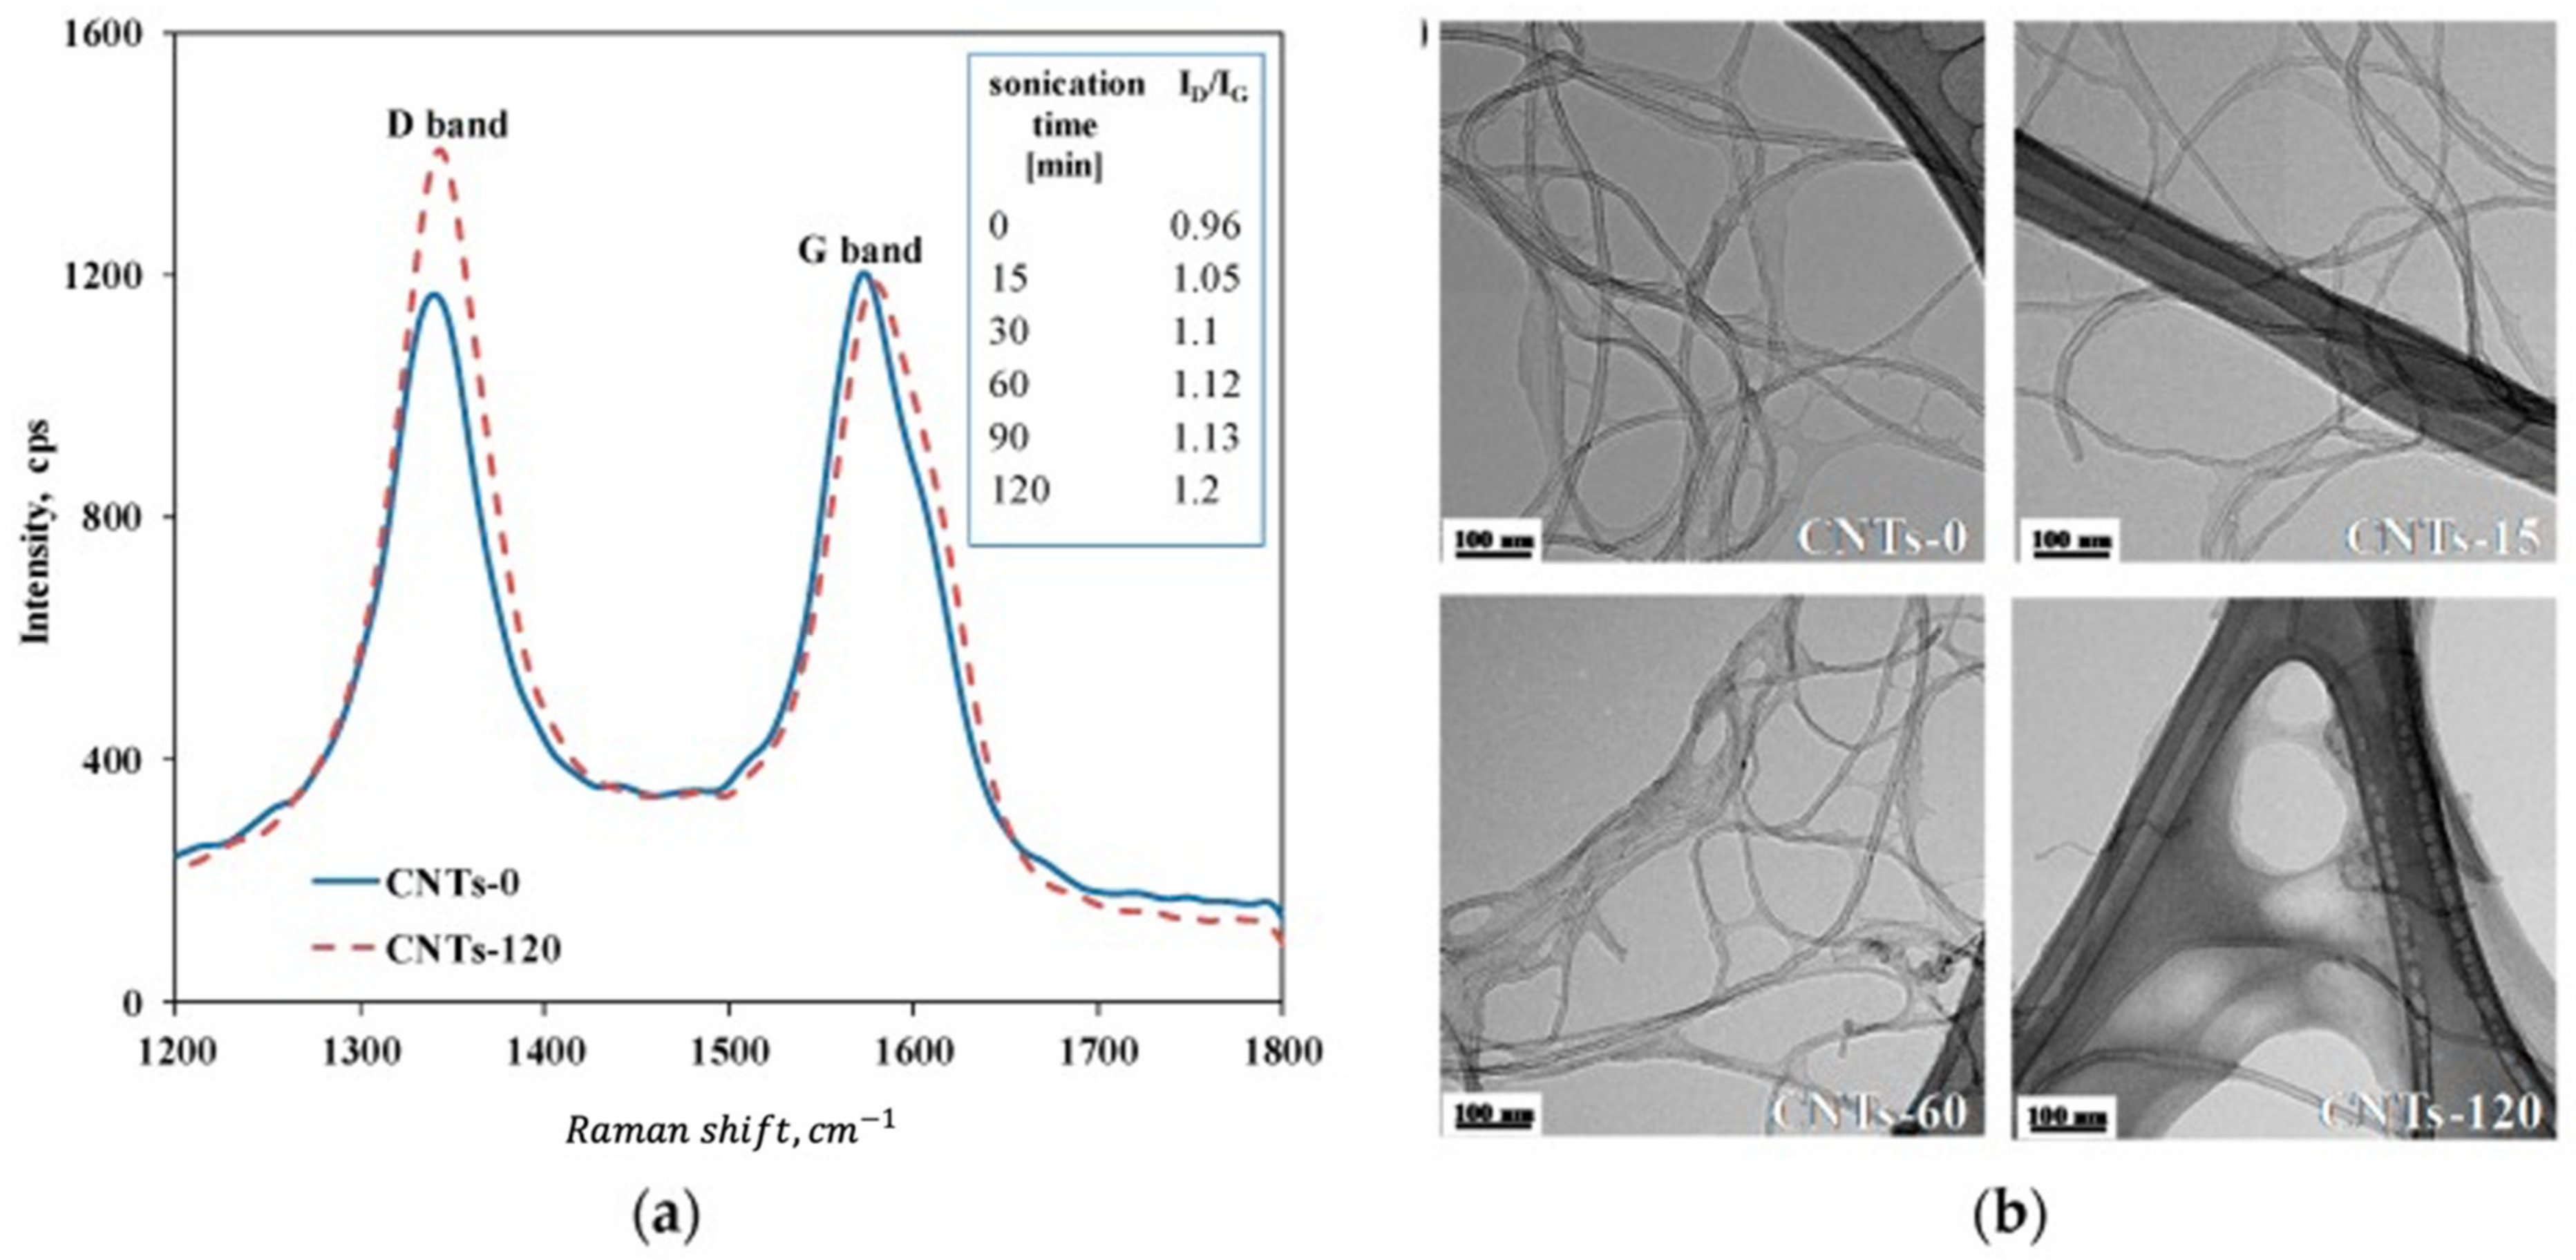
| Raman | Surface damage Amount of single CNT vs. bundles | [15,25,66,70,71] [84] |
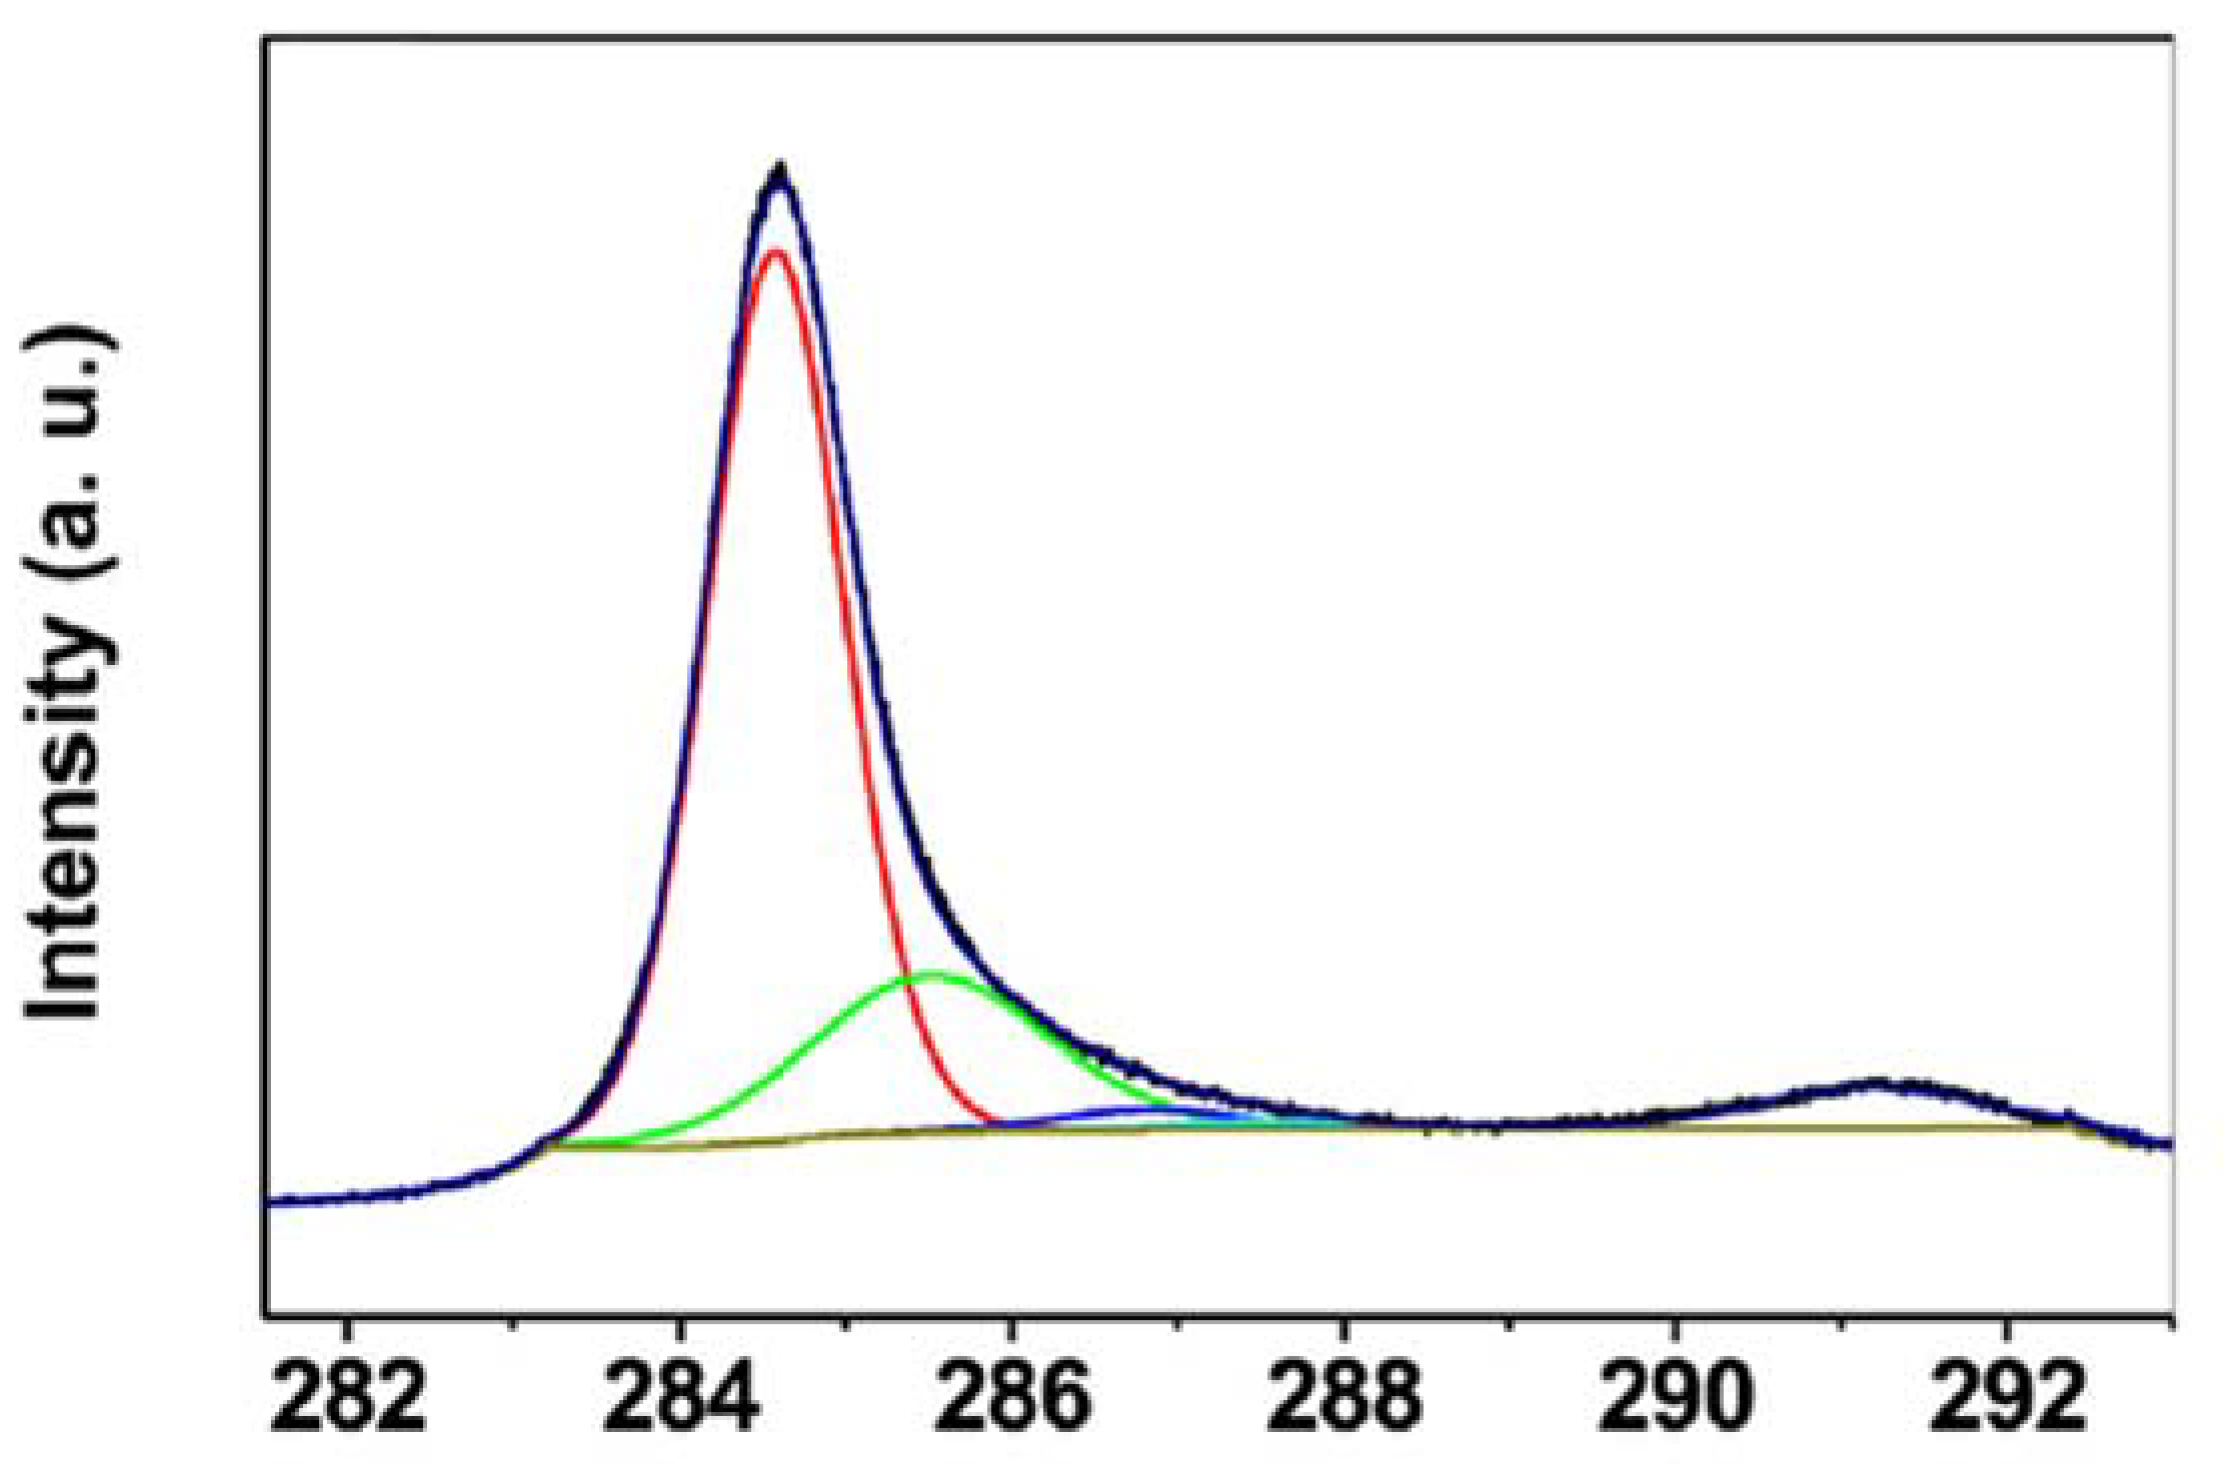
| XPS | Chemical bonds, side groups, oxidation | [15,17,67,72,73] |
| UV–vis-NIR | Amount of single CNT vs. bundles | [25,35,36,38,48,69,75,76,77,86] |
| FTIR | Surface chemistry | [15,27,75] |
| DLS | Agglomerates and bundles size/indirect single CNT | [36,56,78] |
| XRD | CNT integrity | [72,74] |
| Rheology | Amount of well dispersed CNT | [24,61,79,83] |
| Conductivity | Dispersion state | [61,85] |
| Dispersion Medium | Nanofiller Type | Input Power | Sonication Time/Energy Input | Analyzing Tool | Length Reduction | Measured Dimension | Citation |
|---|---|---|---|---|---|---|---|
| Distilled water + polyacrylate-based dispersing agent | MWCNT | 150 W | 25 J/mL–400 J/mL | SEM | 265 nm (75 J/mL)–216 nm (400 J/mL); histogram peak | Length | [35] |
| Milli-Q water | Carboxylated MWCNT | 100 W | 7 h | SEM | 902 nm (0 min)–152 nm | Length | [87] |
| Distilled water | MWCNT | 260 W, ultrasonic bath | 15–120 min | DLS | 400 nm (0 min)–50 nm (90 min) | Length calculated from Dh | [70] |
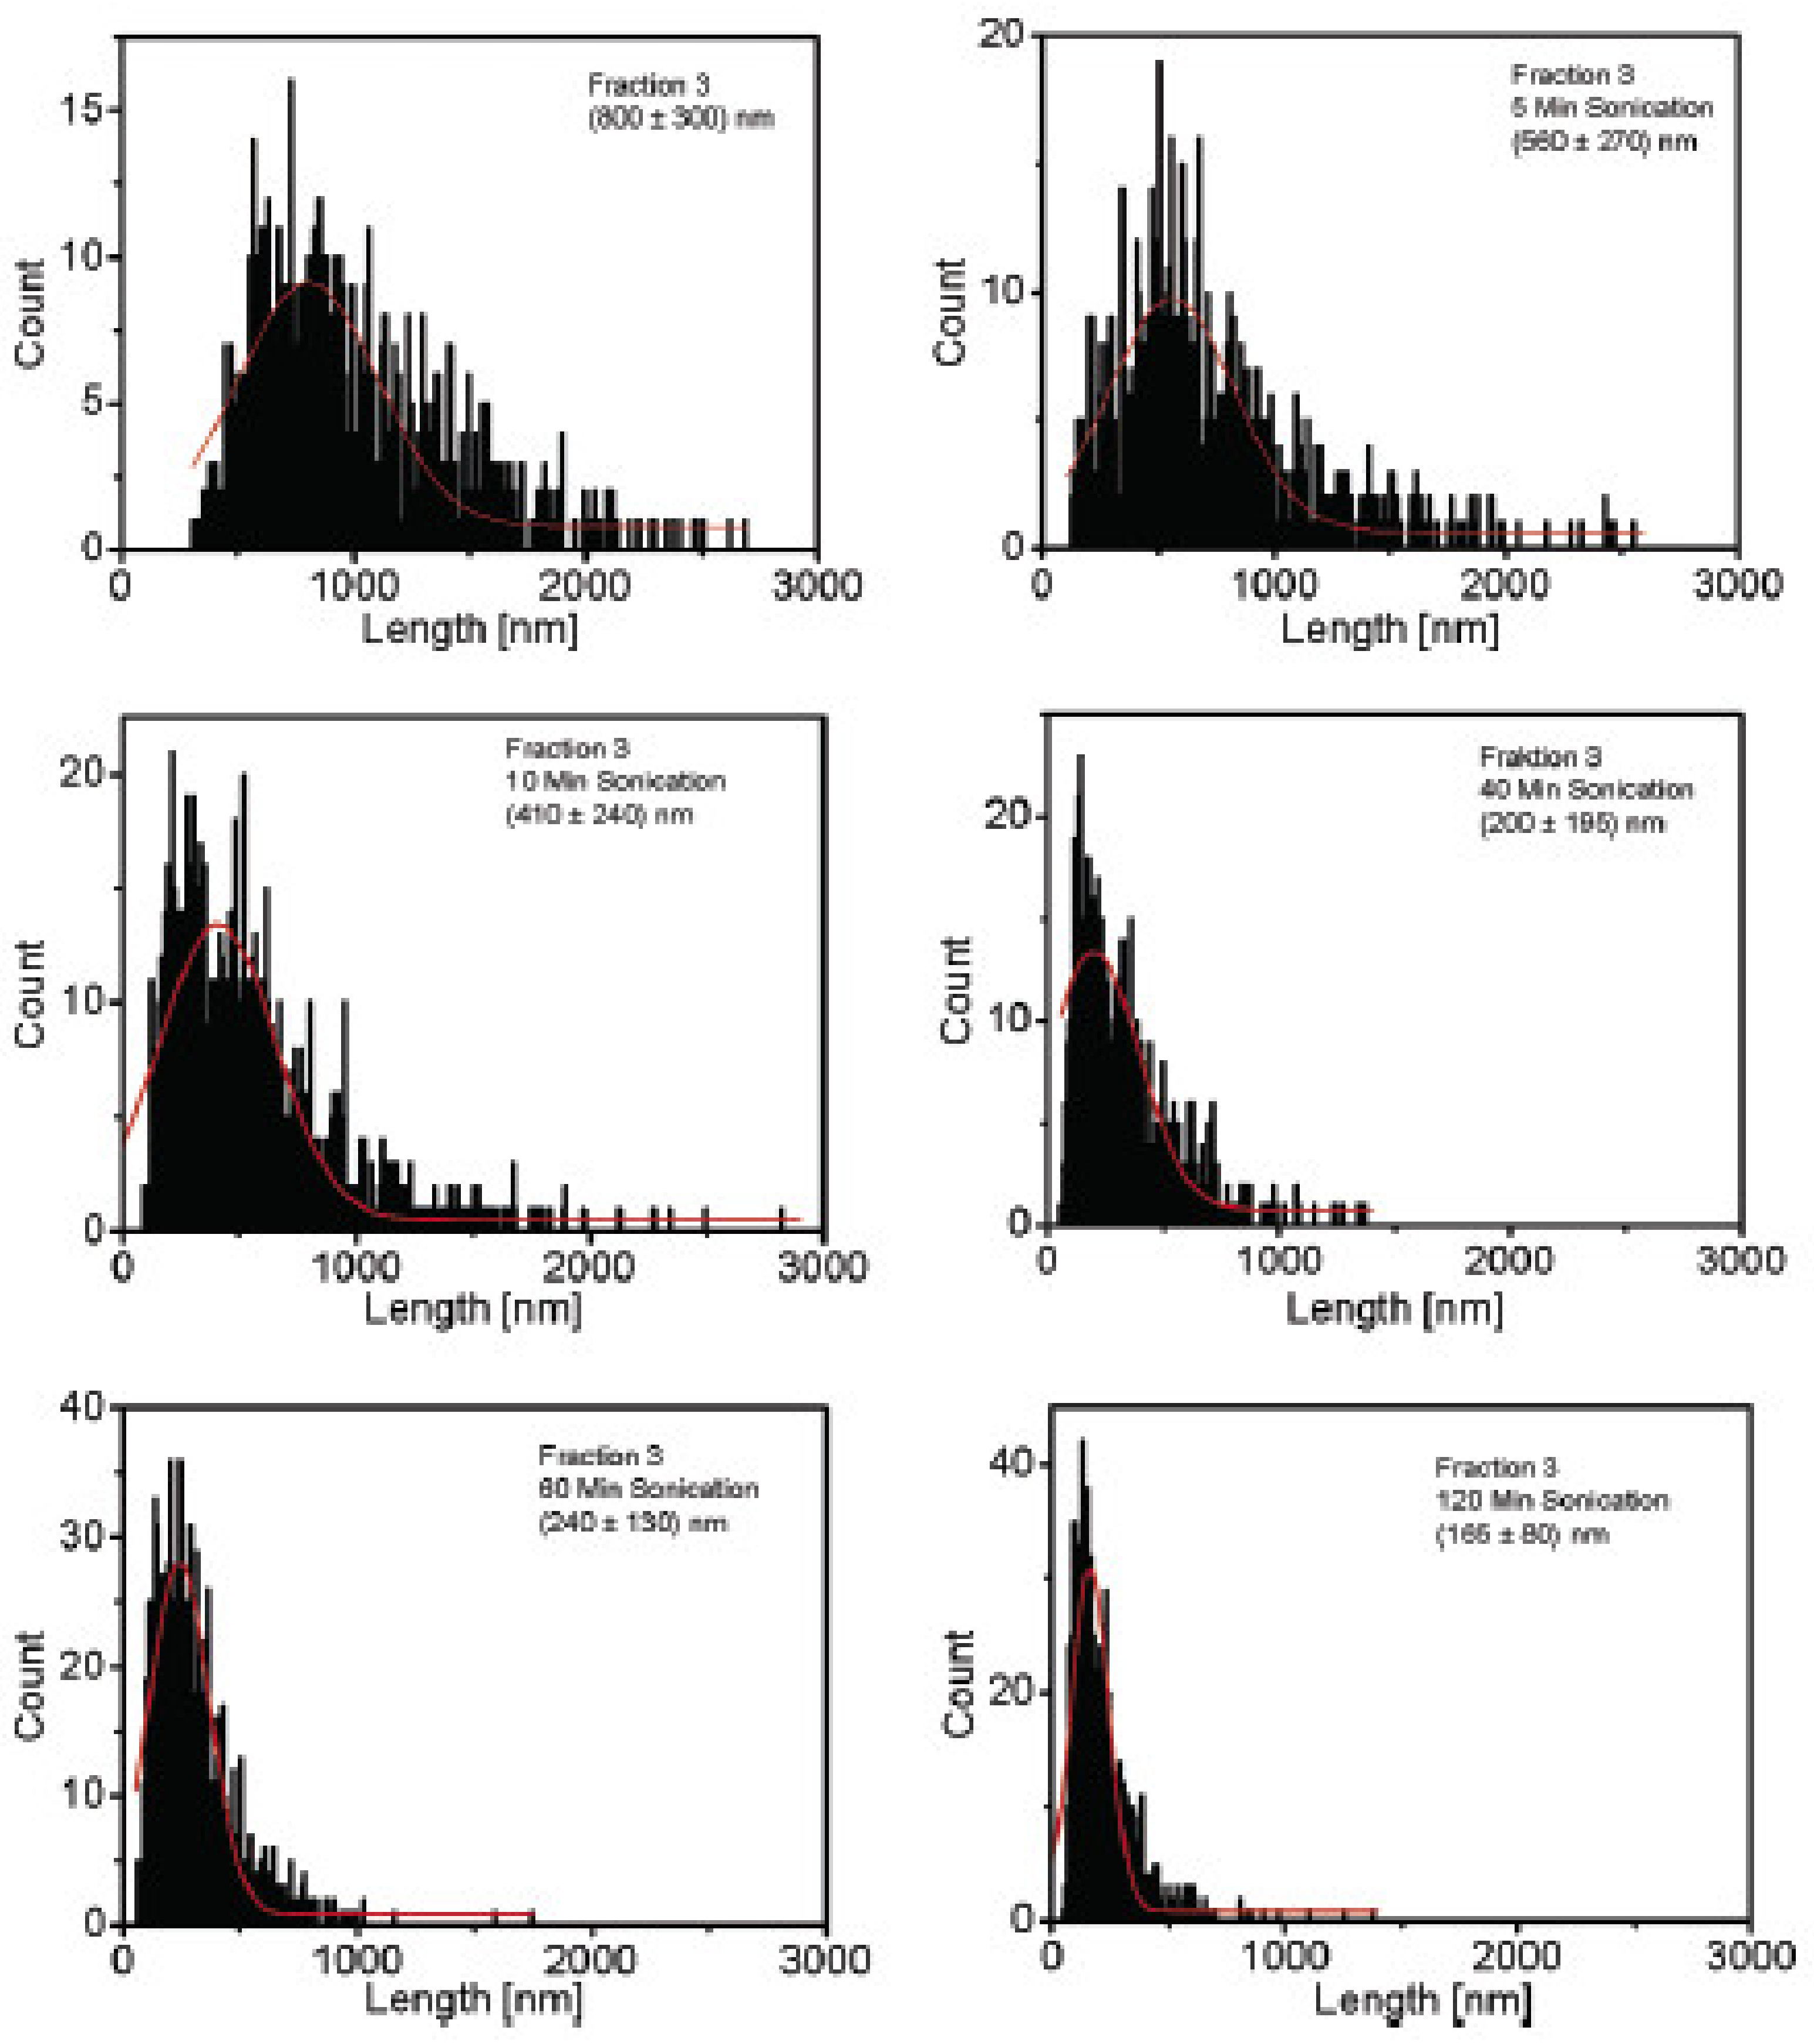
| D2O + sodium cholate | SWCNT | 20 W | 5–120 min | AFM | 800 nm (0 min)–165 nm (120 min) | Length | [36] |
| Sodium deoxychlorate | SWCNT | 120 W, sonication tip | 10–120 min | AFM | 1.3 µm (30 min)–0.7 µm (120 min) histogram peak | Length | [69] |
| Organic solvent + pyrene-siloxane surfactant | MWCNT | >60 W/cm2 | 3–10 h | SEM | 5–15 µm (0 min)–2–6 µm (3 h) | Length | [65] |
| Sodium dodecyl sulfate + Milli-Q water | SWCNT (bundles) | 20 and 40 W | 15–120 min | DDLS | Length: 2.286–1.146 µm; diameter: 40.6–12.1 nm (20 W, 30–120 min); 1.156–0.822 µm; diameter: 37.9–2.9 nm (40 W, 15–120 min); | Length and diameter | [78] |
| Water | MWCNT and N-doped MWCNT | 1.2 kJ, 2.1 kJ, 6 kJ, 10 kJ, 17 kJ | 30–300 s | SEM | 17.1± 11.9 µm undoped–13.6 ± 9.9 µm N-doped (30 s, 1.2 kJ); 9.5 ± 5.1 µm undoped–10.1 ±6.0 µm N-doped (300 s, 10 kJ) | Contour length | [67] |
| Dispersion Medium | Nanofiller Type | Input Power | Sonication Time/Energy Input | Analyzing Tool | Results | Citation |
|---|---|---|---|---|---|---|
| Distilled water | MWCNT | 260 W, US bath | 15–120 min | Raman | ID/IG 0.96 (untreated)–1.2 (120 min) | [70] |
| NaNO3 + H2SO4 + KMnO4 | MWCNT | / | 40–160 min | Raman, FTIR | ID/IG 0.84 (untreated)–1.14 (40 min); FTIR confirmed oxygen-containing functional groups | [15] |
| CH2Cl2 | MWCNT | 17 W | 5–20 min | Raman, ESR spectroscopy | No info on ratio | [71] |
| o-DCB or DMF | SWCNT | 195 W | 20–220 s | Raman | ID/IG+ ratio increase by factor 1.4 (DMF) and 1.7 (o-DCB) after 60–80 s | [92] |
| ddH2O+distilled water+ss-DNA oligo+(dT)30 | SWCNT | 3–80 W, US bath | 1–6 h | Raman | Almost no change, increase in defect sites less than 10% and not significant | [93] |
| Dispersion Medium | Nanofiller Type | Input Power | Sonication Time/Energy Input | Analyzing Tool | Results | Citation |
|---|---|---|---|---|---|---|
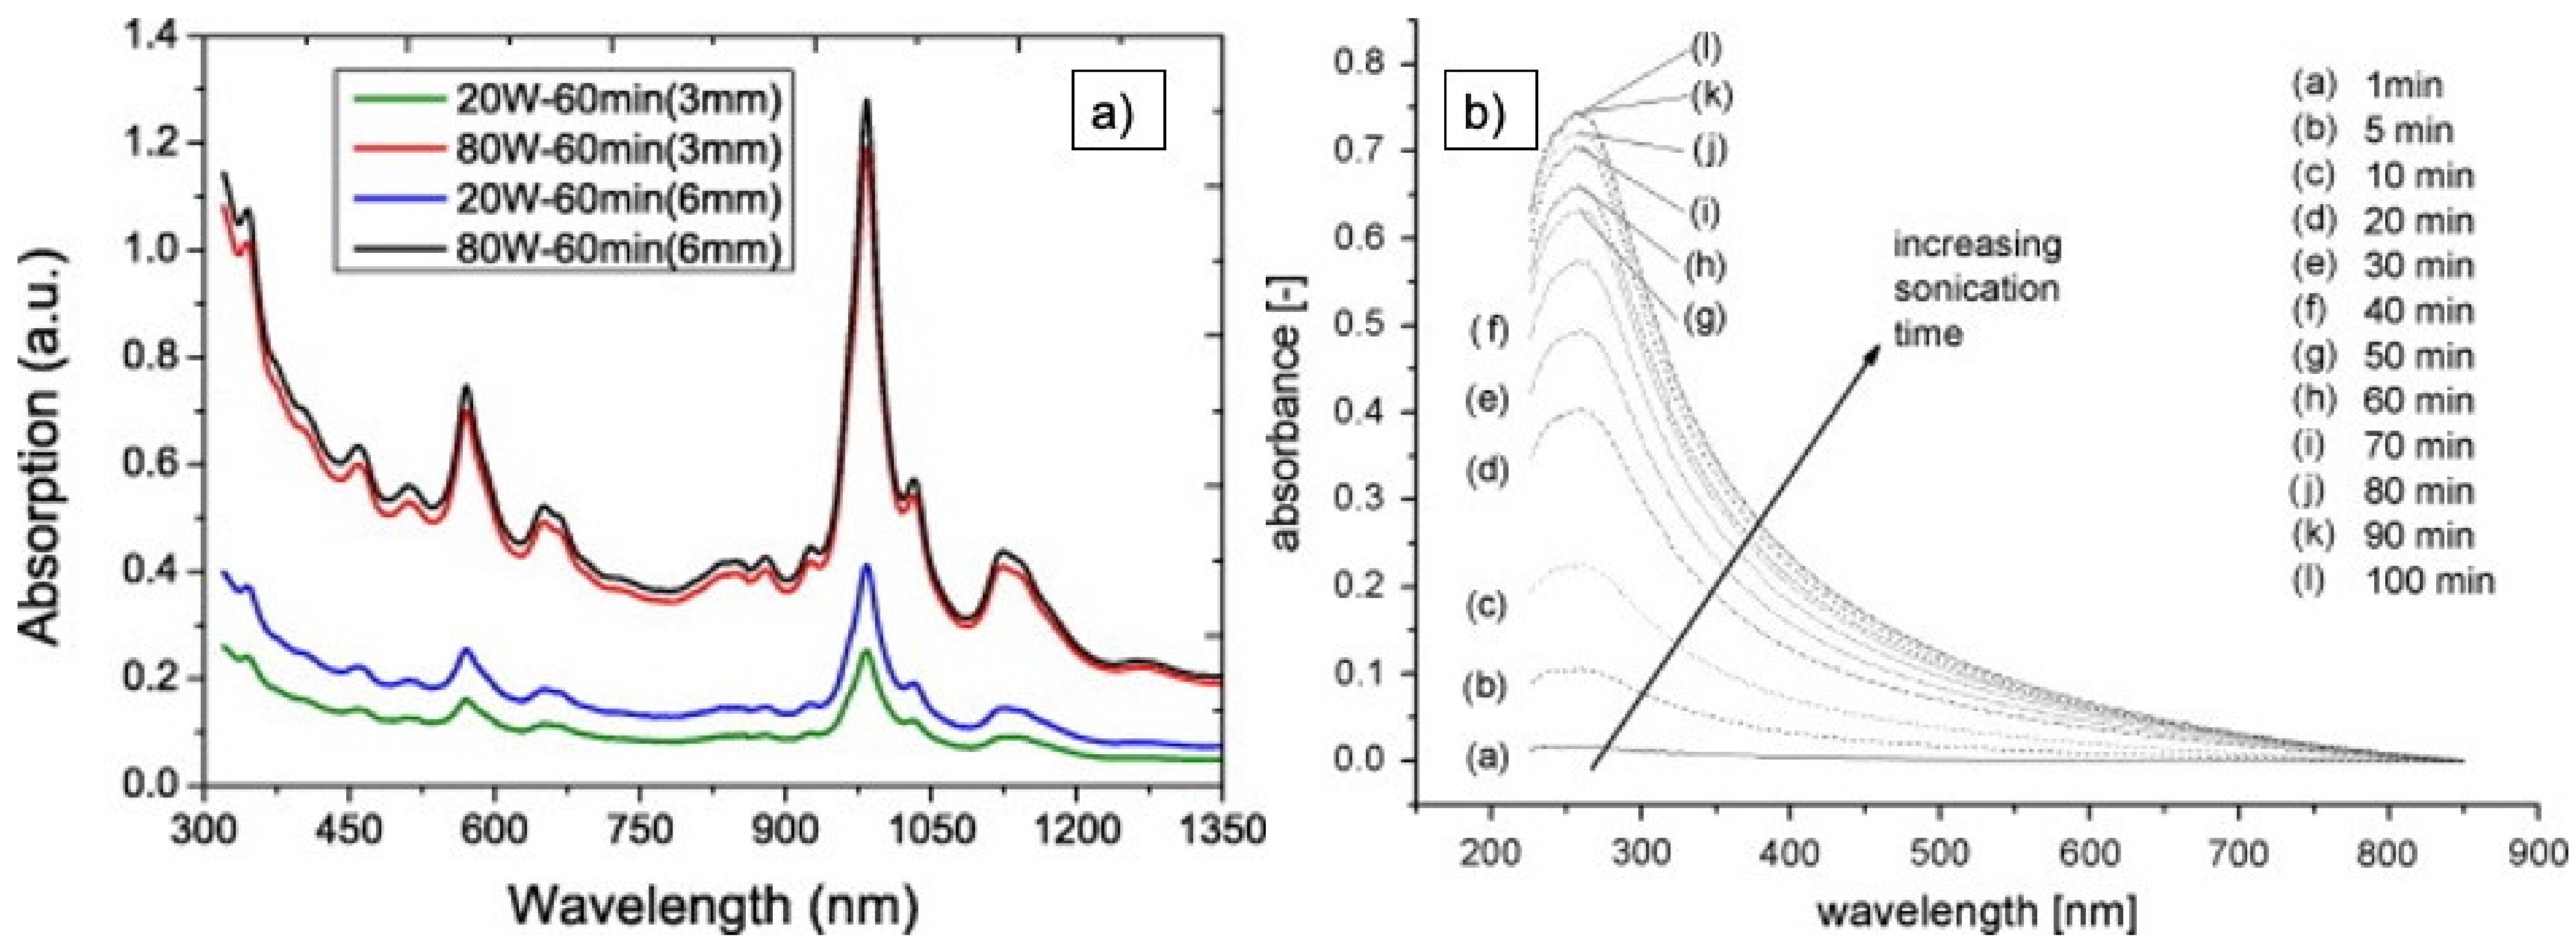
| Various surfactants (SDS, CTAB, polyxyethylene stearyl ether) and deionized water | MWCNT (neat and different functionalized types) | 140 W | 100 min | UV–vis | General finding for different surfactants and MWCNT: at short sonication time, absorbance increases rapidly, at higher times, absorbance levels off | [75] |
| NaDOC (30% cmc and 300% cmc) in Milli-Q water | SWCNT | 100 and 200 W | 0–60 min | UV–vis | 100 W: 0.775 (15 min)–0.88 (60 min) (30% cmc) 0.825 (15 min)1.25 (60 min) (300% cmc) 200 W: 0.85 (15 min)–1.0 (60 min) (30% cmc) 1.1 (15 min) 1.95 (60 min) (300% cmc) | [38] |
| 17 different surfactants | SWCNT | 140 W | 0–120 min | UV–vis | Resonance ratio increases: 0.04 (0 min)–0.08 (120 min) (surfactant: NaDDBS) | [86] |
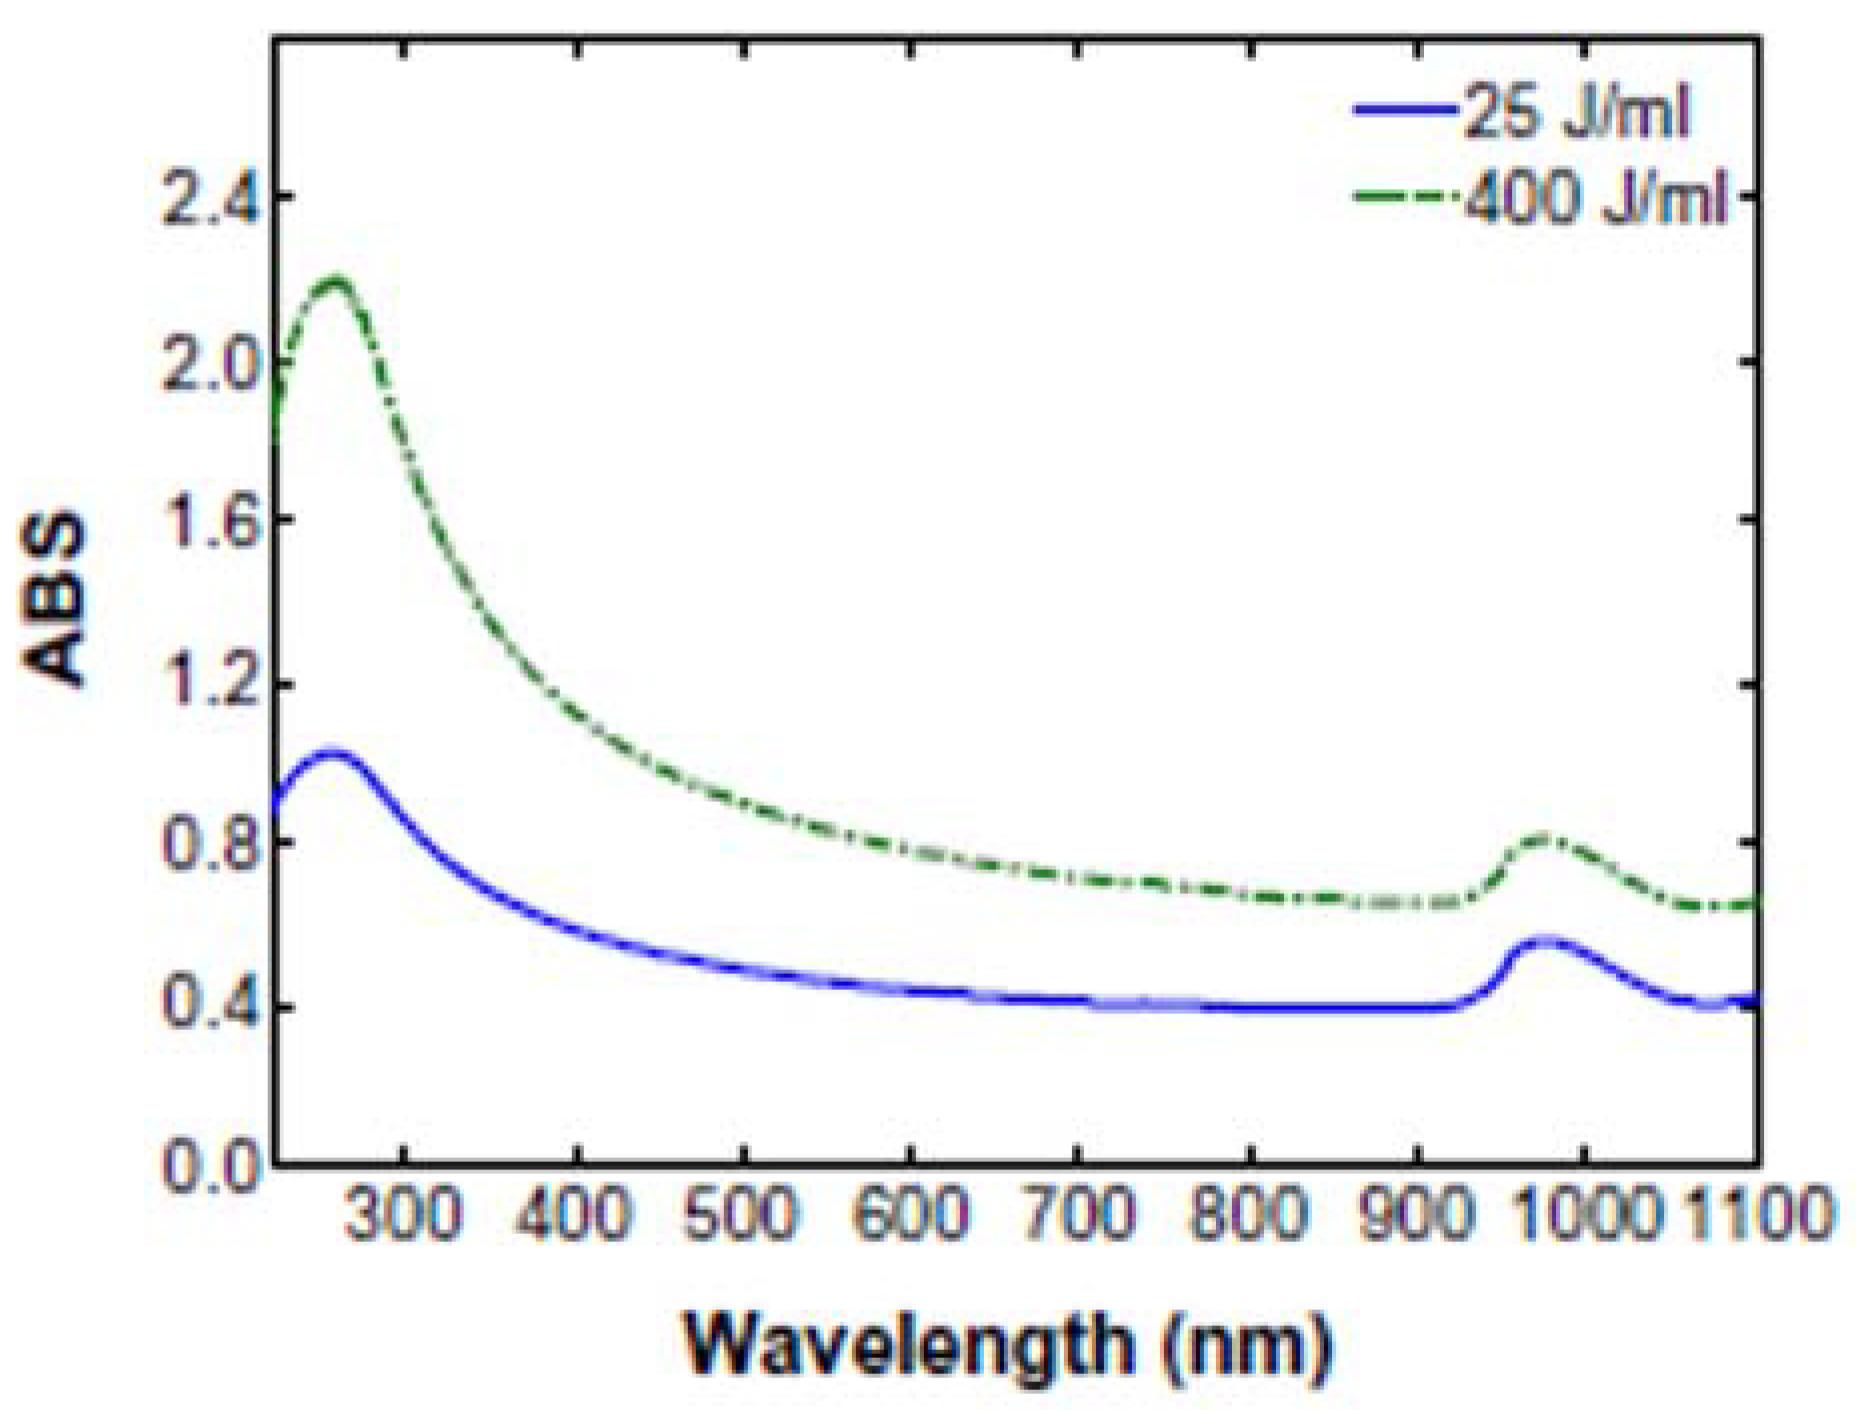
| Distilled water + polyacrylate-based dispersing agent | MWCNT | 150 W | 25 J/mL–400 J/mL | UV–vis | Increase in absorbance: 0.4 (25 J/mL)–0.8 (400 J/mL) | [35] |
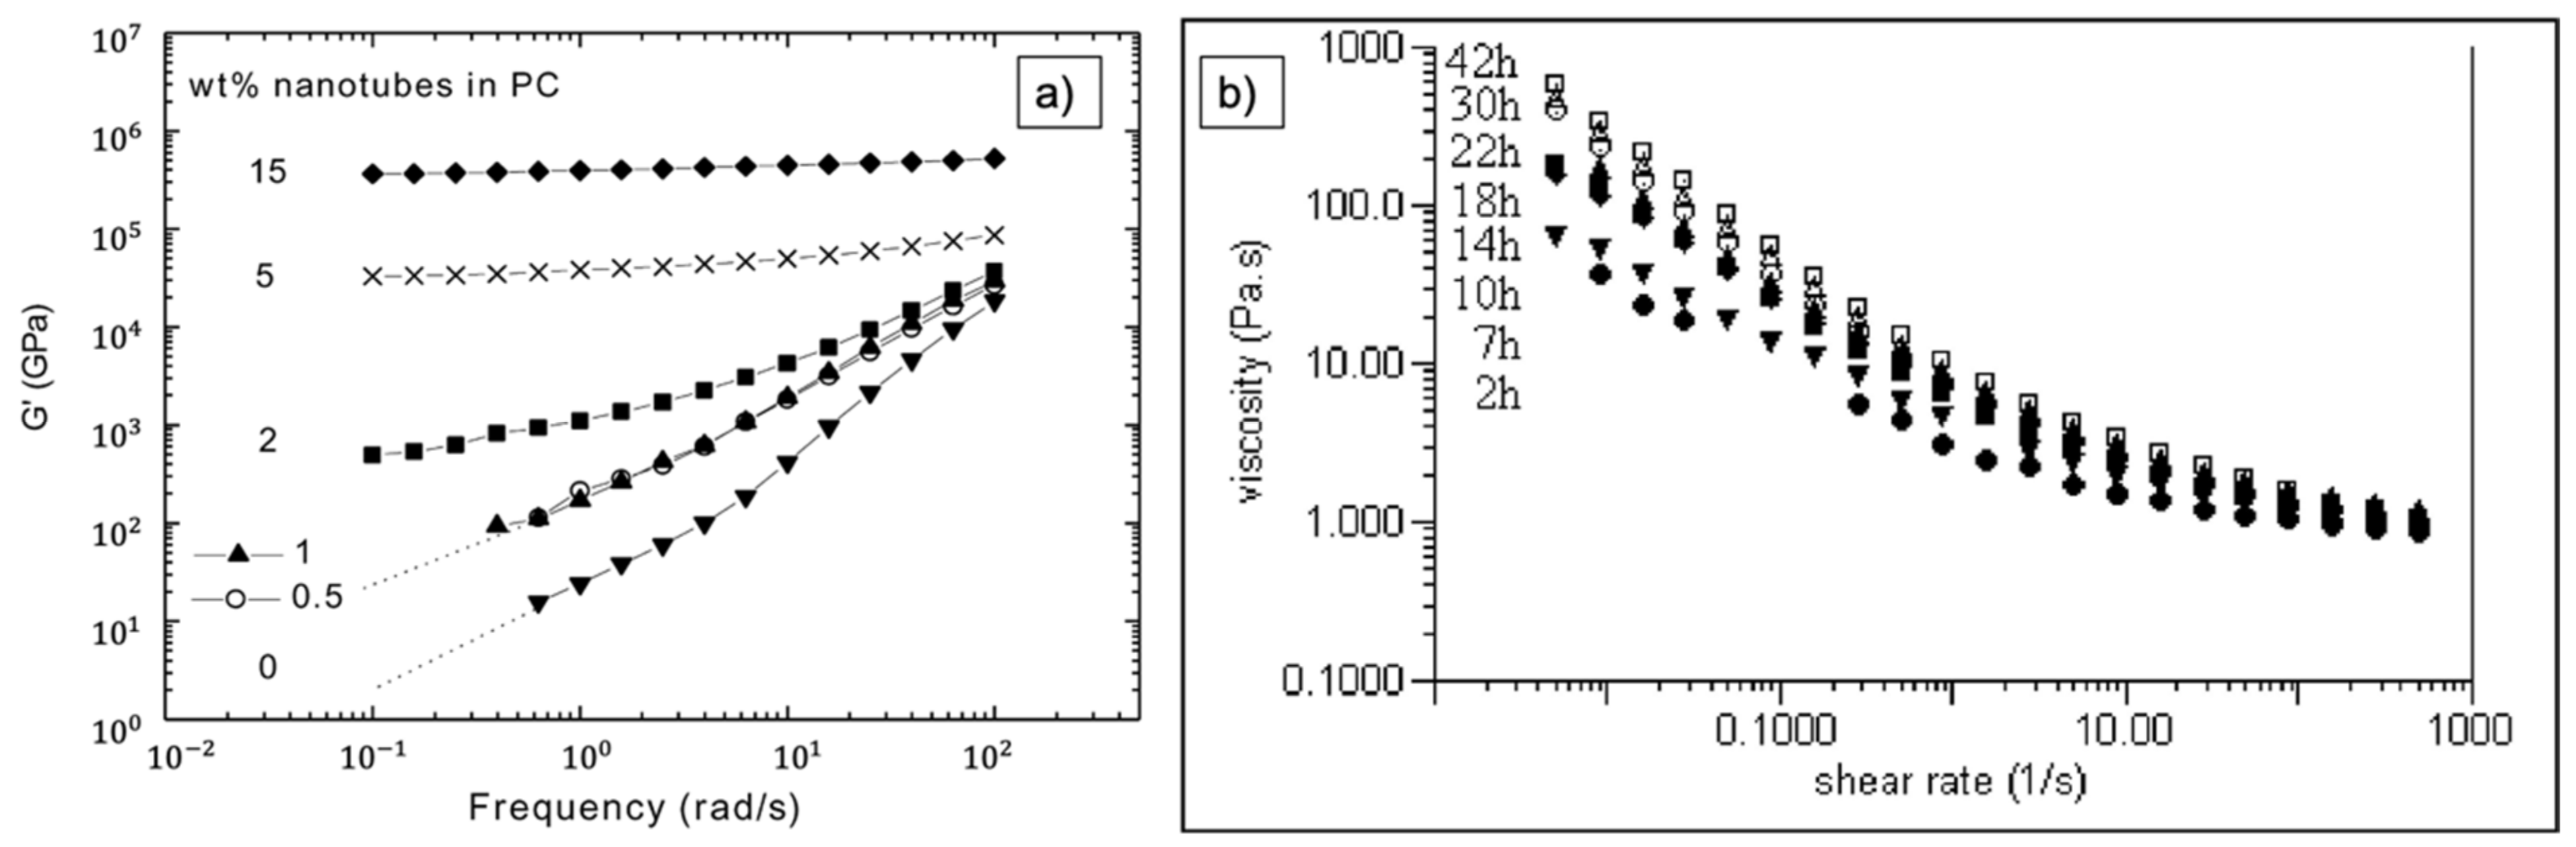
| Acetone | MWCNT | /(ultrasonic bath) | 2–42 h | Rheology | Increasing viscosity values with increasing sonication time | [83] |
| Ethanol | MWCNT | / | 2 h | Rheology | Shear thinning—viscosity values: 106–102 Pa.s (functionalized MWCNT); 103–101 Pa.s (neat MWCNT) | [80] |
| DCM | MWCNT | 60–70 W | 0–90 min | UV–vis + rheology | UV–vis: Increase of absorbance until 30 min sonication, afterwards decrease Rheology: After 30 min, network formation, afterwards, negatively affected | [61] |
Publisher’s Note: MDPI stays neutral with regard to jurisdictional claims in published maps and institutional affiliations. |
© 2021 by the authors. Licensee MDPI, Basel, Switzerland. This article is an open access article distributed under the terms and conditions of the Creative Commons Attribution (CC BY) license (https://creativecommons.org/licenses/by/4.0/).
Share and Cite
Rennhofer, H.; Zanghellini, B. Dispersion State and Damage of Carbon Nanotubes and Carbon Nanofibers by Ultrasonic Dispersion: A Review. Nanomaterials 2021, 11, 1469. https://doi.org/10.3390/nano11061469
Rennhofer H, Zanghellini B. Dispersion State and Damage of Carbon Nanotubes and Carbon Nanofibers by Ultrasonic Dispersion: A Review. Nanomaterials. 2021; 11(6):1469. https://doi.org/10.3390/nano11061469
Chicago/Turabian StyleRennhofer, Harald, and Benjamin Zanghellini. 2021. "Dispersion State and Damage of Carbon Nanotubes and Carbon Nanofibers by Ultrasonic Dispersion: A Review" Nanomaterials 11, no. 6: 1469. https://doi.org/10.3390/nano11061469
APA StyleRennhofer, H., & Zanghellini, B. (2021). Dispersion State and Damage of Carbon Nanotubes and Carbon Nanofibers by Ultrasonic Dispersion: A Review. Nanomaterials, 11(6), 1469. https://doi.org/10.3390/nano11061469