Effects of Ultrasonication Time on the Properties of Polyvinyl Alcohol/Sodium Carboxymethyl Cellulose/Nano-ZnO/Multilayer Graphene Nanoplatelet Composite Films

Abstract
1. Introduction
2. Materials and Methods
2.1. Materials
2.2. Preparation of PVA/CMC Films
2.3. Preparation of PVA/CMC/ZnO NPs/xGnP Composite Films
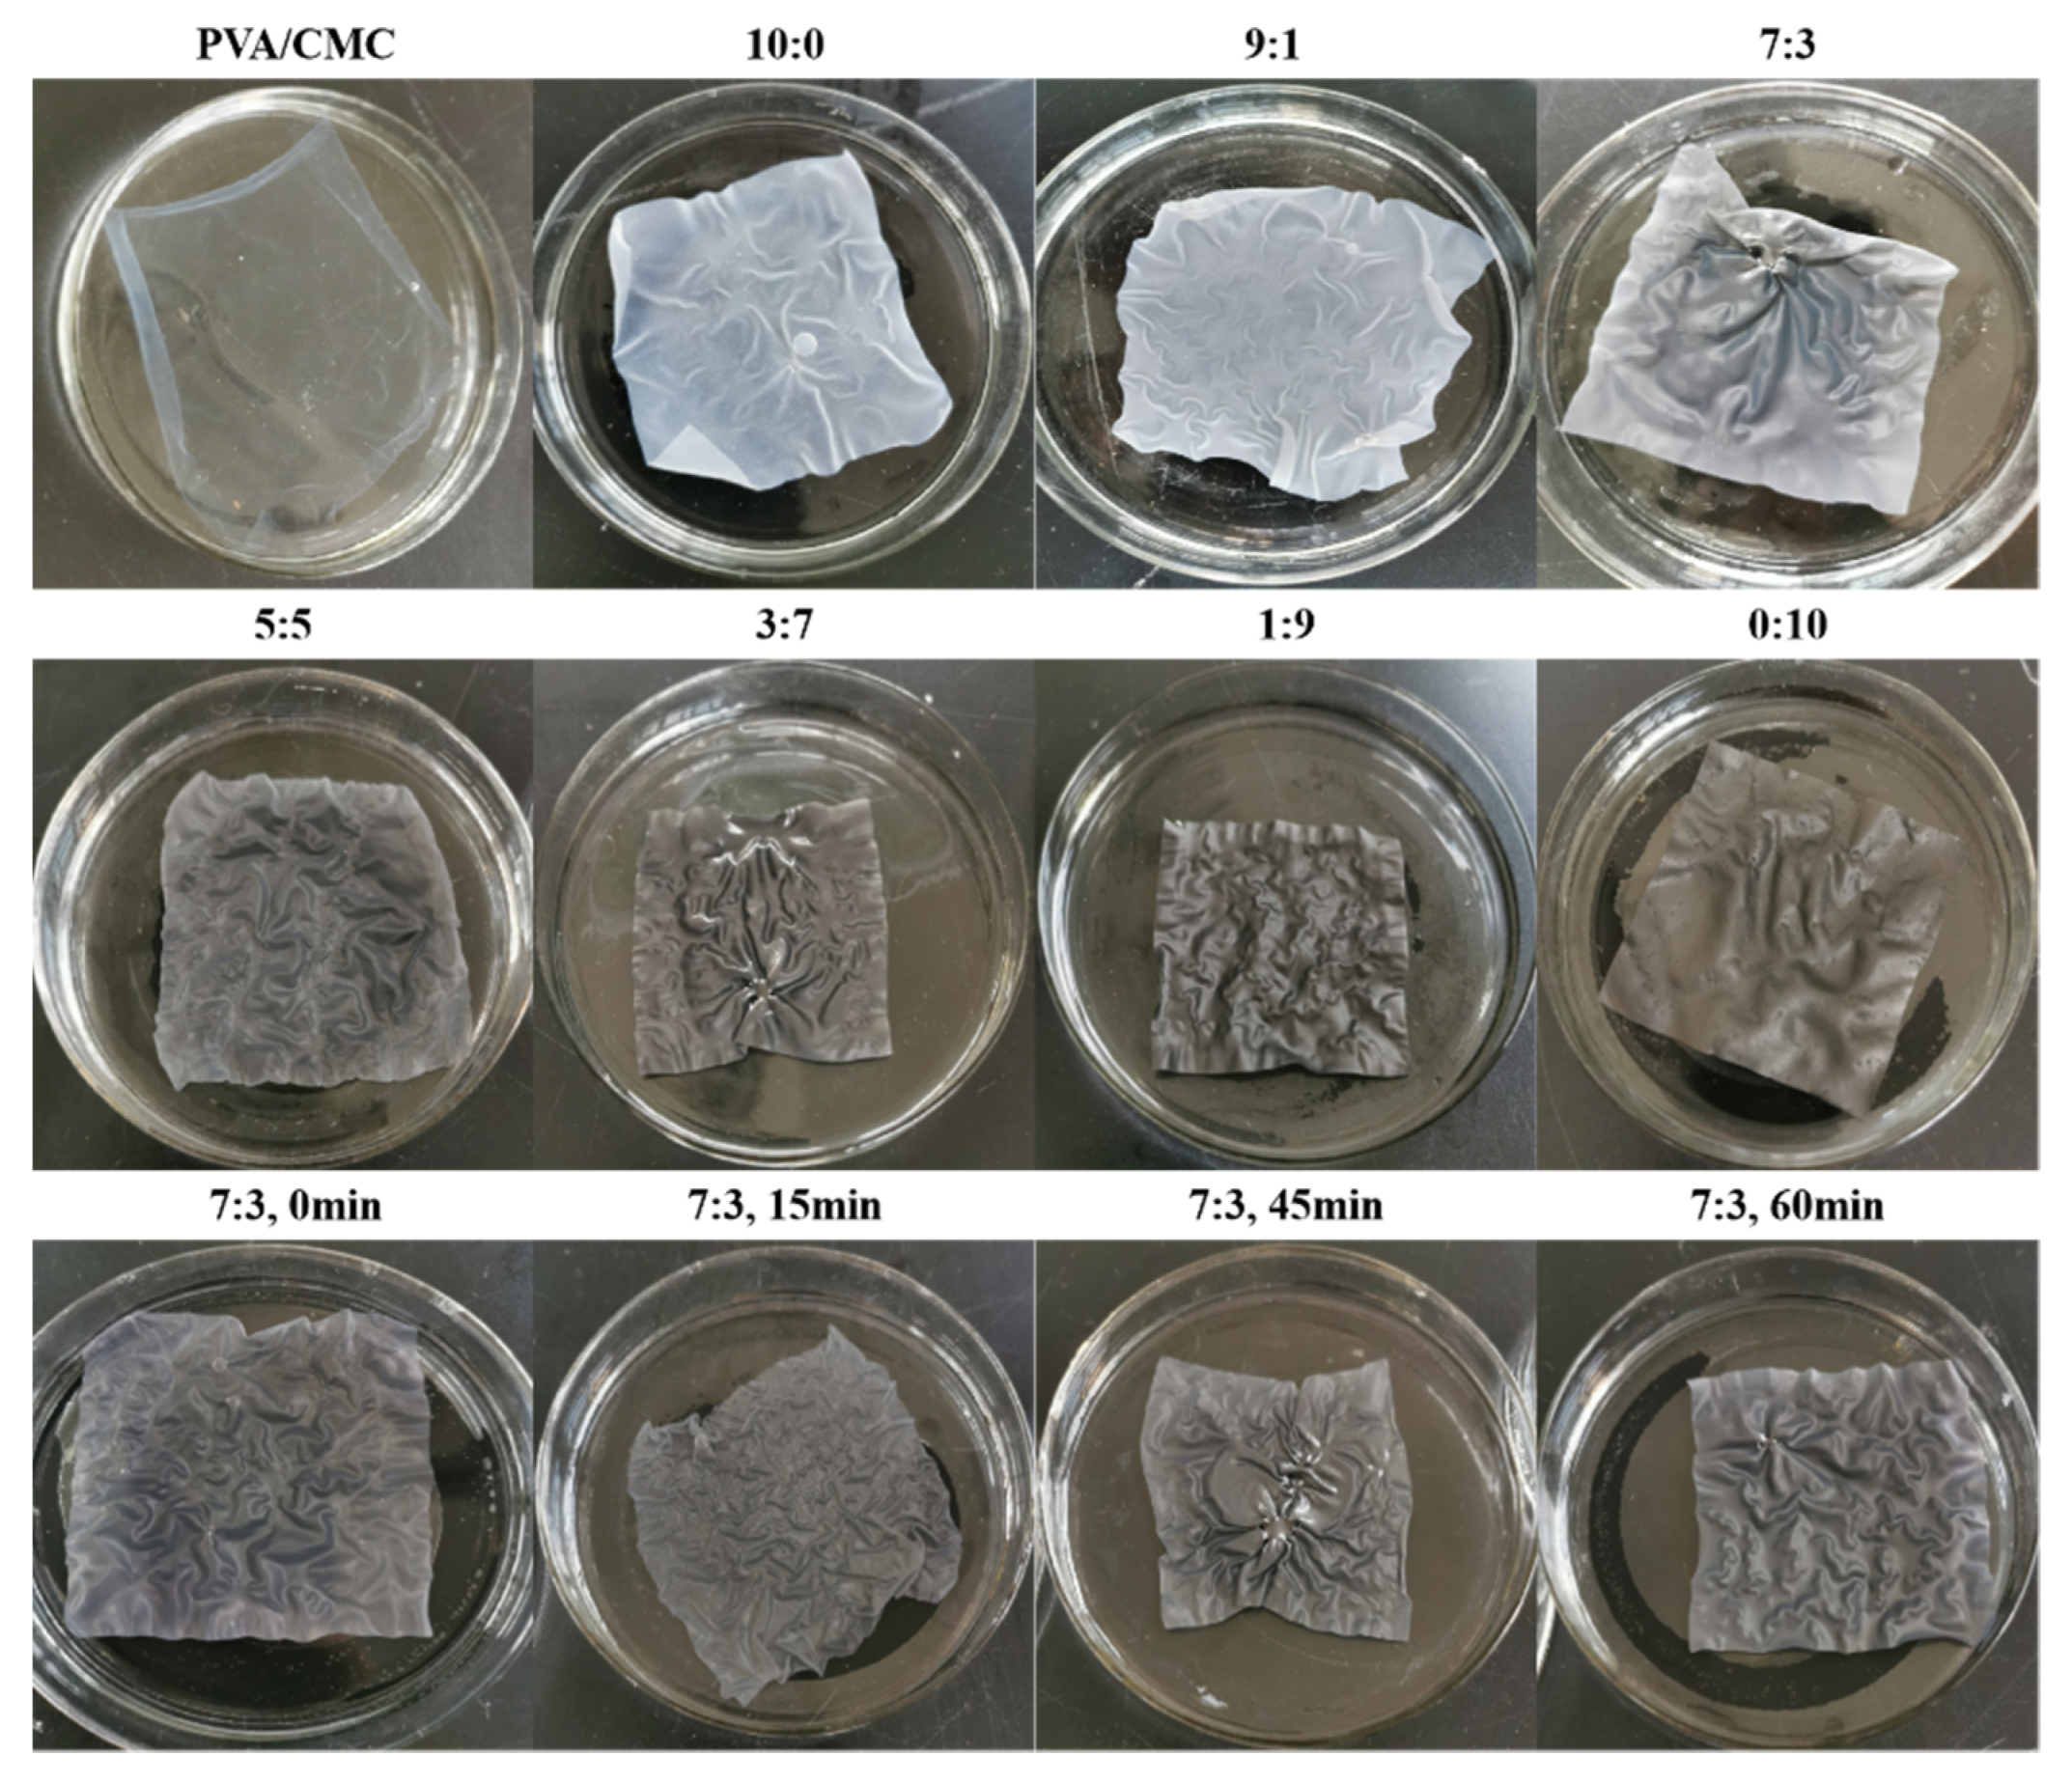
2.4. Swelling Capacity and Solubility
2.5. Scanning Electron Microscopy (SEM)
2.6. Attenuated Total Reflectance-Fourier Transform Infrared (ATR-FTIR) Spectroscopy
2.7. X-ray Diffractometry (XRD)
2.8. Differential Scanning Calorimetry (DSC)
2.9. Density Determination
2.10. Determination of Water Vapor Permeability (WVP)
2.11. Determination of Mechanical Properties
2.12. Determination of Surface Color
2.13. Determination of Light Transmittance
2.14. Evaluation of Biodegradability
2.15. Evaluation of Antimicrobial Activity
2.16. Preservation Experiment of Strawberries
2.16.1. Weight Loss Ratio
2.16.2. Firmness
2.16.3. Content of Total Soluble Solids (TSS)
2.16.4. Titratable Acidity (TA)
2.17. Statistical Analysis
3. Results and Discussion
3.1. Chemical Property–Swelling Property
3.2. Physical Property
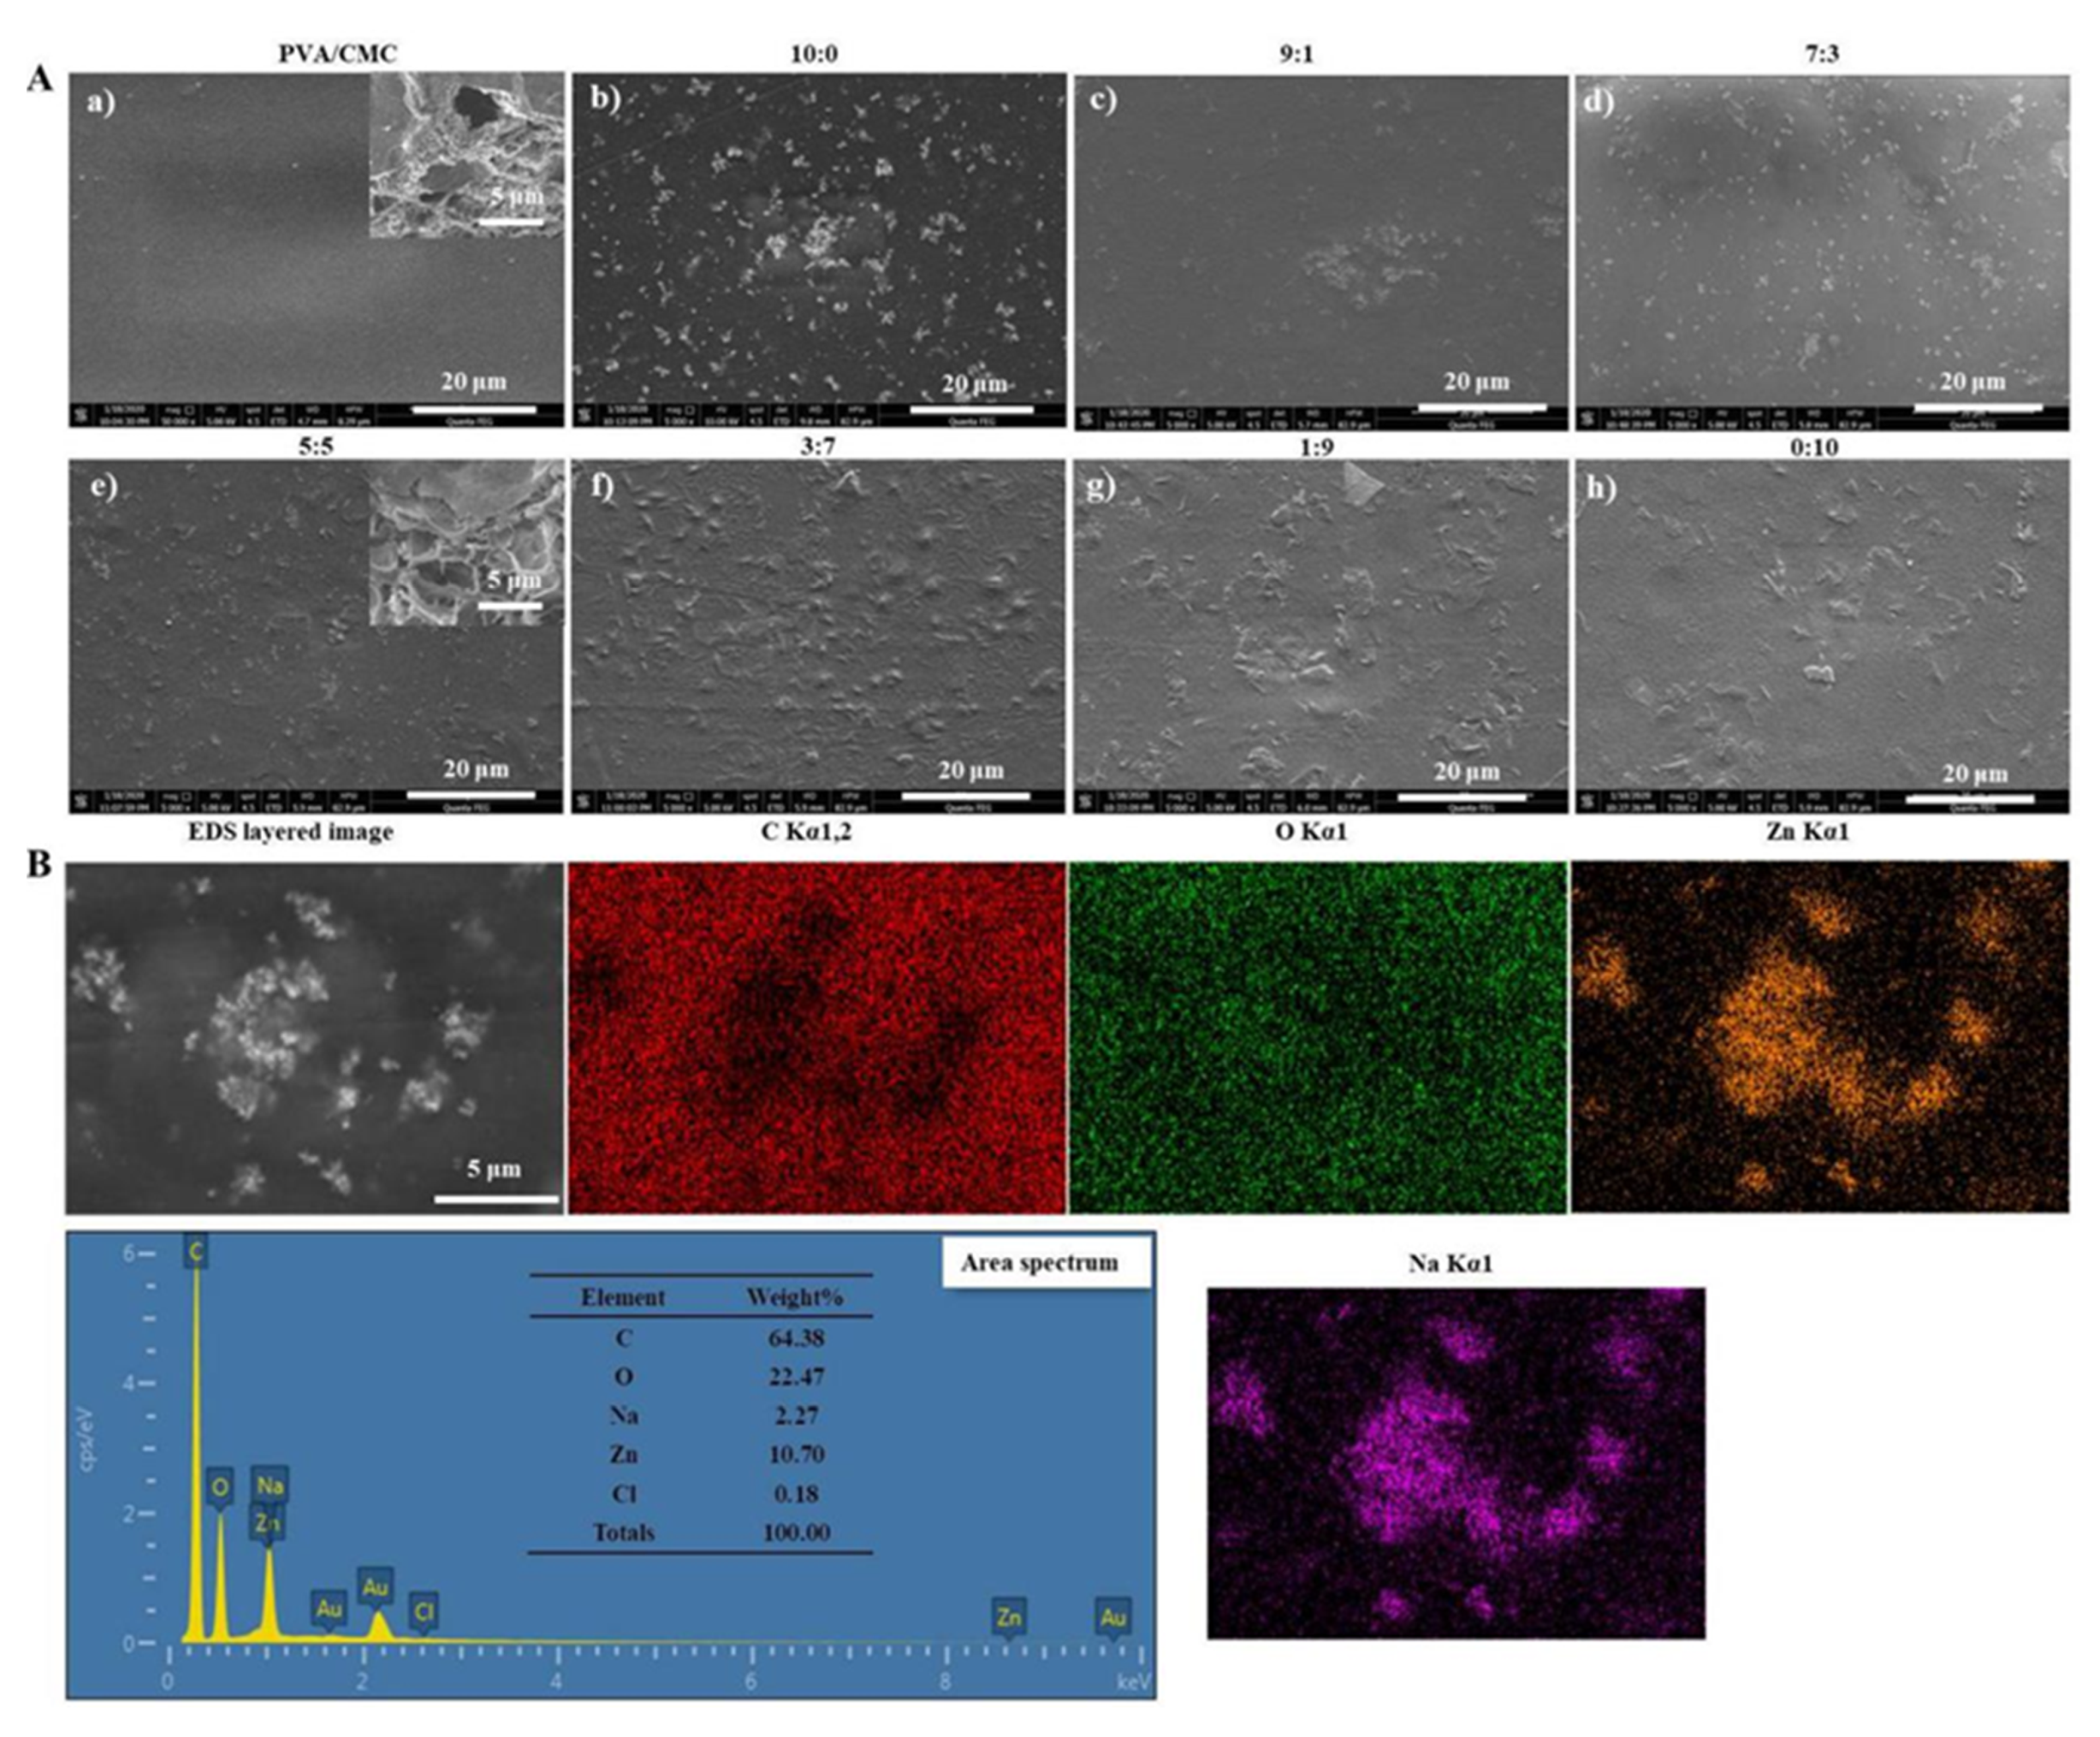
3.2.1. Composite Morphology
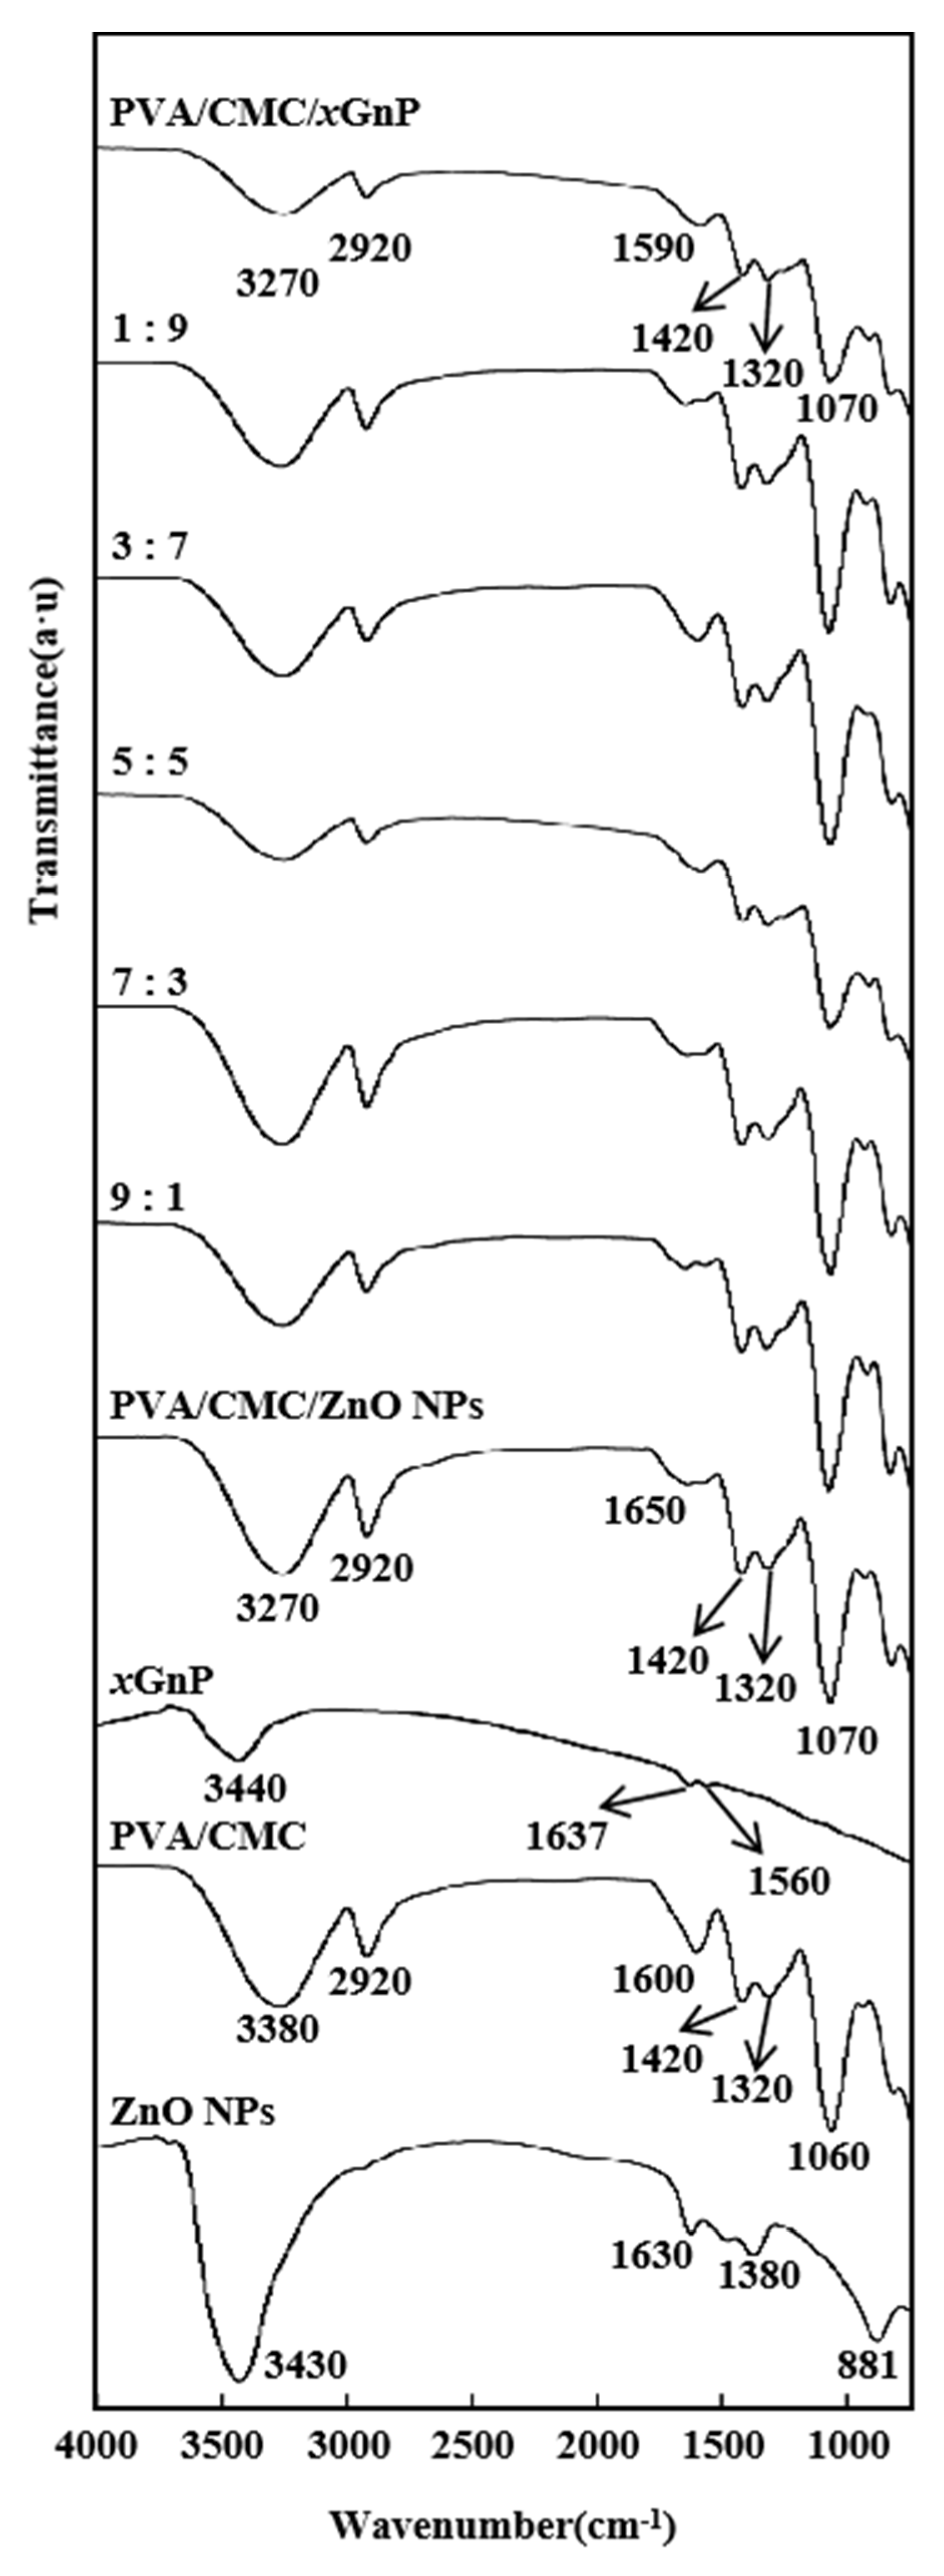
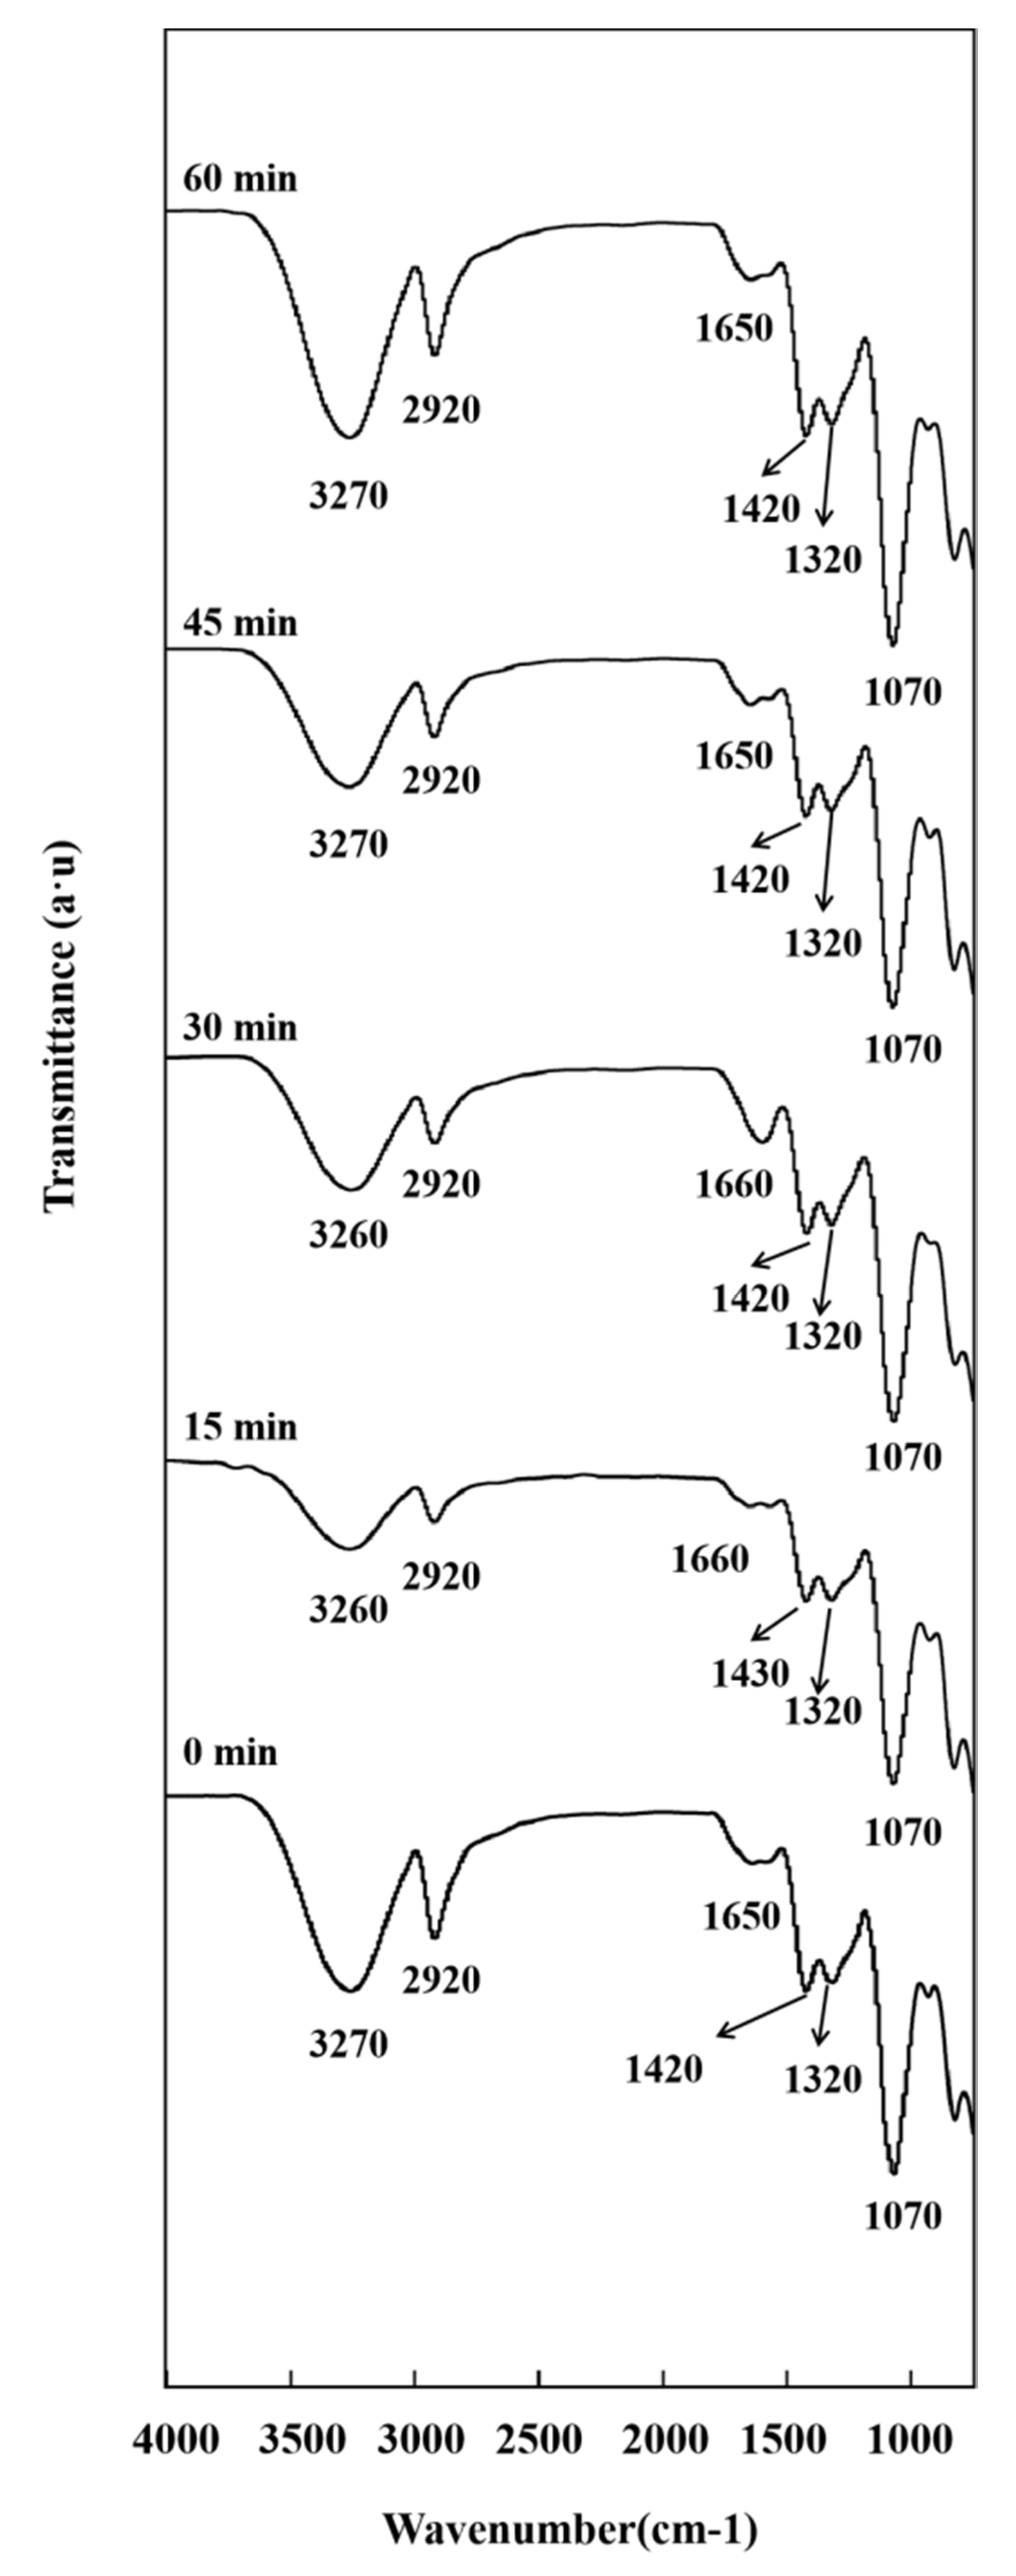
3.2.2. ATR-FTIR Analysis
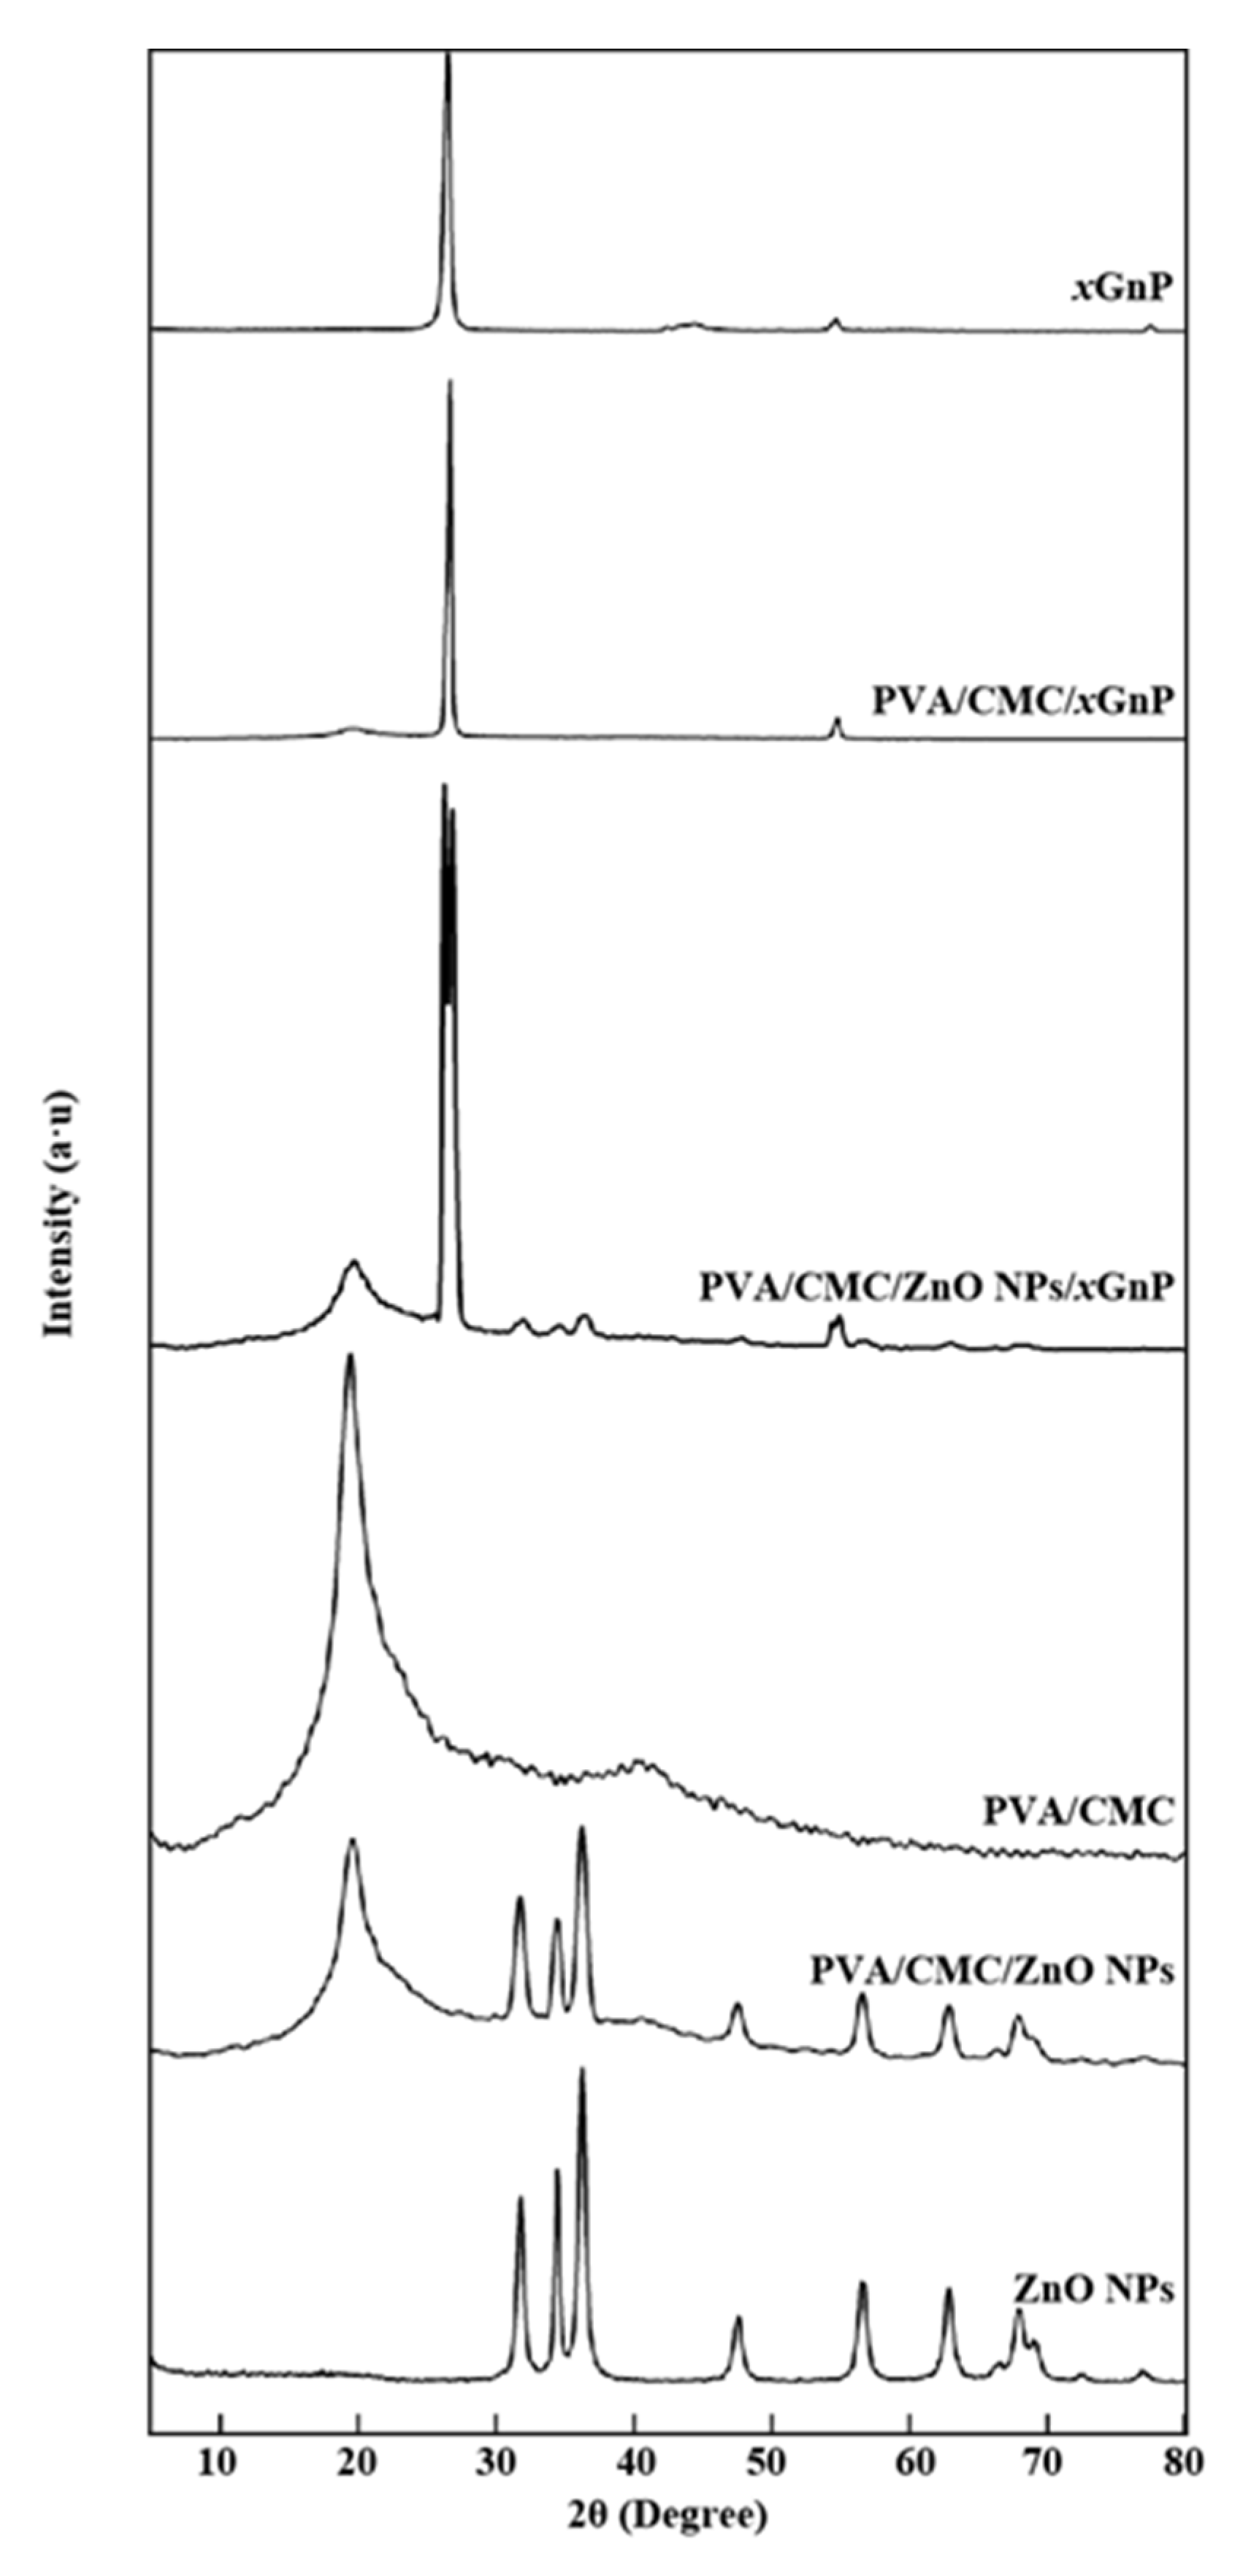
3.2.3. XRD Analysis
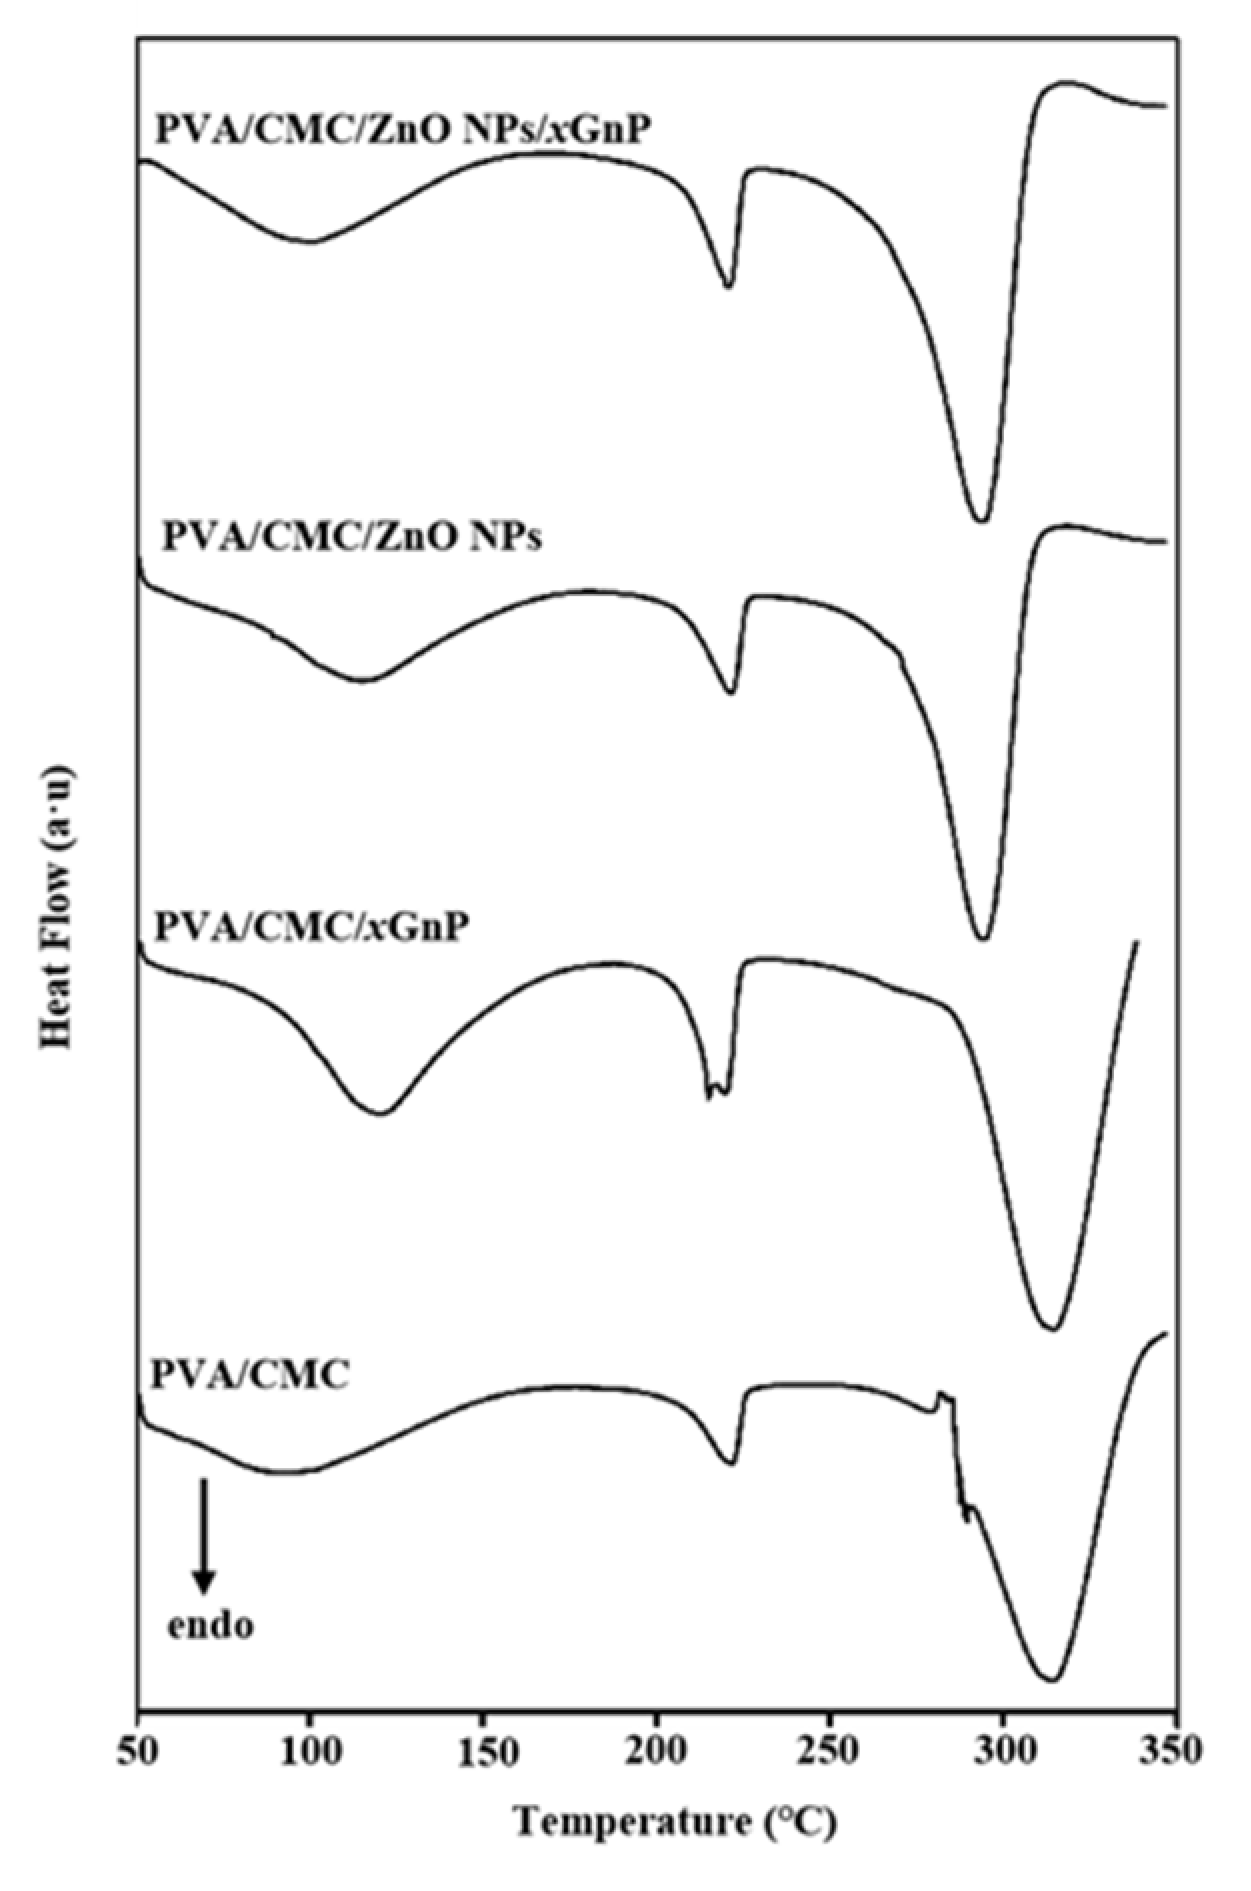
3.2.4. DSC Analysis
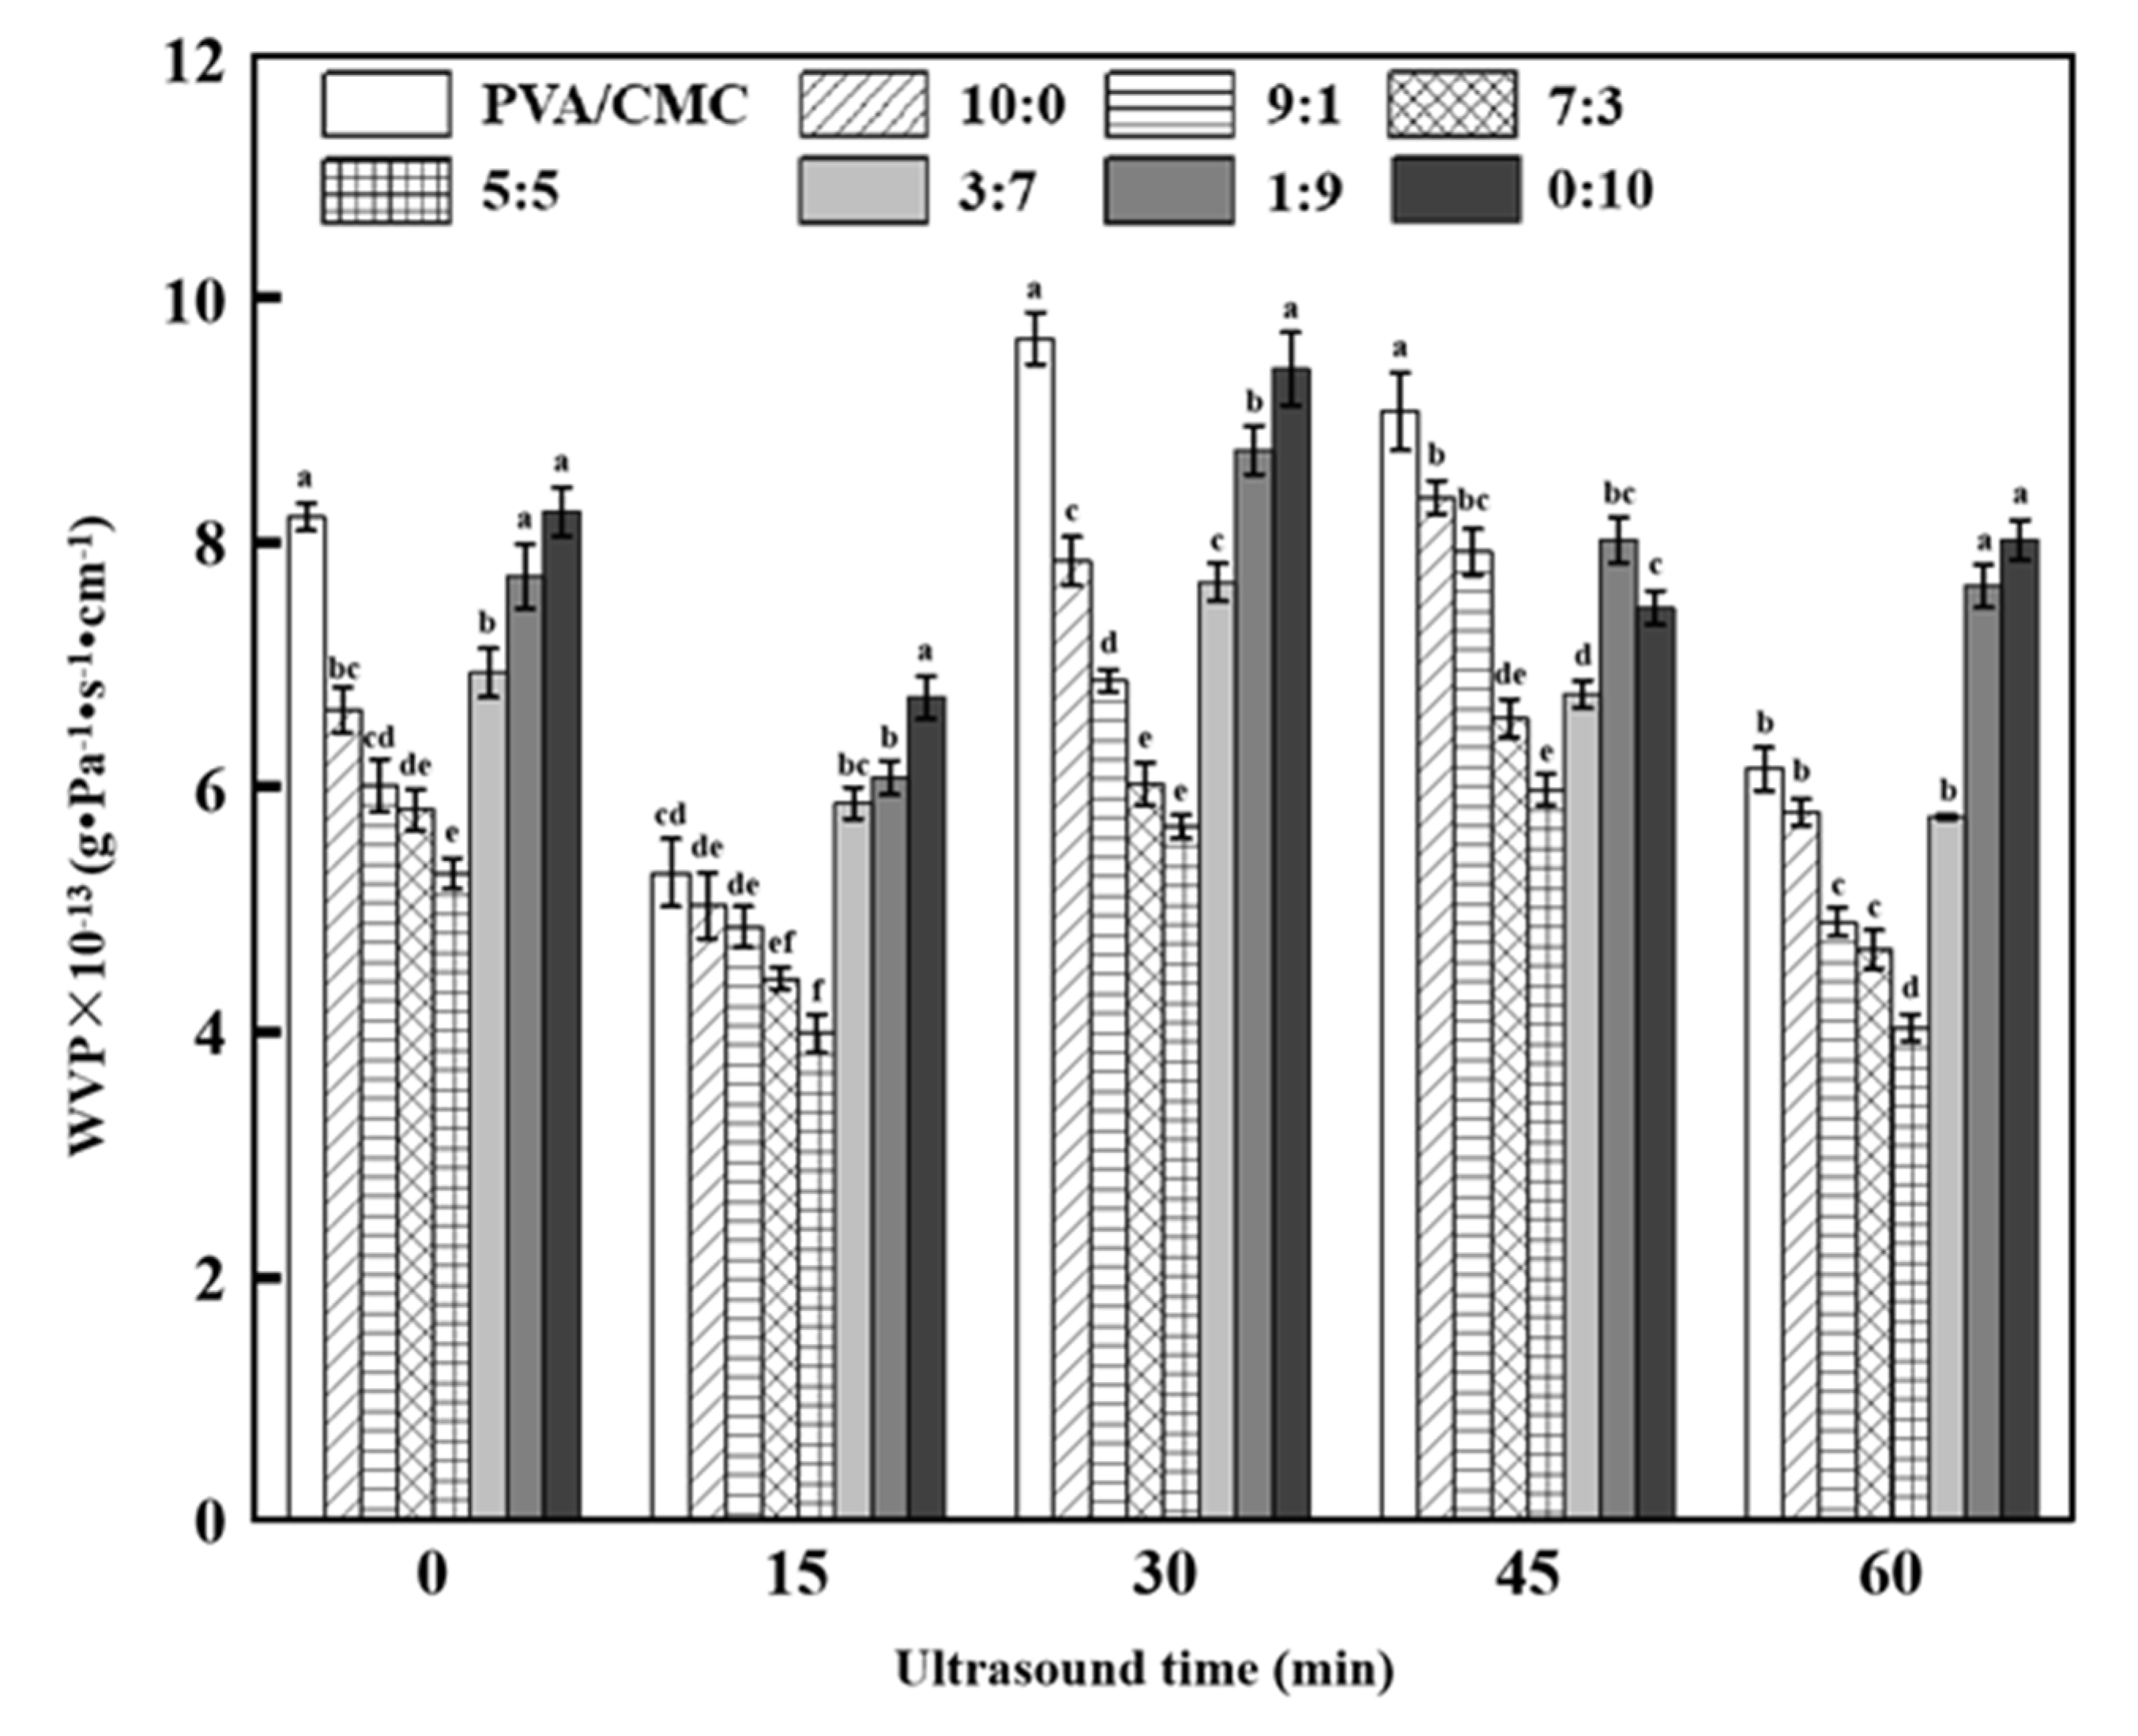
3.2.5. WVP
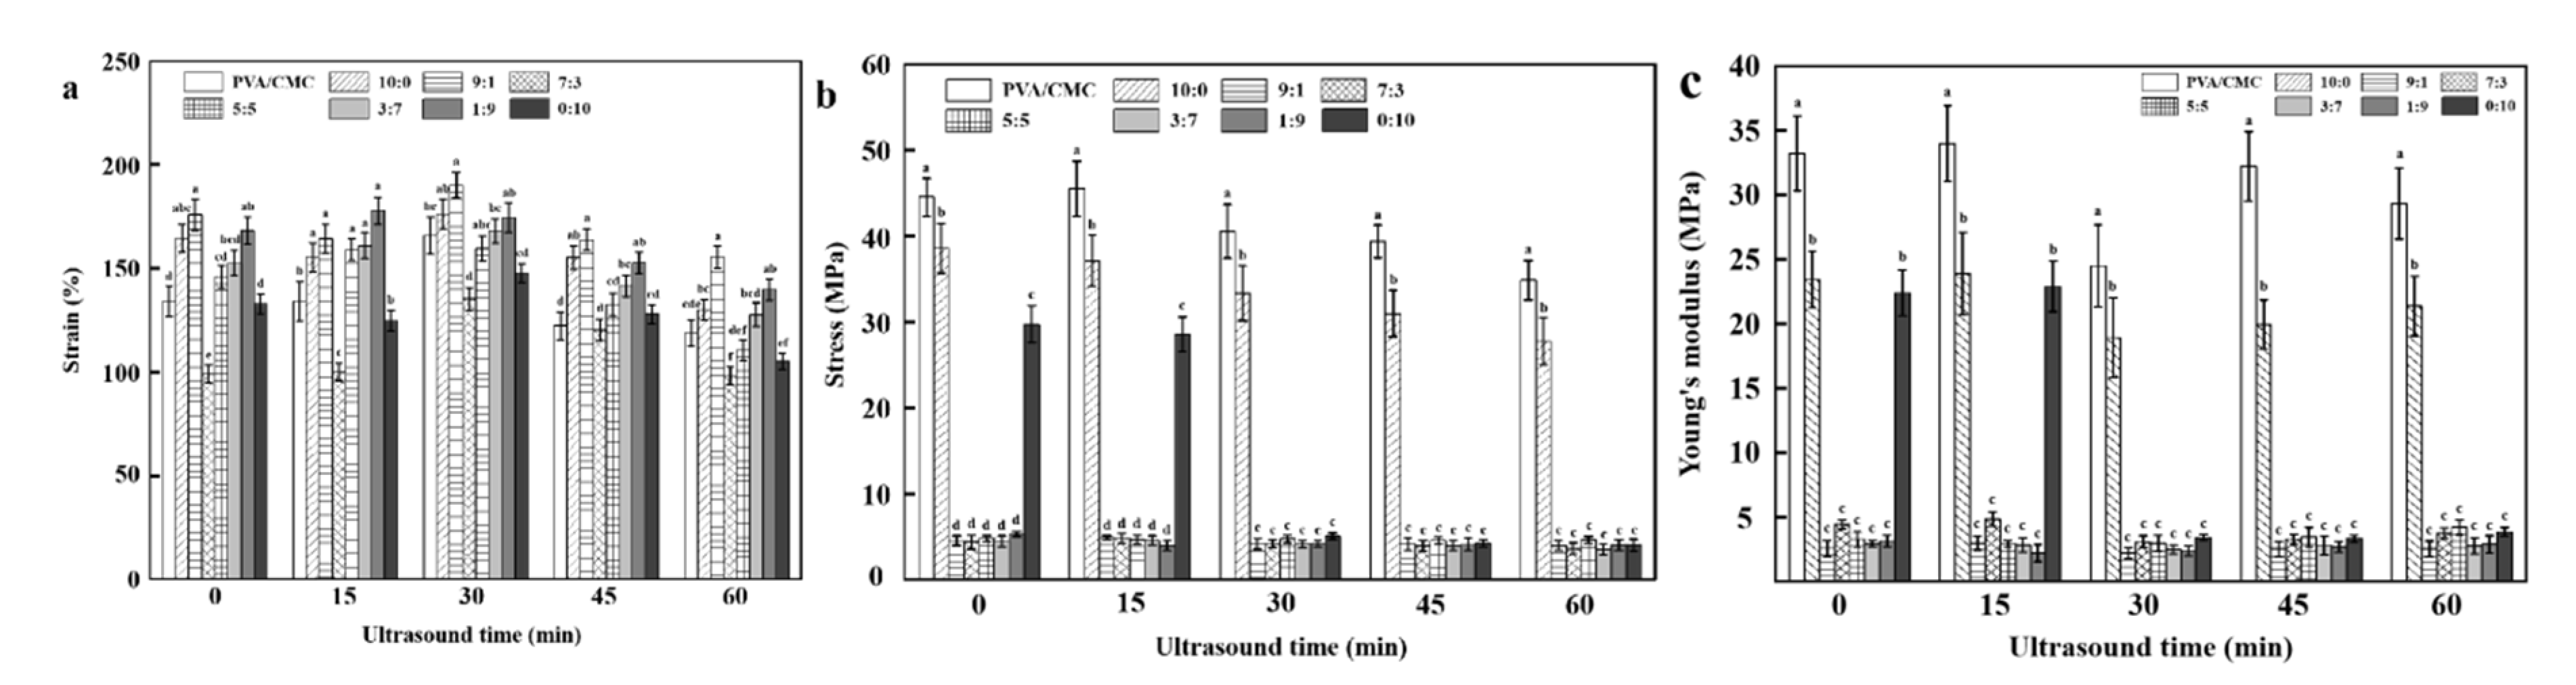
3.2.6. Mechanical Properties
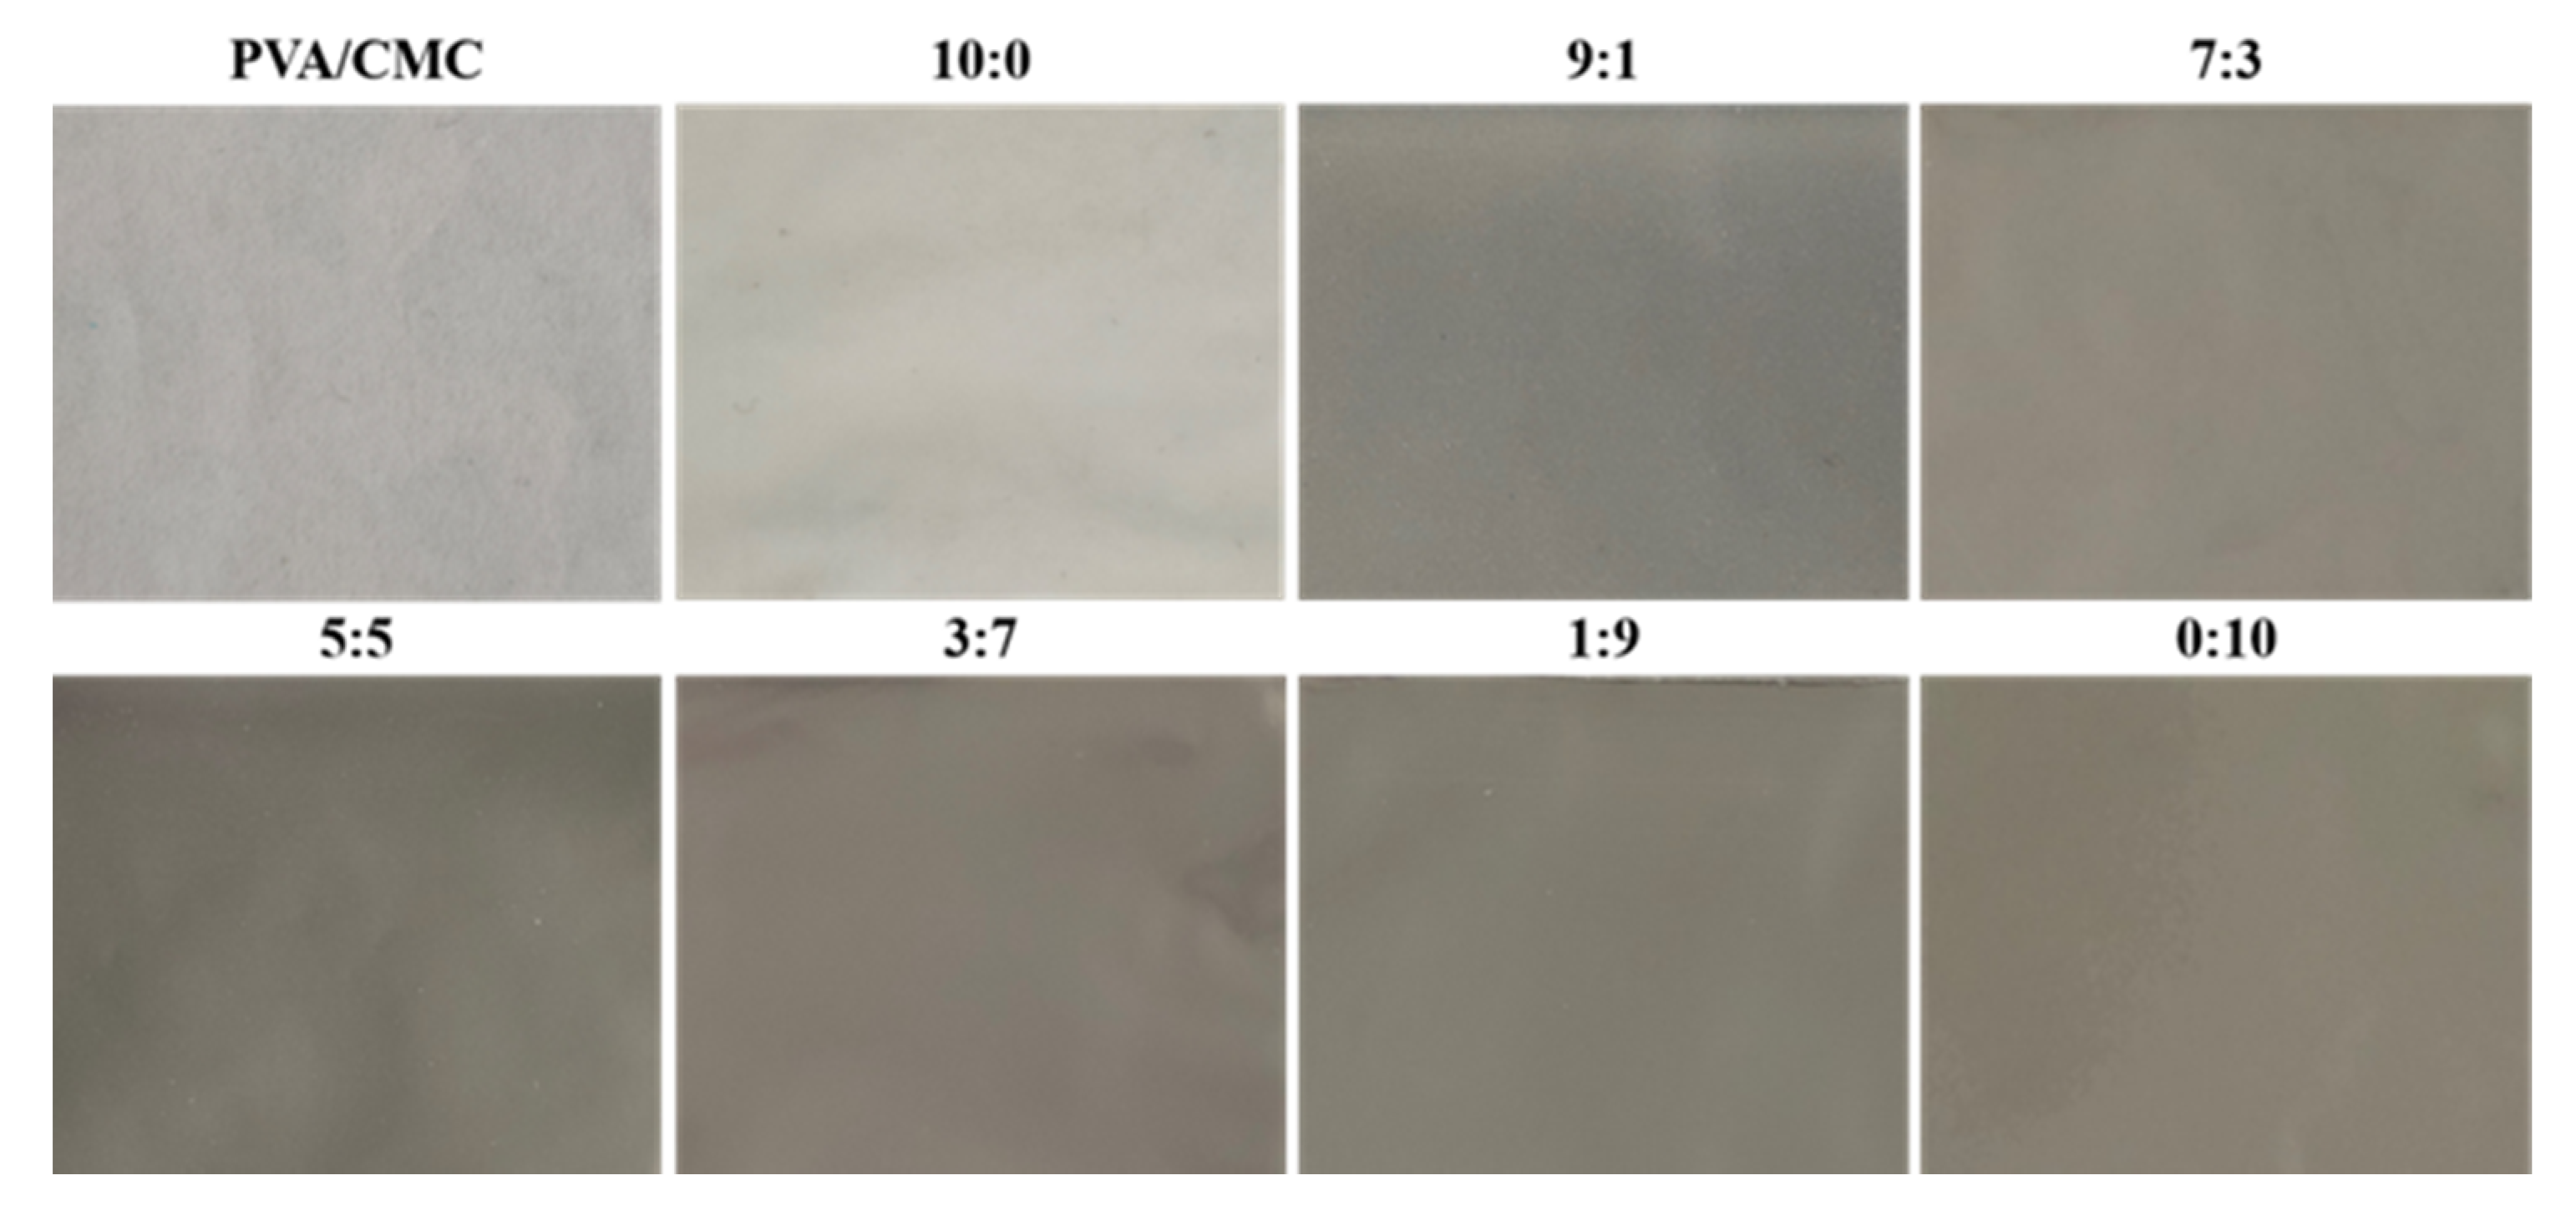
3.2.7. Surface Color
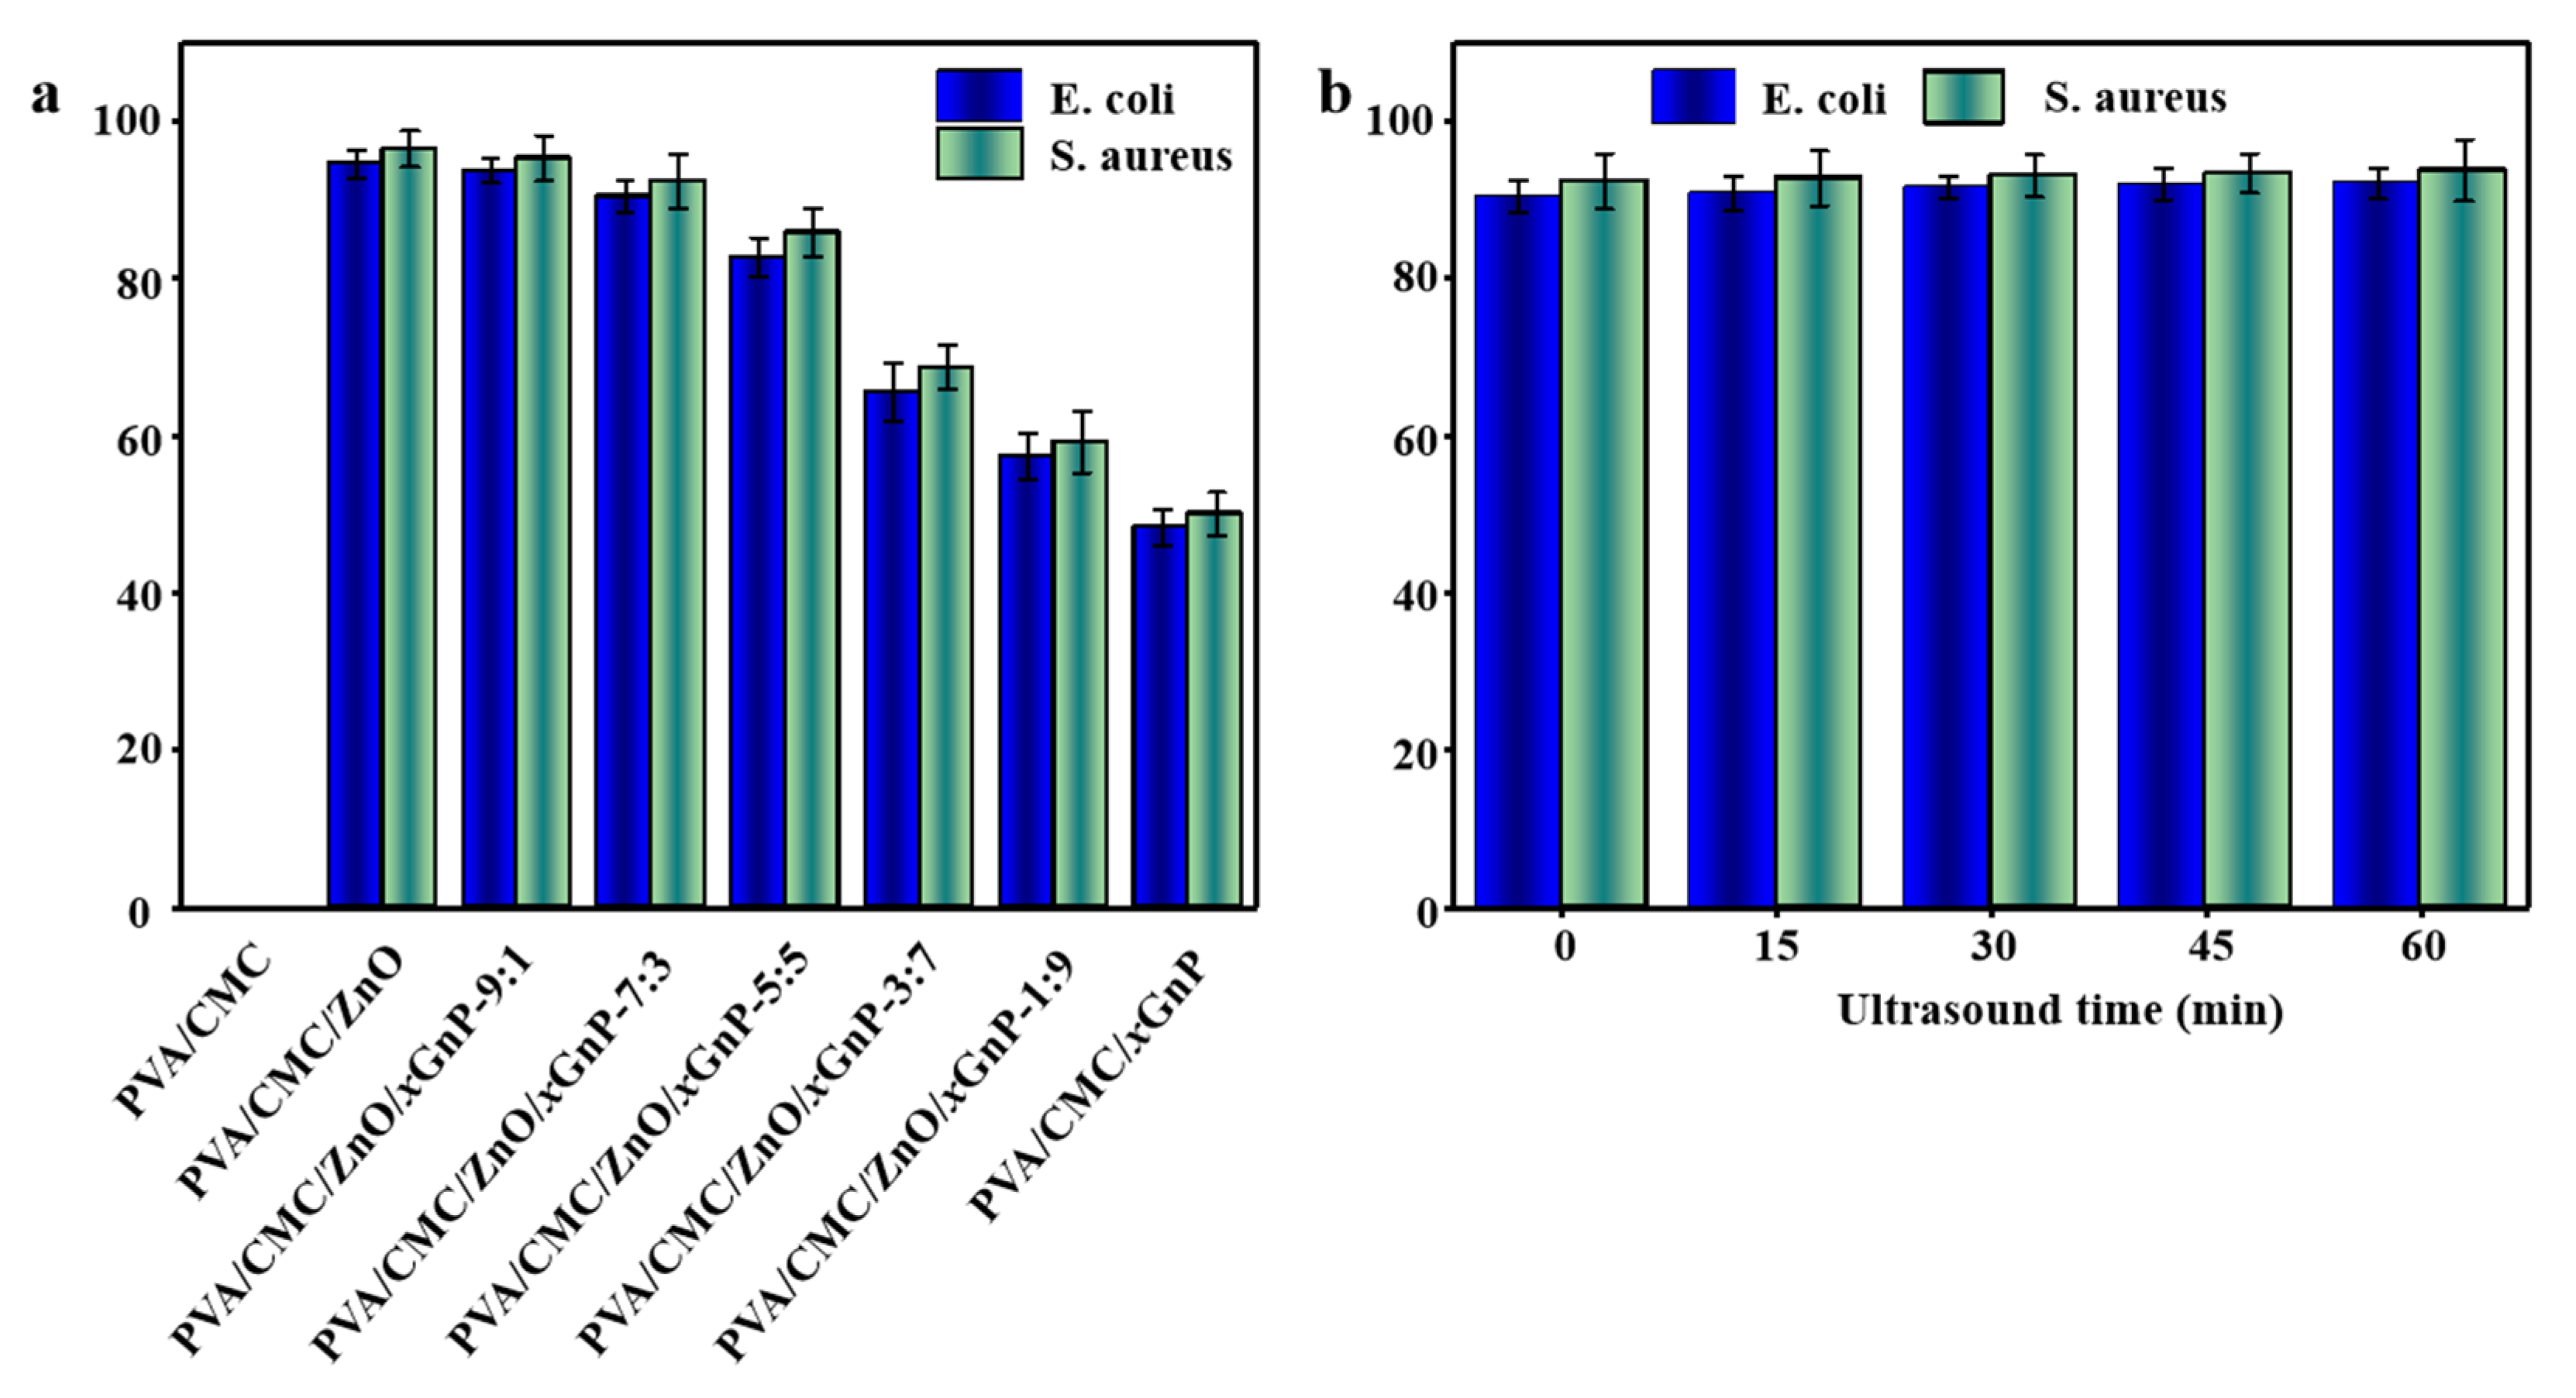
3.2.8. Antimicrobial Activity
3.3. Safety Issues
3.4. Biodegradability
3.5. Preservation Experiment of Strawberries
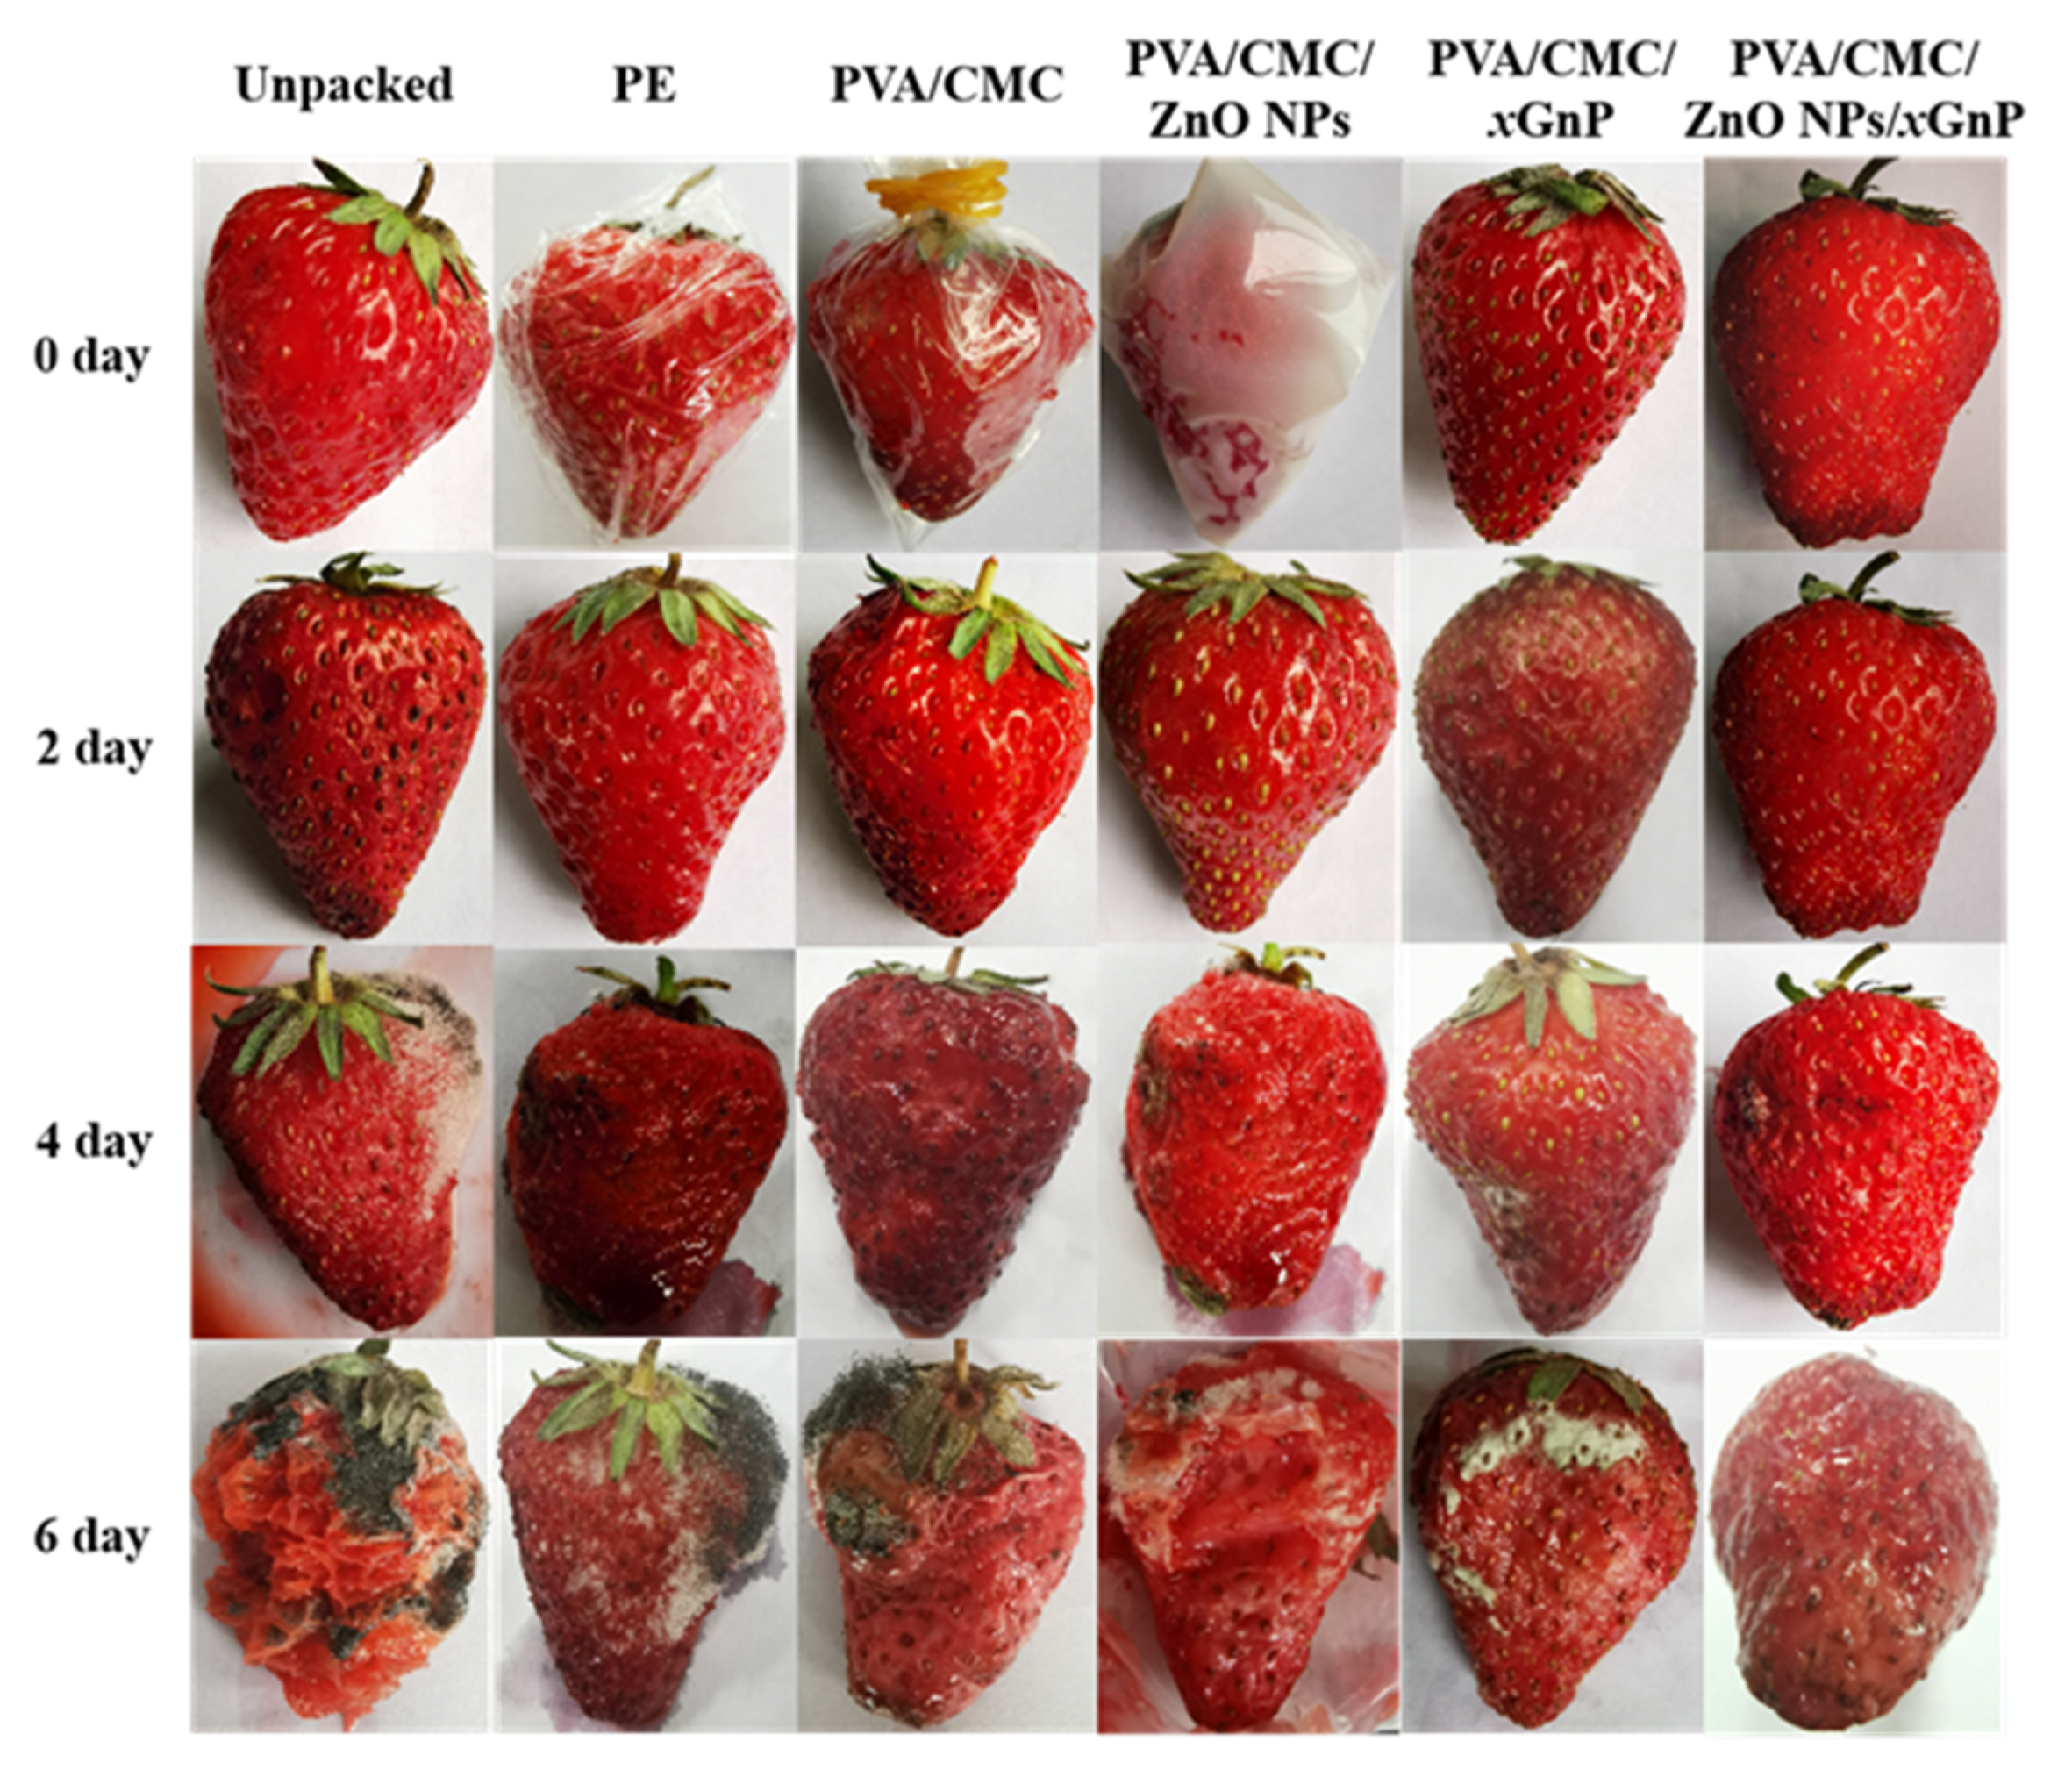
3.5.1. Photographs of Strawberries During the Storage Time
3.5.2. Strawberry Properties
4. Conclusions
Author Contributions
Funding
Conflicts of Interest
Appendix A

| Apparent Colors and Light Transmittance | Ultrasound Time (min) | Samples | |||||||
|---|---|---|---|---|---|---|---|---|---|
| PVA/CMC | 10: 0 | 9:1 | 7:3 | 5:5 | 3:7 | 1:9 | 0:10 | ||
| L | 0 | 90.78 ± 0.26Aa | 91.91 ± 0.35Aa | 48.70 ± 1.12Ba | 38.91 ± 0.12Db | 38.56 ± 0.30Db | 40.69 ± 0.19Ca | 41.48 ± 0.10Cab | 41.34 ± 0.16Ca |
| 15 | 91.31 ± 0.13Aa | 91.40 ± 0.12Aa | 48.54 ± 1.67Ba | 39.54 ± 0.12Cb | 40.02 ± 0.34Ca | 40.56 ± 0.26Ca | 41.69 ± 0.11Cab | 41.56 ± 0.13Ca | |
| 30 | 91.15 ± 0.08Aa | 91.36 ± 0.14Aa | 44.57 ± 2.00Bab | 40.60 ± 0.36Ca | 39.99 ± 0.21Ca | 39.45 ± 0.91Ca | 41.29 ± 0.18Cb | 41.24 ± 0.07Ca | |
| 45 | 90.93 ± 0.14Aa | 91.94 ± 0.15Aa | 42.70 ± 1.81Bb | 39.79 ± 0.42CDab | 38.87 ± 0.16Db | 39.84 ± 0.80CDa | 41.65 ± 0.04BCab | 41.45 ± 0.08BCa | |
| 60 | 90.90 ± 0.10Aa | 92.04 ± 0.09Aa | 42.53 ± 0.85Bb | 39.39 ± 0.25Cb | 39.84 ± 0.14Ca | 38.94 ± 0.55Ca | 41.77 ± 0.14Ba | 41.40 ± 0.22Ba | |
| a | 0 | 0.91 ± 0.15Aa | 0.87 ± 0.17Aa | –4.48 ± 0.10CDa | –4.12 ± 0.10BCa | –3.89 ± 0.15Ba | –4.47 ± 0.10CDa | –4.30 ± 0.11BCDa | –4.56 ± 0.09Db |
| 15 | 0.95 ± 0.08Aa | 1.08 ± 0.11Aa | –4.42 ± 0.07BCDa | –4.17 ± 0.15BCa | –4.06 ± 0.11Ba | –4.46 ± 0.10CDa | –4.40 ± 0.09BCDa | –4.58 ± 0.10Db | |
| 30 | 0.88 ± 0.10Aa | 0.93 ± 0.13Aa | –4.38 ± 0.14Ba | –4.35 ± 0.09Ba | –4.10 ± 0.09Ba | –4.37 ± 0.08Ba | –4.36 ± 0.09Ba | –4.07 ± 0.11Ba | |
| 45 | 0.74 ± 0.09Aa | 0.83 ± 0.08Aa | –4.37 ± 0.15BCa | –4.16 ± 0.07BCa | –4.07 ± 0.02Ba | –4.52 ± 0.09Ca | –4.46 ± 0.09Ca | –4.29 ± 0.17BCab | |
| 60 | 0.63 ± 0.05Aa | 0.77 ± 0.07Aa | –4.53 ± 0.15Ca | –4.15 ± 0.04Ba | –4.08 ± 0.13Ba | –4.54 ± 0.10Ca | –4.55 ± 0.11Ca | –4.00 ± 0.03Ba | |
| b | 0 | –3.87 ± 0.21Eab | –3.72 ± 0.10Eb | 2.88 ± 0.13Aa | 1.71 ± 0.09Ca | 1.32 ± 0.10Da | 1.77 ± 0.01Cb | 1.77 ± 0.09Ca | 2.18 ± 0.01Ba |
| 15 | –4.22 ± 0.09Db | –4.17 ± 0.11Db | 3.12 ± 0.17Aa | 1.79 ± 0.11BCa | 1.46 ± 0.10Ca | 1.95 ± 0.01Bab | 1.90 ± 0.10Ba | 2.11 ± 0.10Ba | |
| 30 | –3.89 ± 0.07Dab | –3.99 ± 0.13Db | 2.93 ± 0.33Aa | 1.88 ± 0.11BCa | 1.46 ± 0.10Ca | 1.94 ± 0.06BCab | 2.03 ± 0.09Ba | 1.50 ± 0.10Cb | |
| 45 | –3.79 ± 0.12Cab | –3.85 ± 0.13Cb | 2.54 ± 0.35Aa | 1.76 ± 0.09Ba | 1.51 ± 0.17Ba | 2.02 ± 0.08ABa | 1.71 ± 0.10Ba | 1.59 ± 0.15Bb | |
| 60 | –3.67 ± 0.03Ea | –2.78 ± 0.22Da | 2.89 ± 0.30Aa | 1.66 ± 0.10BCa | 1.65 ± 0.11BCa | 2.05 ± 0.08Ba | 1.78 ± 0.08Ba | 1.22 ± 0.08Cb | |
| ∆E | 0 | 1.13 ± 0.04Eb | 2.11 ± 0.22Eb | 42.35 ± 0.95Db | 51.76 ± 0.11ABa | 52.03 ± 0.26Aa | 50.05 ± 0.16BCa | 49.25 ± 0.07Bab | 49.46 ± 0.14Ba |
| 15 | 1.41 ± 0.08Da | 1.45 ± 0.07Dc | 42.54 ± 1.44Cb | 51.15 ± 0.10Aa | 50.62 ± 0.29Ab | 50.19 ± 0.22ABa | 49.07 ± 0.10Bb | 49.25 ± 0.09Ba | |
| 30 | 1.31 ± 0.03Ca | 1.55 ± 0.08Cc | 46.39 ± 1.69Bab | 50.13 ± 0.31Ab | 50.65 ± 0.19Ab | 51.28 ± 0.81Aa | 49.47 ± 0.15Aa | 49.43 ± 0.06Aa | |
| 45 | 1.32 ± 0.04Da | 2.12 ± 0.15Db | 48.16 ± 1.54Ca | 50.90 ± 0.37ABab | 51.76 ± 0.15Aa | 50.92 ± 0.52ABa | 49.09 ± 0.03BCb | 49.25 ± 0.09BCa | |
| 60 | 1.41 ± 0.04Da | 2.76 ± 0.13Da | 48.40 ± 1.13Ca | 51.28 ± 0.21Aa | 50.83 ± 0.11ABb | 51.81 ± 0.79Aa | 48.99 ± 0.11Cb | 49.23 ± 0.19BCa | |
| T280 | 0 | 82.38 ± 0.74Aa | 27.69 ± 0.30Ga | 31.32 ± 1.02Fa | 37.75 ± 0.87Eab | 39.97 ±0.93Eab | 46.31 ± 0.90Dab | 53.01 ± 0.84Cb | 61.19 ± 1.37Bab |
| 15 | 82.12 ± 0.70Aa | 27.29 ± 0.42Ha | 31.24 ± 0.79Ga | 37.20 ± 0.36Fab | 39.67 ± 0.83Eab | 45.63 ± 0.73Dab | 52.31 ± 0.79Cb | 60.36 ± 0.70Bab | |
| 30 | 81.78 ± 0.82Aa | 26.72 ± 0.37Ha | 30.67 ± 1.12Ga | 35.62 ± 0.67Fb | 38.32 ± 1.00Eb | 45.21 ± 0.49Db | 51.04 ± 0.38Cb | 58.63 ± 0.84Bb | |
| 45 | 82.01 ± 0.39Aa | 27.33 ± 0.62Ga | 30.98 ± 0.93Fa | 36.35 ± 0.55Eb | 38.70 ± 0.87Eb | 45.23 ± 0.77Db | 51.73 ± 0.67Cb | 58.32 ± 1.03Bb | |
| 60 | 82.89 ± 0.69Aa | 28.36 ± 0.44Ha | 32.92 ± 1.32Ga | 39.23 ± 0.98Fa | 42.83 ± 0.89Ea | 48.33 ± 0.73Da | 55.93 ± 0.56Ca | 63.84 ± 0.73Ba | |
| T600 | 0 | 88.60 ± 0.82Aa | 57.98 ± 0.83Bab | 50.57 ± 0.71Ca | 47.77 ± 0.46Dab | 42.08 ± 0.75Eb | 37.97 ± 0.33Fab | 32.58 ± 0.74Gab | 30.68 ± 0.50Gb |
| 15 | 88.83 ± 0.64Aa | 57.31 ± 0.83Bab | 49.32 ± 0.62Ca | 47.02 ± 1.30Cb | 41.74 ± 0.54Db | 37.05 ± 0.76Eb | 32.02 ± 0.66Fb | 30.47 ± 0.56Fb | |
| 30 | 88.12 ± 0.62Aa | 56.36 ± 0.54Bb | 48.21 ± 1.42Ca | 45.00 ± 0.89Db | 40.12 ± 0.48Eb | 36.49 ± 0.73Fb | 30.18 ± 0.75Gb | 28.94 ± 0.62Gb | |
| 45 | 89.03 ± 0.71Aa | 56.48 ± 0.74Bb | 48.42 ± 0.72Ca | 45.13 ± 0.39Db | 40.74 ± 0.38Eb | 36.72 ± 0.57Fb | 30.42 ± 0.99Gb | 29.30 ± 0.41Gb | |
| 60 | 89.71 ± 1.29Aa | 59.64 ± 0.65Ba | 50.83 ± 0.51Ca | 50.43 ± 0.74Ca | 45.32 ± 0.74Da | 39.92 ± 0.46Ea | 34.82 ± 0.40Fa | 34.29 ± 0.33Fa | |
References
- Abazari, R.; Sanati, S.; Saghatforoush, L.A. Non-aggregated divanadium pentoxide nanoparticles: A one-step facile synthesis. Morphological, structural, compositional, optical properties and photocatalytic activities. Chem. Eng. J. 2014, 236, 82–90. [Google Scholar] [CrossRef]
- Taleb, M.F.A.; El-Mohdy, H.L.A.; El-Rehim, H.A.A. Radiation preparation of PVA/CMC copolymers and their application in removal of dyes. J. Hazard. Mater. 2009, 168, 68–75. [Google Scholar] [CrossRef] [PubMed]
- Yang, J.; Zheng, Y.; Sheng, L.; Chen, H.; Zhao, L.; Yu, W.; Zhao, K.-Q.; Hu, P. Water Induced Shape Memory and Healing Effects by Introducing Carboxymethyl Cellulose Sodium into Poly (vinyl alcohol). Ind. Eng. Chem. Res. 2018, 57, 15046–15053. [Google Scholar] [CrossRef]
- Hallaji, H.; Keshtkar, A.R.; Moosavian, M.A. A novel electrospun PVA/ZnO nanofiber adsorbent for U(VI), Cu(II) and Ni(II) removal from aqueous solution. J. Taiwan Inst. Chem. Eng. 2015, 46, 109–118. [Google Scholar] [CrossRef]
- Abutalib, M.M. Effect of zinc oxide nanorods on the structural, thermal, dielectric and electrical properties of polyvinyl alcohol/carboxymethyle cellulose composites. Phys. B Condens. Matter 2019, 557, 108–116. [Google Scholar] [CrossRef]
- El Sayed, A.M.; El-Gamal, S.; Morsi, W.M.; Mohammed, G. Effect of PVA and copper oxide nanoparticles on the structural, optical, and electrical properties of carboxymethyl cellulose films. J. Mater. Sci. 2015, 50, 4717–4728. [Google Scholar] [CrossRef]
- Zhong, R.; Zhong, Q.; Huo, M.; Yang, B.; Li, H. Preparation of biocompatible nano-ZnO/chitosan microspheres with multi-functions of antibacterial, UV-shielding and dye photodegradation. Int. J. Biol. Macromol. 2020, 146, 939–945. [Google Scholar] [CrossRef]
- Espitia, P.J.P.; Soares, N.D.F.F.; dos Reis Coimbra, J.S.; de Andrade, N.J.; Cruz, R.S.; Medeiros, E.A.A. Zinc Oxide Nanoparticles: Synthesis, Antimicrobial Activity and Food Packaging Applications. Food Bioprocess Technol. 2012, 5, 1447–1464. [Google Scholar] [CrossRef]
- Zhou, T.-J.; Hu, Y.-Y.; Chen, R.-Y.; Zheng, X.; Chen, X.; Chen, Z.; Zhong, J.-Q. Preparation and characterization of bipolar membranes modified by photocatalyst nano-ZnO and nano-CeO2. Appl. Surf. Sci. 2012, 258, 4023–4027. [Google Scholar] [CrossRef]
- Parameswaranpillai, J.; Sanjay, M.R.; Varghese, S.A.; Siengchin, S.; Jose, S.; Salim, N.; Hameed, N.; Magueresse, A. Toughened PS/LDPE/SEBS/xGnP ternary composites: Morphology, mechanical and viscoelastic properties. Int. J. Light. Mater. Manuf. 2019, 2, 64–71. [Google Scholar] [CrossRef]
- Asrofi, M.; Abral, H.; Kasim, A.; Pratoto, A.; Mahardika, M.; Hafizulhaq, F. Mechanical Properties of a Water Hyacinth Nanofiber Cellulose Reinforced Thermoplastic Starch Bionanocomposite: Effect of Ultrasonic Vibration during Processing. Fibers 2018, 6, 40. [Google Scholar] [CrossRef]
- Wang, R.; Ma, N.; Yan, Y.; Wang, Z. Ultrasonic-assisted fabrication of high flux T-type zeolite membranes on alumina hollow fibers. J. Membr. Sci. 2018, 548, 676–684. [Google Scholar] [CrossRef]
- Asrofi, M.; Abral, H.; Putra, Y.K.; Sapuan, S.M.; Kim, H.-J. Effect of duration of sonication during gelatinization on properties of tapioca starch water hyacinth fiber biocomposite. Int. J. Biol. Macromol. 2018, 108, 167–176. [Google Scholar] [CrossRef] [PubMed]
- Liu, Y.; Wang, S.; Lan, W.; Qin, W. Development of ultrasound treated polyvinyl alcohol/tea polyphenol composite films and their physicochemical properties. Ultrason. Sonochem. 2019, 51, 386–394. [Google Scholar] [CrossRef]
- Yan, Y.; Duan, S.; Zhang, H.; Liu, Y.; Li, C.; Hu, B.; Liu, A.; Wu, D.; He, J.; Wu, W. Preparation and characterization of Konjac glucomannan and pullulan composite films for strawberry preservation. Carbohydr. Polym. 2020, 243, 116446. [Google Scholar] [CrossRef]
- Abdeen, Z.I.; El Farargy, A.F.; Negm, N.A. Nanocomposite framework of chitosan/polyvinyl alcohol/ZnO: Preparation, characterization, swelling and antimicrobial evaluation. J. Mol. Liq. 2018, 250, 335–343. [Google Scholar] [CrossRef]
- Swaroop, K.; Somashekarappa, H.M. In vitro Biocompatibility and Antibacterial Activity of Gamma Ray Crosslinked ZnO/PVA Hydrogel Nanocomposites. Mater. Today Proc. 2018, 5, 21314–21321. [Google Scholar] [CrossRef]
- Zhao, Z.; Mao, A.; Gao, W.; Bai, H. A facile in situ method to fabricate transparent, flexible polyvinyl alcohol/ZnO film for UV-shielding. Compos. Commun. 2018, 10, 157–162. [Google Scholar] [CrossRef]
- Saadiah, M.A.; Zhang, D.; Nagao, Y.; Muzakir, S.K.; Samsudin, A.S. Reducing crystallinity on thin film based CMC/PVA hybrid polymer for application as a host in polymer electrolytes. J. Non-Cryst. Solids 2019, 511, 201–211. [Google Scholar] [CrossRef]
- Sun, L.; Sun, J.; Chen, L.; Niu, P.; Yang, X.; Guo, Y. Preparation and characterization of chitosan film incorporated with thinned young apple polyphenols as an active packaging material. Carbohydr. Polym. 2017, 163, 81–91. [Google Scholar] [CrossRef]
- ASTM E96/E96M-16. Standard Test Methods for Water Vapor Transmission of Materials; ASTM International: West Conshohocken, PA, USA, 2016. [Google Scholar]
- ASTM. Standard test methods for tensile properties of thin plastic sheeting. D882–10. In Annual Book of ASTM.; American Society for testing and Materials: Philadelphia, PA, USA, 2010. [Google Scholar]
- Khorasani, M.T.; Joorabloo, A.; Moghaddam, A.; Shamsi, H.; MansooriMoghadam, Z. Incorporation of ZnO nanoparticles into heparinised polyvinyl alcohol/chitosan hydrogels for wound dressing application. Int. J. Biol. Macromol. 2018, 114, 1203–1215. [Google Scholar] [CrossRef]
- Arfat, Y.A.; Benjakul, S.; Prodpran, T.; Sumpavapol, P.; Songtipya, P. Properties and antimicrobial activity of fish protein isolate/fish skin gelatin film containing basil leaf essential oil and zinc oxide nanoparticles. Food Hydrocoll. 2014, 41, 265–273. [Google Scholar] [CrossRef]
- Zhang, R.; Wang, Y.; Ma, D.; Ahmed, S.; Qin, W.; Liu, Y. Effects of ultrasonication duration and graphene oxide and nano-zinc oxide contents on the properties of polyvinyl alcohol nanocomposites. Ultrason. Sonochem. 2019, 59, 104731. [Google Scholar] [CrossRef] [PubMed]
- Gao, Y.; Xu, D.; Ren, D.; Zeng, K.; Wu, X. Green synthesis of zinc oxide nanoparticles using Citrus sinensis peel extract and application to strawberry preservation: A comparison study. LWT 2020, 126, 109297. [Google Scholar] [CrossRef]
- Khodaei, D.; Hamidi-Esfahani, Z. Influence of bioactive edible coatings loaded with Lactobacillus plantarum on physicochemical properties of fresh strawberries. Postharvest. Biol. Technol. 2019, 156, 110944. [Google Scholar] [CrossRef]
- Abral, H.; Atmajaya, A.; Mahardika, M.; Hafizulhaq, F.; Handayani, D.; Sapuan, S.M.; Ilyas, R.A. Effect of ultrasonication duration of polyvinyl alcohol (PVA) gel on characterizations of PVA film. J. Mater. Res. Technol. 2020, 9, 2477–2486. [Google Scholar] [CrossRef]
- Agarwal, R.; Alam, M.S.; Gupta, B. Polyvinyl alcohol-polyethylene oxide-carboxymethyl cellulose membranes for drug delivery. J. Appl. Polym. Sci. 2013, 129, 3728–3736. [Google Scholar] [CrossRef]
- Fasihi, H.; Fazilati, M.; Hashemi, M.; Noshirvani, N. Novel carboxymethyl cellulose-polyvinyl alcohol blend films stabilized by Pickering emulsion incorporation method. Carbohydr. Polym. 2017, 167, 79–89. [Google Scholar] [CrossRef]
- Koutavarapu, R.; Manepalli, R.K.N.R.; Madhav, B.T.P.; Satyanarayana, T.; Nagarjuna, G.; Shim, J.; Rao, M.C. Optical, electrical and photoluminescence studies on Al2O3 doped PVA capped ZnO nanoparticles for optoelectronic device application. Optik 2020, 205, 164236. [Google Scholar] [CrossRef]
- Bouakaz, B.S.; Habi, A.; Grohens, Y.; Pillin, I. Organomontmorillonite/graphene-PLA/PCL nanofilled blends: New strategy to enhance the functional properties of PLA/PCL blend. Appl. Clay Sci. 2017, 139, 81–91. [Google Scholar] [CrossRef]
- Özkan, V.; Yapici, A.; Karaaslan, M.; Akgöl, O. Electromagnetic Scattering Properties of MWCNTs/Graphene Doped Epoxy Layered with PVC Nanofiber/E-Glass Composites. J. Electron. Mater. 2020, 49, 2249–2256. [Google Scholar] [CrossRef]
- Chilkoor, G.; Sarder, R.; Islam, J.; ArunKumar, K.E.; Ratnayake, I.; Star, S.; Jasthi, B.K.; Sereda, G.; Koratkar, N.; Meyyappan, M.; et al. Maleic anhydride-functionalized graphene nanofillers render epoxy coatings highly resistant to corrosion and microbial attack. Carbon 2020, 159, 586–597. [Google Scholar] [CrossRef]
- Akhavan, A.; Khoylou, F.; Ataeivarjovi, E. Preparation and characterization of gamma irradiated Starch/PVA/ZnO nanocomposite films. Radiat. Phys. Chem. 2017, 138, 49–53. [Google Scholar] [CrossRef]
- Shtepliuk, I.; Ivanov, I.G.; Pliatsikas, N.; Iakimov, T.; Jamnig, A.; Sarakinos, K.; Yakimova, R. Probing the uniformity of silver-doped epitaxial graphene by micro-Raman mapping. Phys. B Condens. Matter 2020, 580, 411751. [Google Scholar] [CrossRef]
- Abdelwahab, N.A.; Ghoneim, A.M. Photocatalytic activity of ZnO coated magnetic crosslinked chitosan/polyvinyl alcohol microspheres. Mater. Sci. Eng. B 2018, 228, 7–17. [Google Scholar] [CrossRef]
- Isa, M.I.N.; Samsudin, A.S. Structural and Ionic Transport Study on CMC Doped NH4Br: A New Types of Biopolymer Electrolytes. J. Appl. Sci. 2012, 12, 174–179. [Google Scholar] [CrossRef]
- Hemalatha, K.S.; Rukmani, K.; Suriyamurthy, N.; Nagabhushana, B.M. Synthesis, characterization and optical properties of hybrid PVA–ZnO nanocomposite: A composition dependent study. Mater. Res. Bull. 2014, 51, 438–446. [Google Scholar] [CrossRef]
- Chieng, B.W.; Ibrahim, N.A.; Yunus, W.M.Z.W.; Hussein, M.Z.; Loo, Y.Y. Effect of graphene nanoplatelets as nanofiller in plasticized poly(lactic acid) nanocomposites. J. Therm. Anal. Calorim. 2014, 118, 1551–1559. [Google Scholar] [CrossRef]
- Goswami, A.; Bajpai, A.K.; Bajpai, J.; Sinha, B.K. Designing vanadium pentoxide-carboxymethyl cellulose/polyvinyl alcohol-based bionanocomposite films and study of their structure, topography, mechanical, electrical and optical behavior. Polym. Bull. 2017, 75, 781–807. [Google Scholar] [CrossRef]
- Lefatshe, K.; Muiva, C.M.; Kebaabetswe, L.P. Extraction of nanocellulose and in-situ casting of ZnO/cellulose nanocomposite with enhanced photocatalytic and antibacterial activity. Carbohydr. Polym. 2017, 164, 301–308. [Google Scholar] [CrossRef]
- Chieng, B.W.; Ibrahim, N.A.; Yunus, W.M.; Hussein, M.Z.; Silverajah, V.S.G. Graphene nanoplatelets as novel reinforcement filler in poly(lactic acid)/epoxidized palm oil green nanocomposites: Mechanical properties. Int. J. Mol. Sci. 2012, 13, 10920–10934. [Google Scholar] [CrossRef] [PubMed]
- Bai, Q.-Q.; Wei, X.; Yang, J.-H.; Zhang, N.; Huang, T.; Wang, Y.; Zhou, Z.-W. Dispersion and network formation of graphene platelets in polystyrene composites and the resultant conductive properties. Compos. Part A Appl. Sci. Manuf. 2017, 96, 89–98. [Google Scholar] [CrossRef]
- Kochkina, N.E.; Butikova, O.A. Effect of fibrous TiO2 filler on the structural, mechanical, barrier and optical characteristics of biodegradable maize starch/PVA composite films. Int. J. Biol. Macromol. 2019, 139, 431–439. [Google Scholar] [CrossRef] [PubMed]
- El-Sayed, S.; Mahmoud, K.H.; Fatah, A.A.; Hassen, A. DSC, TGA and dielectric properties of carboxymethyl cellulose/polyvinyl alcohol blends. Phys. B Condens. Matter 2011, 406, 4068–4076. [Google Scholar] [CrossRef]
- Chakraborty, G.; Valapa, R.B.; Pugazhenthi, G.; Katiyar, V. Investigating the properties of poly (lactic acid)/exfoliated graphene based nanocomposites fabricated by versatile coating approach. Int. J. Biol. Macromol. 2018, 113, 1080–1091. [Google Scholar] [CrossRef]
- Girdthep, S.; Komrapit, N.; Molloy, R.; Lumyong, S.; Punyodom, W.; Worajittiphon, P. Effect of plate-like particles on properties of poly(lactic acid)/poly(butylene adipate-co-terephthalate) blend: A comparative study between modified montmorillonite and graphene nanoplatelets. Compos. Sci. Technol. 2015, 119, 115–123. [Google Scholar] [CrossRef]
- Rodríguez-Tobías, H.; Morales, G.; Grande, D. Improvement of mechanical properties and antibacterial activity of electrospun poly(d, l-lactide)-based mats by incorporation of ZnO- graft -poly(d, l-lactide) nanoparticles. Mater. Chem. Phys. 2016, 182, 324–331. [Google Scholar] [CrossRef]
- Scaffaro, R.; Botta, L.; Maio, A.; Gallo, G. PLA graphene nanoplatelets nanocomposites: Physical properties and release kinetics of an antimicrobial agent. Compos. Part B Eng. 2017, 109, 138–146. [Google Scholar] [CrossRef]
- Zhou, Y.G.; Zhao, X.D.; Dong, B.B.; Liu, C.T. Improvement of the dispersity of micro-nano particles for PP/PVC composites using gas-assisted dispersion in a controlled foaming process. Polym. Eng. Sci. 2019, 60, 524–534. [Google Scholar] [CrossRef]
- Wang, J.; Zhang, W.; Yin, Q.; Yin, B.; Jia, H. Highly sensitive and flexible strain sensors based on natural rubber/graphene foam composites: The role of pore sizes of graphene foam. J. Mater. Sci. Mater. Electron. 2019, 31, 125–133. [Google Scholar] [CrossRef]
- Ranjan, S.; Mukherjee, B.; Islam, A.; Pandey, K.K.; Gupta, R.; Keshri, A.K. Microstructure, mechanical and high temperature tribological behaviour of graphene nanoplatelets reinforced plasma sprayed titanium nitride coating. J. Eur. Ceram. Soc. 2020, 40, 660–671. [Google Scholar] [CrossRef]
- Abral, H.; Putra, G.J.; Asrofi, M.; Park, J.-W.; Kim, H.-J. Effect of vibration duration of high ultrasound applied to bio-composite while gelatinized on its properties. Ultrason. Sonochem. 2018, 40, 697–702. [Google Scholar] [CrossRef] [PubMed]
- Cheng, W.; Chen, J.; Liu, D.; Ye, X.; Ke, F. Impact of ultrasonic treatment on properties of starch film-forming dispersion and the resulting films. Carbohydr. Polym. 2010, 81, 707–711. [Google Scholar] [CrossRef]
- Gao, Y.; Jing, H.W.; Chen, S.J.; Du, M.R.; Chen, W.Q.; Duan, W.H. Influence of ultrasonication on the dispersion and enhancing effect of graphene oxide–carbon nanotube hybrid nanoreinforcement in cementitious composite. Compos. Part B Eng. 2019, 164, 45–53. [Google Scholar] [CrossRef]
- Peres, G.L.; Leite, D.C.; Silveira, N.P.D. Ultrasound effect on molecular weight reduction of amylopectin. Starch-Stärke 2015, 67, 407–414. [Google Scholar] [CrossRef]
- Wang, D.; Lv, R.; Ma, X.; Zou, M.; Wang, W.; Yan, L.; Ding, T.; Ye, X.; Liu, D. Lysozyme immobilization on the calcium alginate film under sonication: Development of an antimicrobial film. Food Hydrocoll. 2018, 83, 1–8.B. [Google Scholar] [CrossRef]
- Han, W.; Wu, Z.; Li, Y.; Wang, Y. Graphene family nanomaterials (GFNs)—Promising materials for antimicrobial coating and film: A review. Chem. Eng. J. 2019, 358, 1022–1037. [Google Scholar] [CrossRef]
- Akhavan, O.; Ghaderi, E. Toxicity of graphene and graphene oxide nanowalls against bacteria. ACS Nano 2010, 4, 5731–5736. [Google Scholar] [CrossRef]
- Heydari-Majd, M.; Ghanbarzadeh, B.; Shahidi-Noghabi, M.; Najafi, M.A.; Hosseini, M. A new active nanocomposite film based on PLA/ZnO nanoparticle/essential oils for the preservation of refrigerated Otolithes ruber fillets. Food Packag. Shelf Life 2019, 19, 94–103. [Google Scholar] [CrossRef]
- Panea, B.; Ripoll, G.; González, J.; Fernández-Cuello, Á.; Albertí, P. Effect of nanocomposite packaging containing different proportions of ZnO and Ag on chicken breast meat quality. J. Food Eng. 2014, 123, 104–112. [Google Scholar] [CrossRef]
- Deepa, B.; Abraham, E.; Pothan, L.A.; Cordeiro, N.; Faria, M.; Thomas, S. Biodegradable Nanocomposite Films Based on Sodium Alginate and Cellulose Nanofibrils. Materials 2016, 9, 50. [Google Scholar] [CrossRef] [PubMed]
- Salehpour, S.; Jonoobi, M.; Ahmadzadeh, M.; Siracusa, V.; Rafieian, F.; Oksman, K. Biodegradation and ecotoxicological impact of cellulose nanocomposites in municipal solid waste composting. Int. J. Biol. Macromol. 2018, 111, 264–270. [Google Scholar] [CrossRef] [PubMed]
- Lani, N.S.; Ngadi, N.; Johari, A.; Jusoh, M. Isolation, Characterization, and Application of Nanocellulose from Oil Palm Empty Fruit Bunch Fiber as Nanocomposites. J. Nanomater. 2014, 2014, 702538. [Google Scholar] [CrossRef]


| Sample | Tg (°C) | Tc (°C) | Tm (°C) | Xc (°C) |
|---|---|---|---|---|
| PVA/CMC | 92.52 | 226.49 | 221.80 | 45.52 |
| PVA/CMC/ZnO NPs | 115.48 | 227.48 | 221.92 | 49.33 |
| PVA/CMC/xGnP | 119.92 | 226.21 | 220.24 | 46.94 |
| PVA/CMC/ZnO NPs/xGnP | 99.07 | 226.68 | 221.21 | 53.20 |
| Time (Days) | Ultrasound Time (min) | Samples | |||||||
|---|---|---|---|---|---|---|---|---|---|
| PVA/CMC | 10: 0 | 9:1 | 7:3 | 5:5 | 3:7 | 1:9 | 0:10 | ||
| 5 | 0 | 14.82 ± 1.73Ac | 8.72 ± 1.02Bb | 8.01 ± 1.21BCb | 6.23 ± 0.63BCDb | 6.11 ± 0.82BCDb | 4.63 ± 0.73CDc | 4.22 ± 0.38Dc | 4.02 ± 1.32Dc |
| 15 | 15.74 ± 1.37Abc | 9.58 ± 2.34Bb | 9.64 ± 2.09Bb | 7.24 ± 1.13Bb | 7.08 ± 0.91Bb | 5.88 ± 0.56Bbc | 4.90 ± 0.44Bc | 5.57 ± 0.78Bbc | |
| 30 | 18.83 ± 2.11Aabc | 11.77 ± 1.78Bb | 11.56 ± 1.64Bab | 9.69 ± 1.57BCab | 8.33 ± 0.75BCb | 7.49 ± 0.85BCabc | 6.46 ± 0.57Cbc | 7.72 ± 1.36BCbc | |
| 45 | 21.54 ± 1.57Aab | 14.90 ± 1.67Bab | 14.37 ± 1.08Bab | 11.17 ± 1.27BCab | 10.57 ± 1.45BCab | 8.37 ± 0.93Cab | 8.83 ± 0.89Cb | 9.64 ± 0.98Cab | |
| 60 | 24.62 ± 1.84Aa | 18.38 ± 1.09Ba | 17.98 ± 2.37BCa | 14.65 ± 2.01BCDa | 13.29 ± 1.68BCDa | 10.12 ± 1.27Da | 12.34 ± 1.38CDa | 12.78 ± 1.37BCDa | |
| 10 | 0 | 23.93 ± 2.31Ab | 17.96 ± 2.83Ba | 17.29 ± 1.73BCa | 14.82 ± 1.03BCb | 13.23 ± 2.02BCa | 11.83 ± 1.36BCb | 11.20 ± 1.20Ca | 11.11 ± 1.05Ca |
| 15 | 25.47 ± 1.87Ab | 19.24 ± 1.14Ba | 18.74 ± 1.46Ba | 15.03 ± 1.27BCab | 14.62 ± 1.78BCa | 12.67 ± 0.98Cab | 12.34 ± 1.44Ca | 11.95 ± 1.18Ca | |
| 30 | 26.99 ± 1.37Aab | 21.65 ± 1.57Ba | 19.26 ± 1.39BCa | 15.98 ± 1.28CDab | 15.24 ± 1.62CDa | 13.46 ± 1.02Dab | 13.18 ± 1.30Da | 12.76 ± 1.33Da | |
| 45 | 28.63 ±1.59Aab | 22.97 ± 1.63Ba | 20.98 ± 1.58BCa | 16.74 ± 1.33CDab | 16.32 ± 1.58CDa | 14.79 ± 1.26Dab | 14.67 ± 1.28Da | 13.39 ± 1.49Da | |
| 60 | 30.19 ± 1.62Aa | 23.88 ± 1.77Ba | 21.75 ± 2.01BCa | 18.66 ± 1.49BCDa | 17.95 ± 1.66CDa | 16.03 ± 1.37CDa | 15.29 ± 1.67Da | 14.28 ± 1.52Da | |
| 15 | 0 | 30.82 ± 3.02Aa | 23.93 ± 2.86AB | 21.56 ± 3.19BCa | 20.39 ± 2.63BCa | 18.30 ± 2.53BCa | 17.94 ± 1.94BCa | 15.34 ± 1.50BCa | 14.38 ± 1.44Ca |
| 15 | 31.24 ± 2.47Aa | 25.13 ± 1.73Ba | 22.91 ± 1.01BCa | 21.57 ± 0.75BCDa | 19.42 ± 1.10CDEa | 19.02 ± 1.88CDEa | 16.72 ± 0.47DEa | 15.73 ± 1.32Ea | |
| 30 | 33.19 ± 2.34Aa | 26.79 ± 1.68Ba | 24.04 ± 1.27BCa | 22.82 ± 1.03BCDa | 20.79 ± 1.78CDEa | 19.87 ± 1.21CDEa | 17.92 ± 0.87DEa | 16.92 ± 1.29Ea | |
| 45 | 34.68 ± 2.18Aa | 27.36 ± 1.29Ba | 25.69 ± 1.18BCa | 24.29 ± 1.28BCa | 21.94 ± 1.62CDa | 20.75 ± 1.34CDa | 18.37 ± 0.92Da | 17.02 ± 1.45Da | |
| 60 | 35.72 ± 2.57Aa | 29.61 ± 1.11Ba | 26.83 ± 1.37BCa | 25.63 ± 1.39BCa | 23.48 ± 1.56CDa | 21.99 ± 1.55CDa | 19.28 ± 1.25Da | 18.54 ± 1.09Da | |
| 20 | 0 | 37.96 ± 3.60Aa | 32.49 ± 3.25ABa | 30.84 ± 2.87ABa | 27.93 ± 2.62BCa | 24.50 ± 2.43BCa | 23.26 ± 2.30BCa | 21.34 ± 1.95Ca | 20.83 ± 2.01Ca |
| 15 | 38.88 ± 1.67Aa | 33.68 ± 1a.09Aa | 31.79 ± 1.78BCa | 28.62 ± 1.73BCDa | 25.50 ± 2.02CDa | 24.69 ± 2.17CDa | 22.68 ± 1.78Da | 21.87 ± 1.76Da | |
| 30 | 39.29 ± 2.04Aa | 35.13 ± 1.23ABa | 32.55 ± 1.69BCa | 29.17 ± 1.38CDa | 26.79 ± 1.38DEa | 25.61 ± 1.68DEa | 23.47 ± 1.64Ea | 23.04 ± 1.58Ea | |
| 45 | 40.76 ± 1.78Aa | 36.62 ± 1.28ABa | 33.49 ± 1.34BCa | 30.56 ± 1.22CDa | 27.15 ± 1.47DEa | 27.01 ± 1.57DEa | 24.39 ± 1.55Ea | 24.65 ± 1.21Ea | |
| 60 | 41.54 ± 1.46Aa | 37.72 ± 1.36ABa | 34.27 ± 1.22BCa | 31.47 ± 1.35CDa | 28.86 ± 1.58DEa | 28.34 ± 1.34DEa | 25.15 ± 1.28Ea | 25.81 ± 1.33Ea | |
| Strawberry Properties | Storage Time (Days) | Unpacked | PE | PVA/CMC | PVA/CMC/ ZnO NPs | PVA/CMC/xGnP | PVA/CMC/ ZnO NPs/xGnP |
|---|---|---|---|---|---|---|---|
| Weight loss ratio (%) | 2 | 3.34 ± 0.11Ac | 3.01 ± 0.53Ac | 2.98 ± 0.47Ac | 2.57 ± 0.77Ab | 2.87 ± 1.04Ac | 2.46 ± 0.27Ab |
| 4 | 12.92 ± 1.23Ab | 12.58 ± 0.98Ab | 11.79 ± 1.22ABb | 8.54 ± 1.38ABb | 10.86 ± 1.47ABb | 7.51 ± 1.55Bb | |
| 6 | 37.67 ± 1.54Aa | 35.62 ± 1.68ABa | 29.99 ± 2.49BCa | 23.67 ± 1.79Ca | 27.63 ± 1.82CDa | 18.66 ± 1.99Da | |
| Firmness(Normalized) | 0 | 0.91964 ± 0.89706Aa | 0.98214 ± 0.67647Aa | 0.9375 ± 0.98529Aa | 0.92857 ± 1Aa | 0.94643 ± 0.10294Aa | 1 ± 0.95588Aa |
| 2 | 0.6875 ± 0.39706Aa | 0.79464 ± 0.83824Aa | 0.73214 ± 0.52941Aa | 0.77679 ± 0.55882Aa | 0.75893 ± 0.67647Aa | 0.80357 ± 0.70588Aa | |
| 4 | 0.36607 ± 0.47059Aa | 0.45536 ± 0.89706Aa | 0.47321 ± 0.14706Aa | 0.51786 ± 0.32353Aa | 0.5 ± 0.60294Aa | 0.55357 ± 0.97059Aa | |
| 6 | 0 ± 0Aa | 0.125 ± 0.02941ABa | 0.1875 ± 0.11765ABa | 0.28571 ± 0.23529ABa | 0.24107 ± 0.22059ABa | 0.41071 ± 0.17647Ba | |
| Content of Total Soluble Solids (%) | 0 | 11 ± 0.79Aa | 11 ± 1.02Aa | 12 ± 1.23Aa | 11 ± 1.24Aa | 11 ± 1.28Aa | 12 ± 1.25Aa |
| 2 | 9 ± 0.23Aab | 9.5 ± 0.67Aab | 10 ± 0.92Aab | 10 ± 0.92Aab | 10.5 ± 1.05Ab | 11 ± 1.38Aab | |
| 4 | 6.5 ± 0.27Abc | 7 ± 0.48ABbc | 7.5 ± 0.38ABbc | 8 ± 0.67Bbc | 7 ± 0.89Bc | 9.5 ± 0.79Bab | |
| 6 | 4 ± 0.87Ac | 5 ± 0.52ABc | 6 ± 0.45ABc | 6.5 ± 0.58ABCc | 6.5 ± 0.57BCc | 8 ± 0.35Cb | |
| Titratable Acidity (%) | 0 | 0.84 ± 0.21Aa | 0.84 ± 0.22Aa | 0.82 ± 0.14Aa | 0.85 ± 0.17Aa | 0.82 ± 0.01Aa | 0.84 ± 0.12Aa |
| 2 | 0.75 ± 0.18Aa | 0.76 ± 0.17Aa | 0.75 ± 0.12Aa | 0.79 ± 0.12Aa | 0.75 ± 0.13Aa | 0.80 ± 0.14Aa | |
| 4 | 0.55 ± 0.11Aa | 0.58 ± 0.12Aa | 0.56 ± 0.05Aab | 0.60 ± 0.07Aa | 0.57 ± 0.06Aab | 0.76 ± 0.08Aa | |
| 6 | 0.31 ± 0.08Aa | 0.33 ± 0.10Aa | 0.33 ± 0.03Ab | 0.42 ± 0.01Aa | 0.35 ± 0.04Ab | 0.53 ± 0.06Aa |
© 2020 by the authors. Licensee MDPI, Basel, Switzerland. This article is an open access article distributed under the terms and conditions of the Creative Commons Attribution (CC BY) license (http://creativecommons.org/licenses/by/4.0/).
Share and Cite
Ji, T.; Zhang, R.; Dong, X.; Sameen, D.E.; Ahmed, S.; Li, S.; Liu, Y. Effects of Ultrasonication Time on the Properties of Polyvinyl Alcohol/Sodium Carboxymethyl Cellulose/Nano-ZnO/Multilayer Graphene Nanoplatelet Composite Films. Nanomaterials 2020, 10, 1797. https://doi.org/10.3390/nano10091797
Ji T, Zhang R, Dong X, Sameen DE, Ahmed S, Li S, Liu Y. Effects of Ultrasonication Time on the Properties of Polyvinyl Alcohol/Sodium Carboxymethyl Cellulose/Nano-ZnO/Multilayer Graphene Nanoplatelet Composite Films. Nanomaterials. 2020; 10(9):1797. https://doi.org/10.3390/nano10091797
Chicago/Turabian StyleJi, Tengteng, Rong Zhang, Xiaorong Dong, Dur E Sameen, Saeed Ahmed, Suqing Li, and Yaowen Liu. 2020. "Effects of Ultrasonication Time on the Properties of Polyvinyl Alcohol/Sodium Carboxymethyl Cellulose/Nano-ZnO/Multilayer Graphene Nanoplatelet Composite Films" Nanomaterials 10, no. 9: 1797. https://doi.org/10.3390/nano10091797
APA StyleJi, T., Zhang, R., Dong, X., Sameen, D. E., Ahmed, S., Li, S., & Liu, Y. (2020). Effects of Ultrasonication Time on the Properties of Polyvinyl Alcohol/Sodium Carboxymethyl Cellulose/Nano-ZnO/Multilayer Graphene Nanoplatelet Composite Films. Nanomaterials, 10(9), 1797. https://doi.org/10.3390/nano10091797