Abstract
The present study aimed to investigate individual differences in practice effects during progressive matrices based on Carpenter et al.’s taxonomy of abstract rules. To this end, data from a non-verbal reasoning test, the Abstract Reasoning Test (ART), were used. Because the ART was developed from Carpenter et al.’s theory, the impact of extraneous factors unrelated to the theoretical model is minimized, thereby allowing for a more precise identification of practice effects. The sample consisted of 765 military recruits who responded to 34 items on the ART. Analyses were conducted using a random weights operation-specific learning model (RWOSLM), in which practice parameters were treated as random effects allowed to vary across individuals. The model measures within-test practice effects specific to each examinee, allowing the hypothesis of rule learning during the ART to be assessed at the individual level. Correlations between practice effects and external measures associated with intelligence were examined to investigate the nature of the practice effects. The results suggest individual differences in rule learning within the ART. Decreases in difficulty were observed for both pairwise progression and figure addition or subtraction, although between-person variability was evident only for the latter. Additionally, the results revealed between-person variability in decreases in difficulty associated with one of the items’ figural properties, which suggests the existence of individual differences in the process of increasing familiarity with this feature throughout the test. Individual differences in practice effects during the ART significantly correlated with external measures of abilities and intellect, suggesting that practice effects during progressive matrices are conceptually tied to intelligence.
1. Introduction
Identifying the cognitive processes underlying performance on intelligence tests is essential for developing a comprehensive understanding of the nature of intelligence. However, the inherent complexity of intelligence tests often makes this identification challenging, thereby perpetuating ongoing debates about the definition and scope of intelligence. To elucidate these processes, rigorous experimental and psychometric analyses of the most representative measures of intelligence are required.
One of the most influential and studied intelligence tests is the Raven’s Advanced Progressive Matrices (RAPM; J. C. Raven 1965). Originally developed by John C. Raven, the progressive matrices were designed to assess the ability to educe relations and correlates, aligning with Spearman’s (1927) definition of the general intelligence factor (g). The RAPM is a derivative of the original progressive matrices designed to spread the scores of the top 20% of the population (Raven and Raven 2003). The centrality of the RAPM among cognitive ability tests has led many experts to consider it the best measure of general intelligence (e.g., Jensen 1998; Snow et al. 1984). Each RAPM item consists of a 3 × 3 matrix of figural elements with the bottom right entry missing. The elements in the matrix follow a pattern based on abstract rules, so respondents must induce the rules in order to identify the element that fills the missing entry.
Based on the analysis of verbal protocols, eye fixation patterns, and errors, Carpenter et al. (1990) developed a processing theory of performance on the RAPM. The authors identified five analytic rules that govern the elements in the matrix (Carpenter et al. 1990): constant in a row (CR: the same value occurs throughout a row, but changes down a column); quantitative pairwise progression (PP: a quantitative increment or decrement occurs between adjacent entries in an attribute such as size, position, or number); figure addition or subtraction (A/S: a figure from one column is added to or subtracted from another figure to produce the third); the distribution of three values (D3: three values from a categorical attribute are distributed through a row); and the distribution of two values (D2: two values from a categorical attribute are distributed through a row; the third value is null). The theory postulates two processes involved in solving RAPM items: correspondence finding and goal management. Correspondence finding entails identifying the elements in the matrix that are governed by a rule, whereas goal management involves decomposing the problem into sub-goals in order to facilitate exploring tentative solution paths while preserving previous progress. These processes rely on different abilities and are affected by different item features. Specifically, correspondence finding relies on the ability to induce abstract relations and is influenced by the type of rule, whereas goal management relies on working memory and is influenced by the number of rules involved in the item. As a result, the difficulty of RAPM items depends on the type and number of rules involved in their resolution. According to Carpenter et al. (1990), the easiest rule to induce is CR, which requires storing only one value for an attribute. The induction of PP is also relatively easy, requiring only basic perceptual comparison of two elements for the pairwise relation to be extrapolated to the third. A/S, D3, and D2, in contrast, are more difficult to induce than PP since they involve conceptual processes and require simultaneous consideration of all three elements. Finally, D2 is the most difficult rule to induce as it requires the additional ability to form abstract correspondences involving null arguments.
In addition, subsequent research has shown that the drawing features involved in the matrices may constitute another source of difficulty in the RAPM (Embretson 2002). More specifically, Embretson (2002) proposed a classification of three figural properties that may impact performance on the RAPM: overlay, distortion, and fusion. Overlay occurs when multiple objects in a matrix entry are superimposed, distortion occurs when the shapes of corresponding objects are deformed, and fusion occurs when multiple objects in an entry can be perceived as one larger object. Embretson (2002) found that distortion was positively related to item difficulty in the RAPM, whereas overlay and fusion correlated negatively with item difficulty, although the effect of overlay was only marginally significant.
Despite the consensus on the relevance of Carpenter et al.’s (1990) theory, later studies have suggested that learning processes may also occur during the RAPM (e.g., Birney et al. 2017; Bui and Birney 2014; Ren et al. 2014; Verguts and De Boeck 2002). These processes unfold across items as individuals practice the rules required to solve them. The hypothesis of learning during the RAPM aligns with Raven’s own conception of the progressive matrices, as he acknowledged that certain learning processes took place while responding to the items (J. Raven 2008). Confirming the existence of rule-learning processes in a benchmark intelligence test such as the RAPM would have important theoretical implications, as it would require incorporating learning into the model as a fundamental component of intelligence.
Although the above-mentioned findings challenge the current theoretical framework of RAPM performance, the existing evidence supporting the learning hypothesis remains inconclusive. Most of the evidence was obtained either under conditions more favorable to learning (e.g., increased exposure to items, explicit feedback, etc.) than those involved in the standard administration of the RAPM or by using modified versions of the items (e.g., Bui and Birney 2014; Verguts and De Boeck 2002), which raises concerns about the validity of the measure as an indicator of general intelligence and the generalizability of the results to the standard use of the RAPM. Additionally, other studies have identified an item-position effect during the RAPM (e.g., Lozano 2015; Ren et al. 2014; Schweizer et al. 2009). However, attributing this effect to rule learning requires further empirical validation.
Lozano and Revuelta (2020) investigated practice effects associated with the abstract rules involved in the RAPM under standard administration conditions. To that end, the authors used operation-specific learning models (Fischer and Formann 1982; Lozano and Revuelta 2021; Spada 1977; Spada and McGaw 1985) in combination with Carpenter et al.’s (1990) taxonomy of rules. This approach is particularly suitable for gathering information on the rule-learning hypothesis, as it allows for modeling practice effects specifically associated with each of the abstract rules involved in the test. However, their results did not support the existence of rule learning in the RAPM. On the contrary, all rules showed a significant increase in difficulty throughout the test as a function of practice. Interestingly, the results suggested the presence of learning effects associated with the items’ figural properties, a possibility that had not received attention in the previous literature.
Nevertheless, Lozano and Revuelta’s (2020) study presents certain limitations that warrant consideration. The models used to analyze the data assume that item difficulty is solely determined by a well-defined set of components (in this case, the RAPM abstract rules and figural properties described above), along with the practice effects associated with these components. However, this assumption may be overly restrictive in the case of the RAPM, which was not designed based on a predefined set of rules. In this regard, unaccounted factors within the RAPM may influence item difficulty, contributing to the observed increase in rule difficulty during the test, and potentially obscuring the presence of rule-learning effects. Consequently, the application of operation-specific learning models to data from progressive matrices strictly generated based on Carpenter et al.’s (1990) taxonomy may help to circumvent this issue and provide complementary information regarding the learning hypothesis in the RAPM.
2. The Present Study
The present study aims to investigate within-test practice effects in theoretically generated progressive matrices based on Carpenter et al.’s (1990) model. This approach minimizes the impact of factors not included in the theoretical model on the study of practice effects. Consequently, changes in difficulty during the test associated with specific components can be more accurately attributed to practice effects such as learning or fatigue. Specifically, the present study analyzed data from the Abstract Reasoning Test (ART; Embretson 1998). The ART was developed using a cognitive design system approach, a method that integrates cognitive theory into test construction to ensure validity. The ART was specifically developed from Carpenter et al.’s (1990) cognitive theory, and its item structures were originally conceived to match the structures studied by Carpenter et al. (1990). The ART’s construct validity has been strongly supported through multiple studies. Specifically, the ART version used in the present study showed a correlation of .78 with the RAPM (Embretson 1998, 2002). In the present study, the analysis of practice effects within the ART was conducted using a random weights operation-specific learning model (RWOSLM; Lozano and Revuelta 2023). The RWOSLM measures within-test practice effects specific to each examinee, which may provide relevant information regarding rule learning during the ART progressive matrices at the individual level. Additionally, correlations between practice effects and external measures associated with intelligence were examined to investigate the nature of the practice effects.
3. Materials and Methods
3.1. Research Model and Statistical Analyses
The RWOSLM is a random weights linear logistic test model (Rijmen and De Boeck 2002) aimed to measure individual differences in operation-specific practice effects. According to the RWOSLM, the logit of the success probability of person i () on item j () is given by
where:
θi is the ability of person i;
αm is the difficulty of rule m ();
δim is the effect of previous practice on the difficulty of rule m for person i;
wjm is the weight of rule m on item j;
vjm is given by
where wkm is the weight of rule m on the previous item k ().
The model also includes W, a J × M matrix that contains the weights wjm, and V, a J × M matrix that contains the weights vjm. The weights wjm and vjm are not estimated. Instead, they are part of the hypothesized test structure, which must be specified before the model is applied.
In this context, the ability parameter θi represents abstract reasoning; that is, the ability of person i to identify and apply the rules involved in the item regardless of practice effects. The difficulty parameter αm represents the initial difficulty (without practice) of rule m. The practice parameter δim represents the effect of practicing rule m for person i. A positive sign for the parameter δim indicates a decrease in the difficulty of operation m for person i as a function of practice, which may be interpreted as learning. On the other hand, a negative sign for the parameter δim indicates an increase in the difficulty of operation m for person i as a function of practice, which may be interpreted as fatigue or loss of interest and/or attention. In this regard, the practice effect may be conceived as a change in the difficulty of a rule for a particular examinee as a function of practice:
where αijm is the difficulty of rule m for person i at item j.
For the model to be identified, the matrices W and V+ = (V, 1) (i.e., V supplemented with a column vector of ones) and the concatenation of both matrices must have a full column rank. Additionally, the number of effects should not exceed the number of items (i.e., 2M + 1 ≤ J)1 and the covariance matrix of the practice effects must be symmetric positive definite.
Model estimation and evaluation were based on a Bayesian framework. The RWOSLM (Lozano and Revuelta 2023) was compared with other models: the operation-specific learning model (OSLM; Fischer and Formann 1982; Lozano and Revuelta 2021; Scheiblechner 1972; Spada 1977; Spada and McGaw 1985), the linear logistic test model (LLTM; Fischer 1973; Scheiblechner 1972), and the random weights linear logistic test model (RWLLTM; Rijmen and De Boeck 2002). While in the RWOSLM the difficulty parameters (αm) are constant across individuals and the practice parameters (δim) are random across individuals2, in the OSLM both difficulty (αm) and practice (δm) parameters are constant across individuals. In this regard, the OSLM represents the absence of individual differences in practice effects. Additionally, the LLTM and the RWLLTM explain item difficulty exclusively as a function of the difficulty of the abstract rules involved in the item. Therefore, both models represent the absence of within-test practice effects. The difference between these two models resides in that the LLTM treats the difficulty parameters as fixed effects constant across individuals (from now on denoted as ηm), whereas the RWLLTM treats them as random effects varying across individuals (from now on denoted as ηim).
Based on previous research (Lozano and Revuelta 2023), the prior distributions for the RWOSLM parameters were
The hyper-prior distributions for the hyper-parameters were
Additionally, based on previous research (Lozano and Revuelta 2021, 2023), an N(0, 100) prior distribution was specified for the fixed-effects parameters of the OSLM (αm and δm). In line with the previous specifications, the random-effects operation difficulty parameter of the RWLLTM (ηim) was assumed to follow the same multivariate normal prior distribution specified for δim in the RWOSLM, whereas the fixed-effects operation difficulty parameter of the LLTM (ηm) was assumed to follow an N(0, 100) prior distribution. A standard normal prior distribution was specified for the person ability parameter (θi) in all models.
Two information criterion measures were used for model comparison and selection: the widely applicable information criteria (WAIC; Watanabe 2010, 2013) and the leave-one-out information criterion (LOOIC; Gelman et al. 2014; Vehtari et al. 2017). These measures quantify the discrepancy between the model and the data while penalizing for model complexity. This penalty compensates for the over-fitting exhibited by more complex models as a result of their greater flexibility. Lower values indicate a better balance between fit and parsimony. Both WAIC and LOOIC have proven useful for detecting within-test practice effects (Lozano and Revuelta 2021, 2023).
Complementarily, posterior predictive model checking (PPMC; Gelman et al. 1996) was used to assess the fit of the models to the data. The posterior predictive p-value (ppost; Meng 1994) was computed using the odds ratio (OR; Chen and Thissen 1997; Sinharay 2005) as a test statistic. The OR statistic is a measure of association between pairs of items that have been effective in identifying within-test practice effects (Lozano and Revuelta 2021, 2023).
3.2. Software
The analyses were conducted with R version 4.4.0 (R Core Team 2024) and the RStan R package version 2.35 (Stan Development Team 2024). Markov chain Monte Carlo simulation was performed using the No-U-Turn Sampler (NUTS; Hoffman and Gelman 2014). Four Markov chains of 5000 samples each were run. The first half of the samples were discarded as burn-in. The potential scale reduction statistic (; Gelman and Rubin 1992) was used to evaluate the convergence of the chains. WAIC and LOOIC were obtained using the loo R package version 2.8.0 (Vehtari et al. 2024).
3.3. Measures and Data
The present study is based on data originally collected by Embretson (1998). The dataset comprised responses of 818 military recruits (80% males) to 34 items of the ART. Participants were randomly assigned to three groups which were administered equivalent computerized forms of the ART. The items administered to the three groups were generated from the same theoretical structure (same number and type of rules) and figural properties, although the specific objects varied between groups. Each form included thirty structurally matched items and four anchor items distributed across the test. Items were ordered by predicted difficulty and their position was equated across forms. Appendix A shows the theoretical structure of the three test forms. Figure 1 presents an example of an ART item involving CR, D3, and overlay; the correct answer is 8. The matrices W and V+, and the concatenation of both matrices, satisfy the full column rank condition, and the number of effects does not exceed the number of items.
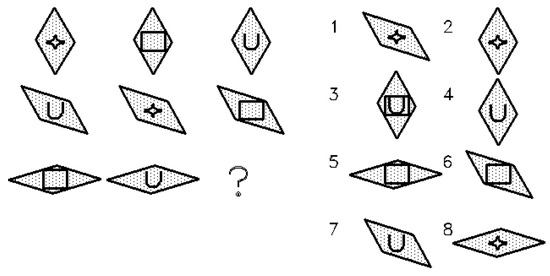
Figure 1.
Example of ART item.
A total of 6.5% of participants were excluded due to response latencies less than one second, which were interpreted as involuntary responses resulting from the computerized administration of the items. The final group sample size was n = 765. A linear regression analysis showed that abstract rules and figural properties accounted for 70% of the variance in item difficulty, operationalized as Rasch item difficulty parameters. Item position did not significantly contribute to the explanation of item difficulty beyond the abstract rules and figural properties.
In addition to the ART, participants completed several other measures as part of the original study. For the present study, we utilized a General Test Battery (GTB) and the Revised NEO Personality Inventory (NEO PI-R; Costa and McCrae 1992) to examine their relationships with individual differences in practice effects in the ART. GTB aggregates several measures of cognitive abilities and exhibits a high load on the general factor of intelligence. The correlation between GTB and the RAPM is .48 (Embretson 1998). Regarding the NEO PI-R, previous research suggests that intelligence is positively and moderately related to Openness, while marginal and mostly inconsistent relationships have been observed with the other personality dimensions (DeYoung 2020).
4. Results
Table 1 shows the goodness-of-fit estimates for the fitted models. The RWOSLM yielded the lowest WAIC and LOOIC values, indicating superior out-of-sample predictive performance. However, an inspection of the prior variances associated with the RWOSLM practice parameters revealed that only A/S and distortion exhibited substantial variability in practice effects. Subsequently, a constrained version of the RWOSLM (hereafter referred to as RWOSLMconst.) was fitted to the data in which all practice parameters, except those associated with A/S and distortion, were treated as fixed effects. The RWOSLMconst. retained the lowest WAIC and LOOIC values among all models. Although posterior predictive checks indicated that none of the models showed a good fit to the data (all ppost < .05), the RWOSLMconst. generated replicated OR values that more closely approximated the realized values, suggesting that this model was the most appropriate for analyzing within-test practice effects in the ART.

Table 1.
Goodness-of-fit estimates for the fitted models.
Table 2 shows the expected a posteriori (EAP) estimates, posterior standard deviations, and posterior probability intervals for the RWOSLMconst. parameters. The positive sign of the EAP estimate of the practice parameter associated with PP (δPP), together with the absence of zero within the posterior probability interval, suggested a decrease in the difficulty of this rule throughout the test. In the case of D3 and distortion, zero was included in the posterior probability interval of the practice parameter (δD3) and in the posterior probability interval of the prior mean of the practice parameter (), respectively, indicating a low posterior probability of a decrease in difficulty throughout the test: P(δD3 > 0 | x) = .196 and P(> 0 | x) = .399. Conversely, the negative signs of the EAP estimates of the practice parameters associated with CR, D2, overlay, and fusion (δCR, δD2, δOverlay, and δFusion) and the negative sign of the EAP estimate of the prior mean of the practice parameter associated with A/S (), together with the absence of zero within the corresponding posterior probability intervals, suggested an increase in difficulty for these components throughout the test.
Table 2.
Expected a posteriori estimates (EAP), posterior standard deviations (SD), and posterior probability intervals (2.5–97.5%) for the RWOSLMconst. parameters.
The previous results represent overall trends. However, the estimated prior variances of the practice parameters of A/S and distortion ( and ) indicated the presence of inter-individual variability in the practice effects associated with these components. Figure 2 shows the difficulty of the ART rules and figural properties as a function of practice, revealing the presence of individual differences in the practice effects associated with A/S and distortion. An analysis at the individual level revealed that 19% and 37% of the participants exhibited a positive EAP estimate of the practice parameter associated with A/S (δiA/S) and distortion (δiDistortion), respectively, suggesting an operation-specific reduction in difficulty throughout the test for the respective proportions of participants.
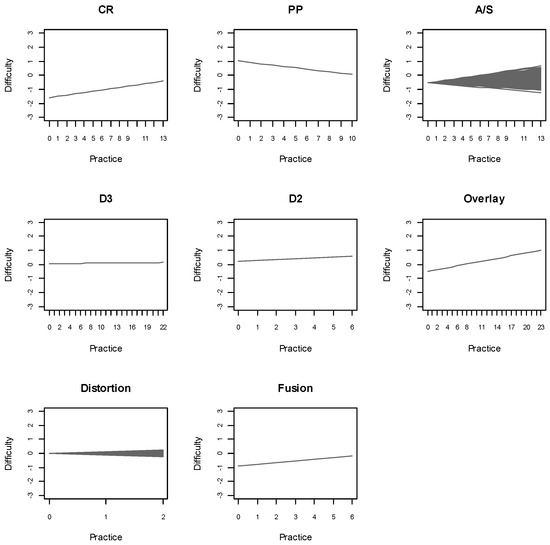
Figure 2.
Difficulty of the ART rules and figural properties as a function of practice according to the RWOSLMconst..
Table 3 shows the Pearson correlations between the EAP estimates of the random-effects parameters of the RWOSLMconst. and the reference measures GTB and NEO PI-R. As expected, the ability parameter (θi) correlated positively and significantly with GTB and Openness. It also correlated negatively and significantly with Conscientiousness, and showed marginal negative correlations with Agreeableness and Neuroticism. With regard to the practice parameters, the practice parameter associated with A/S correlated positively and significantly with GTB, negatively and significantly with Conscientiousness and Agreeableness, and exhibited a marginal positive correlation with Openness; whereas the practice parameter associated with distortion correlated positively and significantly with GTB and Openness, and showed marginal negative correlations with Conscientiousness, Extraversion, and Agreeableness.
Table 3.
Pearson correlations between the EAP estimates of the random-effects practice parameters of the RWOSLMconst. and the reference measures.
5. Discussion
The conceptualization of intelligence has historically lagged behind its measurement. Understanding the cognitive processes underlying performance on intelligence tests has played a crucial role in shaping our definition of intelligence. Consequently, identifying individual differences in learning processes when using reference measurement instruments could significantly influence our conceptualization of intelligence. In this vein, this study aimed to examine inter-individual variability in the practice effects associated with the abstract rules involved in the ART. The fact that the ART was developed based on Carpenter et al.’s (1990) theory minimizes the impact of extraneous factors unrelated to the theoretical model, thereby allowing for a more accurate identification of practice effects.
Evidence of decreases in difficulty associated with abstract rules during the ART was scarce, primarily observed in PP and, to a lesser extent, in A/S. The evidence concerning PP was consistent across participants, suggesting that performance improvements in this rule occur naturally throughout the test. In contrast, evidence related to A/S was far more limited, indicating that improvements with this rule are considerably more challenging to achieve. Specifically, only 19% of participants showed a decrease in difficulty associated with A/S. Individual differences in practice effects associated with A/S correlated positively with the reference ability measure and Openness. These findings suggest that practice effects during the ART are fundamentally linked to intelligence, as they predict performance on complex ability tasks and relate to measures of intellect.
Regarding the items’ figural properties, a decrease in difficulty throughout the test was observed only for distortion. Specifically, 37% of participants showed a reduction in difficulty, suggesting the presence of learning effects related to this property. The positive and significant correlations with GTB and Openness further support the association between individual differences in practice effects within the ART and intelligence.
The increases in difficulty observed in CR, D2, overlay, and fusion, as well as in A/S and distortion for most participants, may be interpreted as progressive fatigue or a decline in interest and/or attention throughout the test. The results therefore suggest that participants improve performance on some components and exhibit impairments on others, both as a result of practice. Alternatively, an increasing presence of difficulty factors not considered by the model as the test progresses could also explain the rising difficulty observed for some rules. However, the fact that the ART was generated directly from theory minimizes the risk of unmodeled factors. Moreover, the results indicated that item position did not significantly contribute to explaining item difficulty beyond what the model’s components accounted for, which provides no evidence for extraneous factors accounting for the observed increases in difficulty.
Nevertheless, it is important to add two cautionary notes to the discussion. First, the additive nature of the fitted models in regard to item difficulty ignored the possibility of interaction effects between components. In this sense, an observed increase in rule difficulty throughout the test might be partially due to interaction effects between rules. Although a linear modeling approach to performance on the ART may be efficient (see also Embretson 1998), the possibility of interaction effects cannot be dismissed. The RWOSLM allows specifying interactions between operations by including new components in the structure matrix that represent the combination of two or more operations within the same item. However, in the case of the ART, the high number of components in the concatenation of the matrices W and V makes it difficult to explore these potential interactions without the estimates becoming highly unstable. Future research on operation-specific learning modeling may help address this issue. Second, the linearity of the fitted models assumed that the relationship between rule difficulty and practice is constant throughout the entire test. However, the literature on learning and fatigue has traditionally suggested that these processes are better represented by curves. In this regard, future studies may be aimed at investigating nonlinear practice effects within progressive matrices.
In summary, this study provides evidence of inter-individual variability in within-test practice effects during the ART. Although evidence supporting learning effects during the test was limited to only a few components of the structure matrix, the results provide relevant information regarding the cognitive processes involved in solving progressive matrices. Given the centrality of progressive matrices in the measurement of intelligence, it would be valuable to investigate whether similar effects occur in other inductive reasoning tests based on pattern recognition in figural matrices. Future research using advanced dynamic item response models could further explore this possibility.
Author Contributions
Conceptualization, J.H.L.; methodology, J.H.L., S.E.E. and J.R.; software, J.H.L. and J.R.; validation, J.H.L. and J.R.; formal analysis, J.H.L., S.E.E. and J.R.; investigation, J.H.L.; resources, S.E.E. and J.R.; data curation, J.H.L. and S.E.E.; writing—original draft preparation, J.H.L.; writing—review and editing, J.H.L., S.E.E. and J.R.; visualization, J.H.L.; supervision, J.R.; project administration, J.R.; funding acquisition, J.R. All authors have read and agreed to the published version of the manuscript.
Funding
This research was funded by the Ministerio de Ciencia, Innovación y Universidades, grant number PID2021-124885NB-I00.
Institutional Review Board Statement
Not applicable.
Informed Consent Statement
Not applicable.
Data Availability Statement
No new data were created or analyzed in this study. Data sharing is not applicable to this article.
Conflicts of Interest
The authors declare no conflicts of interest.
Appendix A
Table A1.
Transposed W matrix of the ART.
Table A1.
Transposed W matrix of the ART.
| Items | CR | PP | A/S | D3 | D2 | O | D | F |
|---|---|---|---|---|---|---|---|---|
| 1 | 1 | 2 | 0 | 0 | 0 | 0 | 0 | 0 |
| 2 | 1 | 0 | 0 | 1 | 0 | 1 | 0 | 0 |
| 3 | 0 | 0 | 0 | 2 | 0 | 1 | 0 | 0 |
| 4 | 1 | 1 | 0 | 1 | 0 | 0 | 0 | 0 |
| 5 | 1 | 0 | 0 | 0 | 0 | 1 | 0 | 1 |
| 6 | 0 | 0 | 1 | 0 | 0 | 1 | 0 | 0 |
| 7 | 1 | 0 | 0 | 2 | 0 | 1 | 0 | 0 |
| 8 | 0 | 0 | 0 | 2 | 0 | 1 | 0 | 0 |
| 9 | 1 | 1 | 0 | 0 | 0 | 1 | 0 | 1 |
| 10 | 1 | 1 | 0 | 0 | 0 | 1 | 0 | 1 |
| 11 | 1 | 1 | 0 | 0 | 0 | 0 | 0 | 0 |
| 12 | 0 | 0 | 1 | 0 | 0 | 1 | 0 | 1 |
| 13 | 0 | 0 | 0 | 2 | 0 | 1 | 0 | 0 |
| 14 | 0 | 0 | 1 | 0 | 0 | 0 | 0 | 1 |
| 15 | 0 | 0 | 1 | 0 | 0 | 0 | 0 | 1 |
| 16 | 0 | 0 | 1 | 0 | 0 | 1 | 0 | 0 |
| 17 | 1 | 1 | 0 | 1 | 0 | 1 | 0 | 0 |
| 18 | 0 | 0 | 1 | 0 | 0 | 1 | 0 | 0 |
| 19 | 1 | 1 | 0 | 0 | 0 | 0 | 0 | 0 |
| 20 | 0 | 0 | 2 | 0 | 0 | 1 | 0 | 0 |
| 21 | 0 | 0 | 1 | 0 | 0 | 1 | 0 | 0 |
| 22 | 1 | 0 | 0 | 2 | 0 | 0 | 0 | 0 |
| 23 | 0 | 0 | 1 | 0 | 0 | 1 | 0 | 0 |
| 24 | 0 | 0 | 1 | 0 | 1 | 1 | 0 | 0 |
| 25 | 1 | 2 | 0 | 0 | 0 | 1 | 0 | 1 |
| 26 | 0 | 0 | 1 | 0 | 0 | 1 | 0 | 0 |
| 27 | 0 | 0 | 1 | 0 | 0 | 1 | 0 | 0 |
| 28 | 0 | 0 | 1 | 0 | 0 | 0 | 0 | 0 |
| 29 | 0 | 0 | 0 | 2 | 0 | 0 | 1 | 0 |
| 30 | 0 | 0 | 0 | 4 | 0 | 1 | 0 | 0 |
| 31 | 0 | 1 | 0 | 2 | 0 | 0 | 1 | 0 |
| 32 | 0 | 0 | 0 | 0 | 3 | 1 | 0 | 0 |
| 33 | 1 | 0 | 0 | 0 | 3 | 1 | 0 | 0 |
| 34 | 1 | 0 | 0 | 2 | 0 | 1 | 1 | 0 |
CR = constant in a row; PP = quantitative pairwise progression; A/S = figure addition or subtraction; D3 = distribution of three values; D2 = distribution of two values; O = overlay; D = distortion; F = fusion.
Notes
| 1 | In Bayesian inference, this restriction is relaxed to 2M ≤ J (Lozano and Revuelta 2023). |
| 2 | In the Bayesian approach, all model parameters are random variables. The terms constant and random are used here to denote invariability/variability across individuals. |
References
- Birney, Damian P., Jens F. Beckmann, Nadin Beckmann, and Kit S. Double. 2017. Beyond the intellect: Complexity and learning trajectories in Raven’s Progressive Matrices depend on self-regulatory processes and conative dispositions. Intelligence 61: 63–77. [Google Scholar] [CrossRef]
- Bui, Myvan, and Damian P. Birney. 2014. Learning and individual differences in Gf processes and Raven’s. Learning and Individual Differences 32: 104–13. [Google Scholar] [CrossRef]
- Carpenter, Patricia A., Marcel A. Just, and Peter Shell. 1990. What one intelligence test measures: A theoretical account of the processing in the Raven Progressive Matrices Test. Psychological Review 97: 404–31. [Google Scholar] [CrossRef] [PubMed]
- Chen, Wen-Hung, and David Thissen. 1997. Local dependence indexes for item pairs using item response theory. Journal of Educational and Behavioral Statistics 22: 265–89. [Google Scholar] [CrossRef]
- Costa, Paul T., and Robert R. McCrae. 1992. Neo Personality Inventory-Revised (NEO PI-R). Odessa: Psychological Assessment Resources. [Google Scholar]
- DeYoung, Colin G. 2020. Intelligence and personality. In The Cambridge Handbook of Intelligence, 2nd ed. Edited by Robert J. Sternberg. Cambridge: Cambridge University Press, pp. 1011–47. [Google Scholar]
- Embretson, Susan E. 1998. A cognitive design system approach to generating valid tests: Application to abstract reasoning. Psychological Methods 3: 380–96. [Google Scholar] [CrossRef]
- Embretson, Susan E. 2002. Generating abstract reasoning items with cognitive theory. In Item Generation for Test Development. Edited by Sidney H. Irvine and Patrick C. Kyllonen. Mahwah: Erlbaum, pp. 219–50. [Google Scholar]
- Fischer, Gerhard H. 1973. The linear logistic test model as an instrument in educational research. Acta Psychologica 3: 359–74. [Google Scholar] [CrossRef]
- Fischer, Gerhard H., and Anton K. Formann. 1982. Some applications of logistic latent trait models with linear constraints on the parameters. Applied Psychological Measurement 6: 397–416. [Google Scholar] [CrossRef]
- Gelman, Andrew, and Donald B. Rubin. 1992. Inference from iterative simulation using multiple sequences. Statistical Science 7: 457–72. [Google Scholar] [CrossRef]
- Gelman, Andrew, Jessica Hwang, and Aki Vehtari. 2014. Understanding predictive information criteria for Bayesian models. Statistics and Computing 24: 997–1016. [Google Scholar] [CrossRef]
- Gelman, Andrew, Xiao-Li Meng, and Hal Stern. 1996. Posterior predictive assessment of model fitness via realized discrepancies. Statistica Sinica 6: 733–807. [Google Scholar]
- Hoffman, Matthew D., and Andrew Gelman. 2014. The No-U-Turn sampler: Adaptively setting path lengths in Hamiltonian Monte Carlo. Journal of Machine Learning Research 15: 1593–623. [Google Scholar]
- Jensen, Arthur R. 1998. The G Factor: The Science of Mental Ability. Westport: Praeger. [Google Scholar]
- Lewandowski, Daniel, Dorota Kurowicka, and Harry Joe. 2009. Generating random correlation matrices based on vines and extended onion method. Journal of Multivariate Analysis 100: 1989–2001. [Google Scholar] [CrossRef]
- Lozano, José H. 2015. Are impulsivity and intelligence truly related constructs? Evidence based on the fixed-links model. Personality and Individual Differences 85: 192–98. [Google Scholar] [CrossRef]
- Lozano, José H., and Javier Revuelta. 2020. Investigating operation-specific learning effects in the Raven’s Advanced Progressive Matrices: A linear logistic test modeling approach. Intelligence 82: 101468. [Google Scholar] [CrossRef]
- Lozano, José H., and Javier Revuelta. 2021. A Bayesian generalized explanatory item response model to account for learning during the test. Psychometrika 86: 994–1015. [Google Scholar] [CrossRef]
- Lozano, José H., and Javier Revuelta. 2023. A random weights linear logistic test model for learning within a test. Applied Psychological Measurement 47: 443–59. [Google Scholar] [CrossRef]
- Meng, Xiao-Li. 1994. Posterior predictive p-values. The Annals of Statistics 22: 1142–60. [Google Scholar] [CrossRef]
- Raven, John. 2008. The Raven progressive matrices tests: Their theoretical basis and measurement model. In Uses and Abuses of Intelligence. Studies Advancing Spearman and Raven’s Quest for Non-Arbitrary Metrics. Edited by John Raven and Jean Raven. New York: Royal Fireworks Press, pp. 17–68. [Google Scholar]
- Raven, John, and Jean Raven. 2003. Raven progressive matrices. In Handbook of Nonverbal Assessment. Edited by R. Steve McCallum. Boston: Springer, pp. 223–37. [Google Scholar]
- Raven, John C. 1965. Advanced Progressive Matrices, Sets I & II. London: H. K. Lewis. [Google Scholar]
- R Core Team. 2024. R: A Language and Environment for Statistical Computing. Vienna: R Foundation for Statistical Computing. Available online: https://www.r-project.org/ (accessed on 19 September 2024).
- Ren, Xuezhu, Tengfei Wang, Michael Altmeyer, and Karl Schweizer. 2014. A learning-based account of fluid intelligence from the perspective of the position effect. Learning and Individual Differences 31: 30–35. [Google Scholar] [CrossRef]
- Rijmen, Frank, and Paul De Boeck. 2002. The random weights linear logistic test model. Applied Psychological Measurement 26: 271–85. [Google Scholar] [CrossRef]
- Scheiblechner, Hartmann. 1972. Das lernen und lösen komplexer denkaufgaben. Zeitschrift für Experimentelle und Angewandte Psychologie 19: 476–506. [Google Scholar]
- Schweizer, Karl, Michael Schreiner, and Andreas Gold. 2009. The confirmatory investigation of APM items with loadings as a function of the position and easiness of items: A two-dimensional model of APM. Psychology Science Quarterly 51: 47–64. [Google Scholar]
- Sinharay, Sandip. 2005. Assessing fit of unidimensional item response theory models using a Bayesian approach. Journal of Educational Measurement 42: 375–94. [Google Scholar] [CrossRef]
- Snow, Richard E., Patrick C. Kyllonen, and Brachia Marshalek. 1984. The topography of ability and learning correlations. In Advances in the Psychology of Human Intelligence. Edited by Robert J. Sternberg. Hillsdale: Erlbaum, vol. 2, pp. 47–103. [Google Scholar]
- Spada, Hans. 1977. Logistic models of learning and thought. In Structural Models of Thinking and Learning. Edited by Hans Spada and Wilhelm F. Kempf. Bern: Huber, pp. 227–62. [Google Scholar]
- Spada, Hans, and Barry McGaw. 1985. The assessment of learning effects with linear logistic test models. In Test Design: Developments in Psychology and Psychometrics. Edited by Susan E. Embretson. New York: Academic Press, pp. 169–194. [Google Scholar]
- Spearman, Charles. 1927. The measurement of intelligence. Nature 120: 577–78. [Google Scholar] [CrossRef]
- Stan Development Team. 2024. RStan: The R interface to Stan. R package version 2.35. Available online: http://mc-stan.org (accessed on 19 September 2024).
- Vehtari, Aki, Andrew Gelman, and Jonah Gabry. 2017. Practical Bayesian model evaluation using leave-one-out cross-validation and WAIC. Statistics and Computing 27: 1413–32. [Google Scholar] [CrossRef]
- Vehtari, Aki, Jonah Gabry, Mans Magnusson, Yuling Yao, Paul-Christian Bürkner, Topi Paananen, and Andrew Gelman. 2024. loo: Efficient Leave-One-Out Cross-Validation and WAIC for Bayesian Models. R Package Version 2.8.0. Available online: https://mc-stan.org/loo/ (accessed on 19 September 2024).
- Verguts, Tom, and Paul De Boeck. 2002. The induction of solution rules in Raven’s Progressive Matrices Test. European Journal of Cognitive Psychology 14: 521–47. [Google Scholar] [CrossRef]
- Watanabe, Sumio. 2010. Asymptotic equivalence of Bayes cross validation and widely applicable information criterion in singular learning theory. Journal of Machine Learning Research 11: 3571–94. [Google Scholar]
- Watanabe, Sumio. 2013. A widely applicable Bayesian information criterion. Journal of Machine Learning Research 14: 867–97. [Google Scholar]
Disclaimer/Publisher’s Note: The statements, opinions and data contained in all publications are solely those of the individual author(s) and contributor(s) and not of MDPI and/or the editor(s). MDPI and/or the editor(s) disclaim responsibility for any injury to people or property resulting from any ideas, methods, instructions or products referred to in the content. |
© 2025 by the authors. Licensee MDPI, Basel, Switzerland. This article is an open access article distributed under the terms and conditions of the Creative Commons Attribution (CC BY) license (https://creativecommons.org/licenses/by/4.0/).