Abstract
Extreme Operational Gusts (EOGs) are critical for assessing the effects of extreme winds on Wind Energy Conversion Systems (WECSs). In regions like La Ventosa, Oaxaca, Mexico—characterized by strong and frequent gusts—the performance and reliability of low-power WECSs can be severely impacted. Traditionally, EOG effects have been analyzed using mathematical models from the IEC 61400-2 standard, which assumes a symmetric gust taxonomy. However, field data have revealed inconsistencies with this model, leading to the development of new asymmetrical taxonomies, such as Manwell’s. This study presents a taxonomic characterization of EOGs in La Ventosa using 1 Hz wind speed data collected over one year (December 2017–November 2018), during which 1655 events were detected. A dedicated detection method was implemented to capture gusts with amplitudes and durations exceeding the IEC range, allowing systematic classification of previously unrecognized patterns. Based on these results, a new taxonomy and a mathematical model were developed to simulate any identified gust. These tools provide more realistic simulations for improving WECS protection under extreme conditions. The analysis shows that Manwell’s taxonomy represents 50.39% of events, the proposed classification 37.04%, and IEC 61400-2 only 12.57%, underscoring its limited applicability to high-wind sites like La Ventosa.
1. Introduction
The dependence of humanity on fossil fuels has been identified as a significant global challenge. According to the “Statistical Review of World Energy”, in 2024, 87% of the energy generated globally was derived from these fuels [1]. Consequently, the incorporation of renewable energy sources, such as wind energy, is recognized as crucial. The “Global Wind Report 2024” indicates that installed wind capacity worldwide reached 117 GW in 2023, representing a 50% increase year-on-year compared to 2022 [2]. However, the adoption of this energy source, particularly in regions characterized by extreme wind conditions face challenges.
The Isthmus of Tehuantepec, located in Oaxaca, has been recognized as one of the regions with the highest potential for wind energy production in Mexico [3]. In certain areas of this region, average wind speeds have been measured at 10 m/s, in contrast to the 6 m/s that is generally deemed suitable for global wind generation [4]. Notably, the town of La Ventosa has been distinguished by its favorable wind quality conditions [5], although these conditions can also lead to turbulent flows and wind gusts [6]. These gusts are considered a significant challenge to the structural integrity of Wind Energy Conversion Systems (WECSs). Various studies have documented their adverse effects; for example, ref. [7] reports that gusts increase the fatigue vulnerability of the blades; Ref. [8] indicates that they can create a hostile environment for gear transmission systems, which are responsible for transferring energy from the rotor to the generator; Ref. [9] notes, it is mentioned that additional loads are induced on the main bearing of the drivetrain; and ref. [10] states that fluctuating energy can cause voltage and frequency variations, reducing the reliability of the electrical grid.
The Extreme Operational Gust (EOG) is acknowledged as the most extensively studied type of extreme wind gust [11]. Numerous studies have employed this phenomenon in numerical simulations to examine the responses of various WECS components under EOG conditions. Both the taxonomy and the corresponding mathematical models must be considered, with the framework proposed in then IEC 61400-1 standard [12] frequently used. It should be noted that IEC 61400-2 [13] employs the same mathematical model, but this standard is specifically designed for low-power wind turbines. Both models are characterized by a symmetrical representation during both the increasing and decreasing phases of wind speed.
Among the studies that have utilized the EOG taxonomy outlined in the IEC 61400-1 standard, the evaluation of a new pitch adjustment device for small-scale WECS under EOG conditions is presented in [14]. The effect of EOGs on the aeroelastic response of WECS blades is examined in [15], using the BaMB model and the GH-Bladed 3.82 software. Additionally, the impact of EOGs on two types of adaptive blades with aeroelastic coupling is analyzed in [16]. Furthermore, ref. [17] calculates the movement and tension responses in the mooring lines of Floating Offshore Wind Turbines (FOWTs) in response to EOGs, assessing the effects of various durations and amplitudes. A time-variable gust based on EOG is implemented in [18] to investigate how fluctuating wind conditions influence the performance of vertical-axis WECSs in turbulent environments. The transient aerodynamic phenomena affecting FOWTs, particularly when subjected to structural movements and unstable winds such as EOGs, are discussed in [19]. Ref. [20] analyzes the impact of these gusts on directly interconnected WECSs and proposes strategies for mitigating their adverse effects. Finally, the electrical effects on low-power WECSs are discussed in [21], showing that EOG amplitude has the greatest negative impact on the Back-to-Back Power Converter (BTB-PC).
Among the research that does not adopt a symmetrical taxonomy for EOGs, Manwell’s proposal in [22] stands out, as it introduces an asymmetric taxonomy in which both the amplitude and the time of descent of wind speed are found to exceed those of the ascent. This taxonomy has been further explored by Branlard in [23], who developed statistical studies on the characteristic parameters of EOGs using this framework. Supporting evidence for this phenomenon can be found in studies utilizing on-site wind data, such as in [24], which indicates that gust fall times are typically between 30% and 40% longer than ascent times. Likewise, ref. [25] suggests that the temporal evolution of gust is highly asymmetric and notes that few investigations have examined the most appropriate distribution forms for modeling additional properties of EOGs.
However, ref. [26] reports an average rise time of 2.3 s and an average decay time of 2.1 s, obtained from the analysis of 100 EOG events recorded under real field conditions. The observed variability suggests that the taxonomy of EOGs is not clearly defined in the literature and may depend on the study site, as contradictory results have been documented regarding the dynamics proposed by Manwell. This situation indicates the possible existence of multiple taxonomies, in which the rise time of wind speed may, in some cases, exceed the decay time. This ambiguity represents a significant research niche, particularly at sites with extreme wind conditions, such as La Ventosa, Oaxaca, Mexico. This variability is also illustrated in Table 1, which chronologically presents research related to taxonomic differences.

Table 1.
Overview of Symmetric and Asymmetric EOG Type Classifications in the Literature.
The mathematical models employed in the studies [14,15,16,17,18,19,20] to simulate EOGs were based on the model defined in the IEC 61400-1 standard, which—as previously noted—is the same adopted in the IEC 61400-2 standard for low-power WECSs. This model was originally developed for their design, with evaluations carried out under extreme gust scenarios corresponding to return periods ranging from 1 to 50 years. Literature reveals the existence of mathematical models that generate a taxonomy analogous to that of the standard. In 1999, Mallat [27] normalized the wavelet of the second Gaussian derivative, termed “Mexican hat.” His work concentrates on the applications of wavelets in signal processing rather than the dynamics of wind speed. It is worth noting that multiplying this wavelet by a factor of −1 yields an expression that signifies the symmetric taxonomy of the EOG. In 2004, Larsen et al. [28] implemented a differing standardization process, producing an alternative equation that delineates the same EOG taxonomy as the standard. This formulation was subsequently revisited by Branlard in his 2009 study [23]. It is imperative to acknowledge that both equations correspond to distinct normalizations of the same foundational expression, presented in [29,30], which forms the basis of the new mathematical model proposed in this research.
For the taxonomic characterization of EOGs in La Ventosa, Oaxaca, Mexico, a code capable of detecting EOGs with distinct durations and descent amplitudes compared to those of ascent is also requisite, in addition to its taxonomy and mathematical model. Branlard describes various methods for detecting extreme wind gusts, including the Peak Over Threshold (POT) method, which has been widely utilized in the identification of extreme wind gusts [31,32,33]. However, this method does not precisely delineate the shape of the EOG.
Another method utilized involves increasing speed above a certain threshold, which has so far been applied exclusively to the detection of fronts [23]. Due to their taxonomic similarity with Extreme Coherent Gusts (ECGs), they will hereafter be referred to as ECGs. However, it presents the advantage of facilitating the detection of extreme gusts of wind, irrespective of duration and amplitude. In the present research, this method will serve as a foundation for developing a novel detection method for EOGs that is capable not only of defining the EOG shape but also of identifying EOGs across various taxonomies.
The primary objective of this research is to execute a taxonomic characterization of EOGs at the La Ventosa site in Oaxaca, Mexico, utilizing a wind speed database with a temporal resolution per second. This analysis aims to identify the most prevalent EOG taxonomy at the site, thereby providing a reference for future studies focused on evaluating the impact of these EOGs on the reliability and performance of WECSs. Additionally, this knowledge is critical for the development of more effective control strategies and protective mechanisms tailored to the site’s specific conditions.
The principal contributions of this research include the determination of the predominant taxonomy of EOGs in La Ventosa, Oaxaca, Mexico, based on field data. Furthermore, a robust detection method will be developed capable of identifying EOGs with distinct taxonomies while independently considering the characteristics of amplitude and duration. A generalized mathematical model capable of simulating any taxonomy identified in the study will also be proposed, with the intention of being utilized in simulations aimed at assessing the impact of EOGs on WECSs under conditions more representative of the actual phenomenon.
The organization of this article is structured as follows: Section 2 presents the theoretical framework. In Section 3, the general methodology utilized is described. Section 4 presents the criteria considered to determine the taxonomy to which each event belongs. Section 5 elucidates the proposed method for detecting EOGs. Section 6 offers insights into the taxonomic characterization of the site. Building upon the results obtained, Section 7 introduces the proposed mathematical model and its capacity to represent the identified taxonomies. A critical discussion of the results is provided in Section 8. Lastly, Section 9 presents the conclusions of the article.
2. Theoretical Framework
2.1. Extreme Operational Gust (EOG)
An EOG is characterized by a brief interval during which wind speed, influenced by atmospheric turbulence, exhibits a decrease, followed by a rapid increase until it reaches a peak, after which it drops sharply and ultimately returns to the original wind speed [17]. This phenomenon is illustrated in Figure 1.
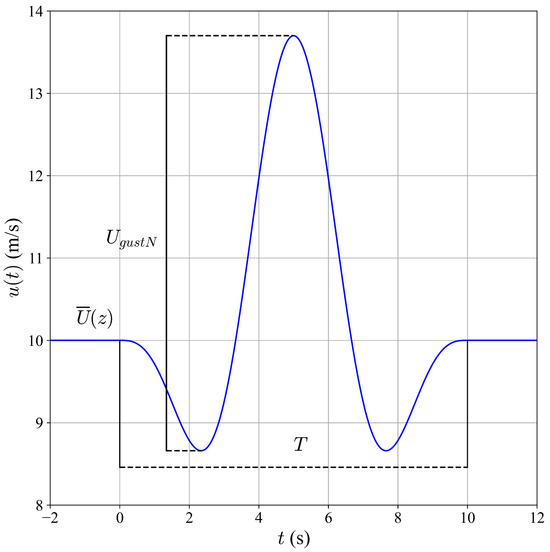
Figure 1.
Taxonomy of an EOG.
2.2. Mathematical Models of the EOG
The definition of the EOG presents only a general description of its behavior. Consequently, mathematical models have been developed in the literature for their integration into numerical simulations. The IEC 61400-2 standard proposes a mathematical model of the EOG featuring an idealized symmetric taxonomy (see Figure 1):
where denotes the average wind speed as a function of height (z), T is the total duration of the gust and is the amplitude of the gust, within a recurrence period of 1 and 50 years and is given by the equation:
where is the standard deviation, is the turbulence scale parameter, D is the rotor diameter = 4.8 for N = 1 and = 6.4 for N = 50.
In [23], another equation is proposed to obtain the variable , only that this publication is called and its equation is:
where is the wind speed impacting the WECS hub, is the extreme wind speed with a recurrence period of 1 year and responds to the following equation:
where is the extreme wind speed with a recurrence period of 50 years.
The various methods for obtaining align with the assumption that an EOG will emerge within an interval of 1 to 50 years, exhibiting specific characteristics in amplitude. In this context, it is essential that the design of the WECS be capable of supporting this EOG.
Mathematical models presented in [29,30] are utilized in signal analysis and reproduce the behavior illustrated in Figure 1, as described by Equation (5). This behavior corresponds to the wavelet function known as the Mexican hat (). Wavelets serve as mathematical functions that decompose a signal into distinct frequency components, enabling each component to be analyzed with a resolution tailored to its timescale [34].
Through defined parameters, wavelet transforms can modify specific properties. For instance, the Mexican hat wavelet serves as a base function that can be adjusted to influence the evolution time, allowing it to either decrease or increase, as well as to shift positively or negatively [29]. This process utilizes the following property:
The parameters have significant effects on the behavior of the wavelet, where a represents the dilation or compression factor and b indicates the displacement parameter. In Figure 2, examples illustrate the impact of these parameters: the parameter b is altered from top to bottom, while the parameter a is modified from left to right.
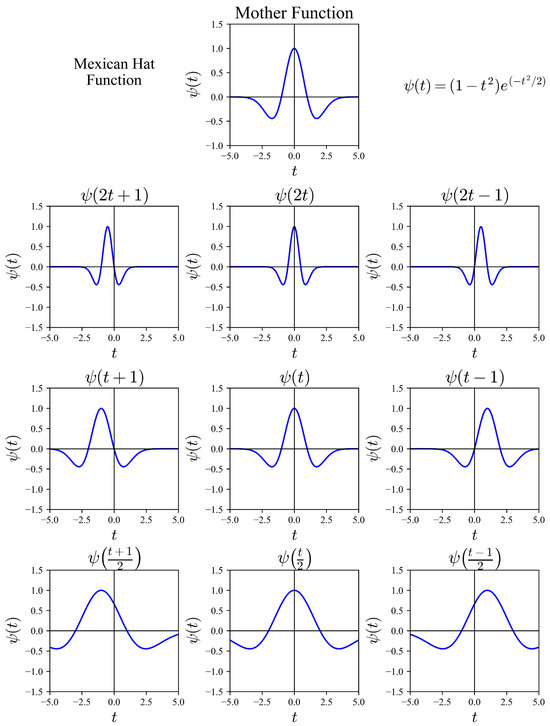
Figure 2.
Wavelets obtained through the “Mexican hat” function (Inspired by [29]).
2.3. Method of Detecting Wind Gusts of Increase Above a Certain Threshold
As indicated in [23], the methodology for detecting ECGs is characterized by an increase in wind speed beyond a specified threshold. This process initiates when the acceleration of wind speed surpasses this threshold and concludes as the acceleration falls below it. The detection mechanism is expressed through the following equation:
where, A is the amplitude of the gust, is the wind speed, and is the time interval during which the ECG evolves. The above describes the theoretical foundations essential for developing each contribution of this research.
3. Methodology
The methodology developed in this study comprises seven stages, aimed at taxonomically characterizing the EOGs located at the site of La Ventosa, Oaxaca, Mexico. The steps undertaken are detailed below:
Review of the State of the Art. A comprehensive review of the scientific and regulatory literature related to EOGs has been conducted to identify the criteria employed in their taxonomic classification. Aspects such as temporal symmetry, duration, and amplitude of gusts have been analyzed, along with the mathematical models utilized in prior studies.
Preparation of the Database. A wind speed dataset covering a full year, from 1 December 2017, to 30 November 2018, was used in this study after debugging. The data were collected at the site of La Ventosa, Oaxaca, Mexico (coordinates: 16°32′40.8″ N, 94°57′09.0″ W), at a height of 40 m, using a WindMaster 3D ultrasonic anemometer with a sampling frequency of 1 Hz, a wind speed range of 0–50 m/s, and a resolution of 0.01 m/s. The dataset was subsequently cleaned, structured, and formatted to meet the requirements of the detection algorithm.
Development of the EOG Detection Algorithm. Building upon the findings of the review and the structure of the available data, an algorithm was developed based on the detection method described in Section 5, using the Python® programming language (version 3.13.5). This algorithm identifies EOGs with an amplitude equal to or greater than 8 m/s and a positive slope development time () ranging from 4 s to 9 s. These limits were established considering the temporal resolution of the records and the hypothesis that faster gusts produce greater impacts on the WECS. The detection threshold was defined based on two criteria. First, according to the World Meteorological Organization, when wind speed ranges between 8 and 10 m/s, its force becomes perceptible on the human body, reaching the limit of tolerable wind on land [35]. Second, as indicated by Rakib [26], the IEC standard appears to handle a threshold of approximately 9.7 m/s. Therefore, an initial analysis was carried out using a 10 m/s threshold, which resulted in only 185 detected gusts. Given the low number of events, the threshold was reduced to 9 m/s, yielding 539 EOGs. However, since this number remained relatively small, the final threshold was set at 8 m/s, resulting in 1655 detected EOGs. It should be noted that the algorithm detects gusts with amplitudes equal to or greater than 8 m/s, not only those at the threshold value. Regarding the time intervals, a value of 4 s was selected for , since the IEC standard indicates that the amplitude development time of gusts is approximately 5 s [26,36]. Furthermore, tests conducted with the detector showed that with s, the taxonomy of EOGs could still be properly distinguished; for smaller values, the formation time was insufficient. Conversely, was set to 9 s, as the study focuses on short-duration events and larger values caused more overlapping between gusts. It is important to note that and refer only to the amplitude development time and not to the entire duration of the event.
Debugging Overlapping Events. The detected events underwent a filtering process to remove overlapping gusts and evaluate the detector’s sensitivity. Initially, it was confirmed that the proposed method exhibits higher sensitivity, as it can identify events not considered by the standard. As shown in Section 6, only 12.57% of the events matched those defined by the standard. Furthermore, sets of EOGs that partially overlapped in time were identified, retaining only the event with the greatest amplitude within each set.
Taxonomic Classification of EOGs. From the filtered gust, various taxonomies have been established, grouped into seven taxonomic subgroups, which have been organized into three main categories according to the shape of the EOGs detected at the site (symmetrical and asymmetric). Subsequently, the relative frequency of occurrence of each taxonomy has been calculated, allowing for the identification of the predominant taxonomies at the site.
Development of the mathematical model. A mathematical model capable of representing the various taxonomies observed was developed. This model is based on the Mexican hat wavelet, which was modified in its shape and scaled to fit the taxonomy of each detected gust. The resulting model has the ability to reproduce any taxonomy identified in the dataset, allowing its subsequent use in numerical simulations aimed at analyzing the impact of EOGs on WECSs under realistic conditions.
Comparative analysis and discussion. Ultimately, the results obtained were compared with the classifications and models documented in the literature, including the symmetric taxonomy defined in the IEC 61400-2 standard and the asymmetric proposals presented by authors such as Manwell, along with the model proposed in this research. This comparison highlighted the limitations of the standard taxonomy in adequately representing the gusts recorded in regions with extreme wind conditions, such as La Ventosa, Oaxaca, Mexico.
4. Taxonomic Classification of EOGs
The taxonomic classification of EOGs is considered essential for the adequate characterization of their dynamic behavior and impact on WECSs. Typically, the IEC 61400-2 standard is proposed to represent EOGs in an idealized form, characterized by a completely symmetrical shape, as illustrated in Figure 1. This symmetry indicates that the duration and amplitude of the Positive Phase () and the Negative Phase () are equal.
However, this research evaluates two additional variants to this ideal shape, establishing a tolerance of m/s between the maximum and minimum amplitudes of the EOG. Based on this criterion, three types of normative taxonomy are defined:
- Type N0 (Symmetric): The EOG exhibits a symmetrical profile, with Positive Amplitude () and Negative Amplitude () values matching within the previously defined tolerance, and with rise and decay times of comparable duration.
- Type N1 (Negative Asymmetry): The exceeds the in magnitude by more than 1 m/s.
- Type N2 (Positive Asymmetry): The is higher than by more than 1 m/s.
This norm-based taxonomy, however, has displayed limitations when applied to actual wind dataset, in which gusts rarely exhibit symmetrical behaviors. Studies by Letson et al. [24] and Hu et al. [25] have documented that EOGs observed in the field tend to show significant asymmetries in both the magnitude and duration of their phases.
Based on these observations. The present research proposes a taxonomic classification that is more representative of the realities observed in sites with high turbulence, such as La Ventosa, Oaxaca, Mexico. To accomplish this, the parameter , is introduced, defined as the time elapsed from when the wind speed reaches its maximum value until it decreases below the established threshold (i.e., the duration of the ). This parameter is compared with , the duration of the , to determine the degree of temporal asymmetry of the event.
According to this methodology, and as shown in Figure 3, it is possible to visually identify the differences between the various taxonomies, taking as reference the one established in the IEC 61400-2 standard. Based on this foundation, the following alternative taxonomies are also considered:
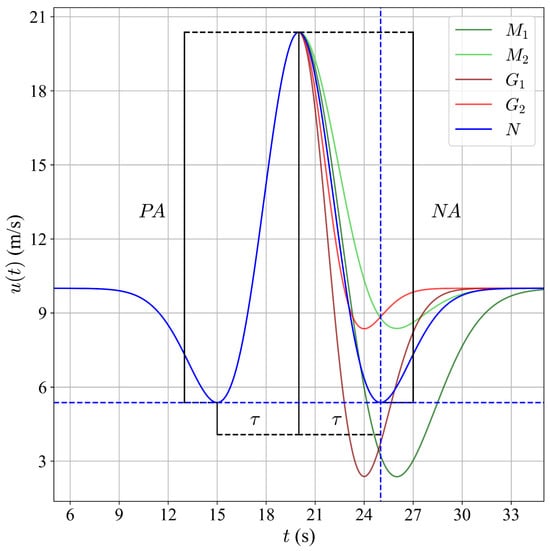
Figure 3.
EOG taxonomic classification.
- Manwell Taxonomies ( and ): Proposed in this research and based on [22], these taxonomies are characterized by a longer than the (). In turn, two variants are distinguished based on a reference line (represented in blue in Figure 3, corresponding to the minimum velocity value reached during ):
- -
- : The is lower than the reference value.
- -
- : The is higher than the reference value.
- Guillén Taxonomies ( and ): Are proposed in this research and are supported by the findings of [26], which observed that, on average, the duration of the exceeds that of the . Based on this behavior, two variants are defined, taking into account the relative position of the with respect to the reference line:
- -
- : The is below the reference value.
- -
- : The is above the reference value.
The complete process for determining the taxonomy of an EOG detected at the study site is illustrated in Figure 4. This scheme considers both the comparison between the durations of the and phases, as well as the differences between their amplitudes ( and ) and relative positions.
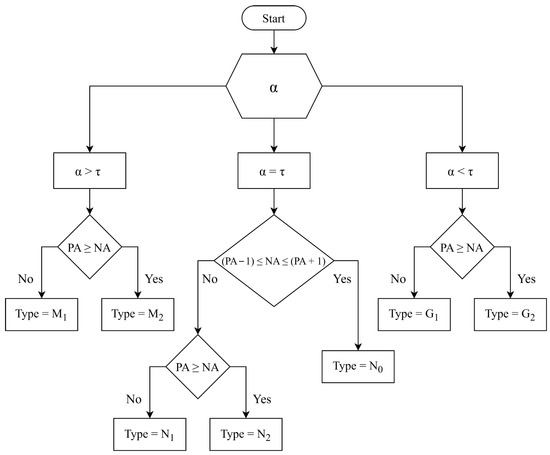
Figure 4.
Diagram of criteria for the taxonomic determination of EOGs.
5. EOG Detector Method
The detection method employed in this study relies on an approach that involves increasing speed beyond a specified threshold. It should be noted that this method has exclusively been applied to the detection of ECGs; hence, adaptations have been made to tailor it for the detection of EOGs. Such adaptations are accomplished through an analysis of two components of the EOG taxonomy: one that focuses on and the other that emphasizes , both of which are grounded in Equation (7) that delineates the method for incrementing above a certain threshold.
The operational process of the code, as illustrated in Figure 5, commences with the loading of wind speed data, followed by the initialization of the variables , and . The variable signifies the threshold which both the and must surpass in order to recognize the occurrence of an extreme gust of wind (8 m/s). Conversely, and establish the range of duration within which EOGs may manifest.
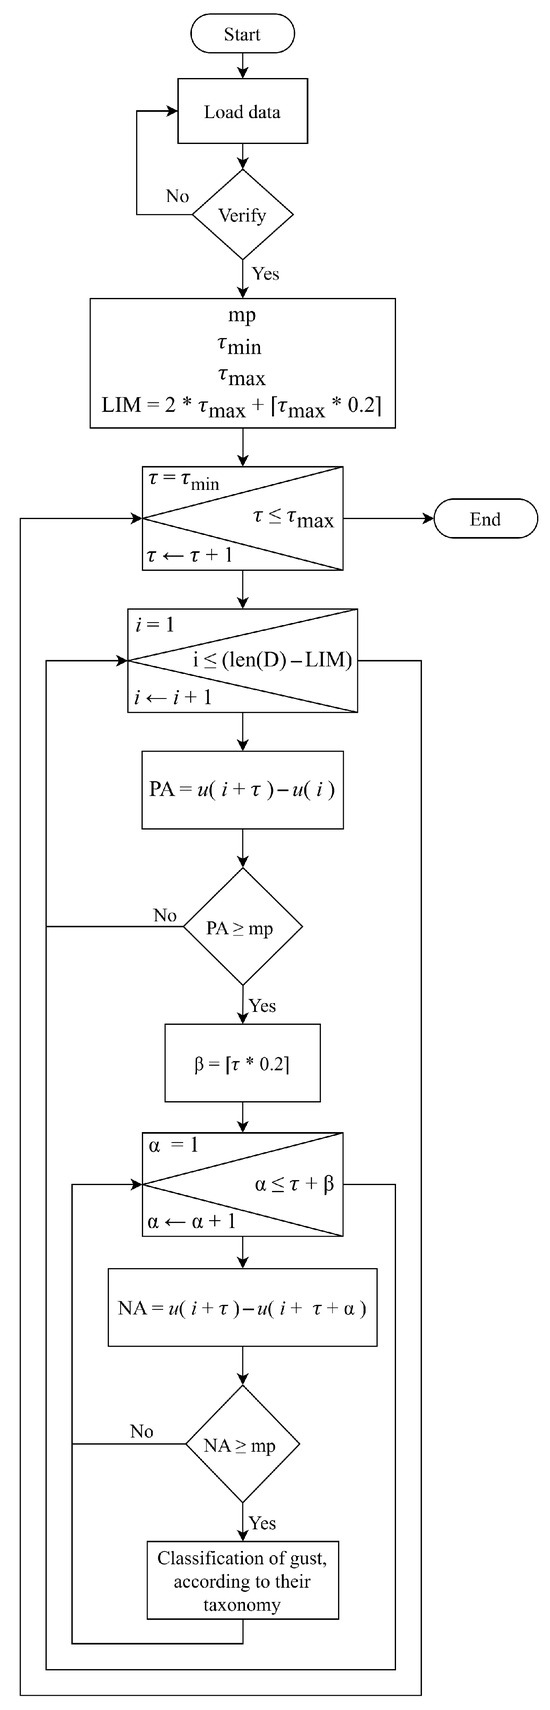
Figure 5.
Flowchart of the EOG detection method.
The program then executes a loop that iterates through the different values of . Within this loop, another loop is nested, tasked with analyzing all the points in the wind database. Finally, the section of the code responsible for identifying EOGs is activated. is calculated using the following equation:
If the condition defined in Equation (8) is satisfied, the detection process continues in the , as illustrated in Figure 5. Otherwise, the presence of an EOG is ruled out. Once meets the established criteria, the is analyzed using the condition defined in Equation (9).
where is equal to:
and where is determined by Equation (11).
The insertion of the parameter enables the method to detect EOGs within a time range during the evolution of the , as illustrated in Figure 6. This division of the analysis into two independent parts enhances detection by preventing the omission of significant EOGs, a crucial aspect of this study, particularly in cases where the varies in timing and amplitude compared to the .
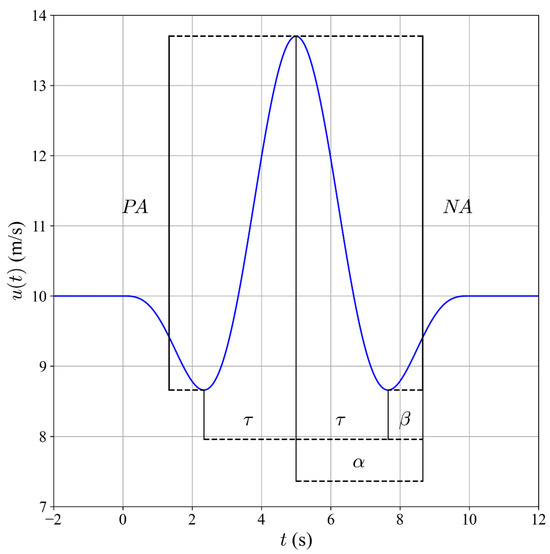
Figure 6.
Illustration of the variables used in the detector method.
This approach enhances the accuracy and sensitivity of the EOG detector method by using a time range instead of a fixed value, facilitating the identification of EOGs that other methods overlook.
6. Taxonomic Characterization of EOGs in La Ventosa, Oaxaca, Mexico
Once the EOG events were obtained in-situ, it was necessary for them to be classified into the various possible taxonomies. Section 4 delineated the criteria utilized for assigning each gust event to its corresponding taxonomy.
The analysis of the dataset resulted in the identification of a total of 1655 EOG events, which were classified in accordance with the established taxonomies. Table 2 presents the detailed distribution of each type of EOG taxonomy, with these events further grouped into the general categories M, G and N, thereby facilitating a comparative analysis.
Table 2.
Type distribution and clustered distribution.
The results indicate that the M cluster is the most frequent, accounting for 50.39% of the total detected EOG events. Within this category, the type is the most common, comprising 28.94%, followed by at 21.45%. This observation suggests that, in general, takes longer than in the EOGs of the site. An example of a real EOG classified under the taxonomy is presented in Figure 7a.
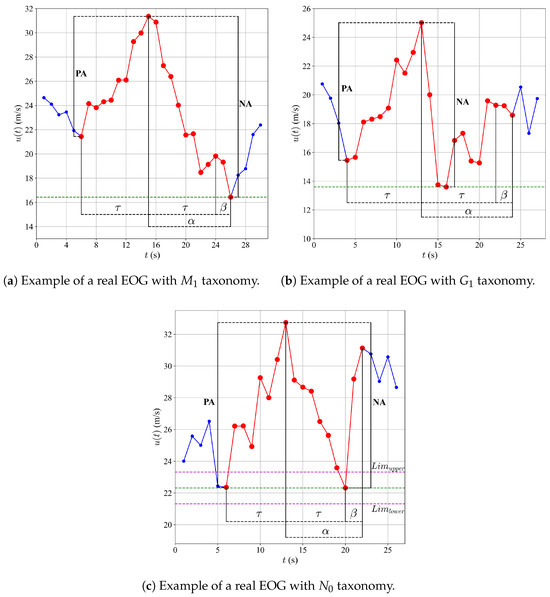
Figure 7.
Examples of real EOGs with different taxonomies: , , and .
Conversely, the G group, which encompasses 37.04% of the events, also exhibits a significant presence. Within this category, the type is the most frequent, representing 23.32%, followed by at 13.72%. These findings imply noteworthy differences in the amplitude of the gusts within this classification. An example of this type of event is illustrated in Figure 7b.
In contrast, group N is the least frequent, representing only 12.57% of all events. It should be noted that, as mentioned previously, a tolerance of m/s was assigned between the maximum and minimum amplitudes of each EOG, resulting in an even lower occurrence of the taxonomy described in the standard, as illustrated in Figure 7c. This indicates that EOGs in this category are less common compared to the M and G groupings, suggesting that the established taxonomy is not fully representative of EOGs in La Ventosa, Oaxaca, Mexico.
The predominance of groups M and G is evident, with these groups representing 50.39% and 37.04% of the total events, respectively. This indicates that most EOGs recorded in La Ventosa exhibit asymmetrical behaviors. Such a distribution suggests that the EOGs at this site tend to deviate from the taxonomy outlined in the IEC standard, which accounts for only 12.57% of cases. Recognizing that the majority of EOGs manifest asymmetrical behaviors allows for a more realistic approach to their study, which is essential for a more accurate assessment of their impact on WECSs.
7. Unified Mathematical Model for EOG Taxonomies
The results obtained in the characterization showed that, at the site of La Ventosa, the norm-based taxonomy presents only 12.57% of presence. This emphasizes the need to develop a mathematical model that is more suitable to be able to represent real events. In this section, a mathematical model capable of representing any of the identified taxonomies is described, with the ability to be modified according to the needs of amplitude and duration.
According to the literature, the Mexican hat wavelet is regarded as a viable option due to its behavior resembling that depicted in the standard, as suggested in [29,30]. Based on Equation (5), modifications were made to facilitate the understanding of the function’s behavior along the x and y axes. As illustrated in the examples presented in Figure 2, the function remains constant on the x-axis. Consequently, the variable was introduced to shift the function along the y-axis. This modification is also reflected in Equation (1), although in this case, the average speed is dependent on the height, which is not accounted for in this model. Similarly, the variable, representing the positive amplitude (from valley to peak) of the EOG, was included. This leads to the formulation of the following equation:
Once the behavior on the x-axis was solved, the y-axis was modified, using the properties of Equation (6), obtaining the following:
where is the valley-to-valley time of the gust, as shown in Figure 8a. It is important to note that this variable is only maintained if the taxonomy to be represented is symmetrical. Otherwise, the value of will vary according to the desired taxonomy, as illustrated in Figure 8b,c. The parameter b is responsible for the displacement of the function on the x-axis, while the parameter a ensures that the EOG has the desired valley-to-valley duration. Substituting these for meters in Equation (6) gives the following result:
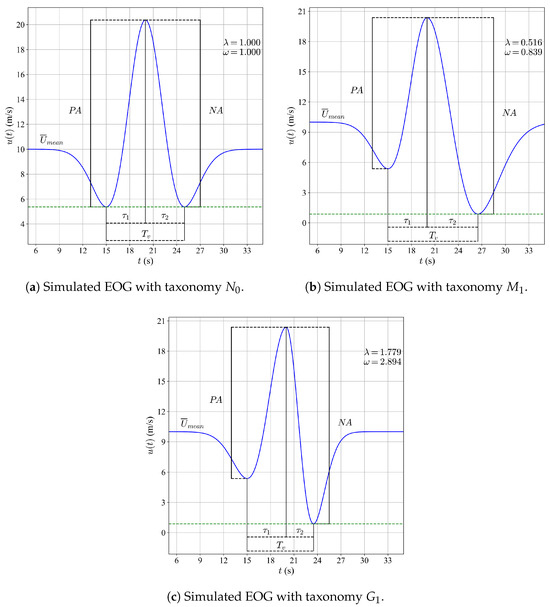
Figure 8.
Examples of simulated EOGs using taxonomies , , and .
Now, by substituting this expression into the Equation (12) where , the following is obtained:
The results of the characterization show that taxonomic differences occur in the Negative Phase (). Therefore, the mathematical model is developed in two parts: one for the Positive Phase () and one for the . The behavior of both phases will be determined by Equation (16). For the segment, this equation remains as originally shown. However, two scale factors ( and ) will be added to the segment equation, giving rise to the following system of equations:
As previously noted, the scale factors ( and ) govern the behavior of the , influencing both its duration and amplitude. Their relative values determine whether the amplitude is longer or shorter than , and whether the dominant effect arises from magnitude or from duration. This leads to three main cases:
- IEC 61400-2 Taxonomy Case (Symmetry): This case represents a neutral condition in which the relative duration and amplitude of and are equivalent, obtained by assigning a value of 1 to both and . It is not classified under the Manwell or Guillén taxonomies, but corresponds to the representation defined in the IEC 61400-2 standard, as shown in Figure 8a.
- Manwell Taxonomy Case (Asymmetry): In this case, the lasts longer than the , according to the Manwell taxonomies ( and ). The distinction between and is defined as follows:
- -
- and are below 1 in the majority of cases.
- -
- : occurs when .
- -
- : occurs when .
(Example: , , with , corresponding to ). This behavior is depicted in Figure 8b. - Guillén Taxonomy Case (Asymmetry): In this case, the lasts longer than the , according to the Guillén taxonomies ( and ). The distinction between and is defined as follows:
- -
- and are greater than 1 in the majority of cases.
- -
- : occurs when .
- -
- : occurs when .
(Example: , , with , corresponding to ). This behavior is shown in Figure 8c.
In Appendix A, Table A1 presents several cases that can be used for EOG simulation, where refers to the percentage deviation in the timing of the relative to the , and refers to the corresponding deviation in amplitude magnitude. The table also shows the values of and that should be used to obtain these combinations.
The mathematical model that has been developed effectively represents the various taxonomies of EOGs at the site of La Ventosa, Oaxaca, Mexico. By employing the Mexican hat wavelet equation as the base, an adequate representation of the variations in amplitude and duration of the EOGs is achieved. It has been observed that the behavior of and other associated parameters varies according to the values of the scale factors and . This model serves as a valuable tool for understanding extreme wind phenomena and can be employed to develop measures to safeguard the operation of WECSs.
8. Discussion of Results
The present study comprehensively addresses the detection of EOGs, their taxonomic characterization, and the mathematical modeling of the identified taxonomies in La Ventosa, Oaxaca, Mexico. A region characterized by an extreme wind environment. The results obtained allow for reflection on three fundamental axes: the effectiveness of the proposed detection method, the validity of the new taxonomy for classifying EOGs based on field-measured data, and the capacity of the developed mathematical model to accurately represent the taxonomy of EOGs.
Firstly, the detection algorithm implemented in the time domain is shown to exhibit robust and consistent performance against site-specific conditions. In contrast to traditional approaches, such as the Peak Over Threshold (POT) method or those based on increments above a certain threshold, this new methodology facilitates the identification of EOGs with significant variations in shape, amplitude, and duration—attributes commonly omitted by simpler techniques. It has been indicated in prior work by Branlard [23] that these conventional methods exhibit structural limitations as they fail to capture the asymmetry or the real kinematics of the gusts. The use of a range for the parameter in Equation (8), rather than a single value, has substantially reduced omissions, enabling a broader and more representative set of relevant events to be captured for the analysis of the impact of EOGs on WECSs.
Secondly, the new classification allows for a more faithful description of the diversity of taxonomies observed in La Ventosa, Oaxaca, Mexico. Specifically, it has been evidenced that the IEC framework only represents 12.57% of the detected events, in contrast to the 50.39% captured by Manwell’s taxonomy and the 37.04% represented by this research’s proposal. This finding corroborates previous studies, such as those conducted by Letson [24] and Hu [25], which highlight the asymmetry of gusts in sites with a high frequency of EOGs. It has been noted that, on average, the decay time () in the EOGs classified as M type is 17.01% longer than the ascent time (), validating both the characterization performed and the empirical formulation of the parameter in Equation (11). Although this value differs from the range of 30–40% reported by Letson, it is crucial to acknowledge that his analysis was based on a database of less than one year, while the current study encompasses a period of one year, offering greater statistical robustness.
Lastly, the mathematical model based on the Mexican hat wavelet demonstrates remarkable versatility in representing the various taxonomies of EOGs identified at the site. Unlike previous efforts, such as those of Manwell [22] and Branlard [23], which propose alternative taxonomies without linking them to a reproducible mathematical model, the present study offers a parametric model capable of adjusting both the duration and the shape of EOGs by manipulating the parameters and . This flexibility positions the model as a powerful tool for simulating extreme loads and designing adaptive control strategies in WECSs, thereby facilitating more realistic studies regarding the interaction between wind and structures.
Collectively, these findings reinforce the necessity of reviewing existing regulatory models, the simplifications of which compromise the safety and efficiency of WECSs in contexts characterized by extreme conditions. The methodology developed herein not only enhances the detection and classification of realistics gusts but also enables more representative simulations, which are fundamental for structural design, safe operation, and optimizing the life cycle of WECSs in regions such as La Ventosa.
9. Conclusions
This study addresses the pressing challenge of accurately characterizing EOGs in high-wind locations such as La Ventosa, Oaxaca, Mexico. Here, extreme gusts possess the potential to significantly affect the stability and performance of WECSs. Traditional regulatory frameworks, such as those outlined by IEC 61400-2, typically assume symmetric gust taxonomy. However, evidence indicates that these models frequently fail to align with actual field observations in extreme-wind regions. A discernible gap exists in the research concerning detection methodologies and taxonomies capable of capturing the full spectrum of EOG behaviors, including asymmetries in both amplitude and duration encountered in these environments. Consequently, there is a well-substantiated necessity for a data-driven approach aimed at generating more accurate simulation inputs for the design and control of WECSs.
A time-domain detection method was developed that identifies EOGs with amplitudes and durations outside the IEC 61400-2 standard assumptions, by employing amplitude thresholding (≥8 m/s) and duration windows ( between 4 s and 9 s), including a variable parameter for negative-phase detection. Compared to conventional Peak-Over-Threshold or fixed-increment methods, this algorithm captures a broader set of gust events with diverse shapes, reducing omissions of asymmetric gusts.
An analysis of one year of 1-Hz wind speed data from La Ventosa identified a total of 1655 EOG events. These events were classified according to multiple taxonomies: the normative taxonomy (based on IEC), the Manwell variant, the newly proposed classification scheme, the Guillén variant.
The IEC symmetric taxonomy accounted for only 12.57% of the events, whereas Manwell’s asymmetric taxonomy captured 50.39%. The proposed Guillén taxonomy represented 37.04% of the events, underscoring both the limitations of the standard model and the significant prevalence of asymmetry in the gust patterns recorded at the site. Statistical characterization further revealed that, on average, the decay phase () lasts approximately 17.01% longer than the ascent phase () in M-type events. This finding supports the empirical formulation of the parameter and highlights site-specific asymmetry patterns.
A mathematical model founded on the Mexican hat wavelet was tailored using parameters (, and ) and scaling factors ( and ) to accurately represent any established EOG taxonomy. This model exhibited remarkable adaptability in characterizing both symmetric and asymmetric gust profiles, facilitating the modulation of amplitude and duration for both positive and negative phases. Consequently, it provides a reliable parametric framework for simulating realistic extreme-gust inputs in WECSs analyses.
The discrepancy between standard symmetric assumptions and the observed diversity of gusts indicates that dependence on IEC-based models may undermine safety margins and efficiency in extreme wind conditions. Integrating the identified EOG characteristics along with the parametric model into structural simulations and control strategy design is anticipated to produce more precise load assessments and enhance protective mechanisms in WECSs functioning in locations such as La Ventosa.
The present research advances the realistic representation of EOGs by integrating a robust detection algorithm, a taxonomy grounded in observations which captures prevalent asymmetries, and a flexible, parametric wavelet-based model. These contributions effectively address critical deficiencies in conventional symmetric gust assumptions, providing designers and operators of WECSs with enhanced tools for more accurate simulation of extreme wind events. The adoption of such data-driven methodologies is imperative for improving the safety, reliability, and performance of wind energy systems operating in regions characterized by frequent and intense gust phenomena.
Main conclusions and findings:
- The standard IEC symmetric taxonomy represents only a small fraction (12.57%) of detected EOGs at La Ventosa, revealing its limited applicability in extreme-wind contexts.
- A time-domain detection algorithm with adaptive parameters successfully identifies a broader range of EOGs, capturing significant asymmetries in amplitude and duration.
- The taxonomic classification shows that asymmetric gusts predominate (Manwell taxonomy: 50.39%; proposed taxonomy: 37.04%), with decay phases on average 17% longer than ascent phases in M-type events.
- A parametric model based on the Mexican hat wavelet effectively reproduces diverse EOG shapes by adjusting scale factors, supporting realistic gust simulations.
- Incorporating observed EOG characteristics into WECS structural and control simulations can improve load assessment accuracy and inform more effective protection strategies.
- Detailed documentation of data, detection thresholds, and fitting procedures is vital for reproducibility and extension to other sites.
- The study is limited by a one-year, single-height, 1-Hz dataset; future work should include multi-year, multi-height, higher-frequency data, cross-site comparisons, and CFD/aeroelastic validation.
This research emphasizes the necessity of moving away from idealized symmetric gust assumptions in the characterization and modeling of EOGs within extreme-wind environments. Through the development of a robust detection algorithm, the identification of asymmetric gust prevalence using a data-driven taxonomy, and the provision of a versatile wavelet-based model, this study furnishes researchers and practitioners with precise and reproducible tools for simulating realistic gust loads. The application of these findings in the design and control of WECSs is expected to significantly enhance both resilience and efficiency in challenging wind conditions. In addition, this paper provides access to a digital tool implementing the detection method described in Section 5, available at https://mdrev2.unistmo.edu.mx/ (accessed on 20 October 2025). Looking ahead, broadening the dataset range, conducting cross-site validation, and collaborating with standards committees will be crucial for establishing more representative extreme gust models that will improve the safety and performance of wind energy systems globally.
Author Contributions
Conceptualization, Á.D.J.G.-O.; methodology, Á.D.J.G.-O.; software, Á.D.J.G.-O.; validation, Á.D.J.G.-O.; formal analysis, Á.D.J.G.-O., E.D.-R., I.M.D.L.S. and R.C.-A.; investigation, Á.D.J.G.-O., E.D.-R., E.H.-M., I.M.D.L.S., R.C.-A. and O.A.J.; resources, E.H.-M., I.M.D.L.S., R.C.-A. and O.A.J.; data curation, E.H.-M., I.M.D.L.S., R.C.-A. and O.A.J.; writing—original draft preparation, Á.D.J.G.-O.; writing—review and editing, Á.D.J.G.-O., E.D.-R., E.H.-M., I.M.D.L.S., R.C.-A. and O.A.J.; visualization, Á.D.J.G.-O.; supervision, E.D.-R. and O.A.J. All authors have read and agreed to the published version of the manuscript.
Funding
This research was funded by PAPIIT-UNAM Project “Modelado, Simulación y Validación a Escala de una Microrred Eléctrica Inteligente Basada en Fuentes de Energías Renovables para Estudios del Fenómeno Supra-Armónico” grant number IT100825.
Data Availability Statement
The wind speed dataset analyzed in this study was obtained from measurements conducted in La Ventosa, Oaxaca, Mexico. Due to institutional restrictions, the data cannot be made publicly available. However, they can be requested from the leader of project 272063, “Fortalecimiento del campo de la energía eólica”, Osvaldo Rodríguez Hernández, Ph.D. (osroh@ier.unam.mx).
Acknowledgments
The authors thank project 272063, “Fortalecimiento del campo de la energía eólica”, within the PhD program in Engineering at the Instituto de Energías Renovables of the Universidad Nacional Autónoma de México, for the facilities provided for the development of this project.
Conflicts of Interest
The authors declare no conflicts of interest.
Appendix A
Table A1.
Results of and for different objectives of and .
Table A1.
Results of and for different objectives of and .
| Obj | Obj | Real | Real | Error | ||
|---|---|---|---|---|---|---|
| 30% | 30% | 0.516 | 0.839 | 29.98% | 29.97% | 0.041 |
| 30% | 20% | 0.533 | 0.758 | 30.02% | 20.05% | 0.051 |
| 30% | 10% | 0.557 | 0.676 | 30.00% | 10.04% | 0.038 |
| 30% | 0% | 0.592 | 0.592 | 29.96% | 0.00% | 0.040 |
| 30% | −10% | 0.648 | 0.505 | 29.96% | −9.98% | 0.043 |
| 30% | −20% | 0.760 | 0.410 | 30.00% | −19.99% | 0.007 |
| 30% | −30% | 1.370 | 0.277 | 30.00% | −29.99% | 0.011 |
| 20% | 30% | 0.605 | 0.984 | 20.02% | 29.99% | 0.023 |
| 20% | 20% | 0.626 | 0.890 | 19.98% | 20.03% | 0.033 |
| 20% | 10% | 0.654 | 0.793 | 19.98% | 9.99% | 0.025 |
| 20% | 0% | 0.694 | 0.694 | 20.04% | 0.00% | 0.040 |
| 20% | −10% | 0.760 | 0.592 | 20.02% | −10.00% | 0.020 |
| 20% | −20% | 0.892 | 0.481 | 20.02% | −20.00% | 0.020 |
| 20% | −30% | 1.609 | 0.325 | 20.00% | −29.99% | 0.008 |
| 10% | 30% | 0.720 | 1.171 | 10.02% | 29.99% | 0.025 |
| 10% | 20% | 0.745 | 1.059 | 9.98% | 20.01% | 0.025 |
| 10% | 10% | 0.778 | 0.944 | 10.00% | 10.03% | 0.025 |
| 10% | 0% | 0.826 | 0.826 | 10.02% | 0.00% | 0.020 |
| 10% | −10% | 0.905 | 0.705 | 9.98% | −10.00% | 0.020 |
| 10% | −20% | 1.062 | 0.573 | 9.98% | −19.99% | 0.022 |
| 10% | −30% | 1.924 | 0.386 | 10.00% | −30.01% | 0.012 |
| 0% | 30% | 0.872 | 1.418 | −0.02% | 29.97% | 0.033 |
| 0% | 20% | 0.901 | 1.281 | 0.00% | 20.03% | 0.028 |
| 0% | 10% | 0.942 | 1.142 | −0.02% | 9.97% | 0.032 |
| 0% | 0% | 1.000 | 1.000 | 0.00% | 0.00% | 0.000 |
| 0% | −10% | 1.095 | 0.853 | −0.02% | −10.00% | 0.020 |
| 0% | −20% | 1.285 | 0.693 | 0.00% | −20.00% | 0.000 |
| 0% | −30% | 2.318 | 0.468 | 0.00% | −29.99% | 0.007 |
| −10% | 30% | 1.076 | 1.750 | −10.00% | 29.99% | 0.015 |
| −10% | 20% | 1.113 | 1.582 | −10.02% | 20.01% | 0.022 |
| −10% | 10% | 1.162 | 1.409 | −9.98% | 9.99% | 0.024 |
| −10% | 0% | 1.235 | 1.235 | −10.02% | 0.00% | 0.020 |
| −10% | −10% | 1.351 | 1.053 | −10.00% | −9.98% | 0.021 |
| −10% | −20% | 1.587 | 0.856 | −10.02% | −20.00% | 0.020 |
| −10% | −30% | 2.868 | 0.577 | −10.00% | −30.00% | 0.004 |
| −20% | 30% | 1.362 | 2.216 | −20.00% | 30.02% | 0.016 |
| −20% | 20% | 1.408 | 2.001 | −20.00% | 20.00% | 0.001 |
| −20% | 10% | 1.471 | 1.784 | −20.00% | 10.00% | 0.003 |
| −20% | 0% | 1.563 | 1.563 | −20.02% | 0.00% | 0.020 |
| −20% | −10% | 1.710 | 1.332 | −20.00% | −10.00% | 0.000 |
| −20% | −20% | 2.007 | 1.083 | −20.00% | −19.99% | 0.012 |
| −20% | −30% | 3.570 | 0.735 | −19.98% | −29.93% | 0.070 |
| −30% | 30% | 1.779 | 2.894 | −30.00% | 30.00% | 0.003 |
| −30% | 20% | 1.839 | 2.614 | −30.00% | 20.01% | 0.012 |
| −30% | 10% | 1.922 | 2.331 | −30.00% | 10.00% | 0.002 |
| −30% | 0% | 2.041 | 2.041 | −30.00% | 0.00% | 0.000 |
| −30% | −10% | 2.234 | 1.740 | −30.00% | −10.00% | 0.004 |
| −30% | −20% | 2.622 | 1.414 | −30.00% | −20.00% | 0.001 |
| −30% | −30% | 4.680 | 0.959 | −30.00% | −29.95% | 0.052 |
References
- Energy Institute. Statistical Review of World Energy, 74th ed.; Energy Institute: London, UK, 2025. [Google Scholar]
- Global Wind Energy Council. Global Wind Report 2024; Global Wind Energy Council: Brussels, Belgium, 2024. [Google Scholar]
- Thomas, S.R.; Martínez-Alvarado, O.; Drew, D.; Bloomfield, H. Drivers of extreme wind events in Mexico for windpower applications. Int. J. Climatol. 2020, 40, 2321–2340. [Google Scholar] [CrossRef]
- Galarza-Chavez, A.A.; Martinez-Rodriguez, J.L.; Domínguez Cruz, R.F.; López-Garza, E.; Rios-Alvarado, A.B. Multi-step wind energy forecasting in the Mexican Isthmus using machine and deep learning. Energy Rep. 2025, 13, 1–15. [Google Scholar] [CrossRef]
- Jaramillo, O.A.; Borja, M.A. Wind speed analysis in La Ventosa, Mexico: A bimodal probability distribution case. Renew. Energy 2004, 29, 1613–1630. [Google Scholar] [CrossRef]
- Villalobos, C.A.L. Caracterización de la Intensidad de Turbulencia y Energía Contenida en Ráfagas Para Aplicaciones en Energía Eólica. Ph.D. Thesis, Universidad Nacional Autónoma de México, Mexico City, Mexico, 2019. [Google Scholar]
- Lei, Z.; Lin, H.; Tang, X.; Xiong, Y.; Wen, H. Wind turbine blade fault detection method based on TROI-SVM. Sensors 2025, 25, 720. [Google Scholar] [CrossRef]
- Kumar, N.; Venkaiah, P.; Sarkar, B.K.; Maity, S. Wind turbine electrohydraulic transmission system control for maximum power tracking with pump fault. Proc. Inst. Mech. Eng. Part I J. Syst. Control Eng. 2023, 237, 1702–1716. [Google Scholar] [CrossRef]
- Hart, E.; Stock, A.; Elderfield, G.; Elliott, R.; Brasseur, J.; Keller, J.; Guo, Y.; Song, W. Impacts of wind field characteristics and non-steady deterministic wind events on time-varying main-bearing loads. Wind. Energy Sci. 2022, 7, 1209–1226. [Google Scholar] [CrossRef]
- Zobair, M.; Aly, M.M.; Said, S.M. Mitigation of voltage and frequency oscillations of a microgrid during wind gust by using fuzzy-controlled flywheel energy storage. Int. J. Appl. Energy Syst. 2024, 6, 12–22. [Google Scholar] [CrossRef]
- Menegozzo, L.; Monte, A.D.; Benini, E.; Benato, A. Small wind turbines: A numerical study for aerodynamic performance assessment under gust conditions. Renew. Energy 2018, 121, 123–132. [Google Scholar] [CrossRef]
- IEC 61400-1 Ed 3.1; Wind Turbines—Part 1: Design Requirements; International Electrotechnical Commission: Geneva, Switzerland, 2014.
- IEC 61400-2 Ed 3.0; Wind Turbines—Part 2: Design Requirements for Small Wind Turbines; International Electrotechnical Commission: Geneva, Switzerland, 2013.
- Bao, D.; Shi, Z.; Li, C.; Jiang, A.; Han, Q.; Luo, Y.; Zhang, S. A study on the influence of different inflow conditions on the output power and dynamic response characteristics of a variable pitch wind turbine structure. Energies 2024, 17, 5818. [Google Scholar] [CrossRef]
- Xu, J.; Zhang, L.; Li, X.; Li, S.; Yang, K. A study of dynamic response of a wind turbine blade based on the multi-body dynamics method. Renew. Energy 2020, 155, 358–368. [Google Scholar] [CrossRef]
- Scott, S.; Capuzzi, M.; Langston, D.; Bossanyi, E.; McCann, G.; Weaver, P.M.; Pirrera, A. Effects of aeroelastic tailoring on performance characteristics of wind turbine systems. Renew. Energy 2017, 114, 887–903. [Google Scholar] [CrossRef]
- Wang, H.; Wen, J.; Ma, G.; Yuan, L.; Ran, Q.; Zhang, J.; Zhou, S. Coupled dynamics analysis of floating wind turbine mooring system under extreme operating gust. Appl. Ocean. Res. 2025, 154, 104333. [Google Scholar] [CrossRef]
- Srinivasan, L.; Ram, N.; Rengarajan, S.B.; Divakaran, U.; Mohammad, A.; Velamati, R.K. Effect of macroscopic turbulent gust on the aerodynamic performance of vertical axis wind turbine. Energies 2023, 16, 2250. [Google Scholar] [CrossRef]
- Schulz, C.W.; Özinan, U.; Netzband, S.; Cheng, P.W.; Abdel Maksoud, M. The impact of unsteadiness on the aerodynamic loads of a floating offshore wind turbine. J. Phys. Conf. Ser. 2023, 2626, 012064. [Google Scholar] [CrossRef]
- O’Donnell, C.W.; Salari, M.E.; Toal, D.J. A study on directly interconnected offshore wind systems during wind gust conditions. Energies 2021, 15, 168. [Google Scholar] [CrossRef]
- Reyes, G.; Mayoral, E.; Reyes, E.; Cortez, I.; Portela, J. Impact of the extreme operating gusts on power converter connected to PMSG-based wind turbine for reliability analysis. IEEE Lat. Am. Trans. 2024, 22, 854–863. [Google Scholar] [CrossRef]
- Manwell, J.; McGowan, J.; Rogers, A. Wind Energy Explained: Theory, Design and Application, 1st ed.; John Wiley & Sons: Chichester, UK, 2003; ISBN 978-0-471-49972-5. [Google Scholar]
- Branlard, E. Wind Energy: On the Statistics of Gusts and Their Propagation Through a Wind Farm; Energy Research Center of the Netherlands: Petten, The Netherlands, 2009.
- Letson, F.; Barthelmie, R.J.; Hu, W.; Pryor, S.C. Characterizing wind gusts in complex terrain. Atmos. Chem. Phys. 2019, 19, 3797–3819. [Google Scholar] [CrossRef]
- Hu, W.; Letson, F.; Barthelmie, R.J.; Pryor, S.C. Wind gust characterization at wind turbine relevant heights in moderately complex terrain. J. Appl. Meteorol. Climatol. 2018, 57, 1459–1476. [Google Scholar] [CrossRef]
- Rakib, M.I.; Evans, S.P.; Clausen, P.D. Measured gust events in the urban environment, a comparison with the IEC standard. Renew. Energy 2020, 146, 1134–1142. [Google Scholar] [CrossRef]
- Mallat, S. A Wavelet Tour of Signal Processing, 1st ed.; Academic Press: Burlington, NY, USA, 1999; ISBN 978-0-124-66605-4. [Google Scholar]
- Larsen, G.C.; Hansen, K.S. Database on Wind Characteristics—Analyses of Wind Turbine Design Loads; Risoe-R No. 1473(EN); Forskningscenter Risoe: Roskilde, Denmark, 2004; ISBN 978-0-12-374370-1. [Google Scholar]
- Nabout, A.A.; Tibken, B. Wavelet descriptors for object recognition using Mexican hat function. In Proceedings of the 16th IFAC World Congress, Prague, Czech Republic, 4–8 October 2005. [Google Scholar]
- Jagdev, S.; Hemen, D.; Devendra, K.; Dumitru, B.; Jordan, H. Methods of Mathematical Modelling and Computation for Complex Systems, 1st ed.; Springer: Cham, Switzerland, 2022; ISBN 978-3-030-77169-0. [Google Scholar]
- Bhaskaran, S.; Verma, A.S.; Goupee, A.J.; Bhattacharya, S.; Nejad, A.R.; Shi, W. Comparison of extreme wind and waves using different statistical methods in 40 offshore wind energy lease areas worldwide. Energies 2023, 16, 6935. [Google Scholar] [CrossRef]
- Schinas, P.N.; Manolas, D.I.; Riziotis, V.A.; Philippidis, T.P.; Voutsinas, S.G. Statistical extrapolation methods for estimating extreme loads on wind turbine blades under turbulent wind conditions and stochastic material properties. Wind. Eng. 2021, 45, 921–938. [Google Scholar] [CrossRef]
- Zhou, K.; Cherukuru, N.; Sun, X.; Calhoun, R. Wind gust detection and impact prediction for wind turbines. Remote Sens. 2018, 10, 514. [Google Scholar] [CrossRef]
- Graps, A. An introduction to wavelets. IEEE Comput. Sci. Eng. 1995, 2, 50–61. [Google Scholar] [CrossRef]
- World Meteorological Organization. Guide to Meteorological Instruments and Methods of Observation, Volume I: Measurement of Meteorological Variables; WMO-No. 8; World Meteorological Organization: Geneva, Switzerland, 2018. [Google Scholar]
- Shirzadeh, K.; Hangan, H.; Crawford, C.; Hashemi Tari, P. Investigating the loads and performance of a model horizontal axis wind turbine under reproducible IEC extreme operational conditions. Wind Energy Sci. 2021, 6, 477–489. [Google Scholar] [CrossRef]
Disclaimer/Publisher’s Note: The statements, opinions and data contained in all publications are solely those of the individual author(s) and contributor(s) and not of MDPI and/or the editor(s). MDPI and/or the editor(s) disclaim responsibility for any injury to people or property resulting from any ideas, methods, instructions or products referred to in the content. |
© 2025 by the authors. Licensee MDPI, Basel, Switzerland. This article is an open access article distributed under the terms and conditions of the Creative Commons Attribution (CC BY) license (https://creativecommons.org/licenses/by/4.0/).