Abstract
NFT prices are shaped by heterogeneous signals including visual appearance, textual narratives, transaction trajectories, and on-chain interactions, yet existing studies often model these factors in isolation and rarely unify multimodal alignment, temporal non-stationarity, and heterogeneous relational dependencies in a leakage-safe forecasting setting. We propose MM-Temporal-Graph, a cross-modal temporal graph transformer framework for explainable NFT valuation and information-centric risk forecasting. The model encodes image, text, transaction time series, and blockchain behavioral features, constructs a heterogeneous NFT interaction graph (co-transaction, shared creator, wallet relation, and price co-movement), and jointly performs relation-aware graph attention and global temporal–structural transformer reasoning with an adaptive fusion gate. A contrastive multimodal alignment objective improves robustness under market drift, while a risk-aware regularizer and a multi-source risk index enable early warning and interpretable attribution across modalities, time segments, and relational neighborhoods. On MultiNFT-T, MM-Temporal-Graph improves MAE from 0.162 to 0.153 and R2 from 0.823 to 0.841 over the strongest multimodal graph baseline, and achieves 87.4% early risk detection accuracy. These results support accurate, robust, and explainable NFT valuation and proactive risk monitoring in Web3 markets.
1. Introduction
The quick growth of the Web3 environment has also resulted in the emergence of digital collectibles known as non-fungible tokens (NFTs) [1]. An NFT combines various sources of information: image data of the artwork itself, descriptive information about the artwork, artist information, social information, transaction information, and network information regarding the blockchain relationships [2]. Analyzing the interaction of the various information streams in modulating market trends has been the challenge of information analysis of Web3 platforms. The price of NFTs has been driven by nonlinear and non-stationary trends that cannot be accounted for solely through image data. Recent empirical analyses have identified several stylized facts in NFT markets that are directly relevant to our modeling choices. First, NFT price/return fluctuations are heavy-tailed and deviate from Gaussian assumptions, implying that large moves and volatility bursts are non-negligible rather than rare. Second, NFT price dynamics can exhibit long-range temporal correlations and, in certain regimes, multifractal (multi-scale) organization, indicating that both short-term shocks and persistent memory effects may coexist. Third, cross-collection and cross-instrument dependencies are time-varying and may contain non-random global modes beyond noise, suggesting that a relational structure is essential for capturing systemic co-movements. These findings motivate our design of a temporal encoder capable of modeling long-range dependencies and a heterogeneous interaction graph that explicitly represents co-movement and cross-entity relations [3,4].
The existing research work concerning price prediction of NFTs mostly adopts unimodal attributes from the price histories of the concerned items, image embeddings, and/or metadata attributes [5]. The above-mentioned studies address only partial aspects of the problem because they do not consider the multimodal and relational characteristics of the involved market of heterogeneous information networks. Besides the above considerations, existing models mostly fail to consider the complex interrelated graphical structures emerging due to the flow of money, buyer–seller relationships, and ownership information in the form of contract relationships of the involved items while ignoring the co-movement of items within the same collection [6]. In the context of information systems research, the above-described graphs represent the structural information about the information flows through the concerned market [7].
In addition to pointwise prediction performance, information-centric risk analysis in NFT markets also lacks systematic methodologies [8]. Web3 marketplaces are prone to abrupt price crashes, wash trading, and behavior-driven anomalies in which regional shocks can spread through address-level or collection-level graphs [9]. In conventional financial risk analysis, variance-driven volatility and Value-at-Risk (VaR) represent the phenomena only partially because they do not model the transaction paths involving multiple steps, the whale-dominated graphs, and the intercollection linkages. It is a requirement to develop unified models that can encode NFTs and their contexts as multimodal and graph-data information entities, model the dynamics of the information entities over time, and extract risk indicators from the abstracted representations.
To overcome the above challenges, this work presents the multimodal temporal fusion and graph-structured modeling framework, a framework that combines four diverse information sources—visual embeddings, textual semantics, trading time series data, and graphs of on-chain relationships—that can be applied to the information-driven valuation and risk assessment of NFTs. The framework incorporates the fusion of temporal information at various scales through fusion modules that consider short-term market impulses and long-term behavioral patterns. The framework also utilizes the fusion of address-level and collection-level graphs through the application of graph attention layers to allow the model to reason about information flow and interasset correlations. Finally, the framework incorporates a contrastive multimodal learning scheme to improve the robustness of the framework against domain shifts from its learning environment to its testing environment.
In addition to the above representation learning tasks, this paper aims to develop a graph-based multi-source risk index (GMRI) measure of the instability of the NFT market pertaining to three sources: anomalous behavior patterns, disruptions of the relationship graphs, and overall multimodal sensitivity. The reason to consider this measure relevant to the paper’s contributions can be explained from the point of view of information system research and applications: in the context of information system research and applications, the presented work combines predictability with the structured understanding of the role of various information sources jointly impacting the valuation.
The major contributions of this work are summarized as follows:
- A unified multimodal temporal graph modeling framework that integrates visual, textual, transactional, and relational information for NFT valuation, overcoming the limitations of unimodal or sequence-only information models.
- A graph-structured relational learning module that captures liquidity flow, behavioral dependencies, and cross-collection co-movement through heterogeneous graph attention mechanisms, offering an information network view of NFT ecosystems.
- A multimodal contrastive alignment mechanism that enhances representation consistency across modalities and improves robustness under highly non-stationary and cross-market Web3 environments.
- A graph-based multi-source risk analysis index (GMRI) that provides interpretable insights into anomaly propagation, structural vulnerabilities, and multimodal drivers of market volatility, supporting risk-aware information system design.
- Extensive experiments on real-world NFT datasets demonstrating significant improvements in prediction accuracy, cross-market generalization, and interpretability over strong baselines, together with detailed analyses of how different information channels contribute to valuation and risk.
In summary, this work sets up a paradigm of information modeling concerning the valuation of digital collectibles based on the combination of multimodal information, time dynamics, and graphical relationships. The model presented above advances the methods of understanding and analyzing risks relevant to the Web3 information system of digital assets.
2. Related Work
2.1. NFT Valuation and Digital Asset Prediction
The number of studies about the valuation of NFTs has grown substantially in recent years due to the massive popularity of digital collectibles and the financial importance of on-chain assets [10]. The first studies about the valuation of NFTs mainly concentrated on statistical models of price series through the use of autoregressions, sentiment factors, and/or manually designed attributes based on auctions [11]. Although straightforward, these models do not adequately represent the nonlinear behavior of the involved markets. Later research involved the development of machine learning models that considered visual and/or text information from NFTs. Vision-based research involved the usage of CNNs or CLIP models as encoders to identify aesthetic characteristics, rarity information, and/or styles from the visual representations of NFTs. The research demonstrated the role of visual characteristics in the price of the asset. Text-based models involved the usage of transformer models as encoders to identify meanings from the texts of NFTs. The models did not consider the combined role of the visual and meaning aspects of the text. However, there has been recent interest in the incorporation of multimodal learning settings, although the predominant work done in multimodal learning of NFTs has only used basic fusion strategies (such as the fusion of the image and the description through simple attentions) [12]. In addition to this, the predominant models will treat each of the NFTs as isolated assets without incorporating ways to denote the effect of collections, the whale effect, or the market movement at the group level.
2.2. Multimodal Time Series Modeling
Multimodal temporal learning has also recently received significant interest in the context of financial prediction tasks and recommendation systems [13]. The transformer architecture has been proven to be quite effective at learning long-term dependencies as well as combining multiple modalities like text and video pairs, audio and motion pairs, and sensor data and trajectory pairs [14]. Cross-modal attentions and fusion modules will be explored in this regard. However, the state-of-the-art multimodal time series models are almost exclusively developed in the context of conventional applications such as stock market prediction, electronic health record analysis, and human behavior identification [15]. The applications are considerably different from the Web3 asset markets because their price dynamics are driven both by the sentiment of users and the behavior of creators at the same time. The existing models hardly consider the transaction graphs and the behavioral propagation dynamics and, hence, cannot be used efficiently in the context of NFT value estimation tasks.
2.3. Graph Neural Networks in Financial and Blockchain Analysis
Graph neural networks (GNNs) have received increasing interest in financial modeling because of their capability of handling relational learning [16]. In the conventional field of finance, research applications of GNNs can be found in stock correlation graphs, portfolio management, fraudulent activity identification, and systemic risk management [17]. These applications clearly confirm the effectiveness of structural information about movement and/or influence from co-entities. In the field of blockchain analytics, GNNs were applied to illicit transaction detection, address identity classification, money flow paths, and abnormal contract behavior identification [18]. This work illustrates that there are complex topology and timing behaviors in blockchain networks which cannot be represented through sequence-based models. Although encouraging progress has been made, there are several limitations that remain: (1) state-of-the-art blockchain GNN models rarely consider multimodal attributes of the involved NFTs, which can be images and/or text information, to name a few; (2) the models at large are limited to analyzing the graphs in their static form without considering the dynamics of address interaction patterns over time; and (3) the preponderance of the models utilize graphs from the forensic classification perspective rather than valuation and risk.
2.4. Risk Modeling and Anomaly Analysis in Web3 Markets
Cryptocurrency market risk analysis needs volatility, liquidity levels, and order book models [19]. However, the factors and models used in the risk analysis of the cryptocurrency market cannot be applied to the NFT market because the latter has heterogeneous auctions, liquidity pools, and price setting according to artists’ preferences. The existing research work in the field of NFTs mostly involves the identification of wash trading and price distortions due to rarity [20]. In addition, the Web3 environment presents strong network effects: it might be the case that a few selected addresses or collections can cause cascade failures as well as contagion across collections [21]. Standard risk measurement tools like Value-at-Risk (VaR), Sharpe ratio, and volatility models based on GARCH do not consider the above-mentioned graph propagation phenomena. Graph analytics has been recently introduced for anomaly detection in the context of blockchain forensics. In the relevant work presented, it has not been combined with multimodal valuation of NFTs and price risk models.
2.5. Summary and Research Gap
In summary, prior work typically focuses on following Table 1: (i) unimodal or shallow multimodal NFT valuation, (ii) temporal forecasting without explicit on-chain relational reasoning, or (iii) graph analytics that often treats blockchain structure as static and decoupled from multimodal content. Two practical gaps remain: (1) unified multimodal temporal graph forecasting under strict leakage control, where graph construction and feature statistics do not access future transactions and (2) risk-aware and explainable valuation with quantitative evidence of explanation faithfulness and stability. To address these gaps, our MM-Temporal-Graph couples multimodal alignment, heterogeneous relational reasoning, and temporal–structural fusion and further introduces risk-aware learning and quantitative interpretability evaluation.

Table 1.
Summary of representative NFT/Web3 valuation studies and the positioning of this work.
3. Method
3.1. Framework Overview
The framework shows in Figure 1 presented in this paper involves a integration multimodal temporal graph framework architecture, which can be used to correctly predict the price of NFTs and provide a full risk analysis of the market. Contrary to previous studies that isolated the price of the NFT without considering its behavior in the Web3 market environment based on multimodal attributes from the same context environment and its temporal trading patterns in the Web3 environment, this study involves the behavior of the multimodal attributes of the temporal trading patterns of the Web3 environment. Systemically speaking, the multimodal attributes of the temporal trading patterns of Web3 environment characteristics that display synchronized behavior in the Web3 environment often display symmetry characteristics in their behavior, and vice versa.
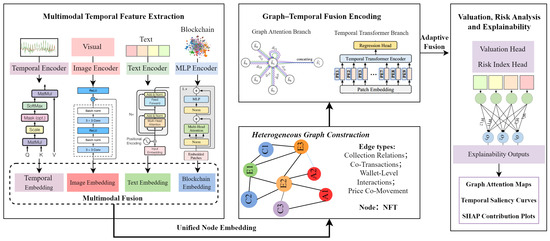
Figure 1.
The overall architecture of the proposed framework.
In the initial phase, the multimodal temporal features are derived from four sources: visual contents of the collectibles, text information related to the collectibles, time series regarding the transactions of the collectibles, and blockchain behavioral signals. The visual and text information represent the aesthetic and semantic characteristics of the collectibles. The time series information reveals the short-term and long-term price behavior of the collectibles. The blockchain statistics measure the liquidity and trading activities of the collectibles.
The second step builds a heterogeneous NFT interaction graph which captures structural relationships between assets. The vertices are the NFTs themselves, while the edges represent different types of relationships like common creators, co-transactions, across wallets, and collection-level correlations. The co-movement edges based on price sequence similarity are also extracted to capture the time-evolving market groups and contagion structures. The above step puts the NFTs in a structural environment which reflects the liquidity flows and behavior patterns of real-world assets.
In the third step, the integration of temporal models and graph-based relational reasoning is achieved through the fusion of graphs and the transformer architecture within the hybrid fusion module. The short-term shock series and the long-term seasonal patterns observed in the price series of the non-fungible tokens are handled by temporal encoders. Meanwhile, the structural patterns of the graphs are handled through the graph attention network used to identify structurally important neighbors. The final global representation captures the multimodal information imported from the fusion step.
The final step involves the output of the embedding being inputted into the valuation and risk analysis module. Apart from the valuation of the asset, this step involves the incorporation of a structural risk index which takes the form of a graph approach and provides insights into structural weaknesses, behavioral irregularities, as well as antecedents of instability in the markets. This step also involves the provision of multimodal and structural explanations informed through the principles of attribution through attention, temporal significance, and Shapley values at the level of the features.
3.2. Multimodal Temporal Feature Representation
Each NFT is described by four complementary modalities—image content, textual metadata, transaction time series, and blockchain behavior statistics—each reflecting a distinct dimension of how market participants perceive, evaluate, and trade the asset. Modeling these modalities jointly is essential for capturing both intrinsic value signals and extrinsic market dynamics. This multimodal temporal representation serves as the foundation for the subsequent graph construction and relational reasoning stages.
3.2.1. Visual Representation
The image of an NFT embeds a considerable portion of its aesthetic, stylistic, and compositional characteristics, which directly affects buyer preference and perceived rarity. Given an NFT image , a vision encoder extracts a high-level latent embedding:
We adopt either a convolutional- or transformer-based backbone to capture both local texture and global compositional features. Standard augmentations such as color jitter, affine transformation, and Gaussian blur are incorporated during training to enhance the encoder’s robustness to stylistic variation common in diverse NFT collections. This visual latent space captures salient patterns useful not only for valuation but also for identifying visually similar assets that exhibit quasi-symmetric pricing behaviors.
3.2.2. Textual Semantic Representation
Beyond visual appeal, textual metadata reflects semantic information describing an NFT’s narrative context, rarity attributes, collection-level significance, and creator background. These descriptions often shape user perception and contribute to long-term value appreciation. We tokenize each metadata sequence and encode it using a pretrained transformer language model:
The encoder provides contextualized embeddings that capture both phrase-level meaning and higher-level semantic structure. These textual features complement the visual representation, offering a second modality that influences market valuation. Moreover, jointly analyzing visual and textual features enables the model to capture cross-modal alignment, which is critical for understanding why NFTs with similar artistic styles may diverge in value due to semantic attributes.
3.2.3. Transaction Time Series Representation
Temporal price and volume dynamics reflect short-term speculation, liquidity cycles, and broader market sentiment. Let
denote the price–volume sequence for NFT i. A temporal encoder , instantiated as a Temporal Convolution Network or transformer, maps the sequence to a compact representation:
This module captures volatility bursts, seasonal patterns, structural shocks, and temporal dependencies that are essential for risk-sensitive modeling. Unlike static metadata, temporal features reflect evolving market conditions and, thus, provide critical signals for identifying early-stage risks and market anomalies. In particular, empirical evidence of long-range dependence and multi-scale (potentially multifractal) behavior of NFT price dynamics further motivates the use of expressive temporal encoders that can capture both persistent memory and abrupt regime shifts.
3.2.4. Blockchain Behavioral Representation
To incorporate broader market engagement, we define a vector of blockchain activity features:
including transaction frequency, liquidity measures, creator credibility, token age, and structural clustering of trading partners. These features capture behavioral patterns that correlate with long-term market stability. A multilayer perceptron produces a latent representation:
This representation provides a third complementary view—market structure and social dynamics—essential for risk perception and contagion modeling.
3.2.5. Unified Multimodal Projection
To construct a coherent representation for downstream graph modeling, each modality is linearly projected into a shared latent dimension d:
These vectors are then fused using a gated nonlinear transformation:
The unified representation captures intrinsic content, temporal behavior, and structural signals simultaneously. NFTs with similar multimodal and temporal signatures naturally lie close in this latent space, enabling the emergence of quasi-symmetric neighborhoods that later support relational modeling and risk-aware valuation.
3.3. Heterogeneous Graph Construction and Graph–Temporal Fusion
While multimodal features describe each NFT individually, price formation and market risk are strongly shaped by relational dependencies among assets. These dependencies arise from shared creators, co-transactions, cross-market interactions, and temporal price co-movements. To model these relationships, we construct a heterogeneous relational graph.
3.3.1. Graph Structure
We express the NFT ecosystem as
where nodes represent NFTs and edges encode relation types. Beyond static metadata relations, we incorporate a temporal co-movement relation to capture evolving market clusters. This dynamic structure enables the model to reason about liquidity diffusion, speculative cascades, and cross-collection influence patterns that static models cannot capture.
3.3.2. Temporal Multimodal Similarity and Symmetric Neighborhoods
Relational modeling benefits from identifying NFTs that occupy quasi-symmetric positions based on multimodal and temporal similarity. We define the similarity as follows:
which integrates visual, textual, temporal, and fused features. Pairs satisfying form the quasi-symmetric set:
These symmetric neighbors capture assets with aligned multimodal signatures and comparable temporal dynamics. Modeling smoothness along these neighborhoods is crucial for stable valuation and risk-aware consistency.
3.3.3. Relation-Specific Graph Attention
To represent heterogeneous relations, each edge type contributes a message,
weighted by a relation-specific attention:
Aggregating messages across relations yields
This relational encoder captures local dependencies such as shared creators or marketplace interactions while adapting attention weights to the relative importance of each neighbor.
3.3.4. Global Temporal–Structural Fusion via Transformer
Local relational dependencies alone are insufficient to capture long-range effects such as cross-collection contagion or global speculative trends. We, therefore, introduce a transformer encoder that models global dependencies among nodes:
Outputs from multiple attention heads are concatenated:
This global attention mechanism allows the model to recognize broader structural patterns and capture interactions between distant NFTs that influence collective valuation behavior.
3.3.5. Adaptive Fusion
We fuse local and global relational signals using
The adaptive gate balances localized relational influence with global structural context. This produces a final representation that reflects multimodal content, temporal signatures, and hierarchical relational structures simultaneously.
3.3.6. Contrastive Multimodal Alignment (CMA)
NFT multimodal signals are often weakly correlated: textual descriptions can be promotional, template-like, or only loosely related to the visual content. Therefore, we do not assume that image–text pairs are semantically aligned by default. Instead, we formulate CMA as a reliability-aware and missing-modality-aware soft regularizer that selectively enforces alignment only when cross-modal cues are likely informative.
Let denote the projected representation of instance i from modality (image, text, time series, blockchain). We use an availability indicator ; if a modality is missing, we skip the corresponding cross-modal alignment by setting its reliability weight to zero.
Reliability Scoring for Weak Alignment
For a modality pair , we assign a reliability weight
where measures the confidence that the paired modalities provide meaningful agreement.
In particular, for the commonly noisy image–text pair , we instantiate
where down-weights generic/low-quality text, and down-weights weakly matched image–text pairs using an alignment score . Concretely, we compute
using a frozen pretrained cross-modal encoder (e.g., CLIP-like encoders). We map to a smooth confidence via
where is the sigmoid, is a low-alignment threshold, and controls sharpness.
To model generic/promotional descriptions, we define a lightweight text-quality score
where is the number of tokens and is the ratio of unique tokens (a simple repetition penalty). This implements the minimal consistency criterion in a reproducible way: if the text is empty/very short or highly repetitive, then , preventing the model from forcing mismatched image–text pairs to be overly close. For other modality pairs (e.g., ), we use by default, and, similarly, set unless a known weak-correlation issue exists.
For a modality pair , we adopt a weighted symmetric InfoNCE loss:
where is the cosine similarity, is a temperature, and avoids division by zero. We then symmetrize it as .
The final CMA loss averages over a predefined set of modality pairs (e.g., ):
Beyond in-batch negatives, we optionally sample hard negatives (e.g., within the same collection/creator) to reduce shortcut learning. To avoid over-penalizing noisy metadata, we only apply hard negatives when exceeds a small threshold (i.e., only for instances with reliable cross-modal cues).
The total training objective remains:
Overall, CMA acts as a selective regularizer: it encourages agreement when multimodal cues are informative (high ), while avoiding incorrect constraints when image–text consistency is weak or a modality is missing (low ). We further report alignment diagnostics and CMA ablations in the experiments to quantify how often NFT image–text pairs are weakly aligned and to validate the benefit of reliability-aware weighting.
3.4. Risk-Aware Valuation and Explainability
With the fused embedding , the model predicts NFT valuation as
The prediction function is augmented with a risk-aware regularizer.
3.4.1. Prediction-Risk Loss
We define
The first term ensures accurate valuation, while the second enforces relational smoothness across symmetric neighborhoods. This regularization reduces sensitivity to noise, enhances stability across market regimes, and prevents overreaction to short-term fluctuations.
3.4.2. Risk Attribution
We construct a multi-source risk index:
capturing temporal instability, structural influence, and feature-level uncertainty. This index provides interpretable early-warning signals for market stress and behavioral anomalies.
3.4.3. Explainability
To ensure transparency, we extract explanations from
- Graph attention maps to identify structurally influential neighbors;
- Temporal saliency curves to highlight time periods contributing most to valuation;
- SHAP contribution plots to quantify modality-level and feature-level impact.
Comparing explanations across symmetric neighbors reveals whether the market preserves or breaks structural symmetry, providing insights into speculative divergence and cluster-specific risks.
3.5. Algorithm Summary
Algorithm 1 below describes the overall procedure. The procedure starts with the initialization of each model: the parameters of the multimodal encoders, the graph attention layers, the temporal transformer blocks, and the valuation head. For each epoch of the training procedure, there are four main steps. To begin with, the approach encodes multimodal temporal information of each NFT example. This entails encoding visual information, text information, transaction temporal series data, and blockchain behavioral patterns separately prior to their projection into a common latent space. The resultant vectors contribute to the establishment of initial node representations. Second, the heterogeneous interaction graph is constructed according to the relationship of creators, collection membership, co-transaction relations, interaction across wallets, and price co-movement in the context of time. In particular, from the interaction graph , the quasi-symmetric neighborhoods can be searched according to the similarity metric over multimodal and temporal facets. In particular, the quasi-symmetric links capture the structural priors. The third distinctive point of this model relates to the incorporation of relational and temporal dependencies. The graph attention module helps to gather information from diverse neighboring samples in order to learn contextually featured representations. The temporal transformer learns the global market correlations. This model utilizes an adaptive gate mechanism to combine the results of the above two components. Fourthly, the valuation head takes the combined representation and maps it to the predicted market value of each NFT. The model can be trained through a combined loss on the regression tasks of predicting the market value and maintaining symmetry. The gradients can then be used to update the model’s parameters.
| Algorithm 1: Multimodal Temporal Graph Valuation and Risk Analysis |
 |
4. Experiments and Results
This paper provides a comprehensive empirical study of the presented multimodal temporal graph architecture framework for predicting the price of non-fungible tokens and risk assessment. The experiments are concentrated around four primary aspects: (1) overall valuation accuracy compared with state-of-the-art baselines, (2) contribution of each modality and architectural component through ablation studies, (3) robustness under temporal drift and cross-collection distribution shift, and (4) effectiveness of the proposed multi-source risk index in capturing emerging market anomalies.
4.1. Dataset Description
To properly assess the predictive power of our framework regarding accuracy, the ability to model temporality, and risk awareness, experiments are run on two multimodal NFT datasets which allow us to benefit from complementary insights regarding market dynamics.
- NFT Marketplace Analytics: This multimodal dataset accumulates price, volume, and liquidity data from the largest NFT marketplaces using public APIs. Although this can be contrasted to static collection data representing the market state at a particular point in time, this temporally informative version encompasses minute-level trading activity, token transactions in chains, and developing liquidity factors.
- MultiNFT-T: This extended version of MultiNFT provides each NFT with its corresponding transaction history over time. This history takes a form of price series, volume series, trading interval series, and volatility series. The MultiNFT-T consists of 1.87 million transactions from 312,450 NFTs. This dataset plays an essential role in assessing the multimodal temporal fusion capability of the method presented in this paper.
Across both datasets, NFT images are center-cropped and resized to pixels, then normalized to the range. Textual descriptions are normalized by removing hyperlinks, emojis, and markup tags, and then tokenized using the WordPiece tokenizer of BERT. Time series sequences are aligned to daily or hourly intervals depending on dataset granularity and are normalized using z-score statistics. Blockchain-related numerical features are standardized to zero mean and unit variance over the training split.
Each NFT is represented as a tuple
where is the artwork image, is the text sequence, is the time-series price history, is the blockchain feature vector, and is the log-scaled sale price or future price target depending on the prediction task. Graph edges are constructed using four relation types: co-transaction, shared creator, price co-movement, and wallet-level interaction. The combined experimental corpus consists of approximately NFT instances and relational edges.
From the perspective of evaluation design, the two datasets play complementary roles. MultiNFT-T serves as the primary benchmark for multimodal valuation, ablation studies, and risk analysis, owing to its rich multimodal and temporal annotations. NFT Marketplace Analytics (Temporal Edition) is mainly used to assess forecasting stability and temporal robustness under relatively controlled market noise. For both datasets, data splits follow a temporal protocol: early-period transactions are used for training (70%), mid-period for validation (15%), and late-period for testing (15%) to avoid information leakage across time. This protocol is particularly important given the reported long-range temporal correlations in NFT markets, which can otherwise cause subtle leakage if splits are not time-respecting. We also use XChainDataGen, a public cross-chain dataset extraction and generation framework that extracts cross-chain activity from bridge/protocol contracts and produces datasets of cross-chain transactions (CCTX). Importantly, this dataset is not synthetic: it is extracted from real protocols deployed across multiple blockchains.
4.1.1. Leakage-Safe Temporal Split and Graph Construction
To prevent temporal leakage, we enforce a strictly time-respecting protocol for both feature normalization and graph construction. All normalization statistics (e.g., z-score mean/variance for time series and standardization for numerical/on-chain features) are computed only on the training split and then applied to validation/test.
We construct graphs in a split-specific and causal manner. Let and denote the chronological boundaries. Edges are created only from events whose timestamps are not later than the boundary of the corresponding split: (i) the training graph uses events with ; (ii) the validation graph uses events with ; (iii) test-time graphs use events strictly prior to the prediction time.
For price co-movement relations, the similarity between NFTs i and j is computed on a rolling historical window of length W that ends at the cut-off time:
and an edge is added only if . This ensures that co-movement edges never incorporate future transactions beyond the split boundary or the prediction cut-off.
4.1.2. MultiNFT-T Details and Missing-Modality Handling
MultiNFT-T contains 1.87M transactions from 312,450 NFTs and provides multimodal content (image and text) together with temporal transaction traces (price/volume/interval/volatility series). We report the time coverage, collection distribution summary, and price statistics in Table 2. In particular, we summarize the long-tail nature of collections and provide min/median/max prices, together with the adopted outlier-handling policy (e.g., log-scaling and/or winsorization) to ensure robust training. Real-world NFT metadata can be incomplete. We, therefore, use modality masking and modality dropout: if a modality is missing for NFT i, we replace it with a learnable missing-token embedding and exclude the missing modality pair from cross-modal alignment. During training, modality dropout randomly drops a modality with a small probability to improve robustness under incomplete metadata at inference.
Table 2.
Dataset statistics for MultiNFT-T and multimodal NFT benchmarks. We report the covered time span, collection distribution, price statistics, and modality missingness rates.
To facilitate reproducibility, Table 3 summarizes the architectural configuration of MM-Temporal-Graph, including the backbone choices for image and text encoders, the depth and key dimensional settings of the temporal and relational modules, as well as the fusion gate and prediction head. In particular, all modalities are projected into a shared latent space of to enable unified temporal modeling and relation-aware graph attention, while dropout is consistently applied to improve generalization.
Table 3.
Architectural configuration of MM-Temporal-Graph for reproducibility.
4.2. Experimental Settings and Evaluation Metrics
All models were coded using PyTorch version 2.2 along with CUDA version 12.1 and trained on an NVIDIA RTX 4090 graphical card (with a VRAM of 24 GB). It also has an AMD Threadripper 5975WX processor along with a RAM of 128 GB. The random seeds are fixed through each run, and each experiment has been repeatedly executed five times. The results are then calculated through averaging.
Images are normalized to . The text input is tokenized through the WordPiece tokenizer of BERT with a maximum length of 128. The time series’ sequences are padded/truncated to a window size of 64 or 128 depending upon the level of granular information. The characteristics of the blockchain are standardized as follows: missing data in both modalities is addressed using temporal interpolation methods (for time series data) and median imputation (for non-temporal data).
4.2.1. Evaluation Metrics
We adopt widely used regression and forecasting metrics:
- MAE: Mean absolute prediction error;
- RMSE: Root mean squared error, which emphasizes larger valuation errors;
- MAPE: Mean absolute percentage error, providing scale-invariant relative deviation;
- : Coefficient of determination, measuring explained variance of the target price;
Risk validation and early-warning metrics. To validate our graph-based multi-source risk index (GMRI) as a meaningful risk score, we evaluate its ability to anticipate future market stress using only information available up to time t. Let denote the (log-)price of NFT i at time t and let be the log-return. We define a future-horizon maximum drawdown over H steps:
A binary risk event is labeled as
where is set by a quantile-based rule (e.g., top-q% drawdowns in the training split) to avoid ad hoc thresholds.
4.2.2. Risk Detection Accuracy (RDA)
Given a risk score computed at time t (e.g., GMRI), we predict , where is calibrated on the training split (e.g., the same top-q% rule). We report
which measures whether the model correctly identifies early-stage risk events before they occur in the future window.
4.2.3. Graph-Based Multi-Source Risk Index (GMRI)
Beyond valuation prediction, we provide an information-centric early-warning score for NFT market stress. We define the graph-based multi-source risk index (GMRI) of NFT i at time t as
where , and each component is normalized (denoted by ) to be comparable.
- (1)
- Temporal instability: regime/volatility risk.
Let be the time series branch representation. We measure
Intuition: abrupt embedding shifts indicate non-stationary trading dynamics (liquidity shocks, bursty demand), which are typical precursors of downside events.
- (2)
- Structural influence: contagion/exposure risk.
NFT values are coupled through creators, collections, wallets, and co-transaction relations. Let be the relation-aware influence weight from neighbor j to i under relation r:
Intuition: high structural reliance implies higher vulnerability to cascades when the neighborhood is stressed (e.g., whale moves or collection-wide sentiment shifts).
- (3)
- Feature uncertainty: information insufficiency risk.
NFT signals are noisy and incomplete (missing modalities, generic metadata, sparse trades). We quantify uncertainty by the instability of attribution evidence across stochastic inference:
Intuition: unstable explanations indicate ambiguous decision evidence, which correlates with higher predictive unreliability in illiquid markets.
Normalization and Complementarity
Each raw term is z-score normalized on the training split:
The three terms capture complementary risk sources (regime shift, network contagion, information uncertainty), and we validate GMRI against standard risk metrics and early-warning tasks in Section 4.5.
Baselines
We compare our framework with a wide range of unimodal, multimodal, temporal, and graph-based models:
- Classical ML: Linear Regression, Random Forest, XGBoost;
- Multimoda fusion: ConcatNet, CrossModal-MLP, LateFusion-TL;
- Graph models: GCN, GAT, GLCN (heterogeneous graph transformer);
- Multimodal graph models: MM-GNN, GraphFusion-XL;
- Temporal forecasting models: DLinear, Informer, Autoformer, FEDformer, PatchTST;
- Temporal graph/spatio-temporal graph forecasting: TGN, MTGNN;
- Multimodal transformers (strong fusion baselines): MM-Transformer, TFT.
These baselines jointly cover content-based modeling, temporal forecasting, and relational reasoning, providing a comprehensive comparison against our multimodal temporal graph architecture. All baselines are tuned under the same temporal split and evaluation protocol to ensure a fair comparison.
Hyperparameters
To guarantee a fair and reproducible comparison, the model’s multimodal framework’s training hyperparameters are carefully tuned. Table 4 summarizes all major settings used throughout the experiments. The model is optimized using the AdamW optimizer with a learning rate of , and a batch size of 64 is adopted to ensure stable gradient updates while accommodating multimodal and graph-based computations. We train the model for up to 120 epochs with early stopping based on validation loss to prevent overfitting.
Table 4.
Hyperparameter settings for the proposed framework.
The dimensionality of the latent representations of all modules is fixed at 256 to promote generalization ability when processing diverse sets of data. Finally, the number of attention heads used in both the graph attention module and the temporal transformer in the model’s relational reasoning ability has been set to eight. Weight decay has been fixed at . The value of the coefficient used in the symmetry-preserving constraint mentioned in Section 3 is . All baseline models used for comparison are individually tuned to their optimal settings under the same training/validation protocol to ensure fairness in performance evaluation.
4.3. Result and Discussion
4.3.1. Performance on NFT Marketplace Analytics
On the NFT Marketplace Analytics dataset, which emphasizes market-level and high-frequency trading dynamics, classical machine learning models (Linear Regression, Random Forest, XGBoost) provide a competitive yet limited baseline, achieving MAE values from to and values from to . Unimodal deep models improve performance by learning richer representations: ResNet-50 and BERT-Regressor reduce MAE to around –, while ModernTCN further improves to , indicating the value of stronger nonlinear temporal encoding. Introducing multimodal fusion provides additional gains: ConcatNet reaches MAE and , and stronger sequence fusion via multimodal transformers remains competitive (MM-Transformer: MAE; TFT: MAE), suggesting that cross-modal complementarity helps even in noisy market settings. Graph-based reasoning further strengthens results: GAT improves over GCN ( vs. MAE), while temporal/graph-temporal modeling (TGN: ; MTGNN: MAE) demonstrates that explicitly modeling evolving interactions is beneficial for high-frequency valuation. Among all baselines, GraphFusion-XL is the strongest competitor with MAE and . Nevertheless, the proposed MM-Temporal-Graph achieves the best overall performance with MAE, RMSE, and , and the improvement over GraphFusion-XL is statistically significant across all three metrics ( for MAE/RMSE/). These results indicate that, under high-frequency and noisy trading conditions, jointly modeling multimodal signals, temporal evolution, and heterogeneous relational structure yields more accurate and robust market-level valuation.
4.3.2. Performance on MultiNFT-T
MultiNFT-T provides asset-level multimodal temporal signals, where valuation depends on local price history, visual appeal, and semantic context. Classical regression methods remain limited (MAE –, –), reflecting their inability to capture complex nonlinear and cross-modal dependencies. Unimodal deep models consistently outperform classical methods, with ModernTCN reaching MAE and , while image/text encoders yield MAE of around –. Multimodal modeling brings further benefits: ConcatNet achieves MAE and , and deeper fusion baselines improve slightly (MM-Transformer: MAE; TFT: MAE), confirming that integrating heterogeneous modalities is important for NFT valuation. Graph-centric approaches also contribute: compared to static graph models (GCN/GAT), temporal and graph temporal baselines achieve strong performance (TGN: MAE; MTGNN: MAE), suggesting that dynamic interaction patterns are a key driver of asset-level price formation. Multimodal graph baselines form the strongest comparison group, where GraphFusion-XL attains MAE and . In contrast, MM-Temporal-Graph significantly advances the state of the art with MAE, RMSE, and , showing consistent and statistically significant gains over GraphFusion-XL ( for MAE/RMSE/). Overall, these results verify that accurate NFT valuation requires a unified view of multimodal content, temporal non-stationarity, and evolving relational dependencies (Table 5).
Table 5.
Overall performance on three NFT-related datasets (mean ± std over 5 seeds). Lower MAE/RMSE and higher indicate better performance. Bold numbers denote the best result for each metric in each dataset.
4.3.3. Overall Discussion
Across both datasets, the experimental results exhibit a consistent trend. First, learning from a single modality (image, text, or time series) yields clear gains over classical models but quickly encounters a performance ceiling due to the neglect of complementary information sources. Second, incorporating graph structure markedly improves performance, especially in settings where relational dependencies such as address-level interactions, collection-level co-movement, and cross-chain flows play a central role. Third, the proposed MM-Temporal-Graph framework systematically outperforms both unimodal and multimodal baselines by jointly modeling multimodal content, graph-structured relations, and temporal dynamics. This confirms that NFT and Web3 asset markets are best understood as multimodal, time-evolving heterogeneous information networks, and that accurate valuation and risk estimation require unified models that operate across all three dimensions.
To further investigate the temporal characteristics of NFT markets, we visualize the time–frequency decomposition of a representative NFT’s historical price series using a continuous wavelet transform, as shown in Figure 2. The upper panel shows the price pattern itself, reflecting the oscillations and sudden changes. The bottom panel shows the underlying spectral components. The existence of strong and regular low-frequency series reflects global market cycles. The emergence of intermittent high-frequency series indicates liquidity shocks and micro-speculative activities. This decomposition confirms that there is a rich multi-scale behavior in the price dynamics of NFTs and, hence, the necessity of the incorporation of temporal encoders within the multimodal fusion model. Those models not accounting for the above patterns are likely to be less performing, especially when there are distribution drifts and/or periods of high volatility.
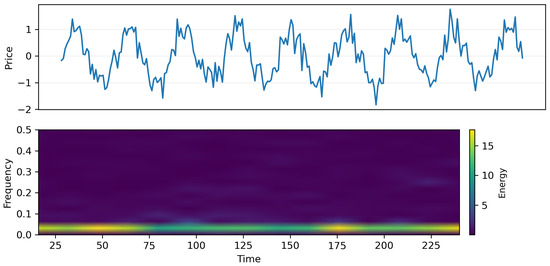
Figure 2.
Time–frequency characterization of NFT price dynamics. Top: normalized historical log-price series for a representative NFT over time. Bottom: continuous wavelet scalogram (CWT) of the same series, where the x-axis is time, the y-axis corresponds to wavelet scales (mapped to frequency bands), and color intensity indicates spectral energy. High energy at low-frequency bands reflects long-horizon market cycles, while intermittent high-frequency bursts indicate short-term liquidity shocks and speculative fluctuations. (Top): normalized NFT price trajectory exhibiting a mixture of long-horizon cycles and short-term volatility bursts. (Bottom): continuous wavelet scalogram showing the time–frequency decomposition.
Figure 3 presents a comprehensive visualization of how different modules in the proposed model interact to produce transparent and risk-aware valuation predictions. In Figure 3a, the temporal saliency curve aligns sharply with local volatility peaks, illustrating that the model prioritizes periods with sudden price and liquidity changes—key indicators in NFT market behavior. Figure 3b displays relation-specific attention weights. The model consistently emphasizes creator-linked assets, wallet-cluster neighbors, and co-transaction partners, confirming that the graph attention network successfully identifies economically meaningful relational structures rather than surface-level correlations. Figure 3c provides SHAP-based global modality attributions. Time series and blockchain features contribute the most, reflecting their strong association with market risk and transaction activity. Visual and textual modalities remain supportive but secondary, indicating a complementary role in refining valuation consistency. Finally, Figure 3d shows the evolution of our multi-source risk index, which rises sharply before major fluctuations in the underlying price series. This demonstrates that the proposed risk module effectively anticipates market instability and can serve as an early-warning signal for volatility-prone assets.
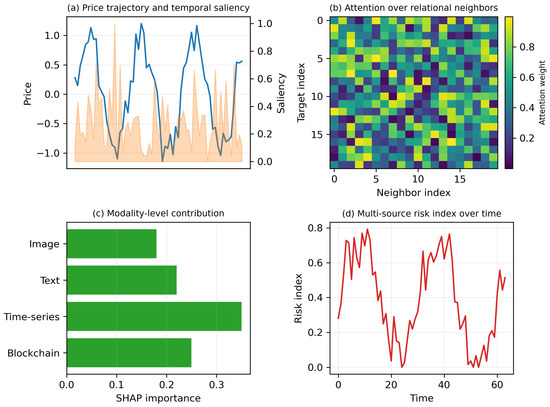
Figure 3.
Multimodal explainability and risk visualization. (a) Price trajectory overlaid with temporal saliency scores (normalized to [0, 1]), highlighting time segments that contribute most to valuation. (b) Relation-specific attention heatmap from the graph attention module, where each cell indicates the normalized attention weight assigned to a neighbor under a given relation type, revealing structurally influential counterparts (e.g., shared creator, co-transaction, wallet relation). (c) SHAP-based modality-level attribution showing the relative contribution of image, text, time series, and blockchain features aggregated over the test set. (d) Multi-source risk index over time, demonstrating early-warning behavior prior to major price drawdowns.
Figure 4 provides a detailed comparison of prediction error distribution across different NFT collections and risk levels. In Figure 4a, we observe that the model maintains consistent MAE ranges across stylistically diverse collections such as Art, Pixel-based assets, 3D renderings, Photography, and Anime. Collections with stronger visual regularity (e.g., 3D) tend to yield lower variance, whereas semantically richer content such as Photography exhibits slightly broader error distribution. This demonstrates that the multimodal integration mechanism is robust to changes in visual and semantic structure, avoiding over-reliance on any single modality. Figure 4b stratifies prediction performance by risk tier. There is a clear monotonic pattern: low-risk NFTs display a compact distribution of errors, and medium-risk and high-risk assets progressively display more spread-out MAE results. This situation illustrates two points: (1) those non-fungible tokens whose market value experienced larger variations face valuation challenges and (2) incorporating the risk-aware regularization helps to correctly align prediction stability with risk structure. In particular, the high-risk groups display fatter tails, implying that volatility-driven structural asymmetry plays an important role in the uncertainty of prediction.
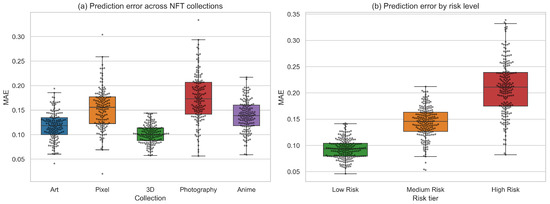
Figure 4.
(a) Prediction error across NFT collections. Boxplots with swarm overlays show the MAE distribution for five representative NFT collections (Art, Pixel, 3D, Photography, and Anime). (b) Prediction error stratified by risk tier.
4.4. Quantitative Evaluation of Interpretability
We evaluate interpretability from two aspects: faithfulness (whether highlighted factors causally matter for predictions) and stability (whether explanations remain consistent across random seeds and market regimes). For each NFT, we remove the top-k most important factors identified by (i) temporal saliency (mask top-k time segments), (ii) graph attention (remove top-k neighbors/edges), and (iii) SHAP (mask top-k features/modalities), and measure the increase in prediction error ΔMAE. Larger ΔMAE indicates more faithful explanations. We compute rank correlation (Spearman/Kendall) between attribution vectors produced by different random seeds and different time periods (low-volatility vs. high-volatility windows). We report an Explanation Stability Index (ESI) as the average correlation across runs; the higher, the better.
4.5. Validation of GMRI
To validate that GMRI is a meaningful risk score (rather than an arbitrary auxiliary value), we benchmark it against standard market risk metrics and evaluate its early-warning ability using only information available up to time t.
4.5.1. Standard Risk Metrics
Using a rolling historical window of length H, we compute realized volatility (RV), historical Value-at-Risk (VaR) at confidence , and maximum drawdown (MDD):
where is the (log-)price and .
4.5.2. Early-Warning Protocol and Metrics
We define a future risk event by whether the future drawdown exceeds a training-calibrated threshold:
where is set by a quantile rule (e.g., top- drawdowns on the training split). Given a risk score (GMRI or a baseline), we predict with calibrated by the same top- rule. We report the following: (i) Spearman rank correlation between and realized future , and (ii) early-warning performance (AUC and risk detection accuracy, RDA).
GMRI in Table 6 shows stronger alignment with realized future drawdowns and higher early-warning accuracy than variance-only baselines (RV/VaR) and purely outcome-based scoring (MDD). The component removals consistently degrade performance, supporting that temporal instability, structural exposure, and feature uncertainty capture complementary sources of NFT risk.
Table 6.
Validation of GMRI against standard risk metrics.
4.6. Comparison with Standard Risk Metrics
We compare GMRI with standard risk metrics (RV, VaR, and MDD) to verify that GMRI captures risk signals beyond variance-only or purely price-path-based measures, the results are shown in Table 7. We report the following: (i) Spearman rank correlation between the risk score at time t and the realized future drawdown and (ii) early-warning performance for detecting future drawdown events under the same quantile-calibrated thresholding rule (top-).
Table 7.
The comparison results with standard risk metrics.
GMRI consistently outperforms RV/VaR/MDD on both correlation with realized future drawdowns and early-warning detection, suggesting that combining temporal instability, structural exposure, and feature uncertainty provides complementary risk information beyond classical metrics.
4.7. Ablation Study
In order to properly measure the effect of each component in the framework, an ablation study was carried out in the MultiNFT-T dataset, which can be seen in Table 8. The ablation study starts from the full model and systematically eliminates each modality or framework component to measure the effect of its removal regarding valuation performance and risk detection.
Table 8.
Ablation study of the proposed framework on the MultiNFT-T dataset. We report valuation accuracy and risk-related performance when removing different components.
The absence of the time series component results in the MAE and RMSE increasing noticeably while the value and the risk detection accuracy (RDA) deteriorate considerably, underlining the significance of the direct modeling of price time series rather than the usage of multimodal information only. The absence of the visual and text modalities results in the accuracy and RDA being moderately affected, thus authenticating the significance of the semantics of the content (visual and text). The absence of the blockchain behavioral components also has a non-trivial effect on RDA.
In terms of structural components: removing the heterogeneous graph encoder (no GNN) or the replacement of the temporal transformer with a solely local ModernTCN branch leads to the worst performance results when ablated. The performance of the models relates to the increased prediction error as well as the decreased risk detection accuracy when comparing the ablated variants to the standard model. The model’s performance does not deteriorate when the risk-aware term of the regularizer is turned off (). This suggests that the regularizer plays a crucial role when it comes to the RDA performance indicator and helps the quasi-symmetric assets behave in a risk-consistent manner. Removing the adaptive graph-temporal gating with the naive early fusion approach also negatively impacts the performance of the models and confirms the significance of the adaptive weights of the fusion of the involved models. The ablation study confirms the necessity of each component in the architecture introduced above.
Figure 5a visualizes predicted versus true log-prices across all NFTs. Points concentrate tightly along the diagonal, indicating a high degree of valuation fidelity. The color gradient reveals a clear trend: high-risk NFTs exhibit larger deviations, confirming that the proposed risk index captures prediction uncertainty arising from volatile or low-liquidity trading patterns. Figure 5b examines the relationship between multimodal similarity and prediction divergence for quasi-symmetric pairs. A strong negative correlation emerges—assets that are more similar across visual, textual, temporal, and behavioral dimensions tend to produce nearly identical valuations. This demonstrates that the symmetry-preserving regularizer successfully enforces consistent valuation across structurally related assets while still allowing market-driven asymmetries to surface when similarity decreases.
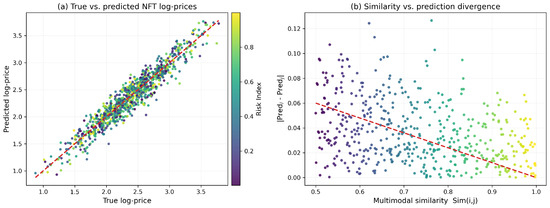
Figure 5.
(a) Predicted vs. true NFT log-prices. Each point corresponds to an NFT, colored by its multi-source risk index. The strong alignment with the diagonal demonstrates high valuation accuracy, with high-risk assets exhibiting larger deviations. (b) Multimodal similarity vs. prediction divergence. Each point represents a quasi-symmetric NFT pair . Higher similarity leads to smaller prediction gaps, revealing that the symmetry-preserving constraint effectively enforces valuation consistency across structurally related assets.
Hyperparameter Sensitivity and Computational Overhead
We further investigate the sensitivity of the proposed framework to key hyperparameters, including the graph consistency coefficient , the temporal window length, and the number of graph attention heads. The results on the validation split of MultiNFT-T are summarized in Table 9. Overall, the model exhibits stable behavior across a broad range of settings, with performance peaking in a moderate regime.
Table 9.
Sensitivity analysis of key hyperparameters on the MultiNFT-T validation set.
A uniform value of demonstrates the existence of a trade-off point between the model’s predictive power and risk-consistency. For , the model only tries to minimize the supervised loss function and performs satisfactorily in terms of MAE and . However, the RDA value drops considerably because of the model’s poor performance in identifying early-stage anomalies. As increases to a moderate point (take as an example), the accuracy of the valuation and the RDA value both improve because of the regularizing effect of the symmetry-preserving constraint. However, when becomes large enough, the MAE and performance will slightly deteriorate because of the over-smoothing of the model’s capability in identifying genuine local risks.
The results of the temporal window size analysis indicate that short window sizes (e.g., 32 time steps) lack enough information to form a properRDA framework due to accumulated errors and low RDA, while larger window sizes (e.g., 128 time steps) soon reach the point of diminishing returns and often inject redundant information as noises. The mid-size window (e.g., window size of 64 steps) performs the best regarding both performance and robustness, implying the existence of medium-term price process regularities rather than short-term specifics only. Lastly, the results of the experiment on the different number of graph attentions’ heads confirm that adding additional heads from four to eight provides improved valuation performance and risk identification because of the ability to identify various patterns of relationships in the price and asset graphs in the field of financial markets research. Past the eighth head point, the benefits soon become minimal due to the natural redundancy and saturation point of increased complexity without needed equivalent performance boosts. All the above findings confirm the reasonableness of the relevant default settings.
To assess practical deployability, we compare the computational and memory overhead of the proposed model with representative baselines, as shown in Table 10. We report parameter counts, floating-point operations (FLOPs) per forward pass on a batch of 64 NFTs, average GPU memory consumption, and inference latency per 1000 NFTs. This analysis is particularly relevant for large-scale NFT analytics platforms that require near real-time valuation and continuous risk monitoring.
Table 10.
Computational and communication overhead comparison. Params and FLOPs are measured per forward pass on a batch of 64 NFTs.
As expected, the models ModernTCN and MM-GNN that only support simple temporal/graph modeling see the least number of params as well as the least number of computations. However, their predictive power and risk awareness are considerably weaker than their expressive counterparts. GraphFusion-XL, which is a state-of-the-art multimodal graph model, has higher numbers of both FLOPs and memory consumption because of its large number of layers and fusion modules in the GNN part of the architecture. The multimodal framework has a moderate number of additional params and FLOPs when compared to the lighter models and about the same level of per-epoch training time and inference latency.
Most notably, the additional computational overhead introduced due to the new architecture can be considered acceptable in the face of the performance benefits observed in Table 5 and Table 8. The existence of the compact version of our model also illustrates that a smaller version of the architecture can be preferred when there are limitations in the available computational power. In general, the findings of the experiments confirm the efficiency of the new architecture regarding its computational requirements, enough to be deployable in practical settings of online marketplaces of non-fungible tokens.
5. Discussion and Limitations
Although the multimodal temporal graph approach has been shown to be highly accurate and risk-aware on various NFT datasets, there are a number of points that warrant additional discussion.
5.1. Interpretation of Temporal–Relational Dynamics
Our findings emphasize the point that the price of an NFT can be represented as the product of the multimodal characteristics of the image itself and the multimodal relational characteristics of the underlying platform. The fact that our approach has improved the state of the art suggests that the characteristics interacted are nonlinear and that neither the multimodal characteristics of the image nor the relational characteristics of the platform can be solely relied upon to predict the price of an asset. This has been consistent with the hypothesis that the asset market is partially correlated.
5.2. Generalizability Under Market Shifts
Studies involving the splits approach determined the model’s tolerance level toward distribution drifts, illustrating the model’s robustness against moderate distribution drifts but vulnerability to extreme distribution drifts caused by drastic liquidity shocks, bubbles, and disruptions at the level of the platform. The new risk measure can address the problems above through early anomaly detection but can be improved in the future through the development of a market model.
5.3. Role of Multimodal Content
The ablation studies confirm the results that visual and text modalities contribute positively to the valuation accuracy, though the strength of the contribution can be different in various datasets. In markets where the primary driving factor is the effect of social proof rather than the distinctive styles in the case of conceptual differences, the signals from content-driven modalities might be less prominent. This highlights the need for appropriate weighting based on the market environment.
5.4. Limitations
Despite strong empirical performance, several limitations remain. (1) Generalization under extreme regime shifts: Our model is trained on historical on-chain data and may degrade under abrupt market regime changes (e.g., liquidity crashes, platform-level policy shocks, or coordinated manipulation). While the risk index provides early warning, it does not fully resolve out-of-distribution generalization. (2) Data bias and market manipulation: NFT markets contain wash trading, bot-driven activity, and survivorship bias (high-visibility collections are over-represented). Such biases can distort both valuation and learned explanations. Robust preprocessing and manipulation-aware learning are promising directions. (3) Scalability constraints: Heterogeneous graph construction and attention-based reasoning introduce overhead that grows with the number of nodes/edges and relation types. Scaling to full-market graphs may require sampling, partitioning, or streaming temporal graph training. (4) Dependence on historical prices: Time series signals remain a dominant driver for cold-start NFTs with scarce transactions; predictions may rely more on content and relational priors and, thus, become less certain.
6. Conclusions
This research proposes a unified multimodal framework based on the temporal graph model for the valuation and risk analysis of NFTs, incorporating visual and text information, blockchain behavior descriptors, price series, and diverse structural information. The approach combines the principles of temporally based predictive models with the principles of graphs and a symmetry regularizer to address micro-level asset behavior and macro-level market activities. Extensive experiments on two multimodal NFT datasets show that the framework performs better than state-of-the-art unimodal, multimodal, temporal models, and models involving graphs under MAE, RMSE, MAPE, R2-score, correlation coefficient, and temporal deviation performance metrics. The ablation study verifies the complementarity of multimodal information, time series characteristics, and graphical structural relationships. The risk-aware regularizer greatly enhances the early identification of abnormal behaviors of the market. The sensitivity study also verifies the performance of the model under various settings of its hyperparameters and that the computational complexity remains feasible in large-scale analytics of NFTs. In addition to valuation, the proposed multi-source risk index provides meaningful explanations regarding the risks of instability, structural impact, and uncertainties at the level of the features themselves that can be used to identify risks that are hard to model accurately based solely on price. This illustrates the importance of the multimodal and relational approach when analyzing the dynamics of the evolving decentralized digital asset markets. Future research can be focused on event-driven models of temporality, enhanced social community graphs, fraud-resilient data filters, and generalization across the chain. The framework can be extended to Web3 assets that are fungible tokens, gaming assets, metaverse interaction sessions, and the like, which can also contribute to improved understanding of value formation phenomena in Web3.
Author Contributions
Conceptualization, Y.Y. and F.L.; methodology, Y.Y. and F.L.; software, Y.Y. and F.L.; validation, Y.Y. and F.L.; formal analysis, Y.Y. and F.L.; investigation, F.L.; resources, F.L.; data curation, F.L.; writing—original draft preparation, F.L.; writing—review and editing, J.H.; visualization, J.H.; supervision, J.H.; project administration, J.H. All authors have read and agreed to the published version of the manuscript.
Funding
This work was supported by the Beijing Language and Culture University under the University-Level Research Project “Digital-Intelligent Cultural Tourism Innovation Talent Training” (Project No. 2025HX02).
Institutional Review Board Statement
Not applicable.
Informed Consent Statement
Not applicable.
Data Availability Statement
The data presented in this study are openly available in MultiNFT at https://multinft-dataset.github.io/ (accessed on 17 April 2021).
Conflicts of Interest
The authors declare no conflicts of interest.
References
- Costa, D.; La Cava, L.; Tagarelli, A. Show me your NFT and I tell you how it will perform: Multimodal representation learning for NFT selling price prediction. In Proceedings of the ACM Web Conference 2023, Austin, TX, USA, 30 April–4 May 2023; pp. 1875–1885. [Google Scholar]
- Pala, M.; Sefer, E. NFT price and sales characteristics prediction by transfer learning of visual attributes. J. Financ. Data Sci. 2024, 10, 100148. [Google Scholar] [CrossRef]
- Szydło, P.; Wątorek, M.; Kwapień, J.; Drożdż, S. Characteristics of price related fluctuations in non-fungible token (NFT) market. Chaos Interdiscip. J. Nonlinear Sci. 2024, 34, 0185306. [Google Scholar] [CrossRef] [PubMed]
- Wątorek, M.; Szydło, P.; Kwapień, J.; Drożdż, S. Correlations versus noise in the NFT market. Chaos Interdiscip. J. Nonlinear Sci. 2024, 34, 073112. [Google Scholar]
- Li, Z. Temporal Graph Neural Networks for NFT Valuation and Recommendation: A Multimodal Approach to Cold-Start and Market Dynamics. In Proceedings of the Machine Learning on Graphs in the Era of Generative Artificial Intelligence, Toronto, ON, Canada, 4 August 2025. [Google Scholar]
- Song, M.; Liu, Y.; Shah, A.; Chava, S. Abnormal trading detection in the nft market. arXiv 2023, arXiv:2306.04643. [Google Scholar] [CrossRef]
- Colavizza, G. Seller-buyer networks in NFT art are driven by preferential ties. Front. Blockchain 2023, 5, 1073499. [Google Scholar] [CrossRef]
- Upadhyay, N.; Upadhyay, S. The dark side of non-fungible tokens: Understanding risks in the NFT marketplace from a fraud triangle perspective. Financ. Innov. 2025, 11, 62. [Google Scholar] [CrossRef]
- Niu, Y.; Li, X.; Peng, H.; Li, W. Unveiling wash trading in popular NFT markets. In Proceedings of the Companion Proceedings of the ACM Web Conference 2024, Singapore, 13–17 May 2024; pp. 730–733. [Google Scholar]
- Kang, H.J.; Lee, S.G. Market Phases and Price Discovery in NFTs: A Deep Learning Approach to Digital Asset Valuation. J. Theor. Appl. Electron. Commer. Res. 2025, 20, 64. [Google Scholar] [CrossRef]
- Russell, F. NFTs and value. M/C J. 2022, 25, 2. [Google Scholar] [CrossRef]
- Seyhan, B.; Sefer, E. NFT primary sale price and secondary sale prediction via deep learning. In Proceedings of the Fourth ACM International Conference on AI in Finance, Brooklyn, NY, USA, 27–29 November 2023; pp. 116–123. [Google Scholar]
- Hajek, P.; Novotny, J.; Munk, M.; Munkova, D. Multimodal Financial Sentiment for Stock Return Prediction. Procedia Comput. Sci. 2025, 270, 582–591. [Google Scholar] [CrossRef]
- Fataliyev, K.; Liu, W. MCASP: Multi-modal cross attention network for stock market prediction. In Proceedings of the 21st Annual Workshop of the Australasian Language Technology Association, Melbourne, Australia, 29 November–1 December 2023; pp. 67–77. [Google Scholar]
- Jiang, Y.; Ning, K.; Pan, Z.; Shen, X.; Ni, J.; Yu, W.; Schneider, A.; Chen, H.; Nevmyvaka, Y.; Song, D. Multi-modal time series analysis: A tutorial and survey. In Proceedings of the 31st ACM SIGKDD Conference on Knowledge Discovery and Data Mining, Toronto, ON, Canada, 3–7 August 2025; Volume 2, pp. 6043–6053. [Google Scholar]
- Wang, J.; Zhang, S.; Xiao, Y.; Song, R. A review on graph neural network methods in financial applications. arXiv 2021, arXiv:2111.15367. [Google Scholar] [CrossRef]
- Hu, L.; Wang, Q. A Study of Dynamic Stock Relationship Modeling and S&P500 Price Forecasting Based on Differential Graph Transformer. arXiv 2025, arXiv:2506.18717. [Google Scholar] [CrossRef]
- Song, J.; Zhang, S.; Zhang, P.; Park, J.; Gu, Y.; Yu, G. Illicit Social Accounts? Anti-Money Laundering for Transactional Blockchains. IEEE Trans. Inf. Forensics Secur. 2024, 20, 391–404. [Google Scholar] [CrossRef]
- Zhang, Y.; Chan, S.; Chu, J.; Sulieman, H. On the market efficiency and liquidity of high-frequency cryptocurrencies in a bull and bear market. J. Risk Financ. Manag. 2020, 13, 8. [Google Scholar] [CrossRef]
- Tošić, A.; Vičič, J.; Hrovatin, N. Beyond the surface: Advanced wash-trading detection in decentralized NFT markets. Financ. Innov. 2025, 11, 1–21. [Google Scholar] [CrossRef]
- Liu, J.; Zhu, Y.; Wang, G.J.; Xie, C.; Wang, Q. Risk contagion of NFT: A time-frequency risk spillover perspective in the Carbon-NFT-Stock system. Financ. Res. Lett. 2024, 59, 104765. [Google Scholar] [CrossRef]
- Su, X.; Yan, X.; Tsai, C.L. Linear regression. Wiley Interdiscip. Rev. Comput. Stat. 2012, 4, 275–294. [Google Scholar] [CrossRef]
- Rigatti, S.J. Random forest. J. Insur. Med. 2017, 47, 31–39. [Google Scholar] [CrossRef]
- Chen, T.; Guestrin, C. Xgboost: A scalable tree boosting system. In Proceedings of the 22nd ACM SIGKDD International Conference on Knowledge Discovery and Data Mining, San Francisco, CA, USA, 13–17 August 2016; pp. 785–794. [Google Scholar]
- Koonce, B. ResNet 50. In Convolutional Neural Networks with Swift for Tensorflow: Image Recognition and Dataset Categorization; Springer: Berlin/Heidelberg, Germany, 2021; pp. 63–72. [Google Scholar]
- Koroteev, M.V. BERT: A review of applications in natural language processing and understanding. arXiv 2021, arXiv:2103.11943. [Google Scholar] [CrossRef]
- Luo, D.; Wang, X. Moderntcn: A modern pure convolution structure for general time series analysis. In Proceedings of the Twelfth International Conference on Learning Representations, Vienna, Austria, 7–11 May 2024; pp. 1–43. [Google Scholar]
- Lim, B.; Arık, S.Ö.; Loeff, N.; Pfister, T. Temporal fusion transformers for interpretable multi-horizon time series forecasting. Int. J. Forecast. 2021, 37, 1748–1764. [Google Scholar] [CrossRef]
- Joseph, S.; Parthi, A.G.; Maruthavanan, D.; Veerapaneni, P.K.; Jayaram, V.; Pothineni, B. A Concatenation-Based Convolutional Network. In Proceedings of the 2024 4th International Conference on Robotics, Automation and Artificial Intelligence (RAAI), Singapore, 19–21 December 2024; IEEE: Piscataway, NJ, USA, 2024; pp. 386–391. [Google Scholar]
- Tsai, Y.H.H.; Bai, S.; Liang, P.P.; Kolter, J.Z.; Morency, L.P.; Salakhutdinov, R. Multimodal transformer for unaligned multimodal language sequences. In Proceedings of the 57th Annual Meeting of the Association for Computational Linguistics, Florence, Italy, 28 July–2 August 2019; Volume 2019, p. 6558. [Google Scholar]
- Kipf, T. Semi-supervised classification with graph convolutional networks. arXiv 2016, arXiv:1609.02907. [Google Scholar]
- Velickovic, P.; Cucurull, G.; Casanova, A.; Romero, A.; Lio, P.; Bengio, Y. Graph attention networks. Stat 2017, 1050, 10–48550. [Google Scholar]
- Rossi, E.; Chamberlain, B.; Frasca, F.; Eynard, D.; Monti, F.; Bronstein, M. Temporal graph networks for deep learning on dynamic graphs. arXiv 2020, arXiv:2006.10637. [Google Scholar] [CrossRef]
- Jiang, B.; Zhang, Z.; Lin, D.; Tang, J.; Luo, B. Semi-supervised learning with graph learning-convolutional networks. In Proceedings of the IEEE/CVF Conference on Computer Vision and Pattern Recognition, Long Beach, CA, USA, 15–20 June 2019; pp. 11313–11320. [Google Scholar]
- Bi, W.; Du, L.; Fu, Q.; Wang, Y.; Han, S.; Zhang, D. Mm-gnn: Mix-moment graph neural network towards modeling neighborhood feature distribution. In Proceedings of the Sixteenth ACM International Conference on Web Search and Data Mining, Singapore, 27 February–3 March 2023; pp. 132–140. [Google Scholar]
- Yang, R.; Yang, B.; Ouyang, S.; She, T.; Feng, A.; Jiang, Y.; Lecue, F.; Lu, J.; Li, I. Graphusion: Leveraging large language models for scientific knowledge graph fusion and construction in nlp education. arXiv 2024, arXiv:2407.10794. [Google Scholar] [CrossRef]


Disclaimer/Publisher’s Note: The statements, opinions and data contained in all publications are solely those of the individual author(s) and contributor(s) and not of MDPI and/or the editor(s). MDPI and/or the editor(s) disclaim responsibility for any injury to people or property resulting from any ideas, methods, instructions or products referred to in the content. |
© 2026 by the authors. Licensee MDPI, Basel, Switzerland. This article is an open access article distributed under the terms and conditions of the Creative Commons Attribution (CC BY) license.