

Graph-Based Automation of Threat Analysis and Risk Assessment for Automotive Security


Abstract

1. Introduction
2. Background
2.1. UN Regulation No. 155—Cybersecurity and Cybersecurity Management System
2.2. Threat Analysis and Risk Assessment
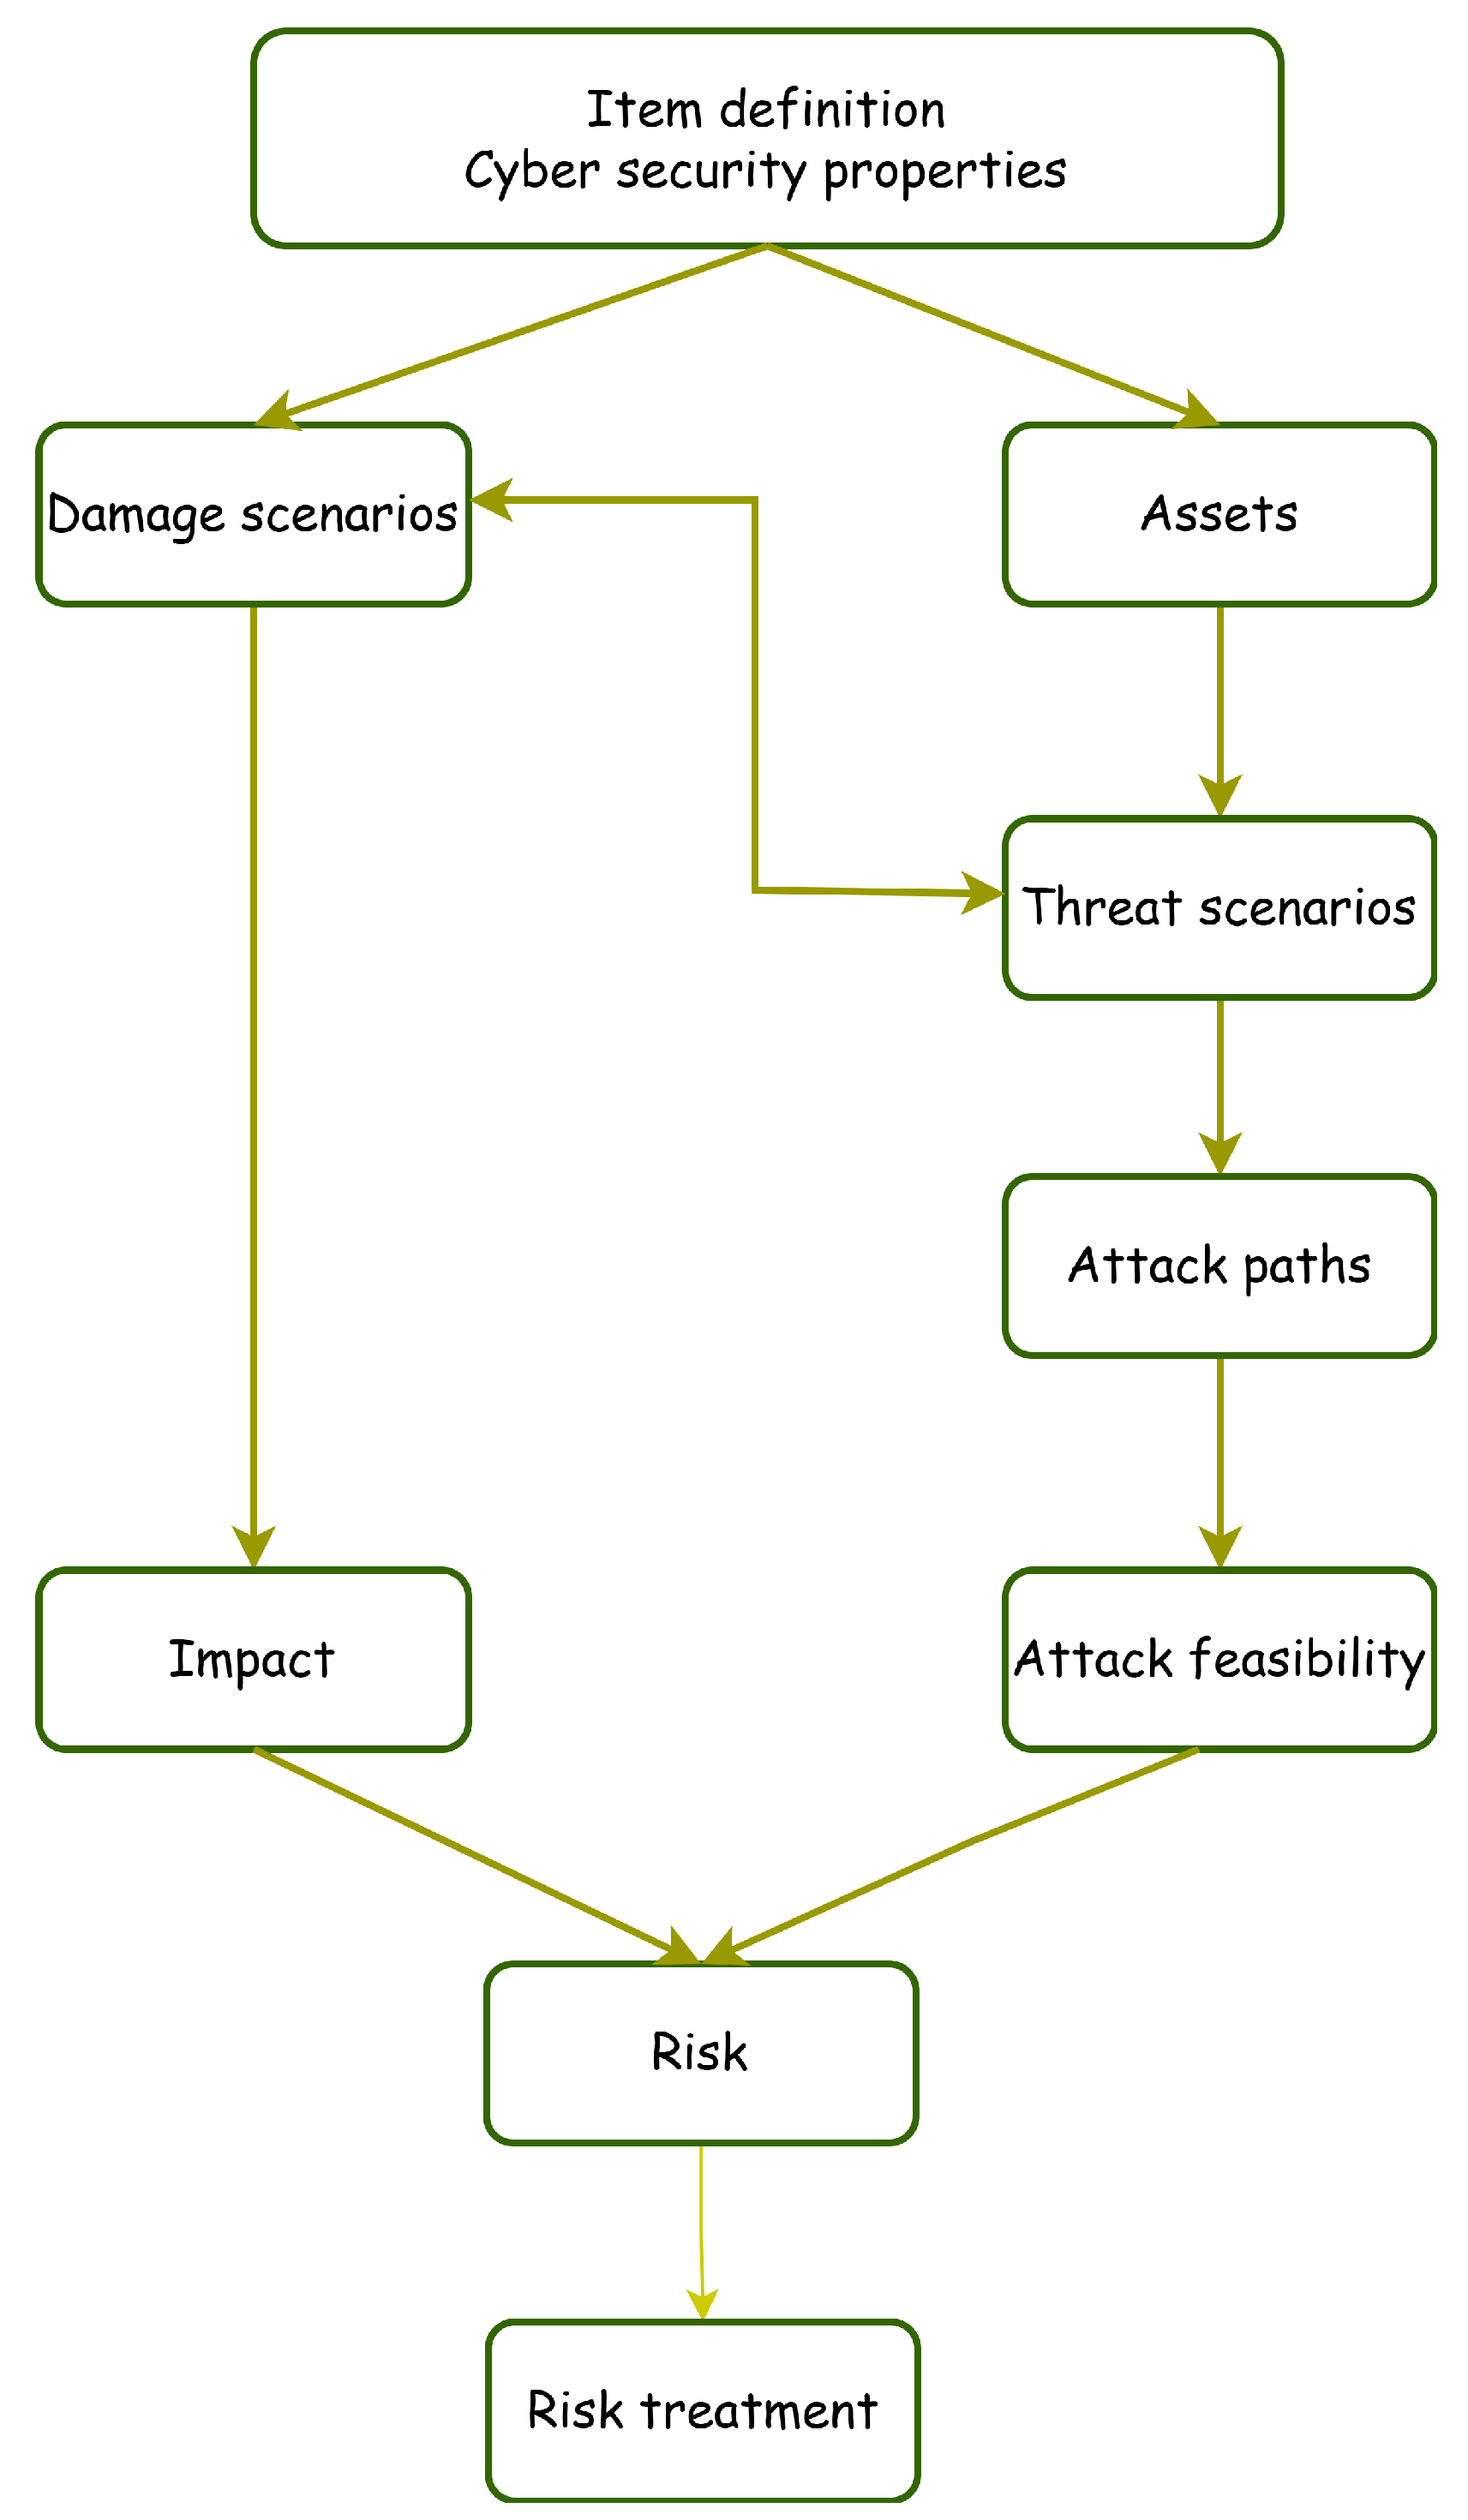
- Asset identification: Assets are valuable components within a vehicle system that require protection from cybersecurity threats. Each asset has associated cybersecurity properties and potential damage scenarios. As shown in Figure 1, this phase corresponds to the “item definition and cybersecurity properties” box, which produces the assets and damage scenarios as outputs. The cybersecurity properties that must be protected according to ISO/SAE 21434 are as follows:
- Confidentiality: ensuring that the information is accessible only to authorized entities.
- Integrity: guaranteeing the accuracy and trustworthiness of information and systems.
- Availability: ensuring that authorized users have timely and reliable access to information and systems.
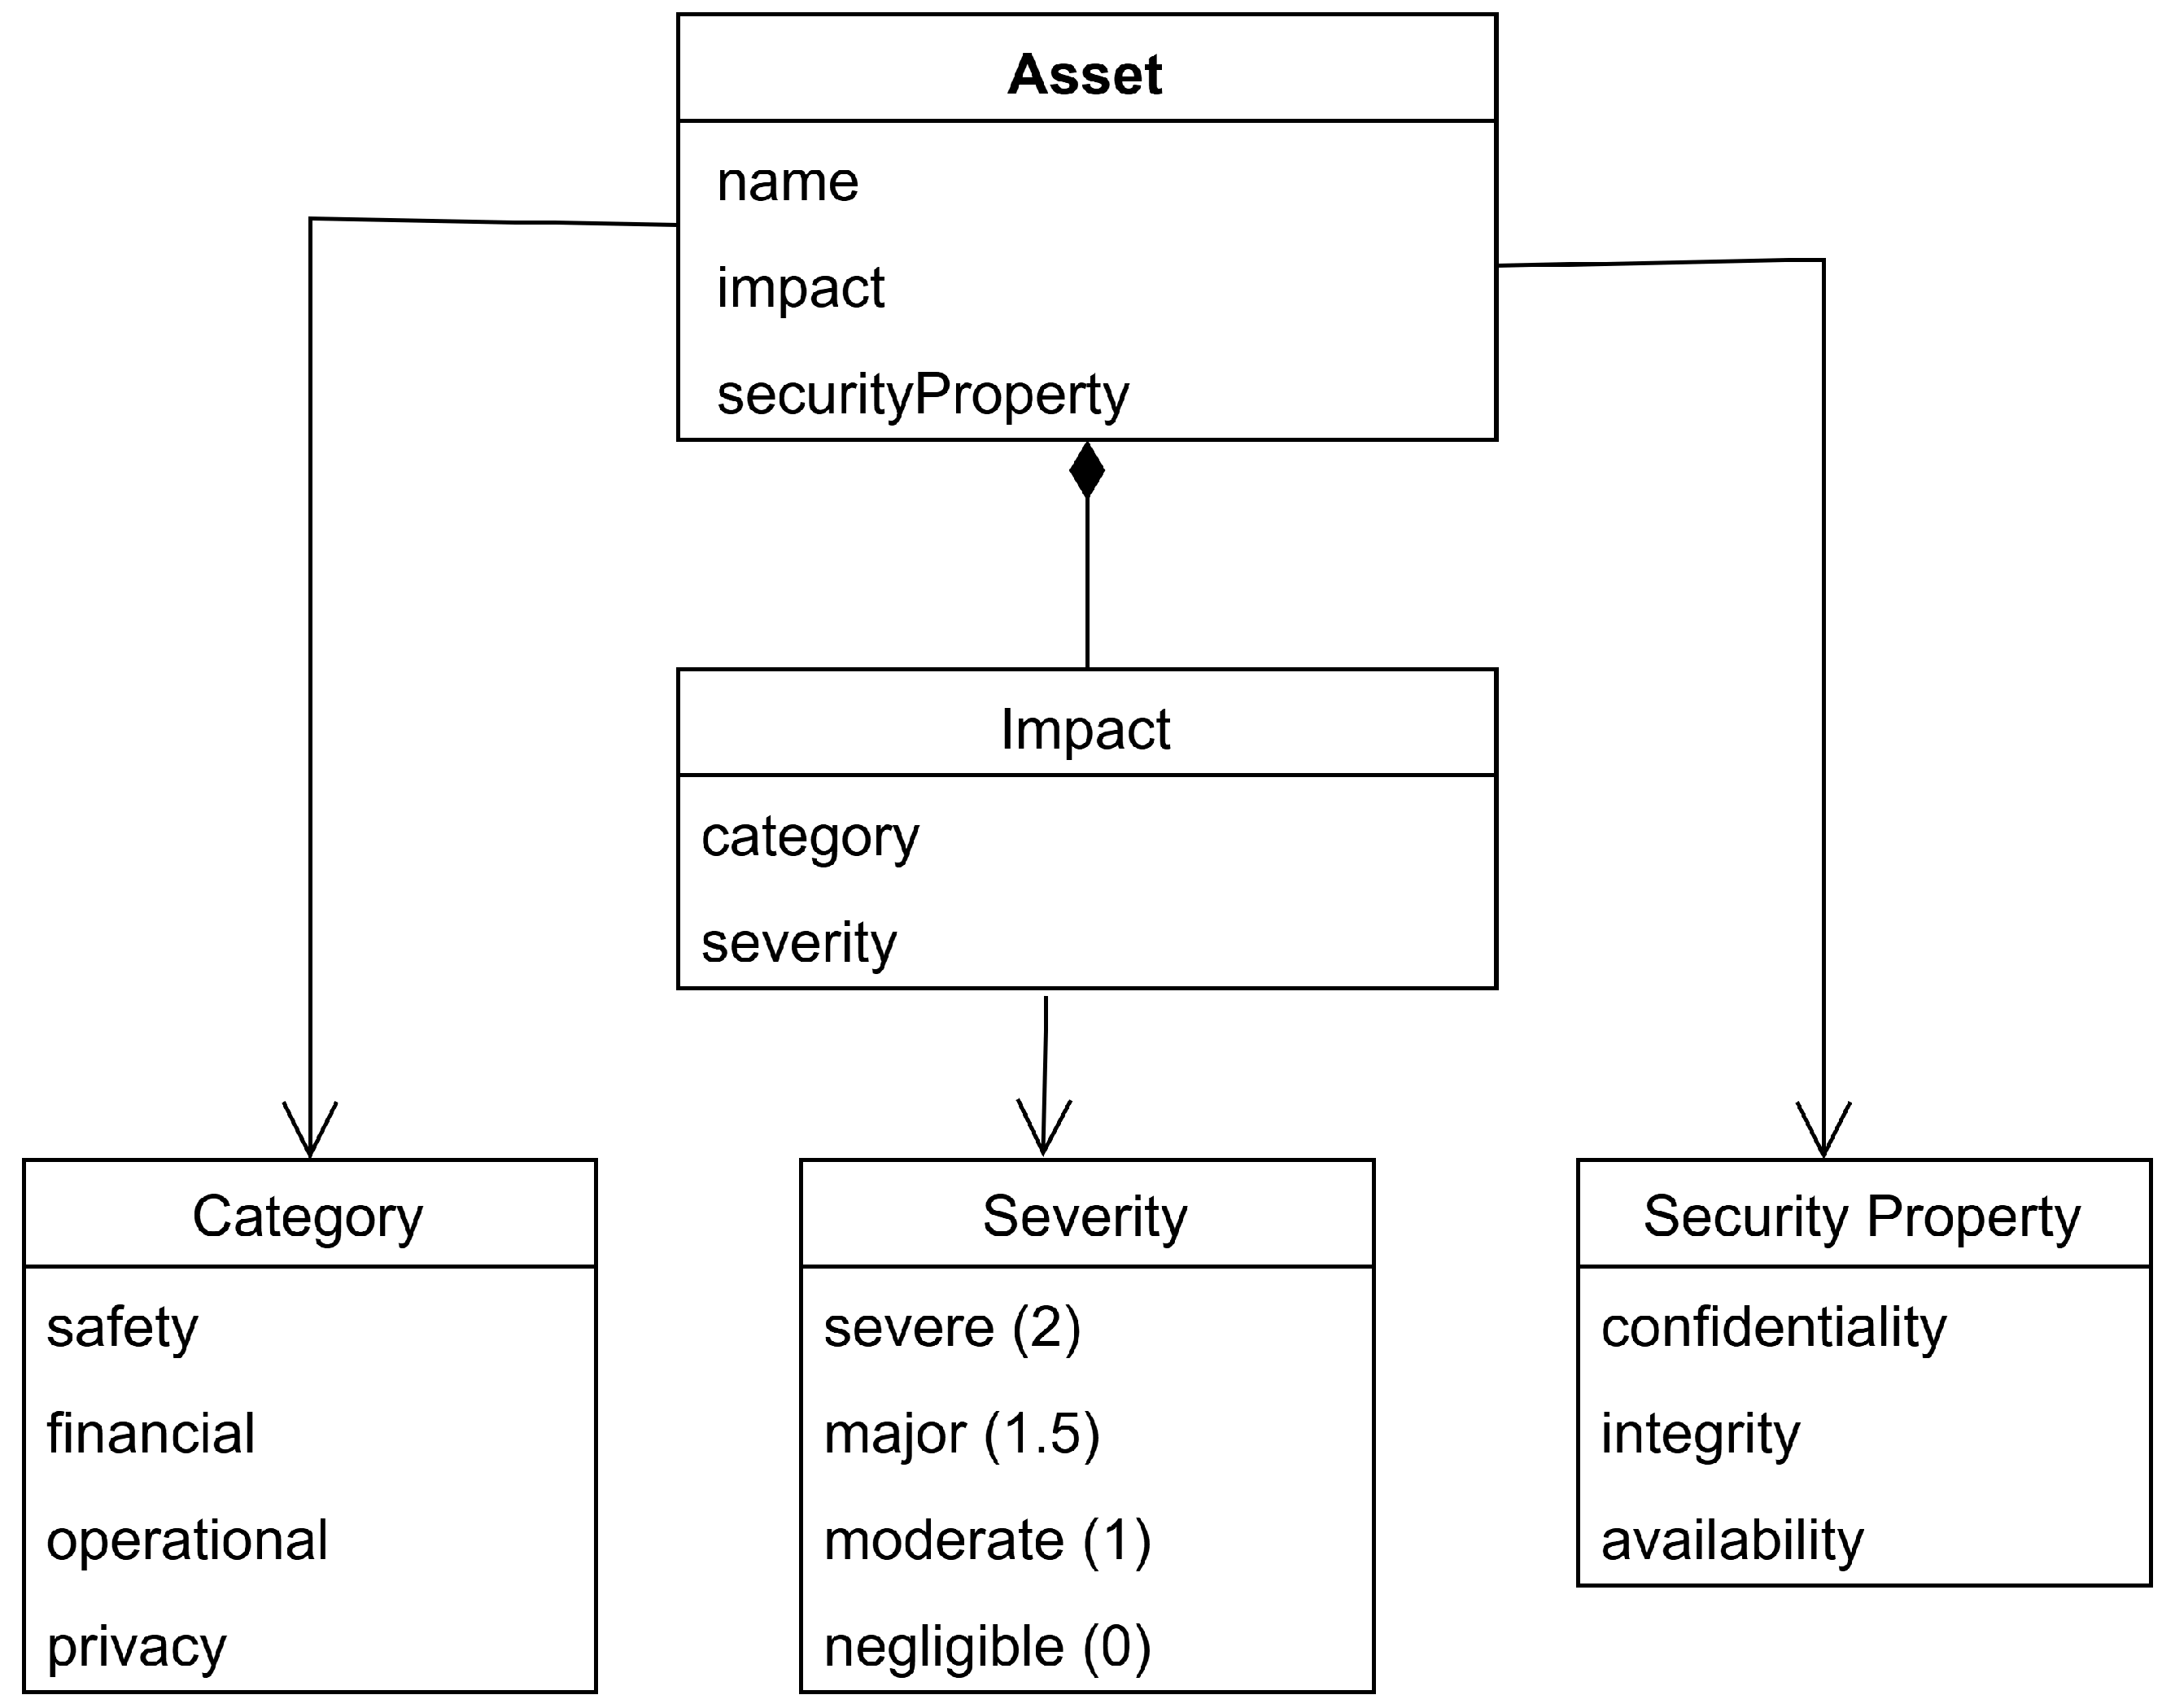
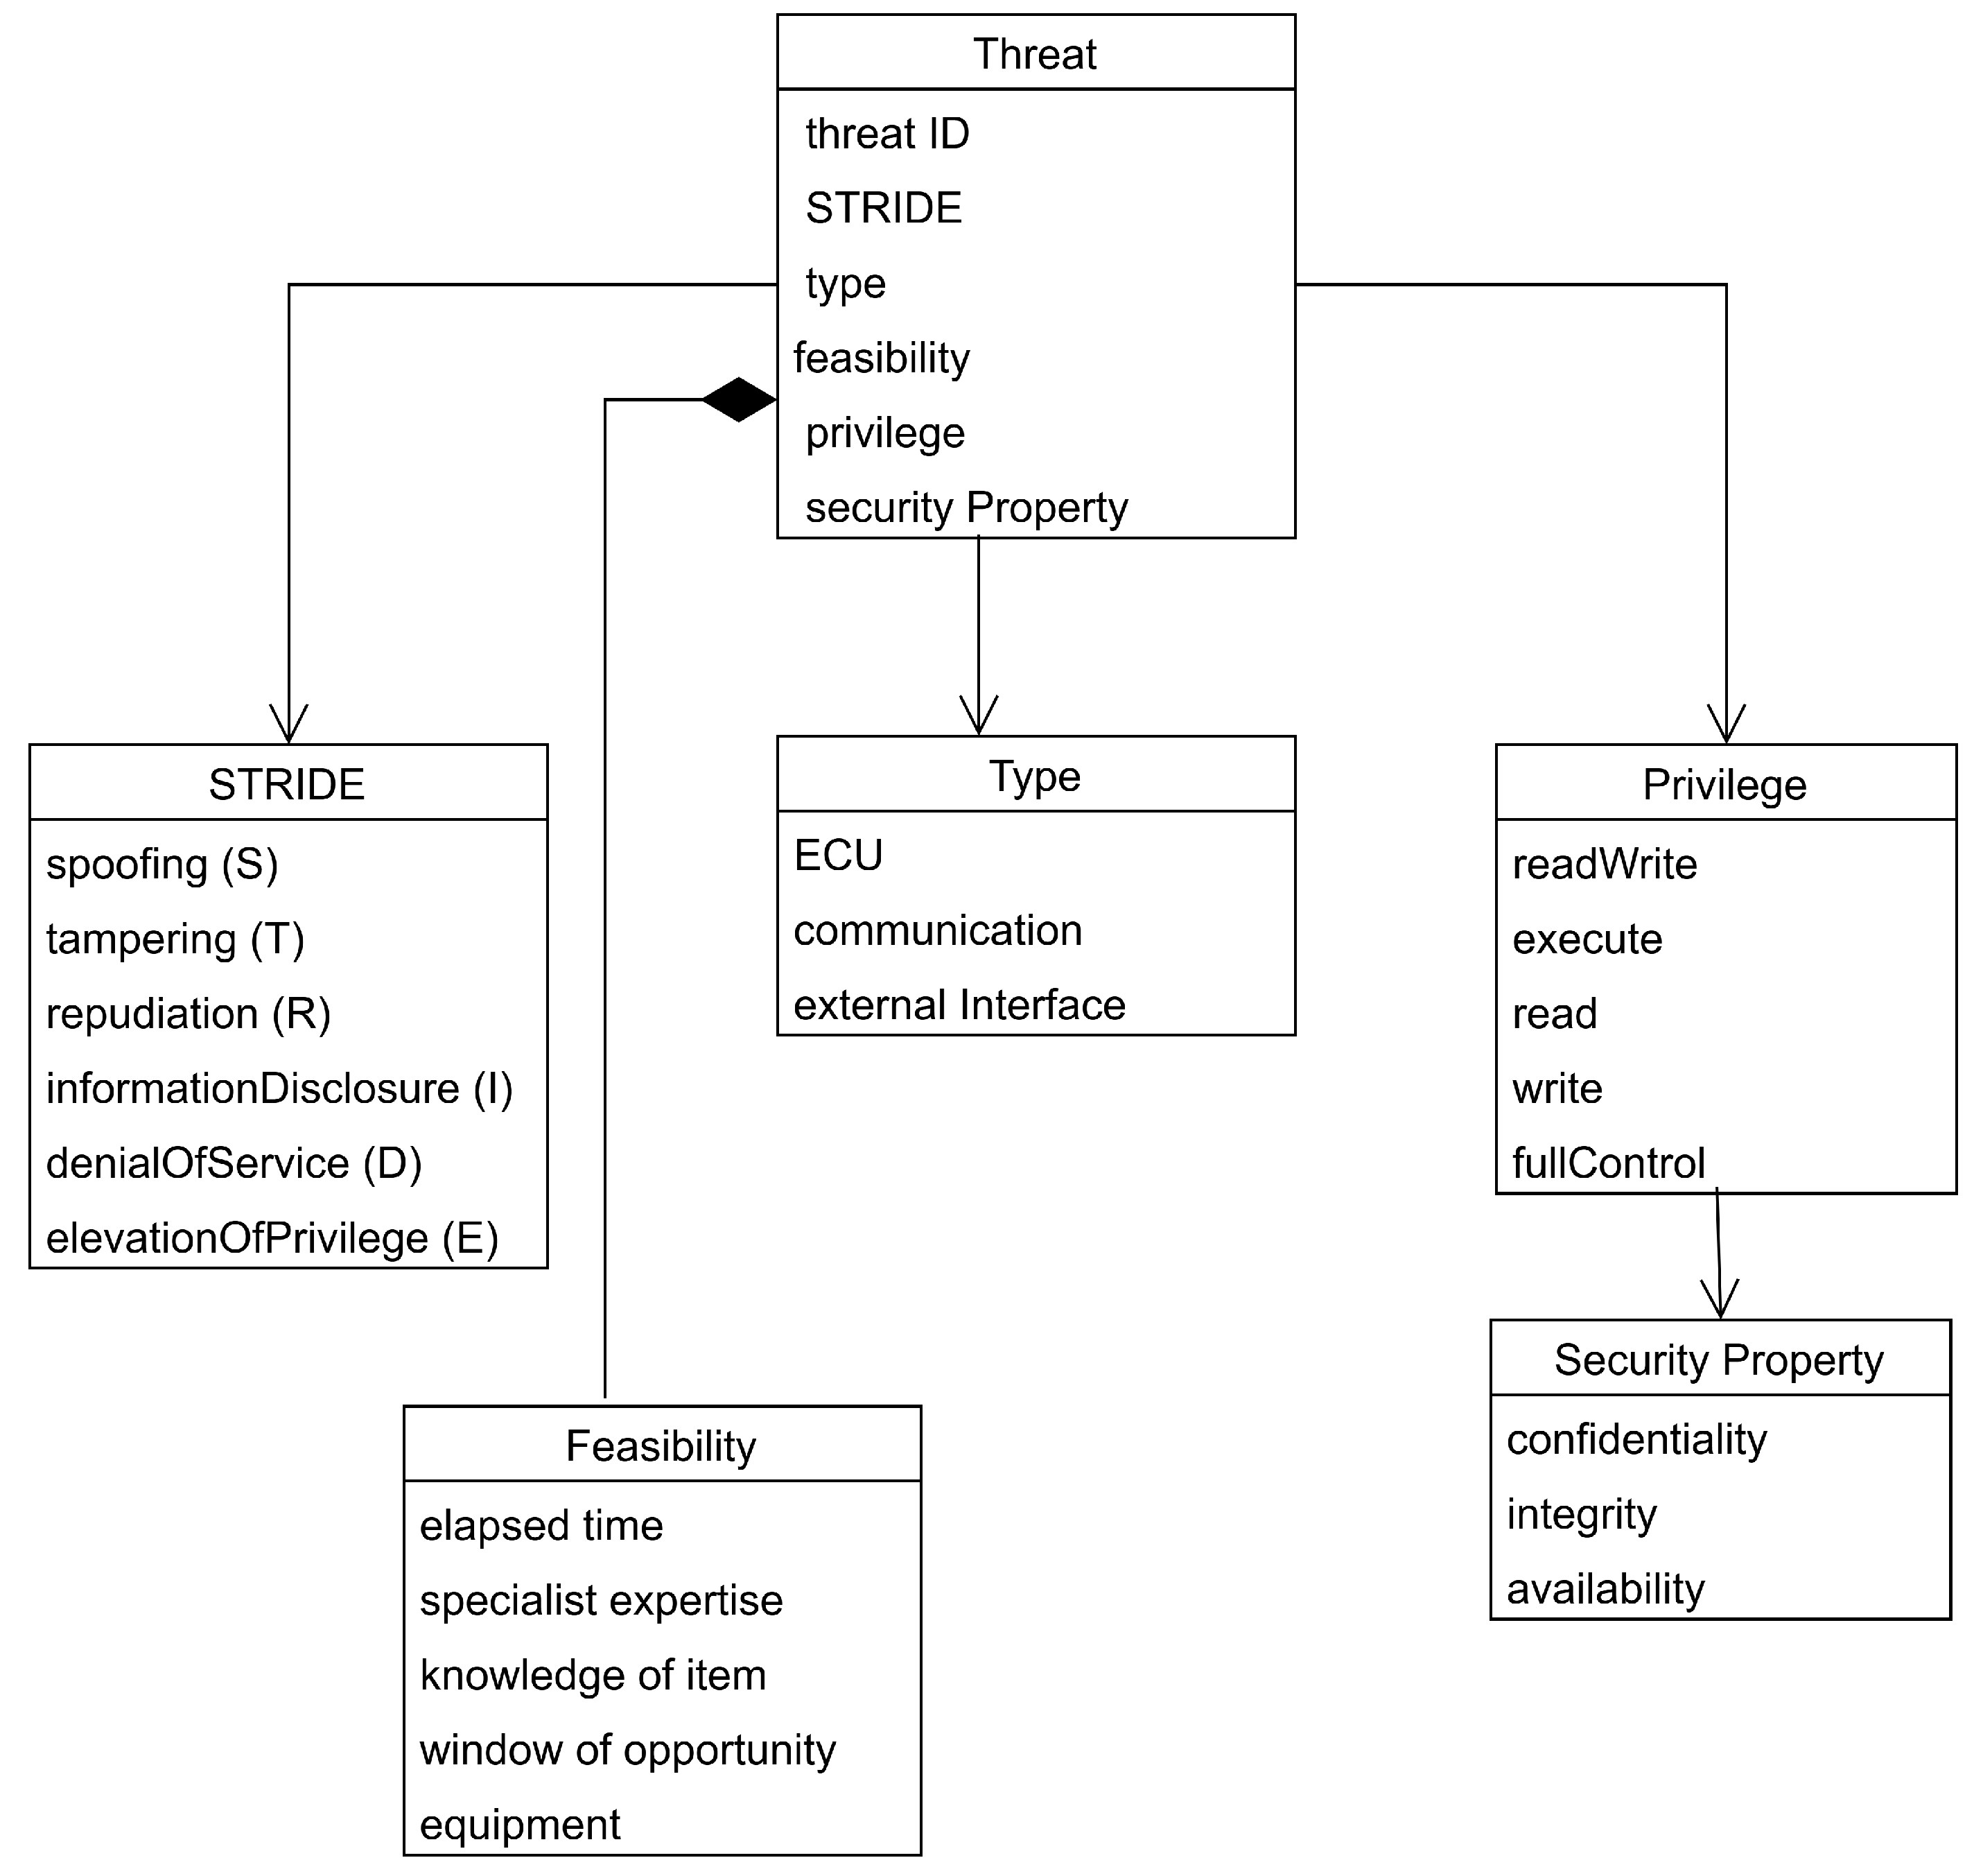
Damage scenarios describe potential negative outcomes that could occur if a threat compromises an asset’s cybersecurity properties. These scenarios may include physical harm to road users in an accident, loss of intellectual property in a data breach, or operational disruptions affecting vehicle functionality.In our methodology, we formalize this output using the asset model shown in Figure 2, which captures the main attributes of each asset within the defined TOE, including its name, associated security properties, and impact categories. - Threat scenario identification: Following the asset identification, the TARA process requires identification of the threat scenarios that could compromise the security properties of identified assets as specified in the ISO/SAE 21434 Section 15.4 [5]. As illustrated in Figure 1, this step builds directly upon the defined assets and their cybersecurity properties. The standard notes that additional information may be included, such as damage scenarios, technical interdependencies between assets, and attack surfaces. It also recognizes that a single damage scenario may correspond to multiple threat scenarios, and conversely, a threat scenario may lead to multiple damage scenarios.In our methodology, we formalize these threats using the threat model defined in in Section 4.3. The UML class diagram represents threats aligning with the ISO requirements: the targeted asset (via the type attribute), the compromised security property (SP), and the cause of the compromise (represented by the STRIDE category and the threat identifier).
- Impact rating: The TARA process requires an assessment of the potential impacts of damage scenarios as specified in ISO/SAE 21434 Section 15.5 [5]. As shown in Figure 1, this step evaluates the severity of consequences that could result from the successful exploitation of identified threats.According to the standard’s requirements [RQ-15-04], four impact categories are defined:
- Safety (S): Potential harm to persons.
- Financial (F): Monetary losses for stakeholders.
- Operational (O): Disruption to vehicle functions or operations.
- Privacy (P): Unauthorized access to or disclosure of personal data.
For each impact category, the standard [RQ-15-05] requires that the impact rating be determined as one of four levels:- Severe: Catastrophic consequences requiring immediate response.
- Major: Significant impact on system operation or business.
- Moderate: Limited impact with containable consequences.
- Negligible: Minimal or no measurable impact.
In our methodology, we formalize these impact ratings in the asset model shown in Figure 3, where the impact attribute is represented as a composite structure containing both category and rating. We map these qualitative ratings to numerical values (severe: 2; major: 1.5; moderate: 1; negligible: 0) to facilitate quantitative risk assessment calculations later in the process. - Attack path analysis: Following impact rating, the TARA process requires an analysis of attack paths as specified in ISO/SAE 21434 Section 15.6 [5]. As shown in Figure 1, this step takes input from the previous steps and it analyzes how attackers can exploit vulnerabilities to realize the identified threat scenarios. According to the standard, an attack path is the combination of various attack actions that, when applied successively, lead to the threat scenario. The standard acknowledges that in early development stages, attack paths may be incomplete or imprecise as specific implementation details may not yet be available. Much of the difficulty of the TARA process lies in the identification of the most relevant attack paths. Traditional manual approaches often struggle with the combinatorial complexity of potential attack sequences. Our GAPP methodology directly addresses this challenge by employing a graph-based approach to systematically identify and analyze attack paths. The formal model described in Section 4.4 provides the mathematical foundation for this analysis, while the implementation detailed in Section 5.2 leverages graph database technology to execute these algorithms.
- Attack feasibility rating: The TARA process requires an assessment of attack feasibility as specified in ISO/SAE 21434 Section 15.7 [5]. As shown in Figure 1, this step takes the attack paths as input, and evaluates the difficulty an attacker would face when attempting to execute each identified attack path. According to the standard’s requirements [RQ-15-10], each attack path must be assigned one of four feasibility ratings:
- High feasibility: Indicates attacks requiring minimal effort.
- Medium feasibility: Indicates attacks requiring moderate effort.
- Low feasibility: Indicates attacks requiring substantial effort.
- Very Low feasibility: Indicates attacks requiring extensive effort.
The standard recommends three potential approaches for determining attack feasibility:- Attack potential-based approach: As recommended in [RC-15-12], this evaluates feasibility based on five core factors:
- –
- Elapsed time: Period required to identify and exploit the vulnerability.
- –
- Specialist expertise: Level of knowledge required.
- –
- Knowledge of the item or component: Specific information needed about the target.
- –
- Window of opportunity: Accessibility constraints.
- –
- Equipment: Tools required for the attack.
- CVSS-based approach: As recommended in [RC-15-13], this uses the Common Vulnerability Scoring System (CVSS) [9] to determine attack feasibility based on exploitability metrics: attack vectors, attack complexity, privileges required, and user interaction.
- Attack vector-based approach: As recommended in [RC-15-14], this evaluates feasibility based on the predominant attack vector used in the attack path.
In our GAPP methodology, we implement the attack potential-based approach as described in Annex G.2 of the ISO/SAE 21434 standard. As described in Section 4.7, each threat is characterized using a 5-tuple of feasibility factors.For multi-step attack paths, we define the affmax aggregation function that determines the overall feasibility by selecting the maximum difficulty value for each factor across all threats in the path. This approach, formally defined in Section 4.7, acknowledges that a chain of attacks is at least as difficult as its most challenging component. - Risk value determination: The TARA process requires determining the overall risk value for each threat scenario. As illustrated in Figure 1, this step synthesizes previous assessments to produce risk metrics that guide security decision-making. ISO/SAE 21434 Section 15.8 [5] specifies that the risk value for each threat scenario is calculated based on the impact rating of the damage and the feasibility of the attack. For scenarios where multiple damage scenarios or impact categories apply, separate risk values may be calculated for each combination. In our GAPP methodology, we implement a risk calculation formula that aligns with these requirements while providing a quantitative foundation for automated analysis:where Impact represents the impact rating (as defined in Section 5.2.2), and Feasibility is derived from the aggregated feasibility factors using the affmax function.
- Risk treatment decision: The final step in the TARA process defines appropriate risk mitigation strategies based on the evaluated risk values. This phase translates analytical findings into concrete security actions.
Challenges of Manual TARA
2.3. Automotive Network Security
2.4. Graph Theory
- g(n): The actual cost of the path discovered so far from the start node to node n.
- h(n): A heuristic estimate of the cost required to get from node n to a goal state.
2.5. Attack Graph
- State-based Attack Graphs (AGs): These structures provide formal representations of potential attack progressions, where vertices correspond to distinct system states within the security domain, and directed edges represent state transitions triggered by adversarial actions. Each vertex captures the security configuration at a specific point during attack execution, while edges point to the exploitation events that transform the system from one state to another [27].
- Attack Trees (ATs): Characterized by a hierarchical, tree-structured representation with a singular root node representing the adversary’s ultimate objective. These models employ recursive decomposition to represent attack methodology, where sub-goals are organized through logical connectives, specifically conjunction (AND), disjunction (OR), and sequential conjunction (SAND), to encode the prerequisite relationships between attack components [28].
- Multiple Prerequisite Attack Graphs (MPAGs): These heterogeneous graphs implement a tripartite structure comprising distinct node classifications: state nodes (encoding attacker privilege levels within specific system components), prerequisite nodes (representing contextual conditions such as network reachability or credential possession), and vulnerability nodes (corresponding to exploitable security weaknesses within specific system interfaces) [29].
- Bayesian Attack Graphs (BAGs): These models extend traditional attack graphs by incorporating probabilistic inference mechanisms. Each vertex is augmented with conditional probability distributions that quantify exploitation likelihood based on multiple factors, including vulnerability characteristics, attacker capability profiles, and defensive control efficacy, enabling quantitative security risk assessment.
3. Related Work
4. GAPP Methodology
4.1. Steps of the GAPP Methodology
- The process begins with the creation of a detailed system model representing the architecture of the TOE. This phase involves the instantiation of nodes representing ECUs, communication networks, and external interfaces, with the definition of their interconnections through a reachability list. The system model establishes the topological foundation for subsequent security analysis phases.
- State model creation: Building upon the architectural foundation, this phase implements an EFSM framework to define the state space of the system. Each node’s possible states are formally characterized based on attacker privilege levels, with corresponding transition functions.
- Vulnerability mapping: Following the creation of the state model, this phase establishes the relationships between the states of the system and the applicable vulnerabilities. The mapping process utilizes a multi-dimensional classification schema incorporating STRIDE categories, component types, and privilege levels to systematically associate relevant threat vectors with specific system states.
- Attack path traversal analysis: A core part of the methodology is the automated graph traversal and search algorithms that systematically identify all viable exploitation sequences from attack surfaces to critical assets.
- Risk-based path prioritization: The final analytical phase implements a quantitative risk assessment for each identified attack path. Using the affmax aggregation function, the methodology calculates composite feasibility metrics across multi-stage attack sequences, combining these with the asset impact ratings to derive the risk scores in accordance with ISO/SAE 21434 criteria.
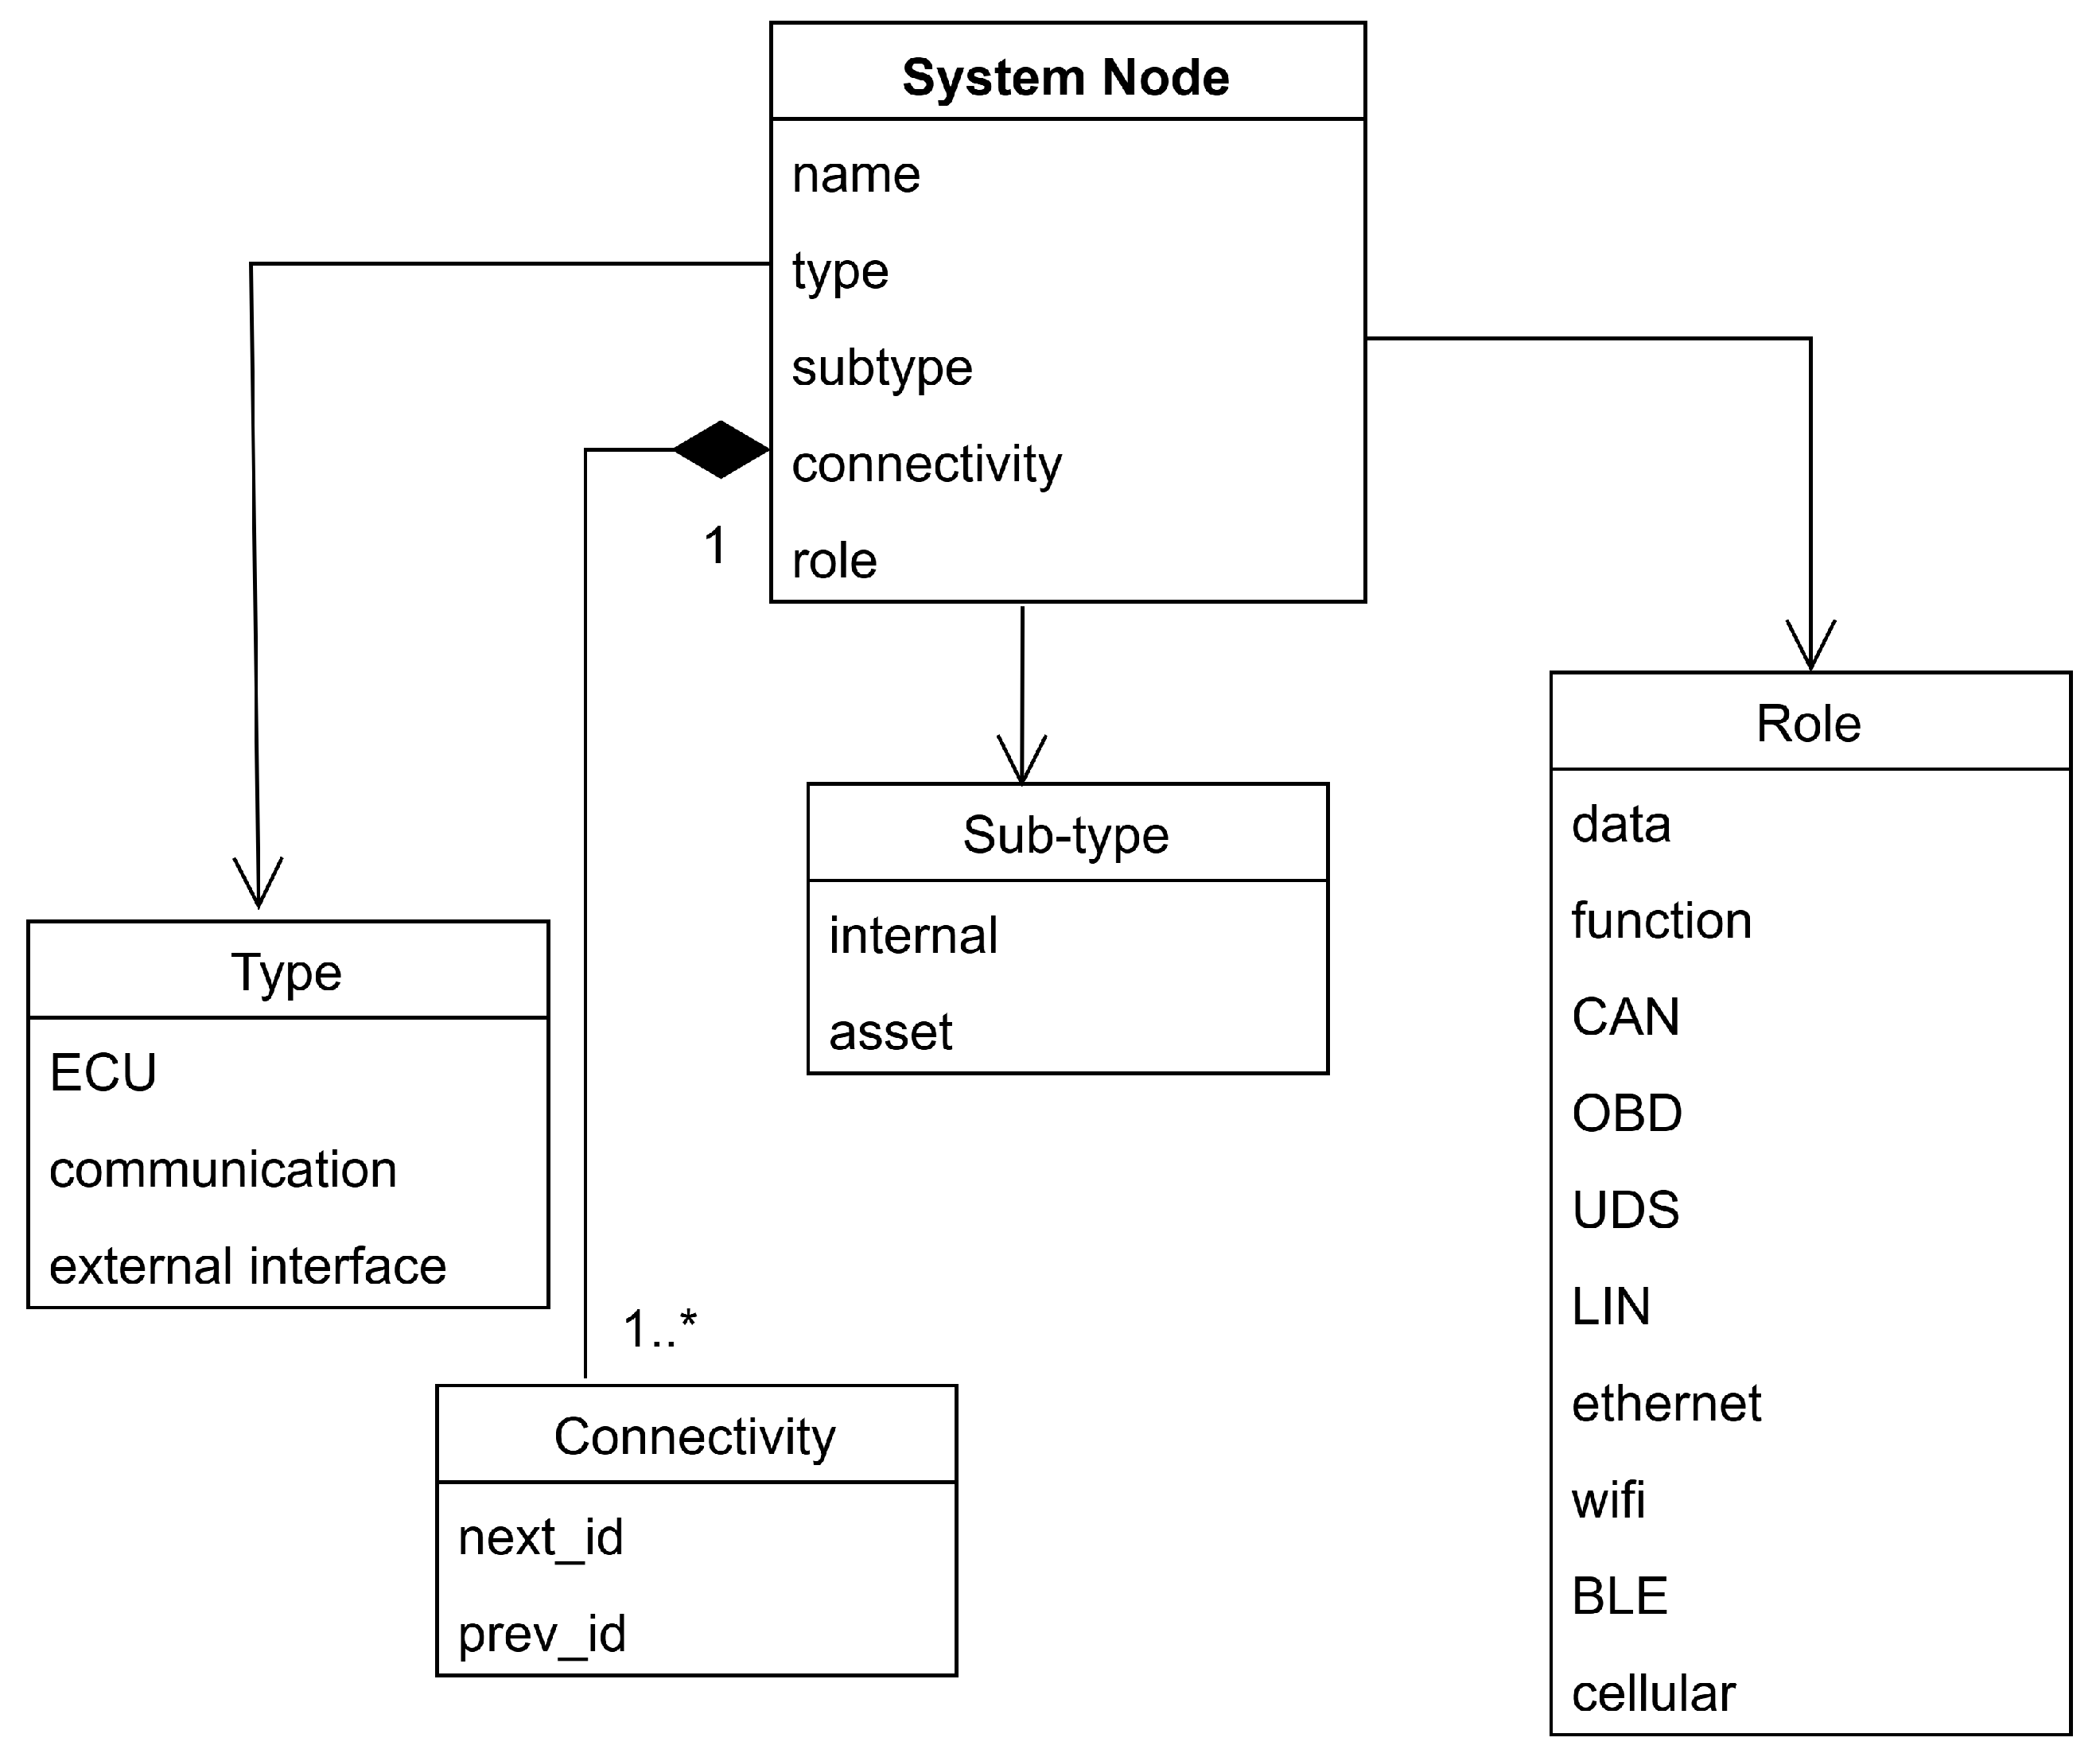
4.2. System Model
4.3. Threat Model
Attacker Privilege Model for Automotive Systems
- Read/Write (Communication Systems): Enables an attacker to intercept, monitor, and manipulate message traffic on communication channels, facilitating activities such as message replay, injection, or denial of service attacks.
- Execute (ECU Systems): Provides capability to invoke specific functions implemented within an ECU, enabling operational control without necessarily exposing data or enabling arbitrary code execution.
- Read (ECU Systems): Grants access to internal data structures, configuration parameters, or program memory without the ability to modify them. This supports reconnaissance activities and intellectual property extraction.
- Write (ECU Systems): Allows modification of internal data structures, configuration parameters, or program memory, facilitating tampering and potentially enabling persistent modifications to ECU behavior.
- Full Control (ECU Systems): Establishes comprehensive administrative access to the ECU, analogous to root-level access in conventional IT systems, enabling arbitrary code execution and complete system manipulation.
4.4. State Security Model
4.4.1. Extended Finite State Machines for Automotive Security Modeling
4.4.2. Formal Model Definition
- Type Compatibility: The Type of the Destination Node must be compatible with the Type of the Threat.
- STRIDE Compatibility: The STRIDE category of the Threat must align with the STRIDE category of the Privilege level of the Destination, as defined in Table 1.
- Connectivity Constraint: There must be a direct connection between the Source and Destination System Nodes according to the Connectivity list.
- Privilege Monotonicity: For transitions between nodes of the same type, the privilege level cannot decrease: .
- ;
- ;
- .
4.5. STRIDE Mapping Methodology and Security Property Correlation
- Attack Method: Examination of the technical mechanisms typically employed in exploiting each threat.
- Target Component: Identification of the primary system components affected.
- Attack Outcome: Determination of the potential security violations resulting from a successful exploitation.
- Spoofing (S) → Confidentiality (C): Spoofing attacks primarily compromise authentication mechanisms, leading to unauthorized access and potential confidentiality breaches.
- Tampering (T) → Integrity (I): Tampering attacks directly target data or code integrity by unauthorized modification.
- Repudiation (R) → Integrity (I): Repudiation threats compromise accountability records, affecting system integrity. If actions cannot be reliably attributed, the trustworthiness of the system’s logs and records is undermined.
- Information Disclosure (I) → Confidentiality (C): Information disclosure directly compromises confidentiality by exposing protected data.
- Denial of Service (D) → Availability (A): DoS attacks specifically target system availability.
- Elevation of Privilege (E) → Multiple (C,I,A): Privilege escalation can lead to multiple security property violations depending on the specific privileges gained.
4.6. Threats Classification
- ECU: Electronic Control Unit components.
- C: Communication networks and interfaces.
- External Interface: Connection points to external systems or devices.
4.7. Feasibility
5. Results
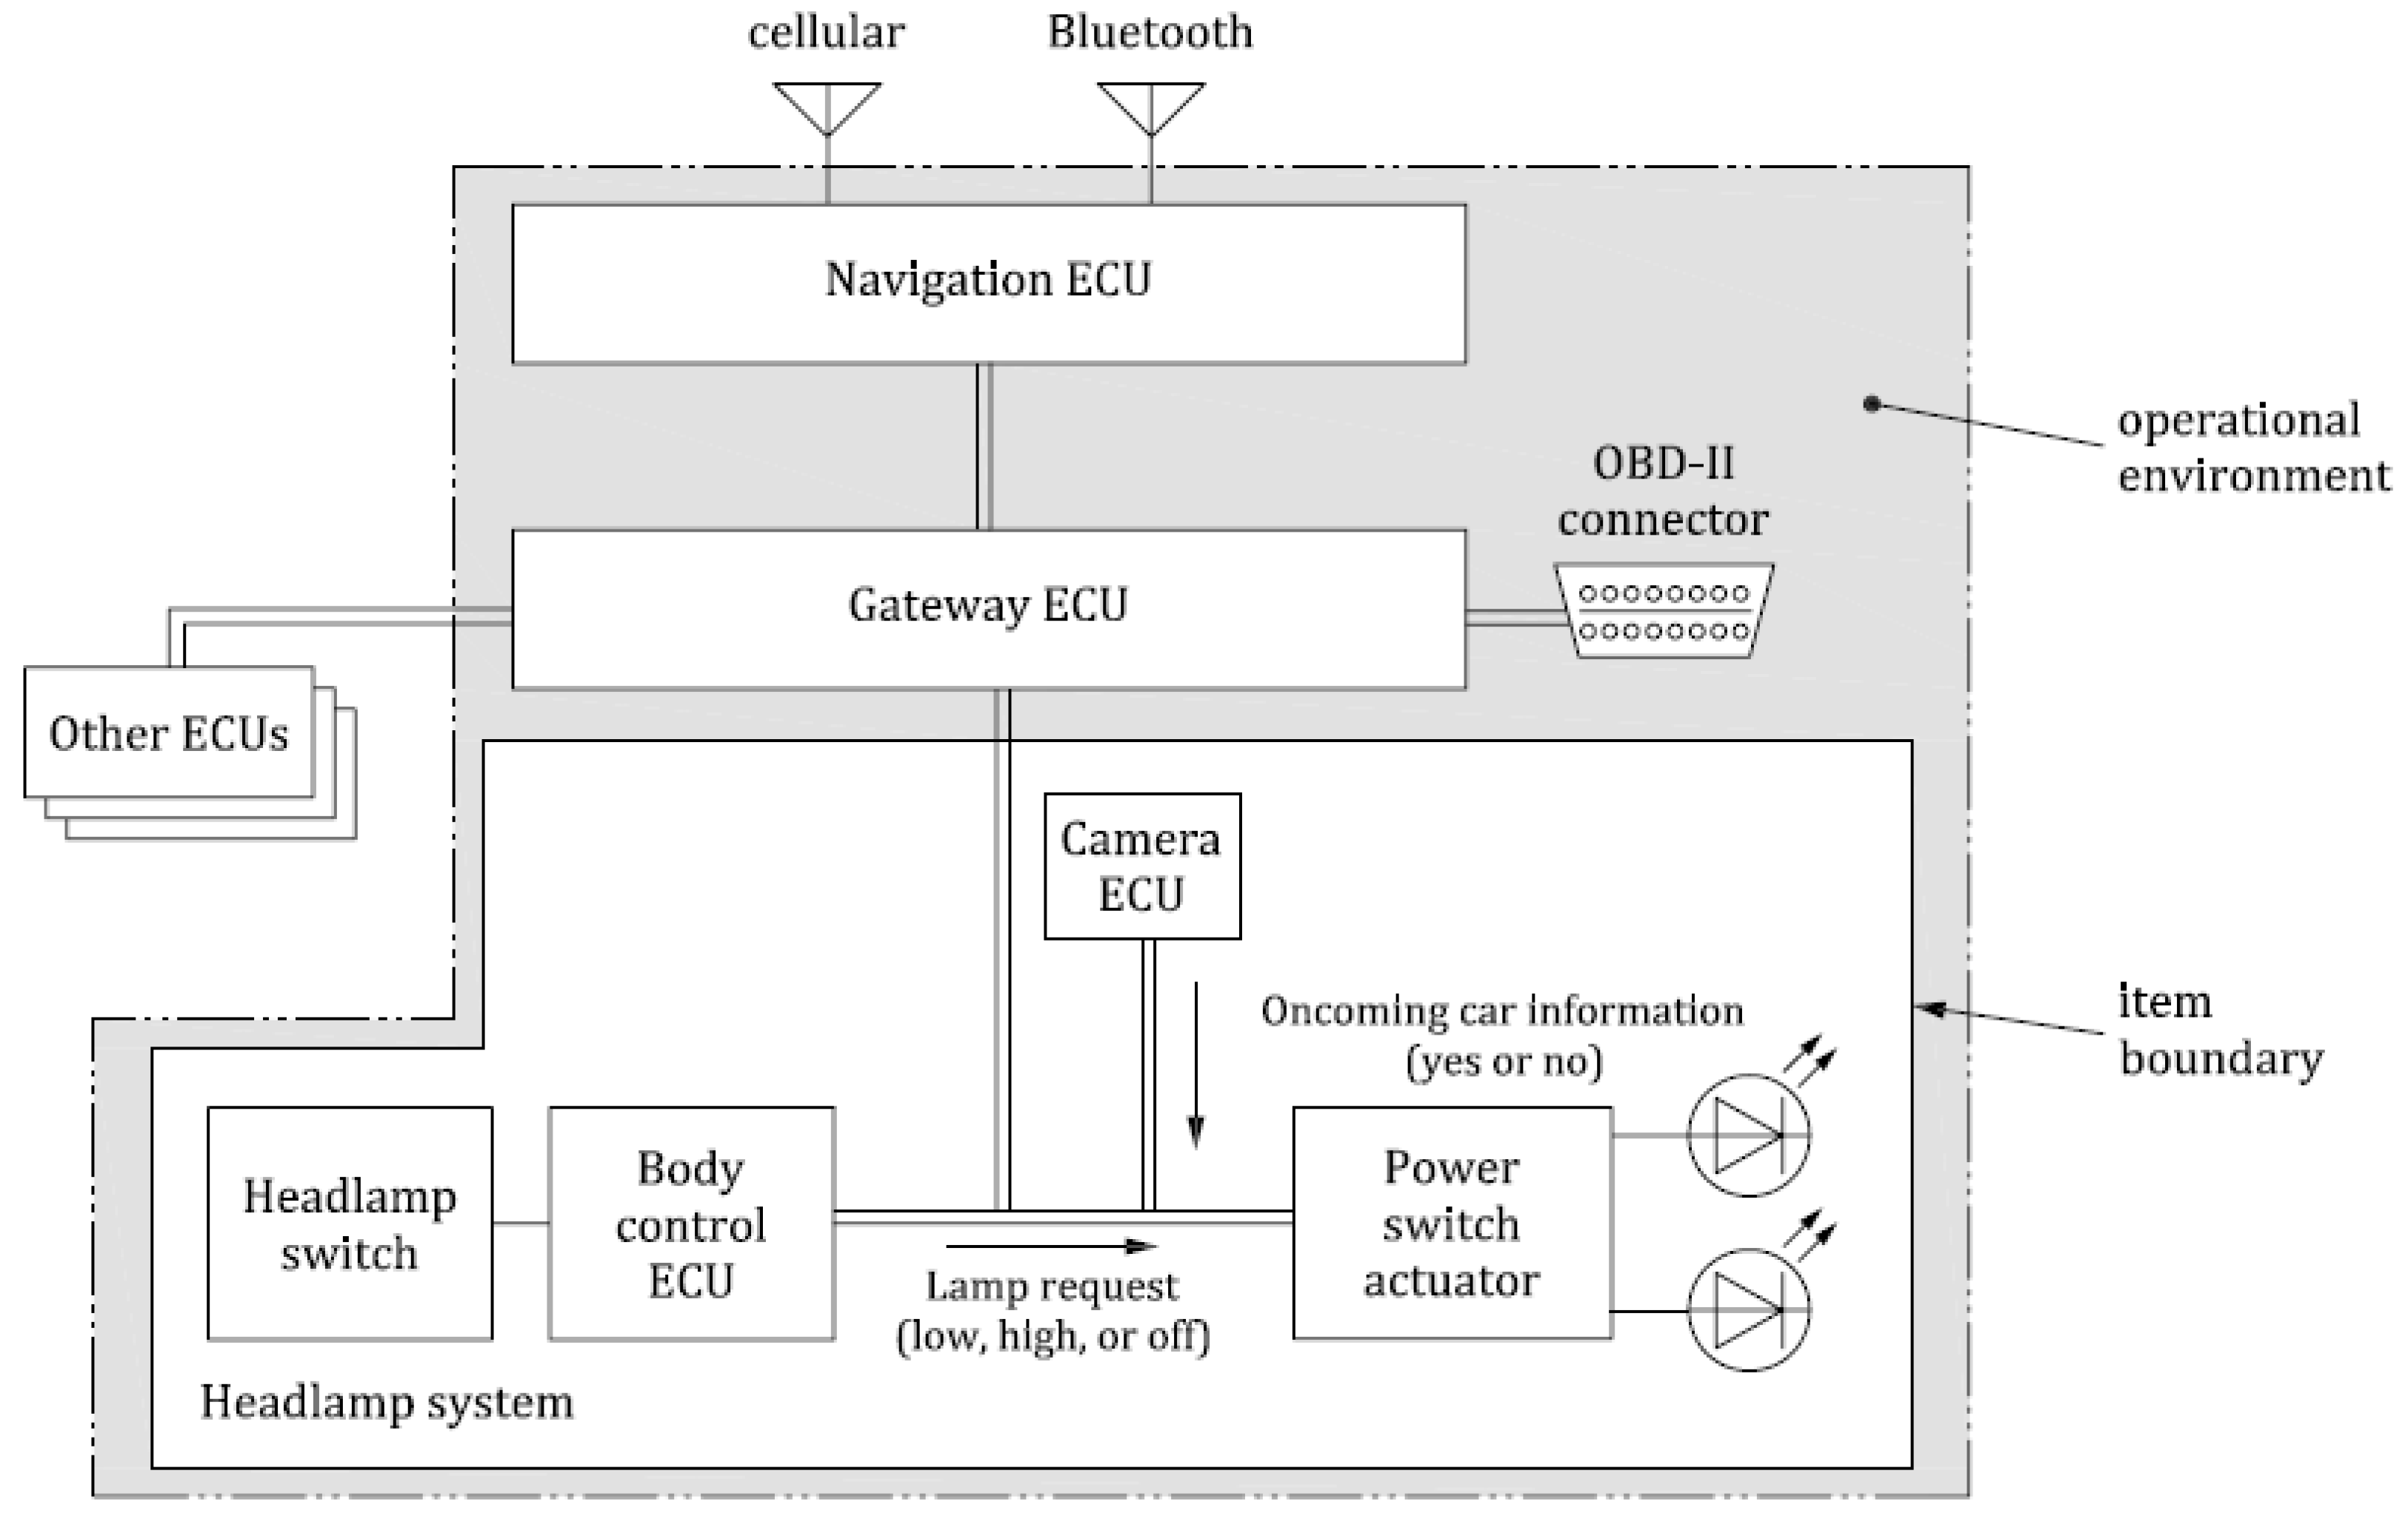
5.1. Sample System
5.1.1. Damage Scenarios
- Loss of Headlight Functionality: Vehicle cannot be safely operated during night conditions due to compromised headlamp function.
- Unauthorized Control: Malicious deactivation of headlamps during nighttime driving at moderate speed, potentially resulting in a collision with stationary objects.
- Data Breach: Exfiltration of sensitive intellectual property related to Headlight Unit design and implementation. Modern automotive lighting systems contain substantial proprietary technology including adaptive lighting algorithms, matrix LED control systems, and communication protocols for integration with vehicle dynamics and perception systems [13,52]. These systems often incorporate proprietary calibration data, lighting patterns, and control algorithms that represent significant research investments.
5.1.2. Threat Scenarios
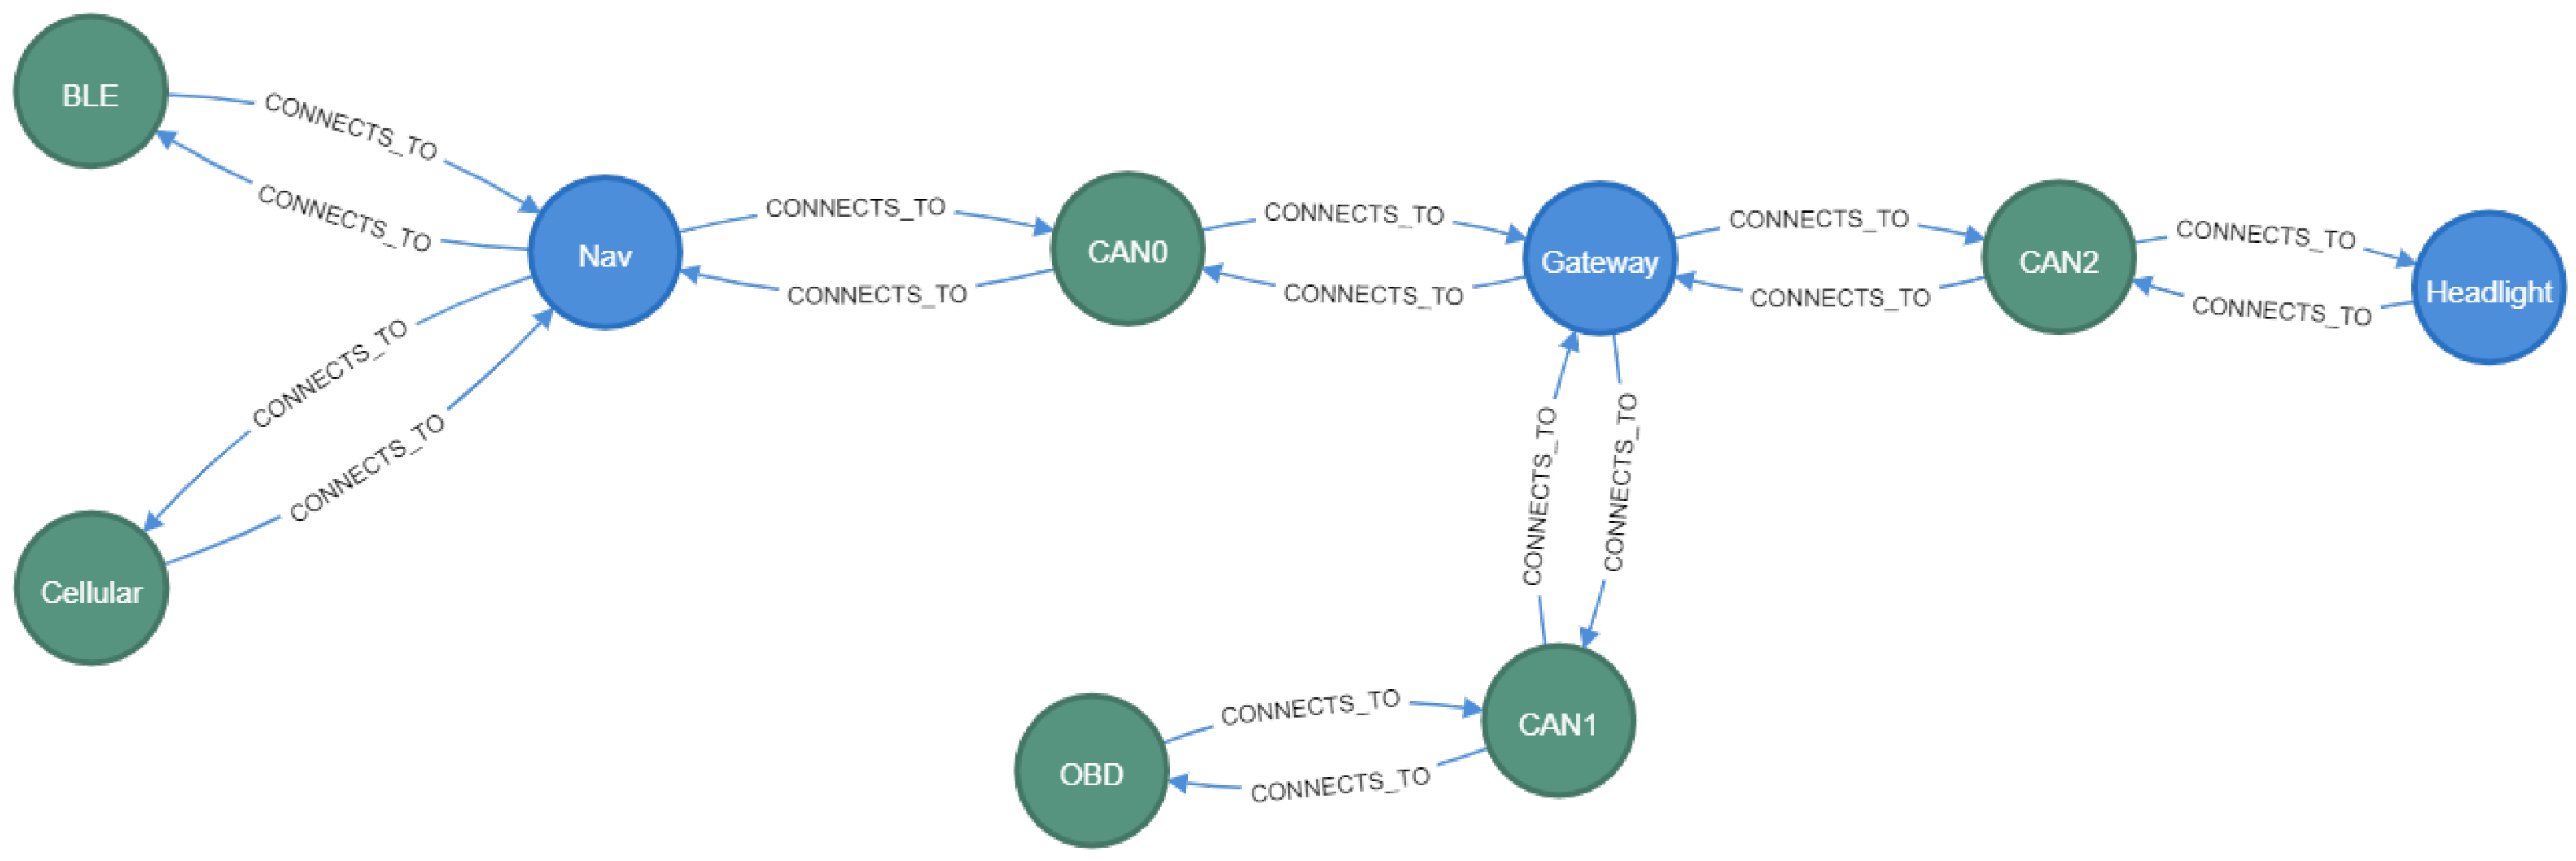
5.1.3. System Model
- ;
- ;
- ;
- ;
- ;
- ;
- ;
- ;
- ;
- .
5.1.4. State Model and Transition Function
- External interface to communication transitions:
- ECU internal state transitions:
- , ,
- , ,
- , ,
- Communication to ECU transitions:
- , , ,
- ECU to communication transition
- , , ,
5.1.5. Event Space Definition
5.1.6. Security Model Instantiation
5.1.7. Attack Path Analysis
- Initial Access (UN-T18): An attacker employs diagnostic tools (e.g., OBD dongles) to establish initial system access, enabling both direct and indirect vehicle parameter manipulation.
- Message Manipulation (UN-T6): The attacker intercepts and modifies communications between the OBD port and internal systems, potentially hijacking legitimate sessions.
- Privilege Escalation (UN-T28): Software vulnerabilities are exploited to elevate privileges within the Gateway ECU, enabling message manipulation and forwarding capabilities.
- Channel Exploitation (UN-T5): Communication channels are leveraged to manipulate vehicle data/code, potentially through parameter alteration or command injection.
- Extraction of vehicle data (UN-T19): Proprietary software or sensitive information is extracted from vehicle systems, compromising confidentiality and potentially exposing intellectual property.
5.1.8. Threat Feasibility Assessment
- UN-T5: Communication channels used to conduct unauthorized actions
- Elapsed Time: ≤1 month (Value: 4)Vehicle function manipulation requires a comprehensive analysis of control message structures and timing constraints within the CAN protocol implementation. This requires time for reverse engineering proprietary message formats and timing sequences.
- Specialist Expertise: Expert (Value: 4)Successful exploitation requires Expert-level understanding of vehicle functional architecture and cross-domain security mechanisms.
- Knowledge of Target: Restricted (Value: 5)Implementation-specific knowledge of function activation mechanisms and associated authentication protocols is needed.
- Window of Opportunity: Moderate (Value: 4)Moderate accessibility, dependent on vehicle operational state.
- Equipment: Specialist (Value: 4)Specialized diagnostic equipment and protocol analyzers are required.
- UN-T18: External interface compromise
- Elapsed Time: ≤1 week (Value: 1)Due to readily accessible interfaces with documented vulnerabilities and established exploitation techniques in the public domain.
- Specialist Expertise: Proficient (Value: 3)Knowledge of automotive network protocols and interface specifications is needed.
- Knowledge of Target: Restricted (Value: 3)Restricted but partially accessible through public documentation.
- Window of Opportunity: Unlimited (Value: 1)External interfaces are typically continuously accessible and designed for connectivity.
- Equipment: Standard (Value: 4)Commercial interface adapters and open-source software tools are typically sufficient for exploitation.
- UN-T19: Extraction of vehicle data
- Elapsed Time: ≤1 month (Value: 4)Extracting proprietary code or sensitive data requires significant time investment for identifying storage locations and developing extraction methodologies.
- Specialist Expertise: Expert (Value: 6)Specialist knowledge of automotive firmware structures and memory protection is needed.
- Knowledge of Target: Restricted (Value: 5)Internal data organization and storage mechanisms are restricted information.
- Window of Opportunity: Moderate (Value: 4)Moderate, limited by operational states and security mechanisms designed to prevent unauthorized data access.
- Equipment: Specialist (Value: 4)Specialized diagnostic and memory analysis tools are required.
5.2. Implementation
5.2.1. Neo4j
- Nodes: These represent entities or objects within the data model. Nodes can be assigned labels, which categorize them and facilitate filtering during algorithm execution or querying. Notably, a node can possess multiple labels, allowing for nuanced categorization.
- Relationships: These denote connections or interactions between nodes. Each relationship has a type and direction, specifying the subject and object of the interaction, thereby providing context to the connections.
- Properties: These are key–value pairs that provide additional information about both nodes and relationships, enhancing the richness of the data model.
5.2.2. System Model
- Nodes are uniquely identified by an ID. They are categorized using labels to specify their roles, such as “ECU”, “Communication”, and “External interface”. Each node contains properties corresponding to the formal model, such as type, subtype, and role.
- Edges are derived from a “connectivity list” as defined in the formal model.
| Listing 1. System model creation algorithm. |
| function CreateSystemModel(TOE_Description): FOR EACH Component in TOE_Description: // Determine node label based on Component.Type IF Component.Type == "ECU" OR Component.Type == "Communication" OR Component.Type == "ExternalInterface": // Create node with appropriate type label CREATE (:{Component.Type} { name: Component.Name, type: Component.Type, subtype: Component.Subtype, conn: Component.Conn, role: Component.Role, }) // Handle Asset nodes IF Component.Subtype == "asset": MATCH (c) WHERE c.name = Component.Name SET c.sub_type = "Asset", c.security_property = Component.SecurityProperty, c.impact = Component.Impact, c.Impact_rating = Component.ImpactRating // Create connections between components FOR EACH Conn IN TOE_Description.ConnectivityList: MATCH (src), (tgt) WHERE src.name = Conn.Source AND tgt.name = Conn.Target CREATE (src)-[:CONNECTS_TO]->(tgt) |
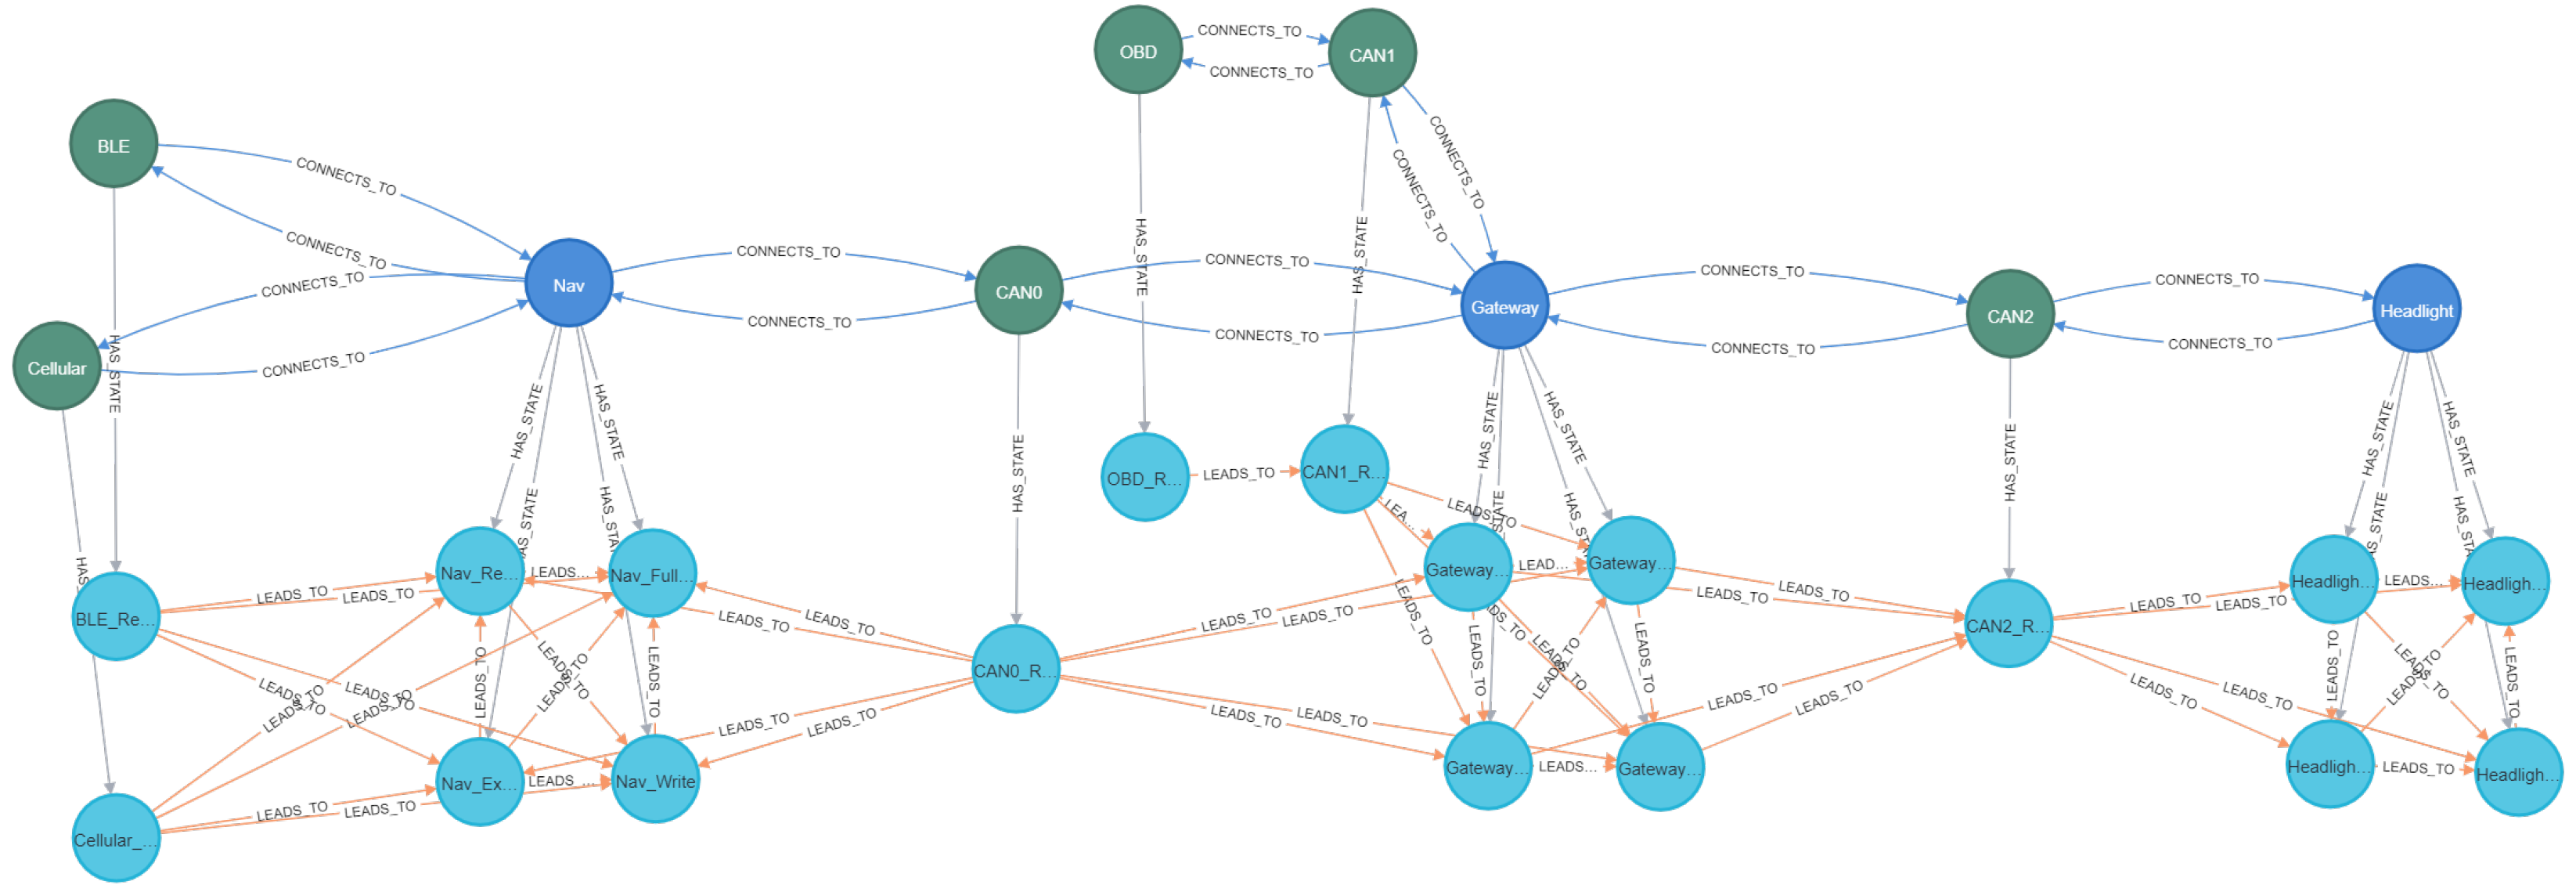
5.2.3. State Model Implementation
- For components where or where , a single state node is generated with .
- For components where , multiple state nodes are generated corresponding to the hierarchical privilege levels defined in the attacker privilege model: .
5.2.4. Relationships Creation
- HAS_STATE Relationship: This edge type establishes a mapping between system components and their corresponding state representations. Each component node () is associated with its potential state configurations () through directed edges that facilitate hierarchical traversal between the architectural and behavioral model layers.
- AFFECTS Relationship: These directed edges implement the vulnerability mapping between threats () and the system states they can potentially compromise.
- LEADS_TO Relationship: These edges constitute the graph-theoretical implementation of the state transition function (T). Each relationship instance represents a potential state transition that satisfies the guard conditions (g) defined in the formal model.
- CONNECTS_TO Relationship: These edges implement the connectivity constraints defined in the system model’s reachability list. They represent physical or logical communication channels between architectural components.
5.2.5. Vulnerability Association and Mapping Methodology
- STRIDE Classification: The algorithm verifies that each vulnerability’s STRIDE categorization aligns with the corresponding threat STRIDE categories for the target state’s privilege level as defined in Table 1.
- Component Type Compatibility: The mapping enforces architectural compatibility by validating that each vulnerability’s target component type (ECU, Communication, External Interface) matches the architectural classification of the corresponding state node’s parent component.
- Privilege Level: Each vulnerability is associated with state nodes that match the privilege levels as defined in the attacker privilege model.
| Listing 2. Vulnerability mapping algorithm. |
| function MapVulnerabilities(): // Map vulnerabilities to states with matching attributes MATCH (v:Vulnerability), (s:State), (c)-[:HAS_STATE]->(s) WHERE v.type CONTAINS c.type AND ANY(cat IN v.STRIDE WHERE cat IN s.stride) AND (v.priv == s.level OR v.priv_max >= s.level) CREATE (v)-[:AFFECTS]->(s) |
5.2.6. Attack Path Generation
- Topological Path Identification: Parameterized queries identify paths connecting external interface nodes to asset nodes while enforcing architectural connectivity and privilege monotonicity constraints:
- Threat Vector Integration: Each state transition is evaluated against applicable threat vectors according to the transition function (T), verifying that each transition satisfies all guard conditions (g) specified in Section 4.4.2.
- Security Property Validation: Path construction terminates upon reaching an asset state with a threat compromising a defined security property:
- Risk Quantification: Each path undergoes risk assessment using the affmax aggregation function:
| Listing 3. Attack path generation and validation algorithm. |
| function FindAttackPaths(source_type, target_type, algorithm_type) if algorithm_type in {"BFS", "DFS"} then paths ← GraphTraversal( start: State(type=source_type), end: State(sub_type=target_type), relation: "LEADS_TO", mode: algorithm_type, constraint: PrivilegeMonotonicity ) else if algorithm_type = "Dijkstra" then paths ← WeightedSearch( start: State(type=source_type), end: State(sub_type=target_type), relation: "LEADS_TO", weight: "weight", constraint: PrivilegeMonotonicity ) else if algorithm_type = "A*" then PrepareHeuristics(target_type) paths ← WeightedSearch( start: State(type=source_type), end: State(sub_type=target_type), relation: "LEADS_TO", weight: "weight", constraint: PrivilegeMonotonicity ) for each path in paths do feasibility ← affmax(ExtractFeasibilityMatrices(path)) impact ← GetImpactRating(path.targetNode) path.risk ← feasibility × impact return SortByMetrics(paths, ["feasibility", "length", "risk"]) |
5.2.7. Search Algorithm
- DFS (Depth-First Search): Identified 32500 unique attack paths with an execution time of 78.344 ms.
- BFS (Breath-First Search): Exhibited similar coverage with 32,500 attack paths but with a longer execution time at 108,342 ms.
- Dijkstra’s: Identified 30 optimized attack paths with an execution time of 380 ms.
- A*: Identified 54 optimized attack paths with an execution time of 394 ms.
6. Discussion
6.1. Path Analysis
- Initial access via OBD interface (UN-T18).
- Network traffic eavesdropping to gather system information (UN-T7).
- Our path uses system disruption techniques (UN-T24) rather than parameter manipulation (UN-T25) shown in the ISO example, but both achieve the same privilege level on the Gateway ECU.
- Additional eavesdropping for confirmation/feedback (UN-T7).
- Our path concludes with system disruption (UN-T24) directly targeting the Headlight functionality, which achieves the same end result as the parameter manipulation in the ISO example.
6.2. Validation
- Architectural Consistency: The fundamental attack progression through system components to target assets is aligned with the standard’s reference architecture.
- Attack Vector Representation: Critical attack vectors identified in the standard (diagnostic interface exploitation, message manipulation, privilege escalation) were represented in GAPP-generated paths.
- State Transition Validity: All generated paths exhibited state transitions consistent with the formal transition rules defined in Section 4.
- Recall Assessment: The paths from the ISO/SAE 21434 example were successfully identified by GAPP, yielding a recall of 100% for documented critical paths.
6.3. Discussion and Limitation
- Self-loops were eliminated from the state model to reduce path explosion.
- Backward transitions (lowering privilege levels) were excluded based on the assumption that attackers maintain or escalate privileges rather than relinquishing them.
- Monotonicity was assumed in privilege progression during attacks.
7. Conclusions
Author Contributions
Funding
Data Availability Statement
Acknowledgments
Conflicts of Interest
Abbreviations
| A* | A-star (search algorithm) |
| affmax | Aggregation Function for Feasibility Maximization |
| AG | State-based Attack Graphs |
| AT | Attack Tree |
| BAG | Bayesian Attack Graph |
| BFS | Breadth-First Search |
| BLE | Bluetooth Low Energy |
| CAN | Controller Area Network |
| CSMS | Cybersecurity Management System |
| CVSS | Common Vulnerability Scoring System |
| DFS | Depth-First Search |
| E/E | Electrical and Electronic |
| ECU | Electronic Control Unit |
| EFSM | Extended Finite State Machine |
| EVITA | E-safety Vehicle Intrusion Protected Applications |
| fc | Full Control (privilege level) |
| GAPP | Graph-based Attack Path Prioritization |
| GW | Gateway |
| HL | Headlight |
| MPAG | Multiple Prerequisite Attack Graph |
| MOST | Media Oriented Systems Transport |
| NAV | Navigation |
| OBD | On-Board Diagnostics |
| r | Read (privilege level) |
| r/w | Read/Write (privilege level) |
| STRIDE | Spoofing, Tampering, Repudiation, Information disclosure, Denial of service, |
| Elevation of privilege | |
| TARA | Threat Analysis and Risk Assessment |
| TOE | Target of Evaluation |
| UDS | Unified Diagnostic Services |
| UML | Unified Modeling Language |
| UNECE | United Nations Economic Commission for Europe |
| V2I | Vehicle-to-Infrastructure |
| V2V | Vehicle-to-Vehicle |
| V2X | Vehicle-to-Everything |
| w | Write (privilege level) |
References
- Dobaj, J.; Ekert, D.; Stolfa, J.; Stolfa, S.; Macher, G.; Messnarz, R. Cybersecurity Threat Analysis, Risk Assessment and Design Patterns for Automotive Networked Embedded Systems: A Case Study. J. Univers. Comput. Sci. (JUCS) 2021, 27, 830–849. [Google Scholar] [CrossRef]
- Mundhenk, P. Security for Automotive Electrical/Electronic (E/E) Architectures; Cuvillier Verlag: Göttingen, Germany, 2017. [Google Scholar]
- Boban, M.; Kousaridas, A.; Manolakis, K.; Eichinger, J.; Xu, W. Use cases, requirements, and design considerations for 5G V2X. arXiv 2017, arXiv:1712.01754. [Google Scholar]
- Lu, R.; Zhang, L.; Ni, J.; Fang, Y. 5G vehicle-to-everything services: Gearing up for security and privacy. Proc. IEEE 2019, 108, 373–389. [Google Scholar] [CrossRef]
- ISO/SAE 21434:2021; Road Vehicles—Cybersecurity Engineering. ISO: Geneva, Switzerland, 2021. Available online: https://www.iso.org/standard/70918.html (accessed on 24 May 2025).
- Saulaiman, M.N.E.; Csilling, A.; Kozlovszky, M. Integrated Automation for Threat Analysis and Risk Assessment in Automotive Cybersecurity Through Attack Graphs. Acta Polytech. Hung. 2025, 22, 149–168. [Google Scholar] [CrossRef]
- ISO 26262-1:2018; Road Vehicles—Functional Safety. ISO: Geneva, Switzerland, 2021. Available online: https://www.iso.org/standard/68383.html (accessed on 24 May 2025).
- UN Regulation No. 155—Cyber Security and Cyber Security Management System|UNECE. Available online: https://unece.org/transport/documents/2021/03/standards/un-regulation-no-155-cyber-security-and-cyber-security (accessed on 24 May 2025).
- Common Vulnerability Scoring System Version 4.0 Calculator. 2025. Available online: https://www.first.org/cvss/calculator/4-0 (accessed on 24 May 2025).
- ISO 11898-1:2024; Road Vehicles—Controller Area Network (CAN), Part 1: Data Link Layer and Physical Coding Sublayer. ISO: Geneva, Switzerland, 2021. Available online: https://www.iso.org/standard/86384.html (accessed on 24 May 2025).
- ISO 11898-2:2024; Road Vehicles—Controller Area Network (CAN), Part 2: High-Speed Physical Medium Attachment (PMA) Sublayer. ISO: Geneva, Switzerland, 2021. Available online: https://www.iso.org/standard/85120.html (accessed on 24 May 2025).
- Toghuj, W.; Turab, N. Automotive Ethernet architecture and security: Challenges and technologies. Int. J. Power Electron. Drive Syst./Int. J. Electr. Comput. Eng. 2023, 13, 5209. [Google Scholar] [CrossRef]
- ENISA. Cyber Security and Resilience of Smart Cars; ENISA: Athens, Greece, 2016. [Google Scholar]
- Koscher, K.; Czeskis, A.; Roesner, F.; Patel, S.; Kohno, T.; Checkoway, S.; McCoy, D.; Kantor, B.; Anderson, D.; Shacham, H.; et al. Experimental Security Analysis of a Modern Automobile. In Proceedings of the 2010 IEEE Symposium on Security and Privacy, Oakland, CA, USA, 16–19 May 2010; pp. 447–462. [Google Scholar] [CrossRef]
- Chartrand, G.; Zhang, P. A First Course in Graph Theory; Courier Corporation: North Chelmsford, MA, USA, 2013. [Google Scholar]
- Gross, J.L.; Yellen, J.; Anderson, M. Graph Theory and Its Applications; Chapman and Hall/CRC: Boca Raton, FL, USA, 2018; pp. 1–115. [Google Scholar]
- Mondal, B.; De, K. An overview applications of graph theory in real field. Int. J. Sci. Res. Comput. Sci. Eng. Inf. Technol. 2017, 2, 751–759. [Google Scholar]
- Dickson, A. Introduction to Graph Theory; CRC Press: Boca Raton, FL, USA, 2006. [Google Scholar]
- Grinberg, D. An introduction to graph theory. arXiv 2024, arXiv:2308.04512. [Google Scholar]
- Wilson, R.J. Introduction to Graph Theory; Pearson Education India: Noida, India, 1979. [Google Scholar]
- Jungnickel, D.; Jungnickel, D. Graphs, Networks and Algorithms; Springer: Berlin/Heidelberg, Germany, 2005; Volume 3. [Google Scholar]
- Baier, C.; Katoen, J.P. Principles of Model Checking; The MIT Press Ser; The MIT Press: Cambridge, MA, USA; London, UK, 2008. [Google Scholar]
- Rich, E. Automata, Computability and Complexity: Theory and Applications; Pearson Prentice Hall: Upper Saddle River, NJ, USA, 2008. [Google Scholar]
- Salfer, M. Automotive Security Analyzer for Exploitability Risks: An Automated and Attack Graph-Based Evaluation of On-Board Networks; Springer Fachmedien: Wiesbaden, Germany, 2024. [Google Scholar] [CrossRef]
- Hong, J.B.; Kim, D.S.; Chung, C.J.; Huang, D. A survey on the usability and practical applications of graphical security models. Comput. Sci. Rev. 2017, 26, 1–16. [Google Scholar] [CrossRef]
- Kordy, B.; Piètre-Cambacédès, L.; Schweitzer, P. DAG-based attack and defense modeling: Don’t miss the forest for the attack trees. Comput. Sci. Rev. 2014, 13, 1–38. [Google Scholar] [CrossRef]
- Sheyner, O.; Haines, J.; Jha, S.; Lippmann, R.; Wing, J.M. Automated generation and analysis of attack graphs. In Proceedings of the 2002 IEEE Symposium on Security and Privacy, Berkeley, CA, USA, 12–15 May 2002; pp. 273–284. [Google Scholar]
- Schneier, B. Attack trees. Dr. Dobb’s J. 1999, 24, 21–29. [Google Scholar]
- Ingols, K.; Lippmann, R.; Piwowarski, K. Practical attack graph generation for network defense. In Proceedings of the 2006 22nd Annual Computer Security Applications Conference (ACSAC’06), Miami Beach, FL, USA, 11–15 December 2006; pp. 121–130. [Google Scholar]
- Ou, X.; Boyer, W.F.; McQueen, M.A. A scalable approach to attack graph generation. In Proceedings of the 13th ACM Conference on Computer and Communications Security, Alexandria, VA, USA, 30 October–3 November 2006; pp. 336–345. [Google Scholar]
- Saulaiman, M.N.E.; Kozlovszky, M.; Csilling, Á.; Banati, A.; Benhamida, A. Overview of Attack Graph Generation For Automotive Systems. In Proceedings of the 2022 IEEE 10th Jubilee International Conference on Computational Cybernetics and Cyber-Medical Systems (ICCC), Reykjavík, Iceland, 6–9 July 2022; pp. 000135–000142. [Google Scholar]
- Tayouri, D.; Baum, N.; Shabtai, A.; Puzis, R. A Survey of MulVAL Extensions and Their Attack Scenarios Coverage. IEEE Access 2023, 11, 27974–27991. [Google Scholar] [CrossRef]
- Salfer, M.; Eckert, C. Attack graph-based assessment of exploitability risks in automotive on-board networks. In Proceedings of the 13th International Conference on Availability, Reliability and Security, Hamburg, Germany, 27–30 August 2018; pp. 1–10. [Google Scholar]
- Boudermine, A.; Khatoun, R.; Choyer, J.H. Dynamic logic-based attack graph for risk assessment in complex computer systems. Comput. Netw. 2023, 228, 109730. [Google Scholar] [CrossRef]
- Barik, M.S.; Sengupta, A.; Mazumdar, C. Attack graph generation and analysis techniques. Def. Sci. J. 2016, 66, 559. [Google Scholar] [CrossRef]
- Yekta, A.R.; Spychalski, D.; Yekta, E.; Yekta, C.; Katzenbeisser, S. VATT&EK: Formalization of Cyber Attacks on Intelligent Transport Systems—A TTP based approach for Automotive and Rail. In Proceedings of the 7th ACM Computer Science in Cars Symposium, Darmstadt, Germany, 5 December 2023; pp. 1–17. [Google Scholar]
- Henniger, O.; Ruddle, A.; Seudié, H.; Weyl, B.; Wolf, M.; Wollinger, T. Securing vehicular on-board it systems: The evita project. In Proceedings of the VDI/VW Automotive Security Conference, Ingolstadt, Germany, 27–28 November 2009; Volume 41. [Google Scholar]
- ISO/IEC 15408-1:2022; Information Security, Cybersecurity and Privacy Protection—Evaluation Criteria for IT Security. ISO: Geneva, Switzerland, 2022. Available online: https://www.iso.org/standard/72891.html (accessed on 24 May 2025).
- Ruddle, A.; Ward, D.; Weyl, B.; Idrees, S.; Roudier, Y.; Friedewald, M.; Leimbach, T.; Fuchs, A.; Gürgens, S.; Henniger, O.; et al. Deliverable D2. 3: Security requirements for automotive on-board networks based on dark-side scenarios. EVITA Proj. 2009. Available online: https://evita-project.org/deliverables.html (accessed on 14 January 2025).
- Dürrwang, J.; Sommer, F.; Kriesten, R. Automation in automotive security by using attacker privileges. In Proceedings of the 19th Escar Europe—The World’s Leading Automotive Cyber Security Conference, Escar Europe, Frankfurt, Germany, 10–11 November 2021; pp. 137–152. [Google Scholar] [CrossRef]
- Abouelnaga, M.; Jakobs, C. Security Risk Analysis Methodologies for Automotive Systems. arXiv 2023, arXiv:2307.02261. [Google Scholar]
- Sommer, F. Automatic Attack Path Generation in Automotive Model-Based Security Testing. Ph.D. Thesis, Institute of Distributed Systems Faculty of Engineering, Computer Science and Psychology, Ulm University, Ulm, Germany, 2024. [Google Scholar]
- Alberts, C.J.; Behrens, S.G.; Pethia, R.D.; Wilson, W.R. Operationally Critical Threat, Asset, and Vulnerability Evaluation (OCTAVE) Framework, Version 1.0; Technical Report; Carnegie Mellon University: Pittsburgh, PA, USA, 1999. [Google Scholar]
- Karahasanovic, A.; Kleberger, P.; Almgren, M. Adapting threat modeling methods for the automotive industry. In Proceedings of the 15th ESCAR Conference, Berlin, Germany, 7–8 November 2017; pp. 1–10. [Google Scholar]
- Saulaiman, M.; Csilling, A.; Kozlovszky, M. Leveraging Attack Graphs in Automotive Threat Analysis and Risk Assessment. In Proceedings of the SECURWARE 2023: The Seventeenth International Conference on Emerging Security Information, Systems and Technologies, Porto, Portugal, 25–29 September 2023. [Google Scholar]
- Alagar, V.; Periyasamy, K. Specification of Software Systems; Texts in Computer Science; Springer: London, UK, 2011. [Google Scholar] [CrossRef]
- Sommer, F.; Kriesten, R.; Kargl, F. Survey of Model-Based Security Testing Approaches in the Automotive Domain. IEEE Access 2023, 11, 55474–55514. [Google Scholar] [CrossRef]
- Luo, F.; Jiang, Y.; Wang, J.; Li, Z.; Zhang, X. A framework for cybersecurity requirements management in the automotive domain. Sensors 2023, 23, 4979. [Google Scholar] [CrossRef] [PubMed]
- National Vulnerability Database (NVD). 2025. Available online: https://nvd.nist.gov/ (accessed on 14 January 2025).
- Checkoway, S.; McCoy, D.; Kantor, B.; Anderson, D.; Shacham, H.; Savage, S.; Koscher, K.; Czeskis, A.; Roesner, F.; Kohno, T. Comprehensive experimental analyses of automotive attack surfaces. In Proceedings of the 20th USENIX Security Symposium (USENIX Security 11), San Francisco, CA, USA, 8–12 August 2011. [Google Scholar]
- Dürrwang, J. Steigerung der Betriebssicherheit von Personenkraftwagen Durch Bedrohungsanalysen für die Informationssicherheit. Ph.D. Thesis, Technische Universität München, Münich, Germany, 2022. [Google Scholar]
- Miller, C.; Valasek, C. A Survey of Remote Automotive Attack Surfaces. In Proceedings of the Black Hat USA, Las Vegas, NV, USA, 2–7 August 2014; pp. 1–94. [Google Scholar]
- Angermeier, D.; Wester, H.; Beilke, K.; Hansch, G.; Eichler, J. Security risk assessments: Modeling and risk level propagation. ACM Trans. Cyber-Phys. Syst. 2023, 7, 1–25. [Google Scholar] [CrossRef]
- Robinson, I.; Webber, J.; Eifrem, E. Graph Databases: New Opportunities for Connected Data; O’Reilly Media, Inc.: Sebastopol, CA, USA, 2015. [Google Scholar]
- Anuyah, S.; Bolade, V.; Agbaakin, O. Understanding graph databases: A comprehensive tutorial and survey. arXiv 2024, arXiv:2411.09999. [Google Scholar]
- Vukotic, A.; Watt, N.; Abedrabbo, T.; Fox, D.; Partner, J. Neo4j in Action; Manning Publications Co.: Shelter Island, NY, USA, 2014. [Google Scholar]
- Pelofske, E.; Liebrock, L.M.; Urias, V. Cybersecurity threat hunting and vulnerability analysis using a Neo4j graph database of open source intelligence. arXiv 2023, arXiv:2301.12013. [Google Scholar]
- Noel, S.; Harley, E.; Tam, K.H.; Gyor, G. Big-data architecture for cyber attack graphs: Representing security relationships in NoSQL graph databases. In Proceedings of the IEEE Symposium on Technologies for Homeland Security (HST), Waltham, MA, USA, 14–16 April 2015; pp. 1–6. [Google Scholar]
- Wang, Y.; Ren, Y.; Cui, Z.; Yu, H. Proactive security defense: Cyber threat intelligence modeling for connected autonomous vehicles. arXiv 2024, arXiv:2410.16016. [Google Scholar]


| Privilege Level | STRIDE Categories |
|---|---|
| Read/Write (Communication Systems) | Spoofing, Tampering, Information Disclosure, Denial of Service (S, T, I, D) |
| Execute (ECU Systems) | Spoofing, Tampering, Repudiation, Denial of Service, Elevation of Privilege (S, T, R, D, E) |
| Read (ECU Systems) | Spoofing, Tampering, Repudiation, Information Disclosure, Elevation of Privilege (S, T, R, I, E) |
| Write (ECU Systems) | Spoofing, Tampering, Repudiation, Elevation of Privilege (S, T, R, E) |
| Full Control (ECU Systems) | Spoofing, Tampering, Repudiation, Elevation of Privilege (S, T, R, E) |
| UN Threat | STRIDE | Type | SP |
|---|---|---|---|
| UN-T1: “Back-end servers used as a means to attack a vehicle or extract data” | T, I, E | ECU | C, I, A |
| UN-T2: “Services from back-end server being disrupted, affecting the operation of a vehicle” | D | ECU | A |
| UN-T3: “Vehicle-related data held on back-end servers being lost or compromised (’data breach’)” | I, T | ECU | C, I |
| UN-T4: “Spoofing of messages or data received by the vehicle” | S | C | C |
| UN-T5: “Communication channels used to conduct unauthorized actions” | T | C | C, I |
| UN-T6: “Messages/data are modified in transit” | S | C | C, I |
| UN-T7: “Eavesdropping on vehicle communication channels” | I | C | C |
| UN-T8: “Denial of service attacks via communication channels to disrupt vehicle functions” | D | C | A |
| UN-T9: “Connection to unauthorized communication partners” | S | C | C, I, A |
| UN-T10: “Viruses embedded in communication media are able to infect vehicle system | T | C | C, I |
| UN-T11: “Messages received by the vehicle (for example X2V or diagnostic messages), or transmitted within it, contain malicious content” | T | C | C, I |
| UN-T12: “Misuse or compromise of update procedures” | T, E | ECU | C, I |
| UN-T13: “It is possible to deny legitimate updates” | D | ECU, C | A |
| UN-T15: “Legitimate actors are able to take actions that would unwittingly facilitate a cyber-attack” | T, I, D | ECU | C, I, A |
| UN-T16: “Manipulation of the connectivity of vehicle functions” | S, T, D | ECU, External interface | C, I, A |
| UN-T17: “Hosted 3rd party software, e.g., entertainment applications, used as a means to attack vehicle systems” | S, T, I, D | ECU | C, I, A |
| UN-T18: “Devices connected to external interfaces, e.g., USB ports, OBD port, used as a means to attack vehicle systems” | S, T, E | External interface | C, I |
| UN-T19: “Extraction of vehicle data/code” | I | ECU | C |
| UN-T20: “Manipulation of vehicle data/code” | T, R, I | ECU | C, I |
| UN-T21: “Erasure of data/code” | T, R | ECU | C, I |
| UN-T22: “Introduction of malware” | T | ECU | C, I |
| UN-T23: “Introduction of new software or overwrite existing software” | T, E | ECU | C, I |
| UN-T24: “Disruption of systems or operations” | D | ECU | A |
| UN-T25: “Manipulation of vehicle parameters” | T | ECU | A, I |
| UN-T26: “Cryptographic technologies can be compromised or are insufficiently applied” | S, D, I, E | ECU, C | C, I, A |
| UN-T27: “Parts or supplies could be compromised to permit vehicles to be attacked” | T | ECU | |
| UN-T28: “Software or hardware development permits vulnerabilities” | T, E | ECU | C, I |
| UN-T29: “Network design introduces vulnerabilities” | S, I, D, T | C | C,I,A |
| UN-T30: “Physical loss of data” | T, D | ECU | C, I, A |
| UN-T31: “Unintended transfer of data can occur” | I | ECU, C | C, I |
| UN-T32: “Physical manipulation of systems can enable an attack” | T | ECU | C, I |
| Threat ID | STRIDE | Type | Feasibility | Privilege | Security Property |
|---|---|---|---|---|---|
| UN-T5 | T | C | {4, 4, 5, 4, 4} | r/w | C, I |
| UN-T6 | S | C | {4, 3, 5, 4, 4} | r/w | C, I |
| UN-T16 | S, T, D | ECU | {2, 3, 3, 1, 4} | ex, r, w, fc | C, I, A |
| UN-T18 | S, T, E | External | {1, 3, 3, 1, 4} | r/w, ex, r, w, fc | C, I |
| UN-T19 | I | ECU | {4, 6, 5, 4, 4} | r | C |
| UN-T24 | D | ECU | {4, 6, 5, 4, 7} | ex | A |
| UN-T28 | T, E | ECU | {4, 6, 5, 4, 7} | ex, r, w, fc | C, I |
| Threat | ET | SE | KoIC | WoO | EQ |
|---|---|---|---|---|---|
| UN-T18 | 1 | 3 | 3 | 1 | 4 |
| UN-T6 | 4 | 3 | 5 | 4 | 4 |
| UN-T28 | 4 | 6 | 5 | 4 | 7 |
| UN-T5 | 4 | 4 | 5 | 4 | 4 |
| UN-T19 | 4 | 6 | 5 | 4 | 4 |
| affmax | 4 | 6 | 5 | 4 | 7 |
| Algorithm | Paths Found | Execution Time (ms) | Time per Path (ms) | Computational Complexity |
|---|---|---|---|---|
| DFS | 32,500 | 78,172 | 2.4 | |
| BFS | 32,500 | 108,627 | 3.3 | |
| Dijkstra | 30 | 472 | 15.7 | |
| A* | 54 | 403 | 7.5 |
| Paths | Path Length | Feasibility Matrix | Normalized Feasibility | Risk |
|---|---|---|---|---|
| [UN-T18, UN-T7, UN-T24, UN-T7, UN-T24] | 4 | [3, 4, 4, 4, 4] | 1.5 | 3 |
| [UN-T18, UN-T7, UN-T24, UN-T8, UN-T24] | 4 | [3, 4, 4, 4, 4] | 1.5 | 3 |
| [UN-T16, UN-T16, UN-T5, UN-T24, UN-T6, UN-T24] | 5 | [3, 4, 4, 4, 4] | 1.5 | 3 |
| [UN-T18, UN-T8, UN-T25, UN-T7, UN-T25] | 4 | [3, 5, 5, 4, 4] | 1 | 2 |
| [UN-T18, UN-T6, UN-T25, UN-T8, UN-T24] | 4 | [3, 5, 5, 4, 4] | 1 | 2 |
| [UN-T18, UN-T6, UN-T25, UN-T7, UN-T24] | 4 | [3, 5, 5, 4, 4] | 1 | 2 |
| [UN-T18, UN-T5, UN-T24, UN-T5, UN-T25] | 4 | [3, 5, 5, 4, 4] | 1 | 2 |
| [UN-T18, UN-T7, UN-T25, UN-T7, UN-T25] | 4 | [3, 5, 5, 4, 4] | 1 | 2 |
| [UN-T18, UN-T8, UN-T24, UN-T6, UN-T25] | 4 | [3, 5, 5, 4, 4] | 1 | 2 |
Disclaimer/Publisher’s Note: The statements, opinions and data contained in all publications are solely those of the individual author(s) and contributor(s) and not of MDPI and/or the editor(s). MDPI and/or the editor(s) disclaim responsibility for any injury to people or property resulting from any ideas, methods, instructions or products referred to in the content. |
© 2025 by the authors. Licensee MDPI, Basel, Switzerland. This article is an open access article distributed under the terms and conditions of the Creative Commons Attribution (CC BY) license (https://creativecommons.org/licenses/by/4.0/).
Share and Cite
Saulaiman, M.N.-E.; Kozlovszky, M.; Csilling, A. Graph-Based Automation of Threat Analysis and Risk Assessment for Automotive Security. Information 2025, 16, 449. https://doi.org/10.3390/info16060449
Saulaiman MN-E, Kozlovszky M, Csilling A. Graph-Based Automation of Threat Analysis and Risk Assessment for Automotive Security. Information. 2025; 16(6):449. https://doi.org/10.3390/info16060449
Chicago/Turabian StyleSaulaiman, Mera Nizam-Edden, Miklos Kozlovszky, and Akos Csilling. 2025. "Graph-Based Automation of Threat Analysis and Risk Assessment for Automotive Security" Information 16, no. 6: 449. https://doi.org/10.3390/info16060449
APA StyleSaulaiman, M. N.-E., Kozlovszky, M., & Csilling, A. (2025). Graph-Based Automation of Threat Analysis and Risk Assessment for Automotive Security. Information, 16(6), 449. https://doi.org/10.3390/info16060449