Article

Pricing in the Sharing Economy—A Hybrid Approach Leveraging Econometrics, Machine Learning, and Artificial Intelligence

by
Kornilios Vezyroglou
* and
Fotios Siokis
*
Department of Balkan, Slavic & Oriental Studies, University of Macedonia, 156 Egnatia Street, GR-546 36 Thessaloniki, Greece
*
Authors to whom correspondence should be addressed.
Information 2025, 16(6), 450; https://doi.org/10.3390/info16060450
Submission received: 20 February 2025 / Revised: 26 April 2025 / Accepted: 23 May 2025 / Published: 27 May 2025
(This article belongs to the Special Issue AI Tools for Business and Economics)

Abstract

:
This study investigates the determinants of Airbnb prices in Athens and Thessaloniki, Greece, employing a hybrid approach combining econometric analysis, machine learning techniques, and artificial intelligence tools. Our findings highlight the significance of location, property type, host responsiveness, listing quality, and photograph quality in influencing rental prices. Notably, we leverage a publicly available AI tool to assess the esthetic and technical quality of listing photos, demonstrating its positive impact on rental prices. This underscores the increasing importance of visual marketing in the sharing economy and the democratization of AI tools for optimizing pricing strategies. We also conduct machine learning analysis, employing algorithms like Random Forest, k-Nearest Neighbors, Support Vector Machine, Neural Network, Gradient Boosting, and AdaBoost. Both AdaBoost and Gradient Boosting demonstrate strong performance across various metrics, with AdaBoost showing an advantage. The study offers valuable insights for Airbnb hosts, platform developers, and policymakers in understanding and optimizing pricing strategies within the short-term rental market.

1. Introduction

The sharing economy, characterized by the exchange of underutilized assets through peer-to-peer platforms [1], has transformed traditional ownership concepts [2]. Airbnb, a leading platform in the accommodation sector, exemplifies this shift, empowering individuals to become hospitality providers [3]. This research introduces an interdisciplinary approach to studying short-term rental markets, integrating econometric analysis, machine learning, and AI tools to understand pricing dynamics. We address a gap in existing research by quantifying the impact of listing photograph quality on rental prices using AI-generated photo quality scores. This study is motivated by the need to provide practical guidance to Airbnb hosts, many of whom lack formal pricing strategies [4,5]. Our findings aim to optimize pricing strategies and enhance listing attractiveness for practitioners or policymakers.
The remainder of this paper is organized as follows: Section 2 provides a theoretical framework for Airbnb’s function. Section 3 presents a literature review, while the following section details the data processing and methodology used in this study. The empirical results of the econometric analysis are presented in Section 5. Section 6 conducts various robustness checks based on machine learning. Finally, Section 7 summarizes our findings. Tables and figures can be found at the end.

2. Theoretical Background

Airbnb, built on the principle of “host anything, anywhere, so guests can enjoy everything, everywhere”, operates as a platform connecting travelers seeking accommodations with residents offering their properties [6]. This creates a diverse range of options, from private rooms to entire homes, catering to a wide array of traveler preferences. Airbnb leverages technology to enhance the user experience, employing machine learning algorithms to optimize search results and facilitate transactions.
Beyond simply providing lodging, Airbnb taps into travelers’ desire for novel experiences [7]. The platform has expanded to offer locally curated experiences, both in-person and online, immersive adventures led by local guides, and specialized services for business travelers, including top-rated accommodations and collaborative workspaces.
The host landscape on Airbnb has evolved significantly. While it initially attracted individual residents looking to monetize their properties, it now includes a mix of residential hosts and commercial entities. Hosts create free accounts, provide detailed property information, and set their own pricing and availability. For a 3% service fee, hosts receive benefits such as customer support, marketing assistance, and insurance coverage. Guests, on the other hand, typically pay a service fee of around 14%, with potential additional charges for cleaning or extra guests.
Airbnb generates value for multiple stakeholders [8,9]. Hosts can generate income from their assets, while travelers gain access to unique, personalized, and often more affordable accommodations compared to traditional hotels. This increased accessibility to travel benefits communities through increased spending in local businesses and the creation of new jobs in various sectors. For example, research has shown a link between Airbnb activity and restaurant revenue growth [10].
However, Airbnb’s growth and evolution have also sparked concerns. Studies have examined the impact of Airbnb on the hotel industry, with meta-analyses suggesting a negative effect, particularly on budget hotels, although the extent of this impact is debated [11]. Another significant concern relates to Airbnb’s influence on housing markets. Research across various cities has demonstrated that a greater Airbnb presence can lead to higher property values and rents [12,13,14,15]. The magnitude of this effect remains a subject of ongoing research and debate, with various factors influencing the relationship between Airbnb and housing costs [16,17]. These concerns have fueled discussions about appropriate regulations for Airbnb, with many cities attempting to mitigate potential negative impacts on housing and the hotel industry. However, policy responses have often been characterized by rigid rules rather than evidence-based approaches [18,19,20].

3. Literature Review

Price setting in Airbnb has been gradually gaining academic interest, along with the rising popularity of the platform. The main body of academic research comes from the USA [21]. Authors have focused on features of the listed property, such as accommodation type, the number of beds and rooms, included facilities like Wi-Fi or parking, etc. [22,23] Size and functionality have proven to be statistically significant determinants of the final price.
In contrast to owners with only one listing, those with multiple listings are more strongly influenced by listing attributes when setting prices [24]. The adage “location, location, location” appears to be particularly relevant to Airbnb listings [25,26], as research consistently demonstrates that guests prioritize convenience and accessibility.
Another area of research evolves around the notion of ‘trust’ [27,28,29]. Host attributes like a verified status and the existence of profile pictures have a positive impact on the price [30,31,32,33] find responsiveness to be a statistically significant price driver. Several authors have explored the importance of the “Superhost” badge. Airbnb Superhost status is a recognition awarded to hosts who consistently provide exceptional hospitality, meeting criteria like high response rates, great reviews, and low cancelation rates. It is a way for Airbnb to highlight their most reliable and welcoming hosts. According to some, guests are willing to pay a premium to “Superhosts” [34,35,36]. Nevertheless, there is also evidence that suggests a potential negative or null effect in certain contexts [37,38].
The average review score has also been investigated. Some authors [31,39,40] suggest that achieving star rating allows hosts to increase their charges. A noteworthy fact, though, is that Airbnb reviews rarely fall below four out of five stars. Guests might hesitate to leave negative reviews out of fear of rejection from prospective guests [41]. An interesting finding is that listings with a larger number of ratings are associated with lower prices [31,42]. This is probably because cheaper alternatives tend to gather more reservations and thus a larger number of reviews.
Additionally, factors like years of hosting experience or hosts’ personal photos can have a marginal impact on revenue generation [43]. Moving on to other factors, ref. [44] highlights the importance of the market dynamics, implying that all hosts could follow strategies to adjust their prices on demand, while ref. [45] found that rental rules can also affect prices.
While the impact of other factors on Airbnb listings has been extensively studied, the effect of photo number and quality remains underexplored. In the same vein, refs. [42,46] found a positive correlation between photo quantity and listing prices, while [47] had also noted that a higher number of high-quality photos positively influences both prices and occupancy rates. Zhang et al. (2017) [48] demonstrated that the esthetic quality of listing photos, also assessed via machine learning, leads to increased earnings. In the same vein, ref. [49] conducted an econometric analysis on content features (living room, bedroom, interior design) and esthetic features (clarity, brightness, contrast) of Airbnb photos, finding that the former had a larger impact than the latter on booking rate and revenues. Hu et al. (2023) [50] combine a SOR (The SOR model, short for Stimulus-Organism-Response, is a theoretical framework used in various fields of academic research, including psychology, marketing, and environmental studies. It explains how external stimuli (S) influence an organism’s internal state (O), leading to a behavioral response (R)) model with a hedonic price model to highlight that images with more pixels or more brightness or cool hues lead to higher Airbnb prices. Finally, Kirkos’ (2022) [51] study examines the determinants of Airbnb occupancy rate, bookings, and revenue, based exclusively on machine learning techniques.

4. Data and Design

In our analysis, we use a cross-sectional sample of 2000 data points, representing property listings on Airbnb on 25 December 2023. Half of the listings are spread throughout the municipality of Athens, not in the periphery of the city, and the other half are within Thessaloniki metropolitan area (the country’s second-largest city).
The data used in this analysis was sourced from Inside Airbnb, a website launched in 2016 that collects and analyzes data from Airbnb. To ensure the feasibility of conducting comprehensive analyses across various AI platforms within the available research period, a sample size of 2000 observations was deemed appropriate for this stage of the research. AI-based robustness checks will be conducted to assess the generalizability of findings to a wider range of listings.
For reasons of data quality and relevance, we did not include a) observations with missing or ‘non-applicable’ values: These entries were excluded as they represent missing completely at random (MCAR) data. According to [52,53], excluding MCAR data is generally considered safe and avoids introducing bias into the analysis that could arise from imputation methods based on potentially fragile assumptions. Also, we excluded b) observations with minimum nights set above 60: this exclusion aligns with current (as of July 2024) domestic legislation, which prohibits stays longer than two months. From the remaining observations, we randomly sampled 1000 listings in Athens and 1000 in Thessaloniki.
We then employed a set of ordinary least squares (OLS) hedonic price regression models to investigate the drivers of Airbnb prices in the city, where the natural logarithm of the sale price (LNPRICE) is the dependent variable. To avoid unnecessary complexity and noise in the model, we reduced the number of variables in the initial dataset trying to avoid the problem of multicolinearity. This involved removing highly correlated variables, such as individual review scores for aspects like cleanliness and location, as these showed almost perfect positive correlation with the overall review score. We also excluded the host verification variable, as 99% of hosts were already verified. The log transformation of the sale price reduces the problem of heteroscedasticity associated with the highly skewed price variable. The hedonic price function, originally given by [54], takes the following form:
P = P ( x , ε ) ,
where P is the price in natural log of the Airbnb listing, x is a vector of explanatory variables, with specific characteristics of the listings and ε is the residual term.
Specifically, we measure the following function:
LNPRICE = f (DAYS, R_1_H, ACC_R, SUPER, LIST, DOWNTOWN, ENTIRE, ACCOM, NIGHTS, INSTANT, REVIEWS, REVIEW_SCORE, AI_SCORE, FILE_SIZE)
This study examines how various factors influence Airbnb listing prices. We expect more experienced hosts (longer DAYS on the platform), responsive hosts (R_1_H for ‘response within one hour’, ACC_R for ‘acceptance rate’), and Superhosts (SUPER) to command higher prices. The effect of managing multiple listings (LIST) is uncertain, as it could lead to economies of scale or signal greater professionalism.
Location is accounted for using DOWNTOWN, with listings in central areas hypothesized to be more expensive. Property type (ENTIRE), guest capacity (ACCOM), minimum stay (NIGHTS), instant booking availability (INSTANT), and review metrics (number of REVIEWS, REVIEW_SCORE) are also included in the analysis.
Our regression analysis includes a variable related to the listing’s cover image, which has been shown to significantly impact demand more than other photos [55] (Li et al., 2022). This research also suggests that optimizing photo layout can increase bookings by 11% and booked days by two to five per year. While the authors defined “optimal photo quality” using technical image characteristics analyzed with a convolutional neural network (CNN), they did not specify the exact characteristics. Building on their work, we use a new, publicly available neural network (Everypixel) to assess both the esthetic and technical quality of photos, aiding developers in content moderation. Ten estimation parameters for this model were established by a group of 10 professional photographers. Then, the model was trained on 347,000 user Instagram photos. We uploaded the 2000 cover photos of our sampled observations to Everypixel, and the model assigned a percentage score (variable AI_SCORE) to each one. It is important to note that we selected this model thanks to its robustness, after thoroughly testing other options. Initially, we experimented with Gemini, a large language model (LLM) developed by Google AI, trained on a vast dataset of text and code. We uploaded all 1000 cover photos and provided clear criteria for assigning a percentage quality score and binary values to specific dummy variables. However, we observed that Gemini occasionally produced inconsistent results for the same image, even when using identical prompts. We then moved to Copilot, a conversational chat interface developed by Microsoft that uses LLMs to assist users with a wide array of tasks and facilitate their decision-making. The results were as unstable as in Gemini. We assessed another free online AI quality scoring platform (Photor AI), but again the results were inconsistent from one day to another.
Finally, we uploaded our photos on the online editing tool Lunapic, to measure the file size of the main photo (FILE_SIZE), expressed as natural log. While file size is not a direct measure of image quality, it serves as a valuable proxy in this context.
Table 1 presents descriptive statistics of the sample. The wide range of average daily prices depicts the variety of lodging alternatives in both cities. The distribution of host experience (DAYS) is extensive, from newly registered hosts (6 days) to those with substantial tenure (4932 days), suggesting potential heterogeneity in host behavior and listing quality. Most hosts in the sample are responsive, with 88.8% responding within one hour. The high percentage of hosts who respond within one hour, as well as the high acceptance rate (95%), reflect a willingness to accommodate guest requests. The proportion of Superhosts is 49.6%, indicating a balanced mix of experienced and newer hosts. The number of listings per host varies, from single listings to a maximum of 329. This vast dispersion highlights potential differences in hosting strategies and business models.
The verification of IDs for 98.9% of hosts indicates a high level of transparency and trustworthiness within the platform. Most listings (95.8%) are entire apartments, with an average capacity of around four guests. This sets Thessaloniki and Athens apart from other cities, where the proportion of entire homes to shared rooms is more evenly distributed. The average length of stay in our sample is 2.3 nights, based on official statistics, (as of December 2023 (https://www.statistics.gr/documents/20181/f4ea8594-ece6-360e-a97e-fe80aa538557) (accessed on 23 June 2024)). The availability of instant booking for over half of the listings (57%) caters to the growing demand for immediate confirmation and hassle-free booking. Finally, a wide range in AI scoring and file size of the main listing photo were traced. This might reflect varying degrees of attention paid to photo quality by different hosts.
Table 2 presents the correlation matrix among all variables. The majority of correlations fall below 0.2, with only a few exceeding 0.3, demonstrating a limited linear relationship between most pairs. This absence of strong correlations suggests that the independent variables do not exhibit significant multicollinearity, supporting their selection for modeling the dependent variable.

5. Empirical Results

The empirical results are presented in Table 3. The Breusch–Pagan–Godfrey test indicated heteroscedasticity in the initial regression, which was addressed by using robust Huber–White–Hinkley (HC1) standard errors. The centered Variance Inflation Factors (VIFs), ranging from 1.08 to 1.47, suggest no substantial multicollinearity. The model explains a good degree of the variation in the natural log of Airbnb prices. While there is a possible endogeneity issue, the model’s high statistical significance level (F-statistic = 70.9026, p = 0.0000) and the use of heteroskedasticity-consistent standard errors mitigate this concern. Furthermore, given the focus on identifying factors associated with variation in natural log price rather than establishing strict causality, any potential bias introduced by endogeneity is unlikely to alter the main conclusions.
The empirical findings of this regression analysis reveal several key factors that significantly influence Airbnb prices. First, the analysis confirms the importance of location-specific attributes and the positive relation with the price variable. Favorably positioned listings (DOWNTOWN) command a premium, reflected in the positive and statistically significant coefficient. This is consistent with the expectation that properties in prime locations, offering proximity to attractions and amenities, are more desirable and thus, more expensive.
Additionally, entire homes (ENTIRE), as well as the maximum capacity of the listing, (ACCOM) are associated with a price increase relative to private rooms. This indicates that guests place a higher value on the privacy and exclusivity afforded by entire properties, leading them to accept a price premium compared to options involving shared spaces. In addition, entire homes can normally accommodate more people.
Moving on, we see that guests reward speed in communication: hosts who offer instantly bookable properties (INSTANT) receive a premium. The positive coefficient of the number of listings (LIST) suggests that hosts with more listings tend to have higher prices. This outcome suggests that hosts with numerous listings may be more professional and experienced in managing their properties. They might have greater knowledge of the market and utilize data-driven tools to enhance pricing strategies for each listing. They could also increase their investments by maintaining and upgrading their properties. Alternatively, they could experiment with different pricing strategies on some listings without risking their overall income. They could be more inclined to set slightly higher prices, understanding that even if some listings remain vacant, others will compensate for it. In any case, a higher number of listings may be perceived as a sign of quality and reliability.
An increase in the number of reviews (REVIEWS) is linked with a slight decrease in price, a result that supports past research findings. The AI-generated quality score of Airbnb listings (AI_SCORE) positively affects price, and so does the file size (FILE_SIZE), consistent with prior research emphasizing the significance of high-quality pictures. While earlier studies on the link between Superhost status and pricing on Airbnb have produced inconsistent findings, our research demonstrates a robust statistically significant positive correlation between these two variables. Finally, although the rest factors were initially hypothesized to have an impact on our dependent variable, the empirical analysis did not find statistically significant evidence to support this.

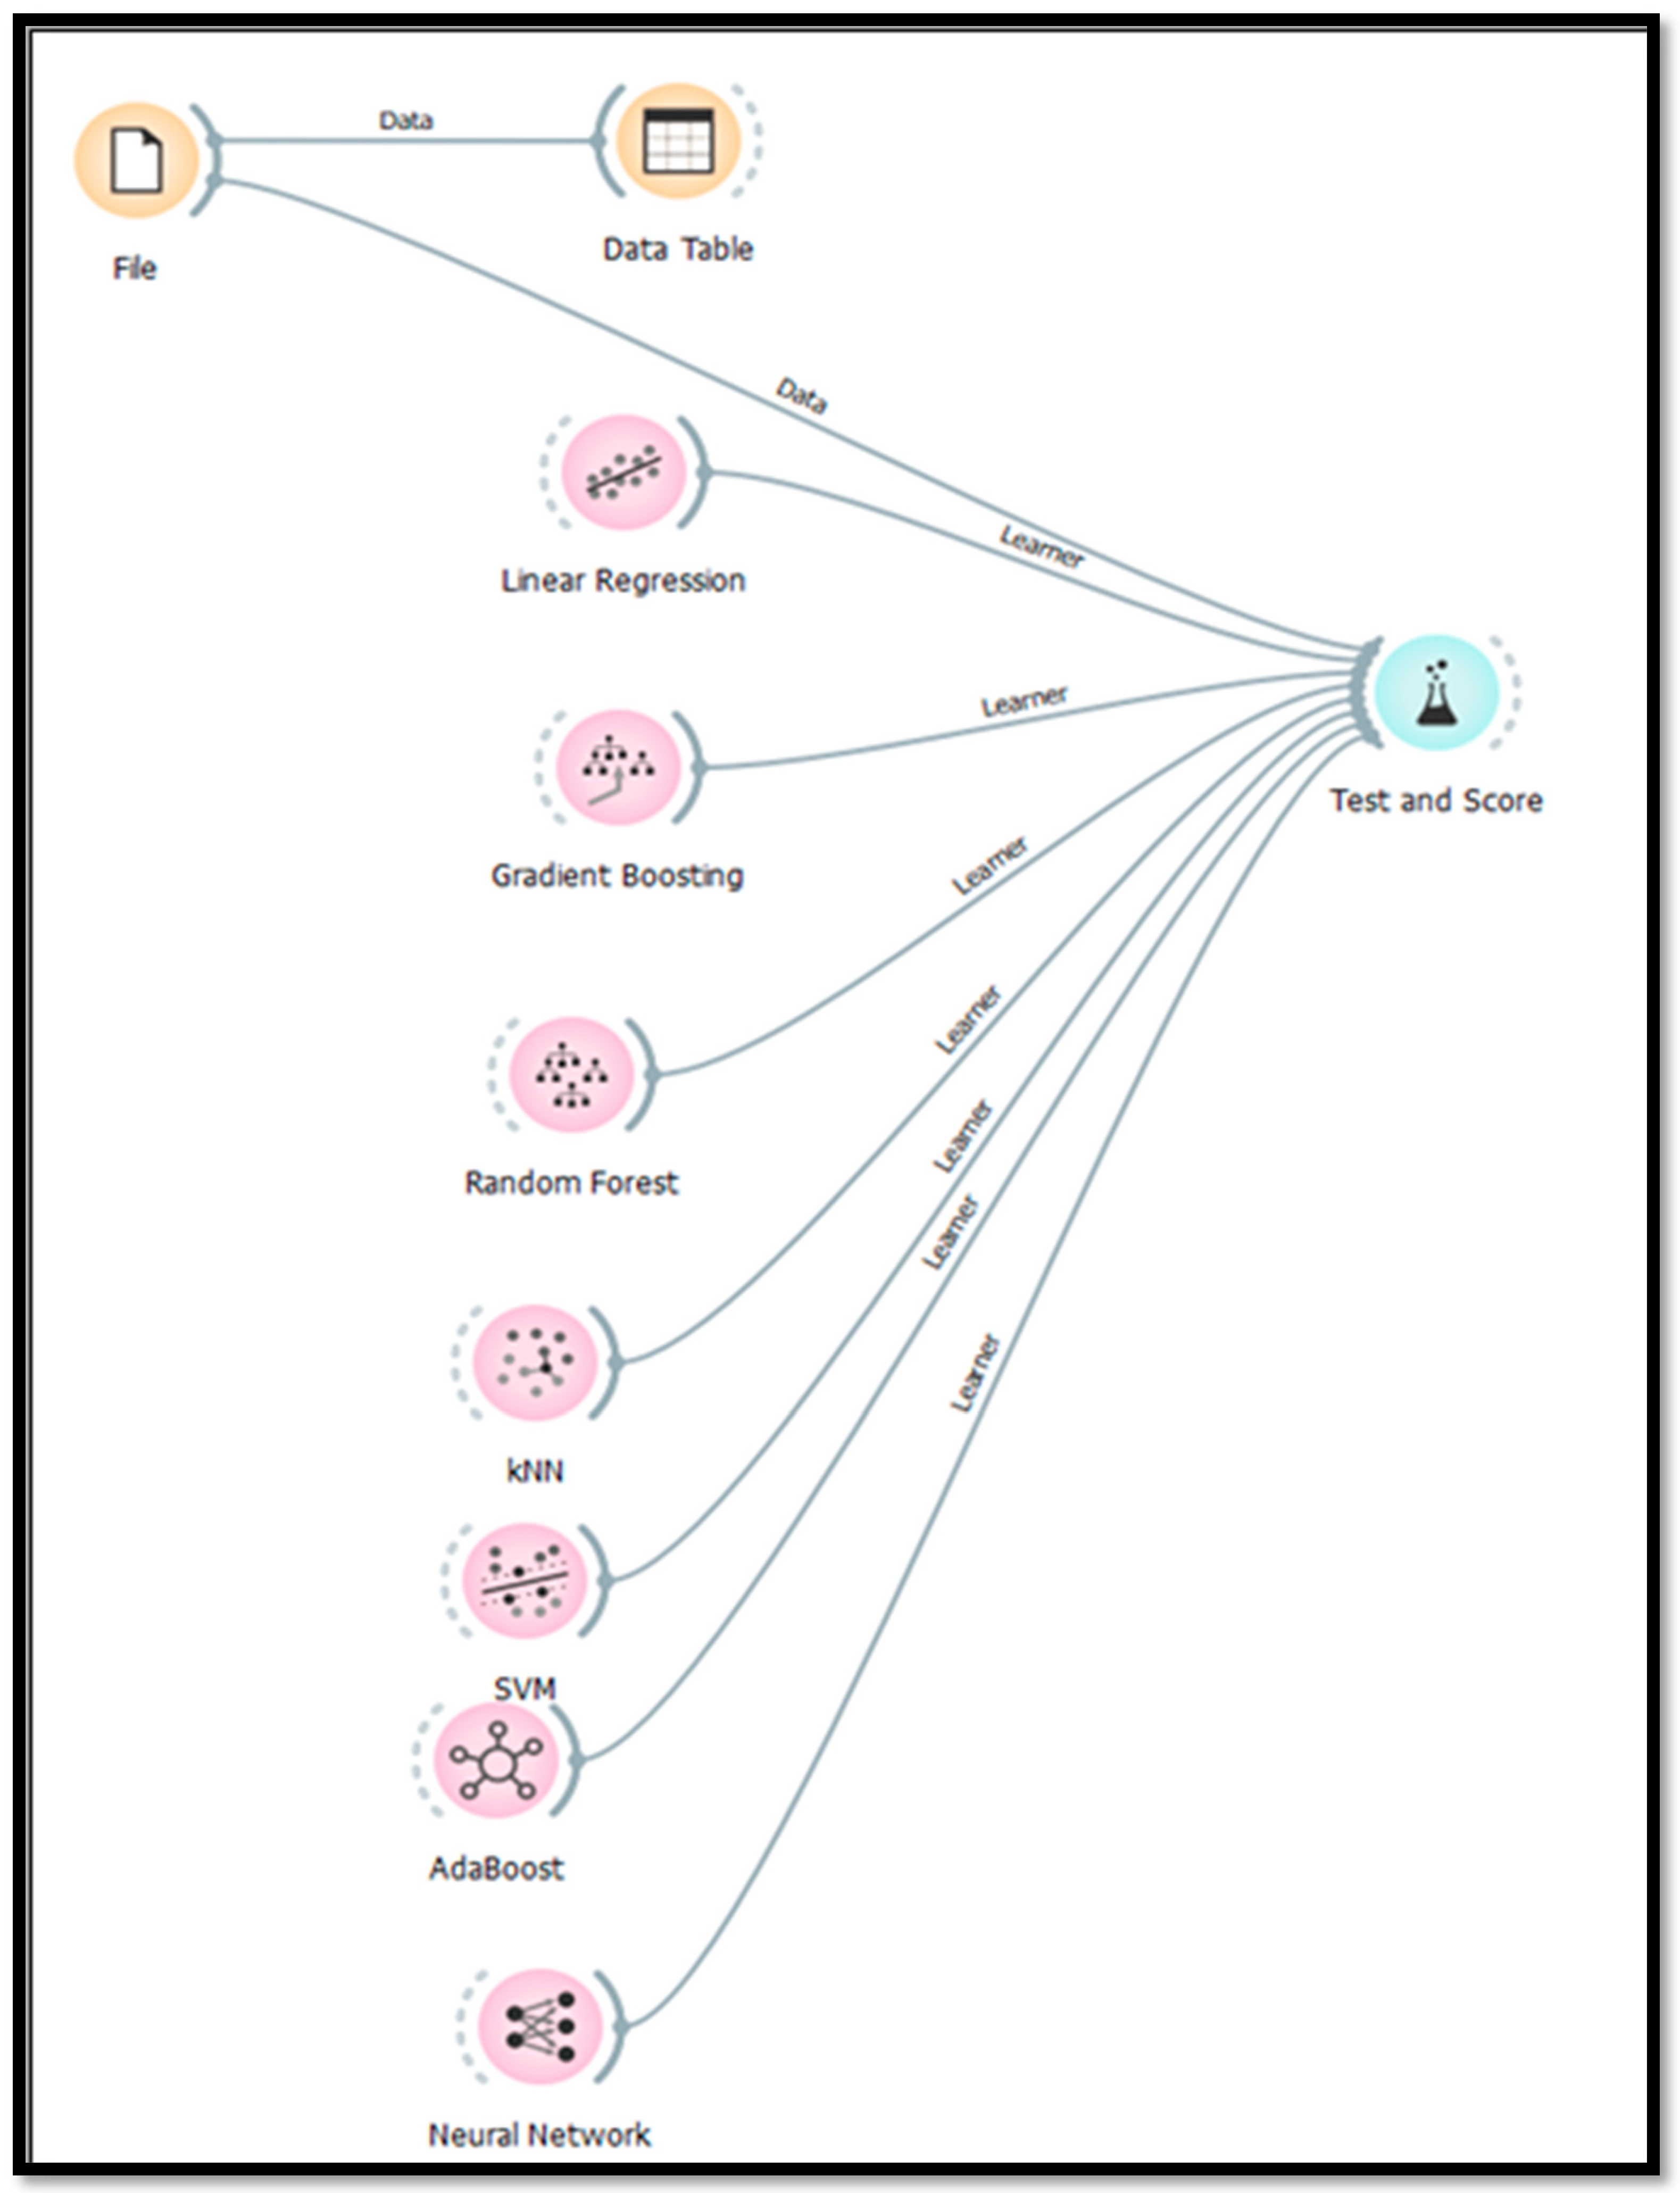
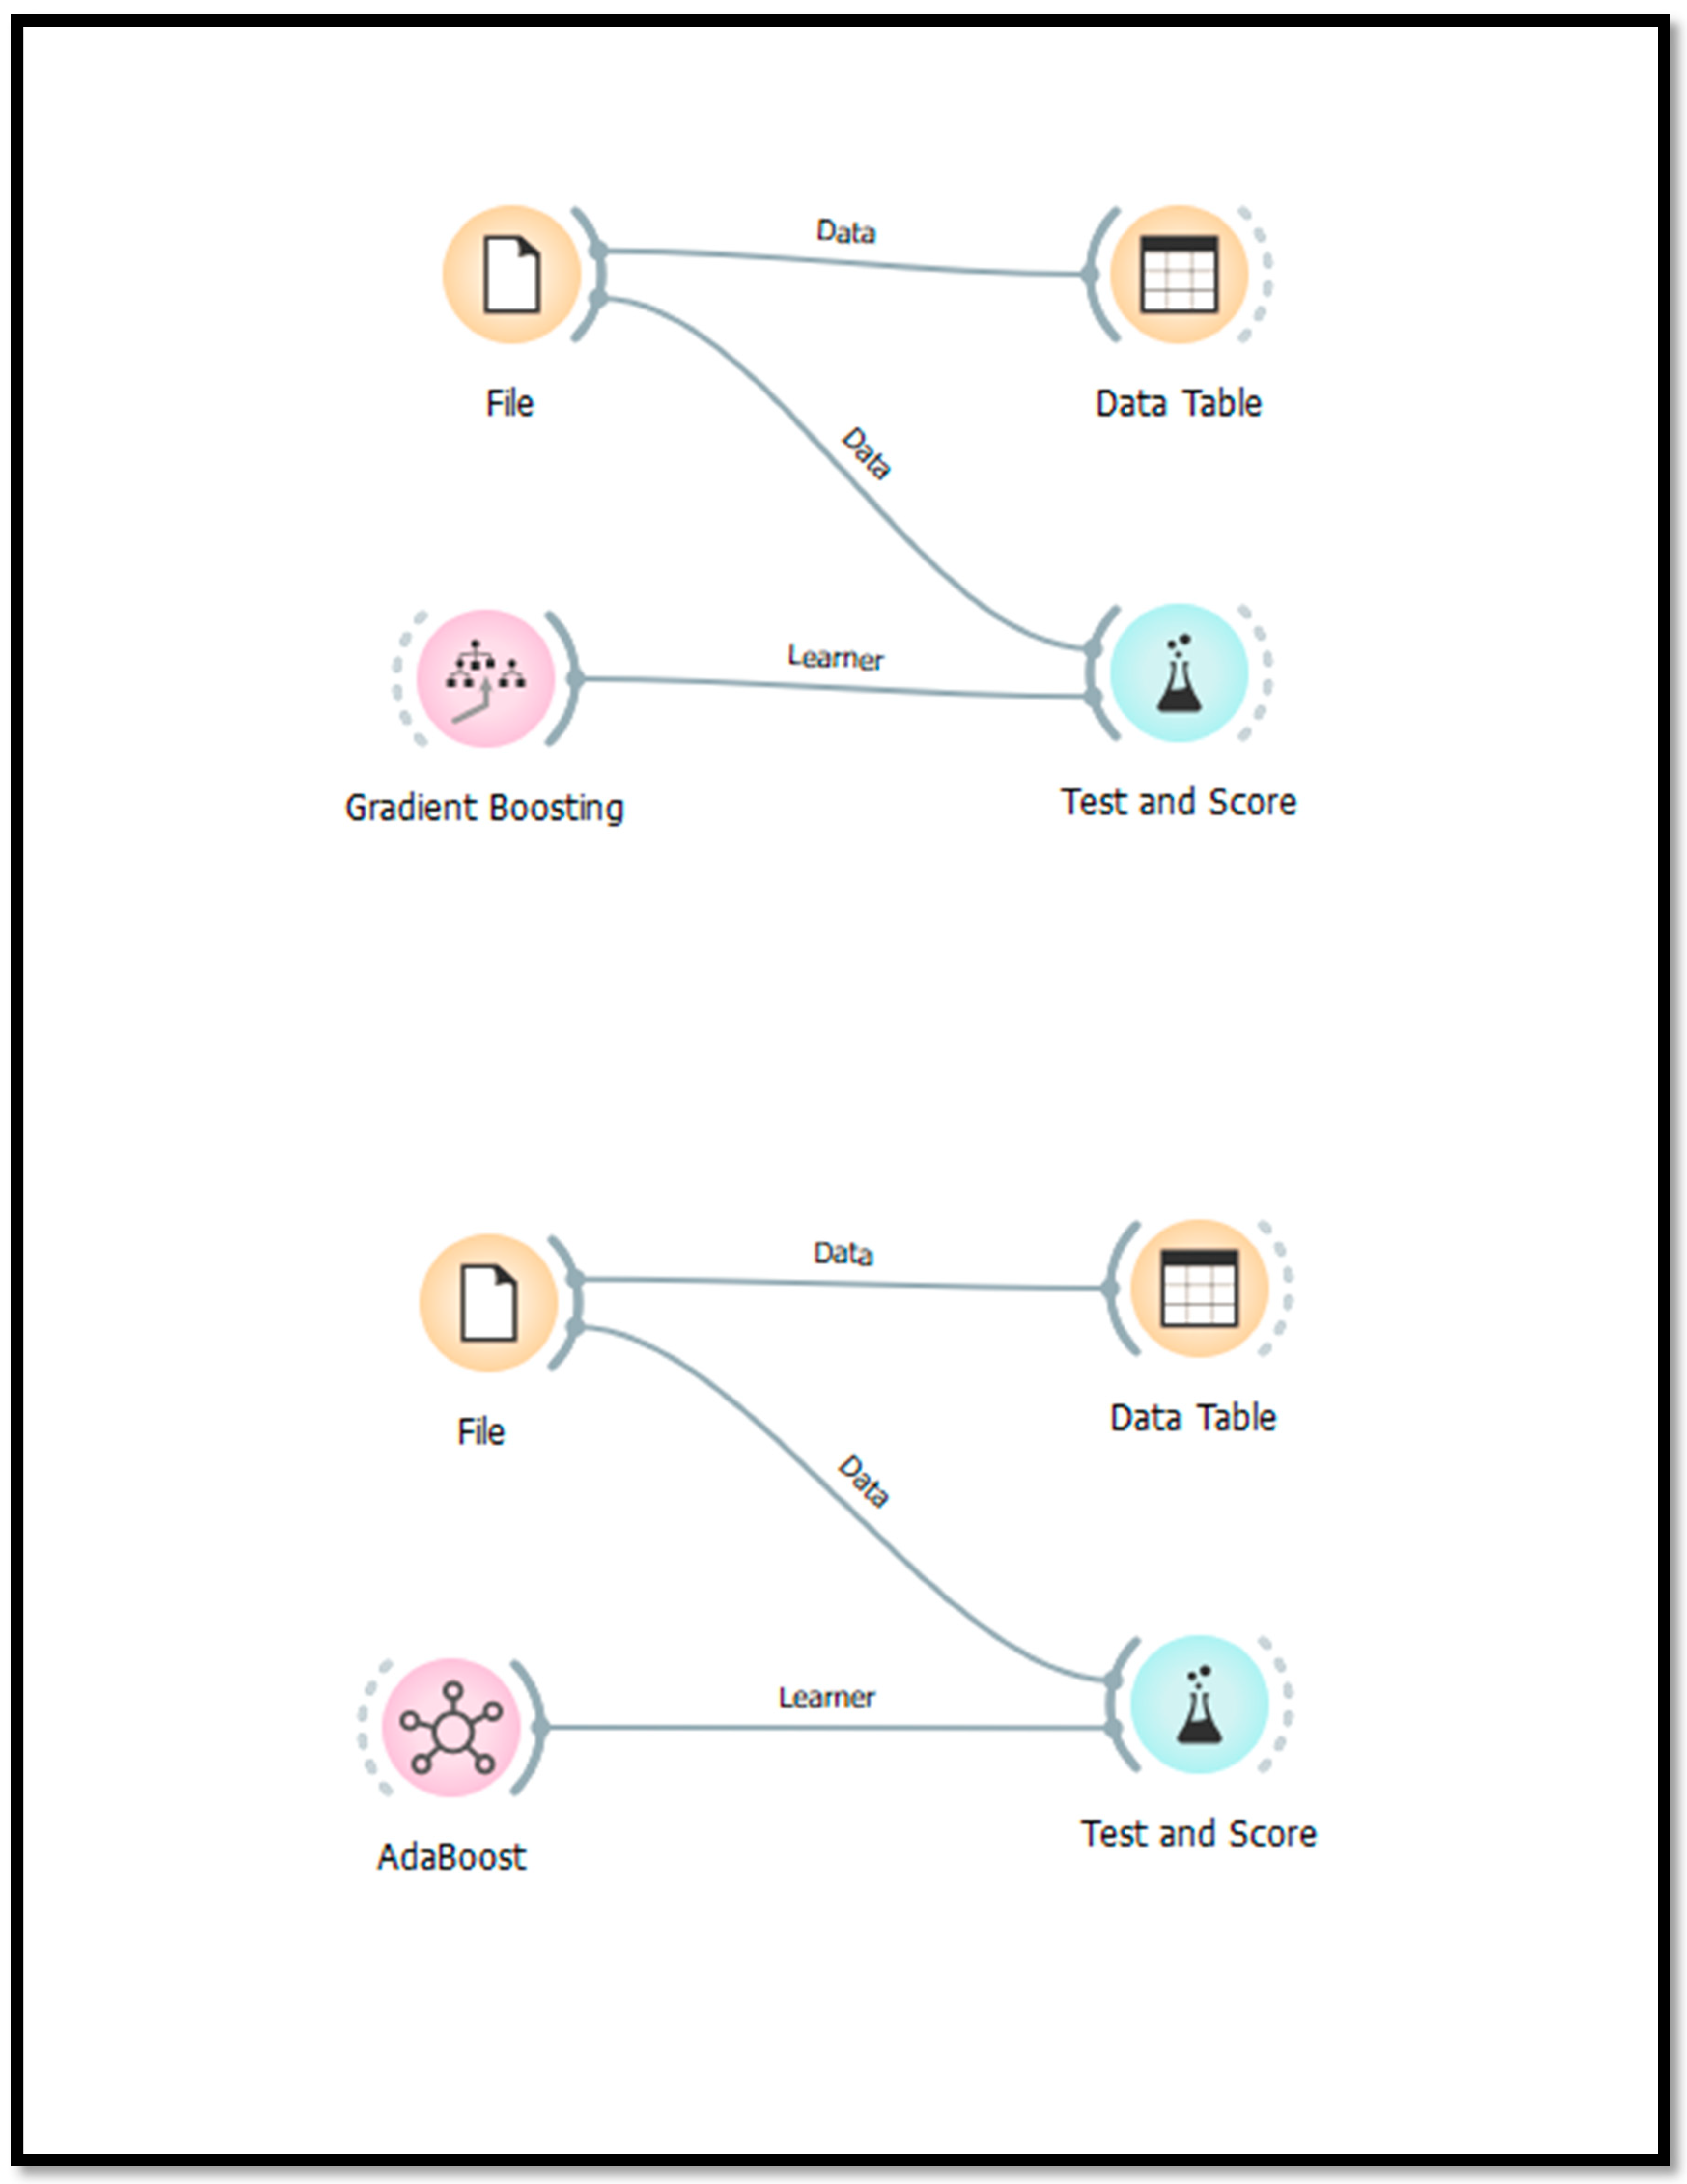
6. Machine Learning Analysis

6.1. Design Process

In this section, we employ machine learning (ML) tools to assess the robustness of, and deepen, our prior econometric analysis (some of the technical information in this subsection was retrieved/inspired from the website: https://fastercapital.com/topics/machine-learning.html (accessed on 4 September 2024)). ML, a subset of AI, is dedicated to creating algorithms (in machine learning, the terms “algorithm”, “learner”, “estimator” and “model” are often used interchangeably) that empower computers to learn from data and enhance their task performance, without explicit programming. This allows computers to recognize patterns, make decisions, and perform tasks based on data.
The employment of ML can offer a compelling complement to classical econometric analysis when analyzing Airbnb price determinants. First, ML models excel at capturing complex and non-linear relationships between variables, while classical econometrics often depends on linear assumptions, which might not adequately reflect market realities [56,57]. Additionally, ML offers a wide range of algorithms, providing more flexibility than traditional econometric analysis to choose the best model for a specific problem and make more precise predictions [58]. However, this predictive power comes at the cost of reduced interpretability. By strategically combining the two approaches, we can achieve a comprehensive understanding of our subject.
For our analysis, we utilize the Orange data mining platform. Orange is an open-source data science toolkit offering a visual programming interface for interactive data exploration, machine learning, and model evaluation. It features a wide array of built-in algorithms for various learning tasks, making it a versatile tool for researchers and practitioners.
ML can be divided into supervised, unsupervised and reinforcement learning. Supervised learning uses labeled (i.e., known, processed) data to train algorithms for tasks like classification and regression. Contrastingly, unsupervised learning uses raw data to find hidden patterns or groupings. Reinforcement learning works through trial and error, receiving human feedback (penalties or rewards), and is often used in game playing and robotics. Given that our dataset is already prepared for the prior econometric analysis, we will focus on supervised learning algorithms. Thus, our dataset was directly input into the Orange workflow without any preprocessing steps.
We begin by outlining the selected machine learning algorithms, based on their diverse strengths in addressing key aspects of model robustness. Specifically, these algorithms were selected for their ability to: (1) capture non-linear relationships (Random Forest, k-Nearest Neighbors, Support Vector Machine, Neural Network); and (2) mitigate overfitting (Random Forest, Gradient Boosting, AdaBoost).
Our initial analysis employs the default parameter settings provided by Orange for each algorithm. This allows us to establish baseline performance for different models using their standard configurations, carefully chosen by developers to offer reasonable performance across various datasets. The workflow for this initial assessment within the Orange data mining tool is depicted in Figure 1.
Next, we focus on the two most promising algorithms and manually fine-tune their parameters to optimize predictive accuracy. This fine-tuning process involves systematic trial and error to identify the parameter settings that yield the best performance on the testing set.
After optimizing the two top performers, we re-evaluate all models to determine the best performing one. Afterwards, we experiment with different training/testing split ratios (e.g., 70/30, 75/25) to assess the sensitivity of the final model’s performance to the amount of training data (the default one is 80/20).
The entire evaluation process concludes with cross-validation, a technique that partitions the data into folds (ten by default) and repeatedly trains and tests the model, holding out one fold for testing and using the remaining folds for training. This process is repeated so that each fold serves as the test set, and the results are averaged across all folds. Cross-validation offers a more robust performance estimate than a single random train–test split by reducing the influence of a potentially lucky (or unlucky) split. Furthermore, we employ stratified sampling during both random sampling and cross-validation to ensure that the class distribution in the original dataset is preserved in the training and testing sets.

6.2. Machine Learning Analysis Empirical Results

Our initial results are shown in Table 4. We begin by employing random sampling with 10 repetitions and an 80% training set size. The main finding is that AdaBoost demonstrates superior performance across all metrics, showing the highest ability to minimize both the magnitude and frequency of prediction errors. Gradient Boosting exhibits the second-best results.
As our AdaBoost model in Orange uses decision trees, which can inherently handle categorical data, there was no need to continuize the data. In terms of ML, data continuization is a process that transforms categorical data (data that represents characteristics or groups) into a numerical (continuous) format. However, to optimize the model, we manually experimented with its properties. After numerous manual refinement efforts, we ended with a combination of parameters that yielded an improvement in all metrics (Mean Squared Error/Root Mean Squared Error/Mean Absolute Error/Mean Absolute Percentage Error/R-squared). More specifically, the initial score is based on the assumption of 50 estimators, while the optimized version comes from 100.
Similarly, we experimented with the Gradient Boosting parameters. After numerous attempts, we discovered that increasing the number of decision trees from 50 to 100 and setting the ‘do not split subsets smaller than’ parameter from 2 to 8 yielded better results. Any node in the decision tree will only be split if it has at least eight samples. This parameter helps control the growth of the tree and can prevent overfitting by ensuring that splits are only made when there is enough data to justify them. It also helps in maintaining a balance between model complexity and generalization. The workflow for the fine-tuning process of both Adaboost and Gradient Boosting is depicted in Figure 2.
Our findings after fine-tuning both Adaboost and Gradient Boosting properties are shown in Table 5. Overall, while both models are effective, Adaboost exhibits a slight edge over Gradient Boosting across all performance metrics. More specifically, AdaBoost slightly outperforms Gradient Boosting in terms of Mean Squared Error (0.212 vs. 0.216), Root Mean Squared Error (0.460 vs. 0.464), Mean Absolute Error (0.320 vs. 0.330), and Mean Absolute Percentage Error (0.083 vs. 0.086). Additionally, AdaBoost has a higher R-squared value (0.391 vs. 0.379), indicating better overall predictive accuracy. This finding aligns with the general expectation that ML techniques often yield superior prognostic results compared to classical econometric models (in our initial analysis, the OLS regression yielded an R-squared value of 33.3%).
Finally, according to the design process presented in the previous subsection, we altered the training/testing split ratios. However, no combination other than the default one (80/20) led to better results. We also experimented by splitting the data into 20 folds (the only option above the default one of 10), but again, this did not yield higher performance for the selected algorithms.

7. Conclusions—Discussion

This research examines factors influencing Airbnb pricing in Athens and Thessaloniki, Greece, using econometrics, machine learning, and AI tools. An econometric model revealed that location, property type, guest capacity, host responsiveness, and host experience significantly affect prices. Most importantly, the esthetic quality of listing photos, assessed by the AI tool Everypixel, also plays a crucial role.
Machine learning models, particularly Adaboost, provided further insights, slightly outperforming the econometric model in explanatory power. This highlights the potential of combining traditional analysis with AI. The study confirms the importance of location, property characteristics, and host reputation in Airbnb pricing, while also emphasizing the growing role of visual marketing and AI in the sharing economy. This has implications for hosts, platform developers, and policymakers.
Hosts can practically use the findings by enhancing their pricing strategies and listing presentation through specific actions such as investing in high-quality photographs and ensuring prompt responsiveness to guest inquiries. Utilizing AI photo quality assessments, they should focus on improving the esthetic and technical aspects of their listing photos, which can significantly boost their rental prices and booking rates. Platform developers can integrate AI-driven insights into their algorithms by prioritizing listings with high-quality photos and responsive hosts, thereby enhancing market efficiency and fairness. They can also provide hosts with tools and recommendations based on AI analysis to optimize their listings. Policymakers might need to implement regulatory measures to address potential issues related to AI-driven pricing and visual marketing, such as ensuring transparency in pricing algorithms and preventing discriminatory practices. In the AI era, they should also ensure that no fictitious, AI-generated pictures are presented as real, maintaining the integrity and trustworthiness of the platform. Establishing guidelines to balance the interests of hosts, guests, and the housing market will promote fair competition and protect consumer rights.
This research, however, is not without its drawbacks. The cross-sectional nature of the data limits the ability to capture temporal dynamics and potential seasonality effects in pricing. Additionally, while the sample size of 2000 listings is substantial, it may not fully encompass the entire spectrum of Airbnb properties. The reliance on a single AI tool for assessing photo quality, while innovative, could introduce some degree of subjectivity. Future research could address these issues by incorporating longitudinal data, expanding the sample size to include a wider range of properties, and exploring alternative AI-based photo assessment tools to enhance the robustness and generalizability of the findings.
Finally, AI evaluation inherently risks cultural and demographic biases due to skewed data and varying quality perceptions. Robust mitigation is crucial for equitable outcomes. Addressing these biases ensures fairness in AI assessment frameworks. One solution could be employing diverse annotators trained in cultural sensitivity to label data in a nuanced and unbiased way. Also, a regular assessment of the AI’s performance across different groups could detect and address emerging biases.

Author Contributions

Conceptualization, K.V. and F.S.; methodology, K.V. and F.S.; software, K.V.; validation, K.V.; formal analysis, K.V.; investigation, K.V.; resources, K.V.; data curation, K.V.; writing—original draft preparation, K.V.; writing—review and editing, K.V. and F.S.; visualization, K.V.; supervision, F.S.; project administration, K.V.; funding acquisition, K.V. All authors have read and agreed to the published version of the manuscript.

Funding

This research received no external funding.

Institutional Review Board Statement

Ethical review and approval were waived for this study due to the use of publicly available, anonymized data that does not involve interaction with human participants.

Data Availability Statement

The original contributions presented in this study are included in the website https://insideairbnb.com/. Further inquiries can be directed to the corresponding authors.

Conflicts of Interest

The authors declare no conflict of interest.

References

  1. Xiao, B.; Lee, Y.; Lim, K.; Tan, C.-W. The sharing economy: Promises and challenges. Internet Res. 2019, 29, 993–995. [Google Scholar] [CrossRef]
  2. Görög, G. The definitions of sharing economy: A systematic literature review. Management 2018, 13, 175–189. [Google Scholar] [CrossRef]
  3. Guttentag, D. Progress on Airbnb: A literature review. J. Hosp. Tour. Technol. 2019, 10, 814–844. [Google Scholar] [CrossRef]
  4. Li, J.; Moreno, A.; Zhang, D. Agent behavior in the sharing economy: Evidence from Airbnb. SSRN Electron. J. 2015, 1298, 10–2139. [Google Scholar] [CrossRef]
  5. Abrate, G.; Sainaghi, R.; Mauri, A. Dynamic pricing in Airbnb: Individual versus professional hosts. J. Bus. Res. 2022, 141, 191–199. [Google Scholar] [CrossRef]
  6. Lutz, C.; Newlands, G. Choice and Discrimination in the Sharing Economy. SSRN Electron. J. 2018. [Google Scholar] [CrossRef]
  7. Lee, T.H.; Crompton, J. Measuring novelty seeking in tourism. Ann. Tour. Res. 1992, 19, 732–751. [Google Scholar] [CrossRef]
  8. Reinhold, S.; Dolnicar, S. Chapter 4–How Airbnb Creates Value. In Peer-to-Peer Accommodation Networks: Pushing the Boundaries; Dolnicar, S., Ed.; Goodfellow Publishers: Oxford, UK, 2017; pp. 39–53. [Google Scholar]
  9. Hati, S.R.; Balqiah, T.E.; Hananto, A.; Yuliati, E. A decade of systematic literature review on Airbnb: The sharing economy from a multiple stakeholder perspective. Heliyon 2021, 7, e08222. [Google Scholar] [CrossRef]
  10. Basuroy, S.; Kim, Y.; Proserpio, D. Sleeping with Strangers: Estimating the Impact of Airbnb on the Local Economy. In Proceedings of the AMA Educators Proceedings, San Diego, CA, USA, 14–16 February 2020. [Google Scholar]
  11. Yang, Y.; Nieto-Garcia, M.; Viglia, G.; Nicolau, J.L. Competitors or complements: A meta-analysis of the effect of Airbnb on hotel performance. J. Travel Res. 2021, 61, 1508–1527. [Google Scholar] [CrossRef]
  12. Chaudhary, A. Effects of Airbnb on the Housing Market: Evidence from London. SSRN Electron. J. 2021, 10. [Google Scholar] [CrossRef]
  13. Franco, S.F.; Santos, C.D.; Longo, R.S. The impact of Airbnb on residential property values and rents: Evidence from Portugal. Reg. Sci. Urban Econ. 2021, 88, 103667. [Google Scholar] [CrossRef]
  14. Thackway, W.; Kok, M.; Lee, C.; Shi, V.; Pettit, C. Spatial variability of the “Airbnb effect”: A spatially explicit analysis of Airbnb’s impact on housing prices in Sydney. ISPRS Int. J. Geo-Inf. 2022, 11, 65. [Google Scholar] [CrossRef]
  15. Garcia-López, M.; Jofre-Monseny, J.; Martínez-Mazza, R.; Segu, M. Do short-term rental platforms affect housing markets? Evidence from Airbnb in Barcelona. J. Urban Econ. 2020, 119, 103278. [Google Scholar] [CrossRef]
  16. Barron, K.; Kung, E.; Proserpio, D. The effect of home-sharing on house prices and rents: Evidence from Airbnb. Mark. Sci. 2021, 40, 23–47. [Google Scholar] [CrossRef]
  17. Ekeroma, J.E. The Airbnb phenomenon: A Qualitative Analysis of Its Consequences on Urban Housing Markets. Preprints 2023. [Google Scholar] [CrossRef]
  18. Svensson, S.; Thelander, Å. Governing Airbnb: A comparative analysis of regulatory strategies in European cities. Tour. Plan. Dev. 2020, 17, 417–433. [Google Scholar]
  19. Gubler, Z.J. The challenges of regulating Airbnb. Fordham Urban Law J. 2021, 48, 437–478. [Google Scholar]
  20. OECD. Regulation of Short-Term Rentals: Evidence and Considerations; OECD Publishing: Paris, France, 2022. [Google Scholar]
  21. Andreu, L.; Bigne, E.; Amaro, S.; Palomo, J. Airbnb research: An analysis in tourism and hospitality journals. Int. J. Cult. Tour. Hosp. Res. 2020, 14, 2–20. [Google Scholar] [CrossRef]
  22. Lorde, T.; Jacob, J.; Weekes, Q. Price-setting behavior in a tourism sharing economy accommodation market: A hedonic price analysis of AirBnB hosts in the caribbean. Tour. Manag. Perspect. 2019, 30, 251–261. [Google Scholar] [CrossRef]
  23. Tong, B.; Gunter, U. Hedonic pricing and the sharing economy: How profile characteristics affect Airbnb accommodation prices in Barcelona, Madrid, and Seville. Curr. Issues Tour. 2022, 25, 3309–3328. [Google Scholar] [CrossRef]
  24. Toader, V.; Negrușa, A.L.; Bode, O.R.; Rus, R.V. Analysis of price determinants in the case of Airbnb listings. Econ. Res.-Ekon. Istraživanja 2022, 35, 2493–2509. [Google Scholar] [CrossRef]
  25. Visser, G.; Erasmus, I.; Miller, M. Airbnb: The emergence of a new accommodation type in Cape Town, South Africa. Tour. Rev. Int. 2017, 21, 151–168. [Google Scholar] [CrossRef]
  26. Perez-Sanchez, V.R.; Serrano-Estrada, L.; Marti, P.; Mora-Garcia, R.-T. The what, where, and why of Airbnb price determinants. Sustainability 2018, 10, 4596. [Google Scholar] [CrossRef]
  27. Phua, V.C. Perceiving Airbnb as sharing economy: The issue of trust in using Airbnb. Curr. Issues Tour. 2018, 22, 2051–2055. [Google Scholar] [CrossRef]
  28. Mao, Z.; Wei, W. Sleeping in a stranger’s home: A trust formation model for Airbnb. J. Hosp. Tour. Manag. 2019, 42, 67–76. [Google Scholar] [CrossRef]
  29. Farmaki, A.; Kaniadakis, A. Power dynamics in peer-to-peer accommodation: Insights from Airbnb hosts. Int. J. Hosp. Manag. 2020, 89, 102571. [Google Scholar] [CrossRef] [PubMed]
  30. Chen, Y.; Xie, K.L. Consumer valuation of Airbnb listings: A hedonic pricing approach. Int. J. Contemp. Hosp. Manag. 2017, 29, 2405–2424. [Google Scholar] [CrossRef]
  31. Wang, D.; Nicolau, J.L. Price determinants of sharing economy-based accommodation rental: A study of listings from 33 cities on Airbnb.com. Int. J. Hosp. Manag. 2017, 62, 120–131. [Google Scholar] [CrossRef]
  32. Ert, E.; Fleischer, A.; Magen, N. Trust and reputation in the sharing economy: The role of personal photos on Airbnb. Tour. Manag. 2016, 55, 62–73. [Google Scholar] [CrossRef]
  33. Gunter, U.; Önder, I. Determinants of Airbnb demand in Vienna and their implications for the traditional accommodation industry. Tour. Econ. 2018, 24, 270–293. [Google Scholar] [CrossRef]
  34. Liang, S.; Schuckert, M.; Law, R.; Chen, C. Be a “Superhost”: The importance of badge systems for peer-to-peer rental accommodations. Tour. Manag. 2017, 60, 454–465. [Google Scholar] [CrossRef]
  35. Zhang, C. Home sharing economy: Reputation badge and hosts competition. SSRN Electron. J. 2018. [Google Scholar] [CrossRef]
  36. Berentsen, A.; Rojas Breu, M.; Waller, C. What is the value of being a superhost? In Proceedings of the 68th Annual Meeting of the French Economic Association 2019, Orléans, France, 17–19 June 2019.
  37. Zhang, S.; Lee, D.; Singh, P.V.; Srinivasan, K. What makes a good image? Airbnb demand analytics leveraging interpretable image features. Manag. Sci. 2022, 68, 5644–5666. [Google Scholar] [CrossRef]
  38. Kisieliauskas, J. Host-related factors influencing airbnb prices in rural areas. Manag. Theory Stud. Rural Bus. Infrastruct. Dev. 2024, 45, 379–389. [Google Scholar] [CrossRef]
  39. Gutt, D.; Herrmann, P. Sharing Means Caring? Hosts’ Price Reaction to Rating Visibility. In Proceedings of the European Conference on Information Systems, Münster, Germany, 26–29 May 2015; Research-in-Progress Papers. p. 54. [Google Scholar]
  40. Zervas, G.; Proserpio, D.; Byers, J.W. The rise of the sharing economy: Estimating the impact of Airbnb on the hotel industry. J. Mark. Res. 2017, 54, 687–705. [Google Scholar] [CrossRef]
  41. Mulshine, K. The dynamics of rating platforms: Evidence from Yelp. J. Ind. Econ. 2015, 63, 437–469. [Google Scholar]
  42. Gibbs, C.; Guttentag, D.; Gretzel, U.; Morton, J.; Goodwill, A. Pricing in the sharing economy: A hedonic pricing model applied to Airbnb listings. J. Travel Tour. Mark. 2018, 35, 46–56. [Google Scholar] [CrossRef]
  43. Abrate, G.; Viglia, G. Personal or product reputation? Optimizing revenues in the sharing economy. J. Travel Res. 2019, 58, 136–148. [Google Scholar] [CrossRef]
  44. Magno, F.; Cassia, F.; Ugolini, M.M. Accommodation prices on Airbnb: Effects of host experience and market demand. TQM J. 2018, 30, 608–620. [Google Scholar] [CrossRef]
  45. Lawani, A.; Reed, M.R.; Mark, T.; Zheng, Y. Reviews and price on online platforms: Evidence from sentiment analysis of Airbnb reviews in Boston. Reg. Sci. Urban Econ. 2019, 75, 22–34. [Google Scholar] [CrossRef]
  46. Dogru, T.; Pekin, O. What Do Guests Value Most in Airbnb Accommodations? An Application of the Hedonic Pricing Approach; Boston Hospitality Review: Boston, MA, USA, 2017. [Google Scholar]
  47. Xie, K.; Mao, Z. The impacts of quality and quantity attributes of Airbnb hosts on listing performance. Int. J. Contemp. Hosp. Manag. 2017, 29, 2240–2260. [Google Scholar] [CrossRef]
  48. Zhang, Z.; Chen, R.; Han, L.; Yang, L. Key factors affecting the price of Airbnb listings: A geographically weighted approach. Sustainability 2017, 9, 1635. [Google Scholar] [CrossRef]
  49. He, J.; Li, B.; Shane Wang, X. Image features and demand in the sharing economy: A study of Airbnb. Int. J. Res. Mark. 2023, 40, 760–780. [Google Scholar] [CrossRef]
  50. Hu, M.; Lin, L.; Liu, M.; Ma, S. Images’ features and Airbnb listing price: The mediation effect of visual aesthetic perception. Tour. Rev. 2023, 79, 5. [Google Scholar] [CrossRef]
  51. Kirkos, E. Airbnb listings’ performance: Determinants and predictive models. Eur. J. Tour. Res. 2022, 30, 3012. [Google Scholar] [CrossRef]
  52. Rubin, D.B. Multiple Imputation after 18+ Years. J. Am. Stat. Assoc. 1996, 91, 473–489. [Google Scholar] [CrossRef]
  53. Schafer, J.L. Analysis of Incomplete Multivariate Data; CRC Press: Boca Raton, FL, USA, 1997. [Google Scholar]
  54. Rosen, S. Hedonic Prices and Implicit Markets: Product Differentiation in Pure Competition. J. Political Econ. 1974, 82, 34–55. [Google Scholar] [CrossRef]
  55. Li, H.; Simchi-Levi, D.; Wu, M.X.; Zhu, W. Estimating and exploiting the impact of photo layout: A structural approach. Manag. Sci. 2022, 69, 5209–5233. [Google Scholar] [CrossRef]
  56. Babii, A.; Ghysels, E.; Striaukas, J. Econometrics of Machine Learning Methods in Economic Forecasting. arXiv 2023, arXiv:2308.10993. [Google Scholar] [CrossRef]
  57. Athey, S. The impact of machine learning on economics. In The Economics of Artificial Intelligence: An Agenda; University of Chicago Press: Chicago, IL, USA, 2018; pp. 1–32. [Google Scholar]
  58. Zapata, H.O.; Mukhopadhyay, S. A Bibliometric Analysis of Machine Learning Econometrics in Asset Pricing. J. Risk Financ. Manag. 2022, 15, 535. [Google Scholar] [CrossRef]
Figure 1. Model workflow simulation in Orange data mining tool.
Information 16 00450 g001
Figure 2. Refinement process for Gradient Boosting and Adaboost simulators in Orange data mining tool.
Information 16 00450 g002
Table 1. Descriptive Statistics.
VariableRepresentationMinMeanMaxStd. Dev. Description
Natural logarithm of listing’s daily price LNPRICE 0.130 4.193 8.996 0.6170 Continuous variable
Days since host registered DAYS 6.000 2198.808 4932.000 977.3948 Continuous variable
Host’s response R_1_H 0.000 0.863 1.000 0.3445 Dummy variable = 1 if host responds within 1 h
Host’s acceptance rate (%) ACC_R 0.000 0.947 1.000 0.1600 Continuous variable
Superhost status SUPER 0.000 0.496 1.000 0.5001 Dummy variable = 1 if host is Superhost
Number of listings from the same host LIST 1.000 13.584 329.000 32.1200 Continuous variable
Listing’s location DOWNTOWN 0.000 0.812 1.000 0.3912 Dummy variable = 1 for listings in downtown Thessaloniki
Listing type ENTIRE 0.000 0.958 1.000 0.2018 Dummy variable = 1 for entire homes
Maximum capacity of the listing ACCOM 1.000 3.16.00 1.9364 Continuous variable
Minimum number of night stay for the listing NIGHTS 1.000 2.283 59.000 3.0357 Continuous variable
Whether the guest can automatically book the listing without the host requiring accepting their booking request INSTANT 0.000 0.571 1.000 0.4951 Dummy variable = 1 if the listing is instantly bookable
Total number of reviews of the listing REVIEWS 0.000 79.888 741.000 102.9775 Continuous variable
Review score REVIEW_SCORE 0.000 4.704 5.000 0.6322 Continuous variable
AI main photo score AI_SCORE 0.120 0.387 0.870 0.1445 Continuous variable
Natural logarithm of main photo file size FILE_SIZE 9.612 12.232 14.705 0.9646 Continuous variable
Table 2. Correlation matrix.
VariablesACC_RACCOMDAYSENTIREAI_SCOREFILE_SIZEINSTANTLISTNIGHTSLNPRICER_1_HREVIEWSREVIEW_ SCOREDOWNTOWNSUPER
ACC_R1.0000
ACCOM0.00321.0000
DAYS−0.07490.05351.0000
ENTIRE0.14460.19340.07471.0000
AI_SCORE0.11860.0215−0.02590.09381.0000
FILE_SIZE0.0986−0.0128−0.1850−0.09120.10751.0000
INSTANT0.3015−0.0062−0.07180.06760.14860.06051.0000
LIST0.0659−0.00360.04500.02300.1434−0.04460.22491.0000
NIGHTS−0.0323−0.05070.1267−0.0147−0.0738−0.0211−0.1286−0.06661.0000
LNPRICE0.05760.47330.01450.24550.13310.03320.10080.1331−0.07101.0000
R_1_H0.31930.00180.03000.12460.1069−0.05260.24900.1239−0.11540.02091.0000
REVIEWS0.14140.02660.29340.09460.0084−0.16750.0798−0.0432−0.1010−0.08520.16451.0000
REVIEW_SCORE0.11440.03110.13110.04410.02860.0234−0.0751−0.18230.00520.00930.02150.13251.0000
DOWNTOWN0.02300.00160.07460.06960.0673−0.09180.08540.0845−0.07600.19750.04140.1641−0.00021.0000
SUPER0.19500.07340.11330.12970.0622−0.0345−0.0302−0.0748−0.00930.09190.16090.23370.23700.07161.0000
Table 3. OLS regression results.
Variable Coefficient Std. Error
CONS 2.501 *** 0.216
DAYS 0.00 0.00
R_1_H −0.056 0.042
ACC_R 0.052 0.079
SUPER 0.084 *** 0.023
LIST 0.002 *** 0.001
DOWNTOWN 0.301 *** 0.028
ENTIRE 0.439 *** 0.089
ACCOM 0.141 *** 0.006
NIGHTS −0.007 0.008
INSTANT 0.076 *** 0.026
REVIEWS −0.001 *** 0.000
REVIEW_SCORE 0.010 0.000
AI_SCORE 0.289 *** 0.078
FILE_SIZE 0.025 ** 0.013
**: Statistically significant at the 0.05 level. ***: Statistically significant at the 0.01 level.
Table 4. Orange test and score results (preset parameters).
Model Mean Squared Error
(MSE)
Root Mean Squared Error (RMSE) Mean Absolute Error
(MAE)
Mean Absolute Percentage Error (MAPE) R-Squared
(R2)
Linear Regression 0.242 0.4910.3550.092 0.305
Gradient Boosting 0.220 0.4690.336 0.088 0.368
Random Forest 0.240 0.4900.355 0.0930.309
kNN 0.365 0.604 0.448 0.117 −0.050
SVM 0.3210.5660.4210.107 0.077
AdaBoost 0.217 0.4660.324 0.084 0.374
Neural Network 0.2380.4880.3520.091 0.315
Table 5. Orange test and score results (refined Adaboost and Gradient Boosting parameters).
Model Mean Squared Error
(MSE)
Root Mean Squared Error (RMSE) Mean Absolute Error
(MAE)
Mean Absolute Percentage Error (MAPE) R-Squared
(R2)
Linear Regression 0.242 0.4910.3550.092 0.305
Gradient Boosting 0.216 0.4640.3300.0860.379
Random Forest 0.240 0.4900.355 0.0930.309
kNN 0.365 0.604 0.448 0.117 −0.050
SVM 0.3210.5660.4210.107 0.077
AdaBoost 0.2120.4600.3200.0830.391
Neural Network 0.2380.4880.3520.091 0.315
Disclaimer/Publisher’s Note: The statements, opinions and data contained in all publications are solely those of the individual author(s) and contributor(s) and not of MDPI and/or the editor(s). MDPI and/or the editor(s) disclaim responsibility for any injury to people or property resulting from any ideas, methods, instructions or products referred to in the content.

