
Performance Variability in Public Clouds: An Empirical Assessment


Abstract
1. Introduction
2. Cloud Computing Platform
AWS—Elastic Cloud Computing (EC2) and Google Cloud Platform (GCP) Services
3. Related Work
4. Results
4.1. Test Bed
4.2. Benchmarks and Metrics
4.2.1. STREAM
4.2.2. NPB (NAS Parallel Benchmarks)
4.2.3. IOR (Interleave or Random)
4.3. Research Methodology
4.4. Results
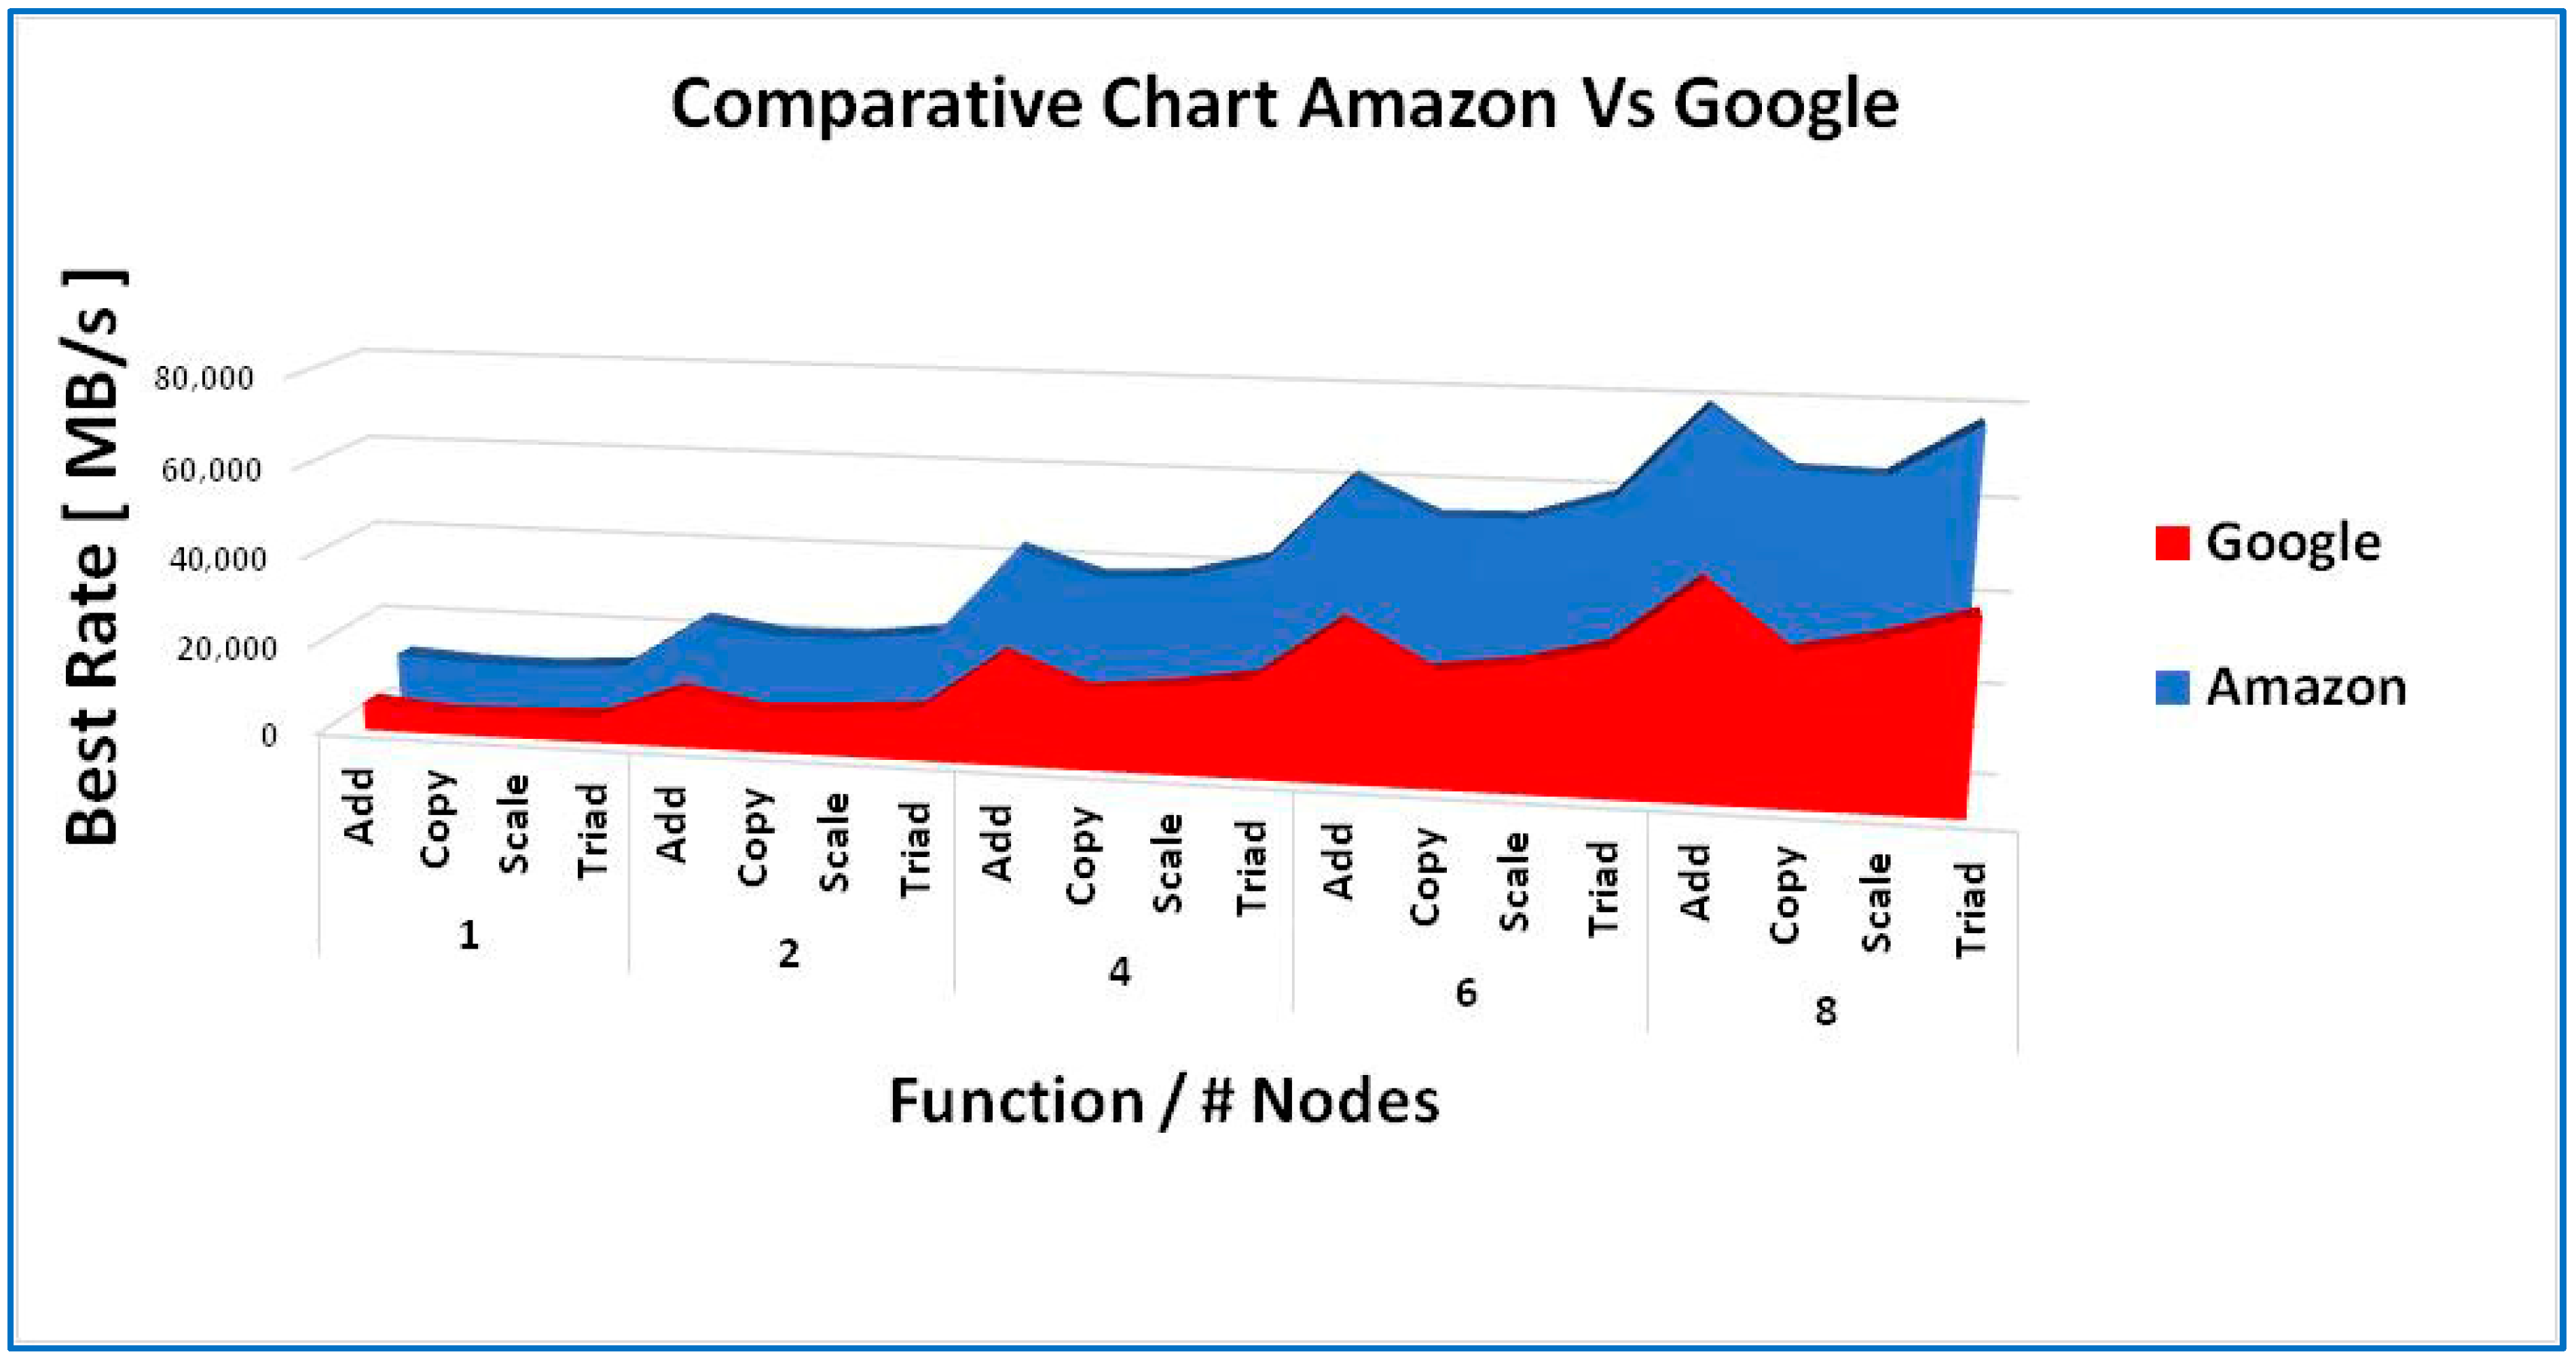
4.4.1. Stream Benchmark Results
4.4.2. Stream Benchmark Statistical Analysis
4.4.3. Stream Benchmark Box-Plot Analysis
4.4.4. Stream Benchmark Significance Test
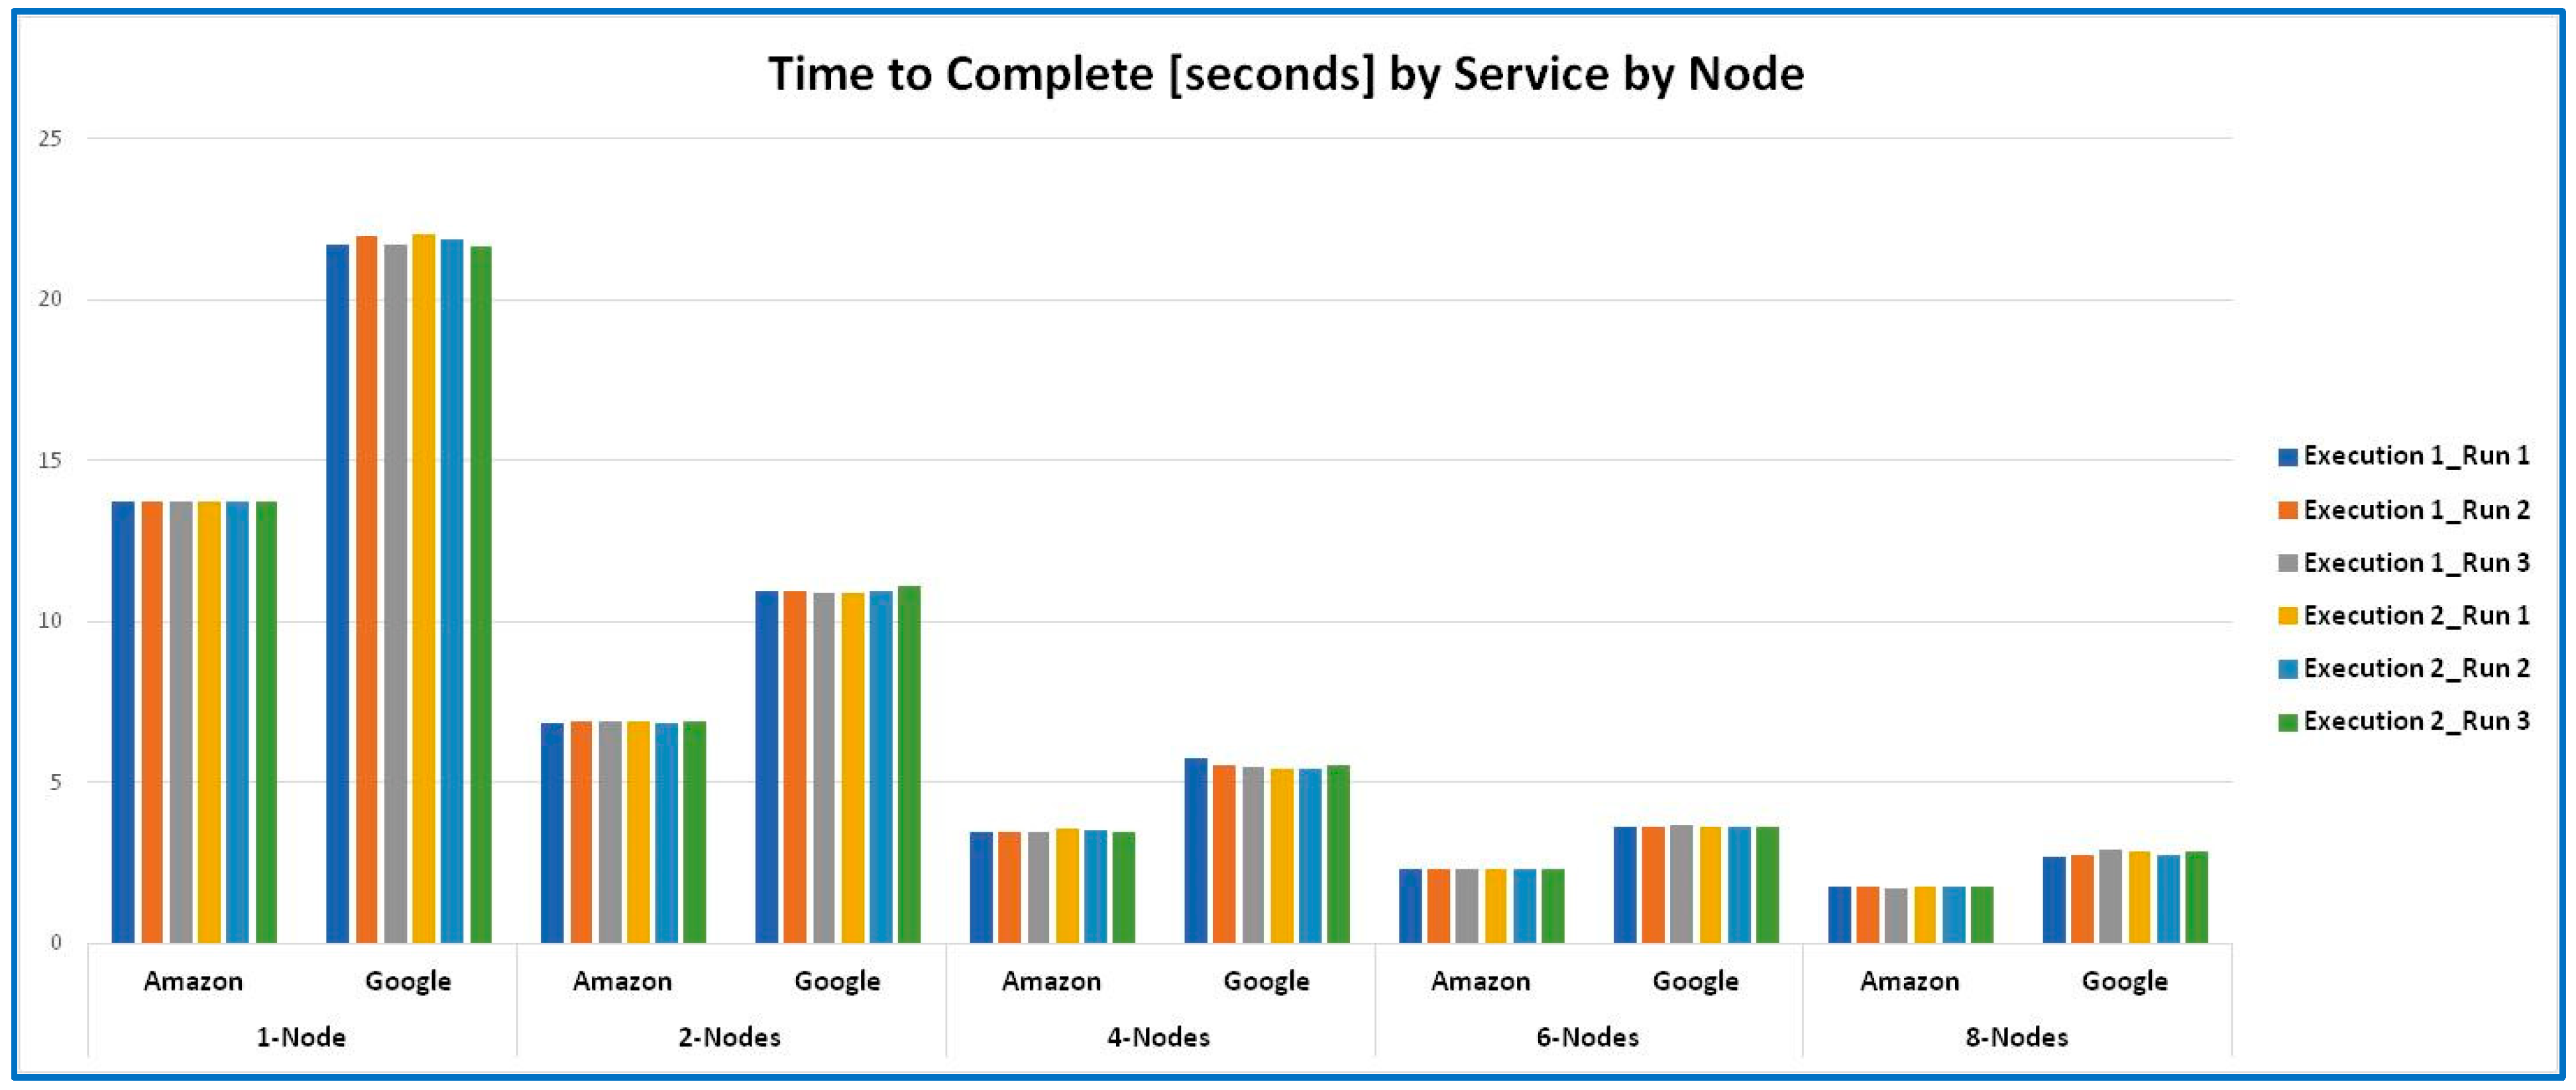
4.4.5. NP Benchmark Results
4.4.6. NP Benchmark Statistical Analysis
4.4.7. NP Benchmark Significance Test
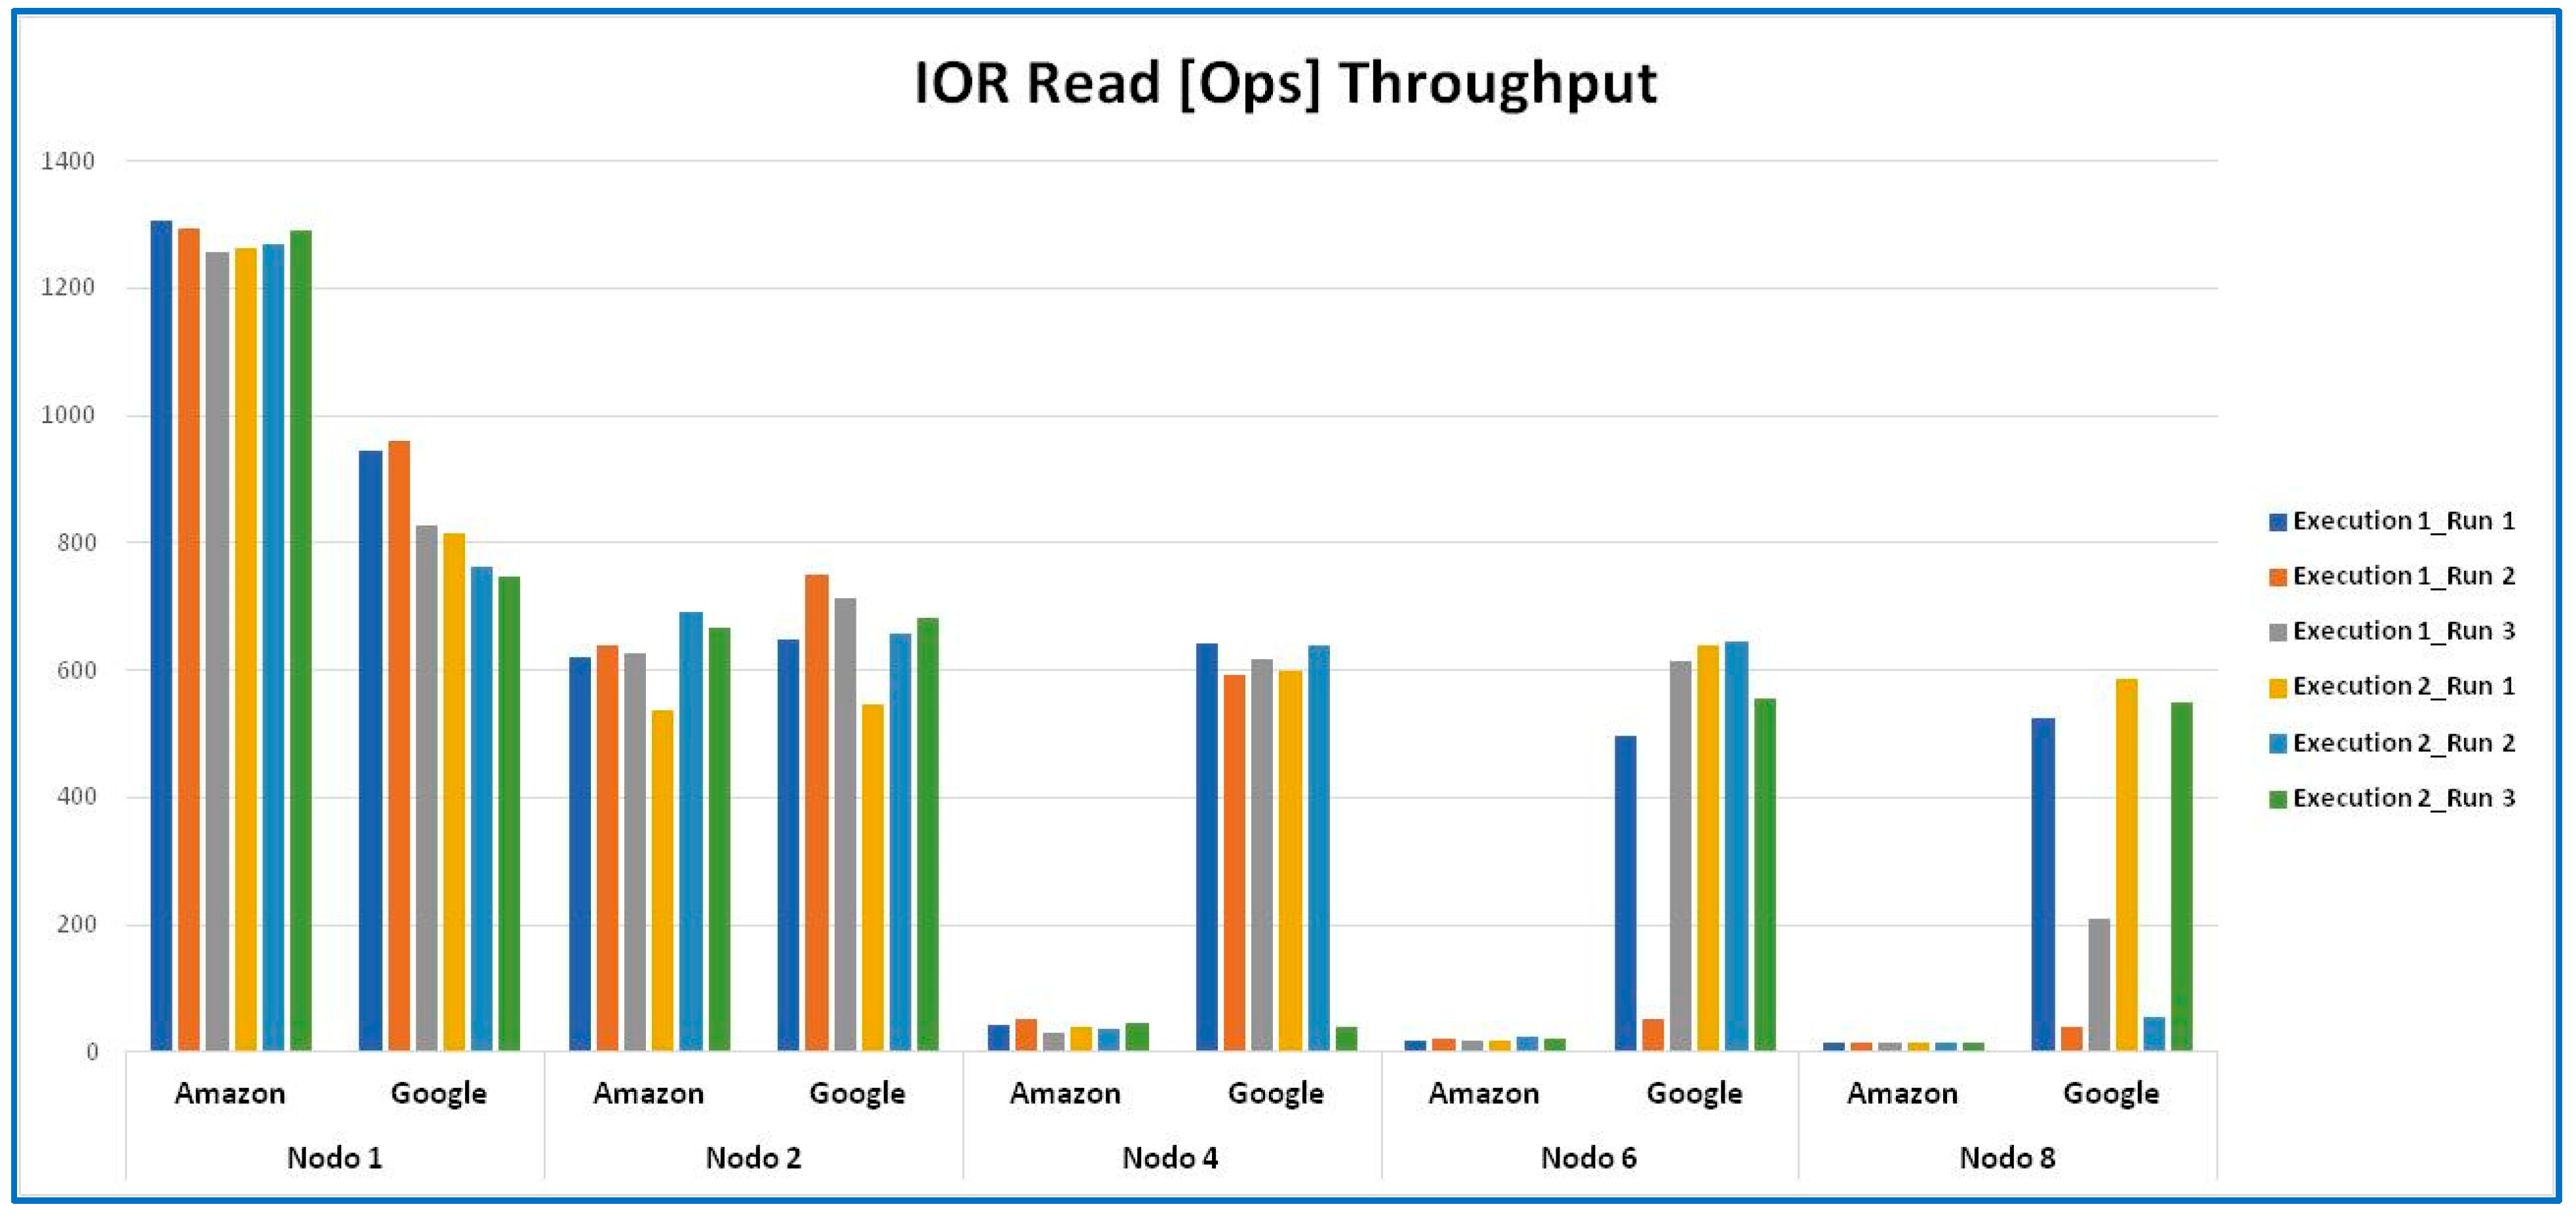
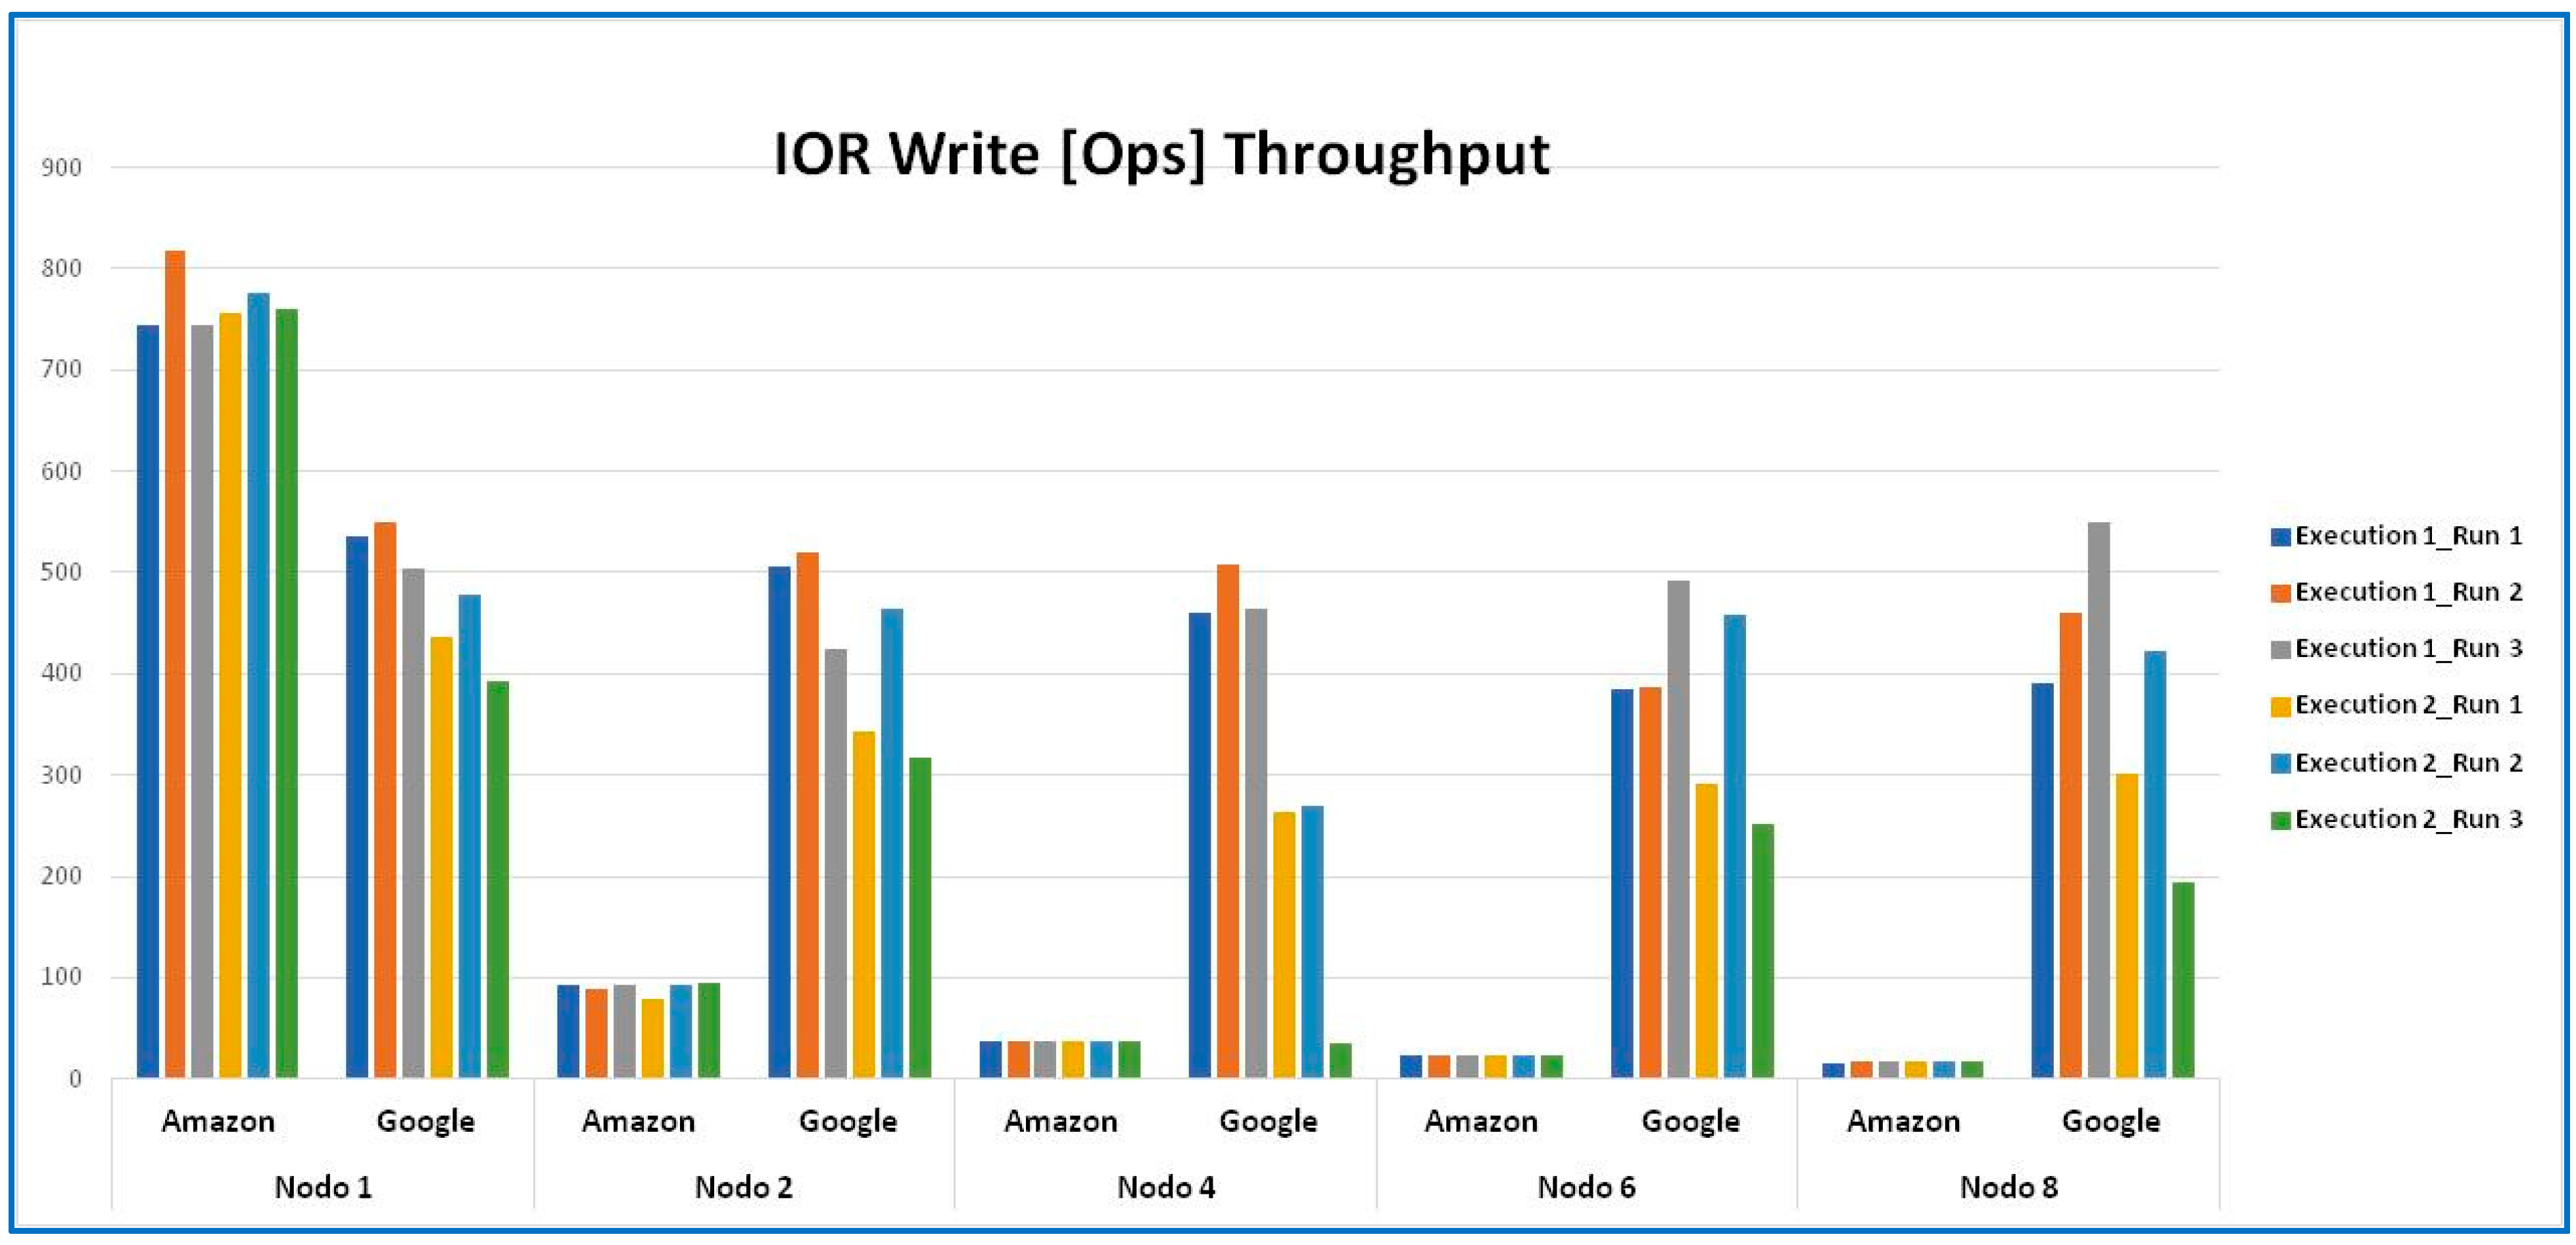
4.4.8. IOR Benchmark Results
4.4.9. IOR Benchmark Statistical Analysis
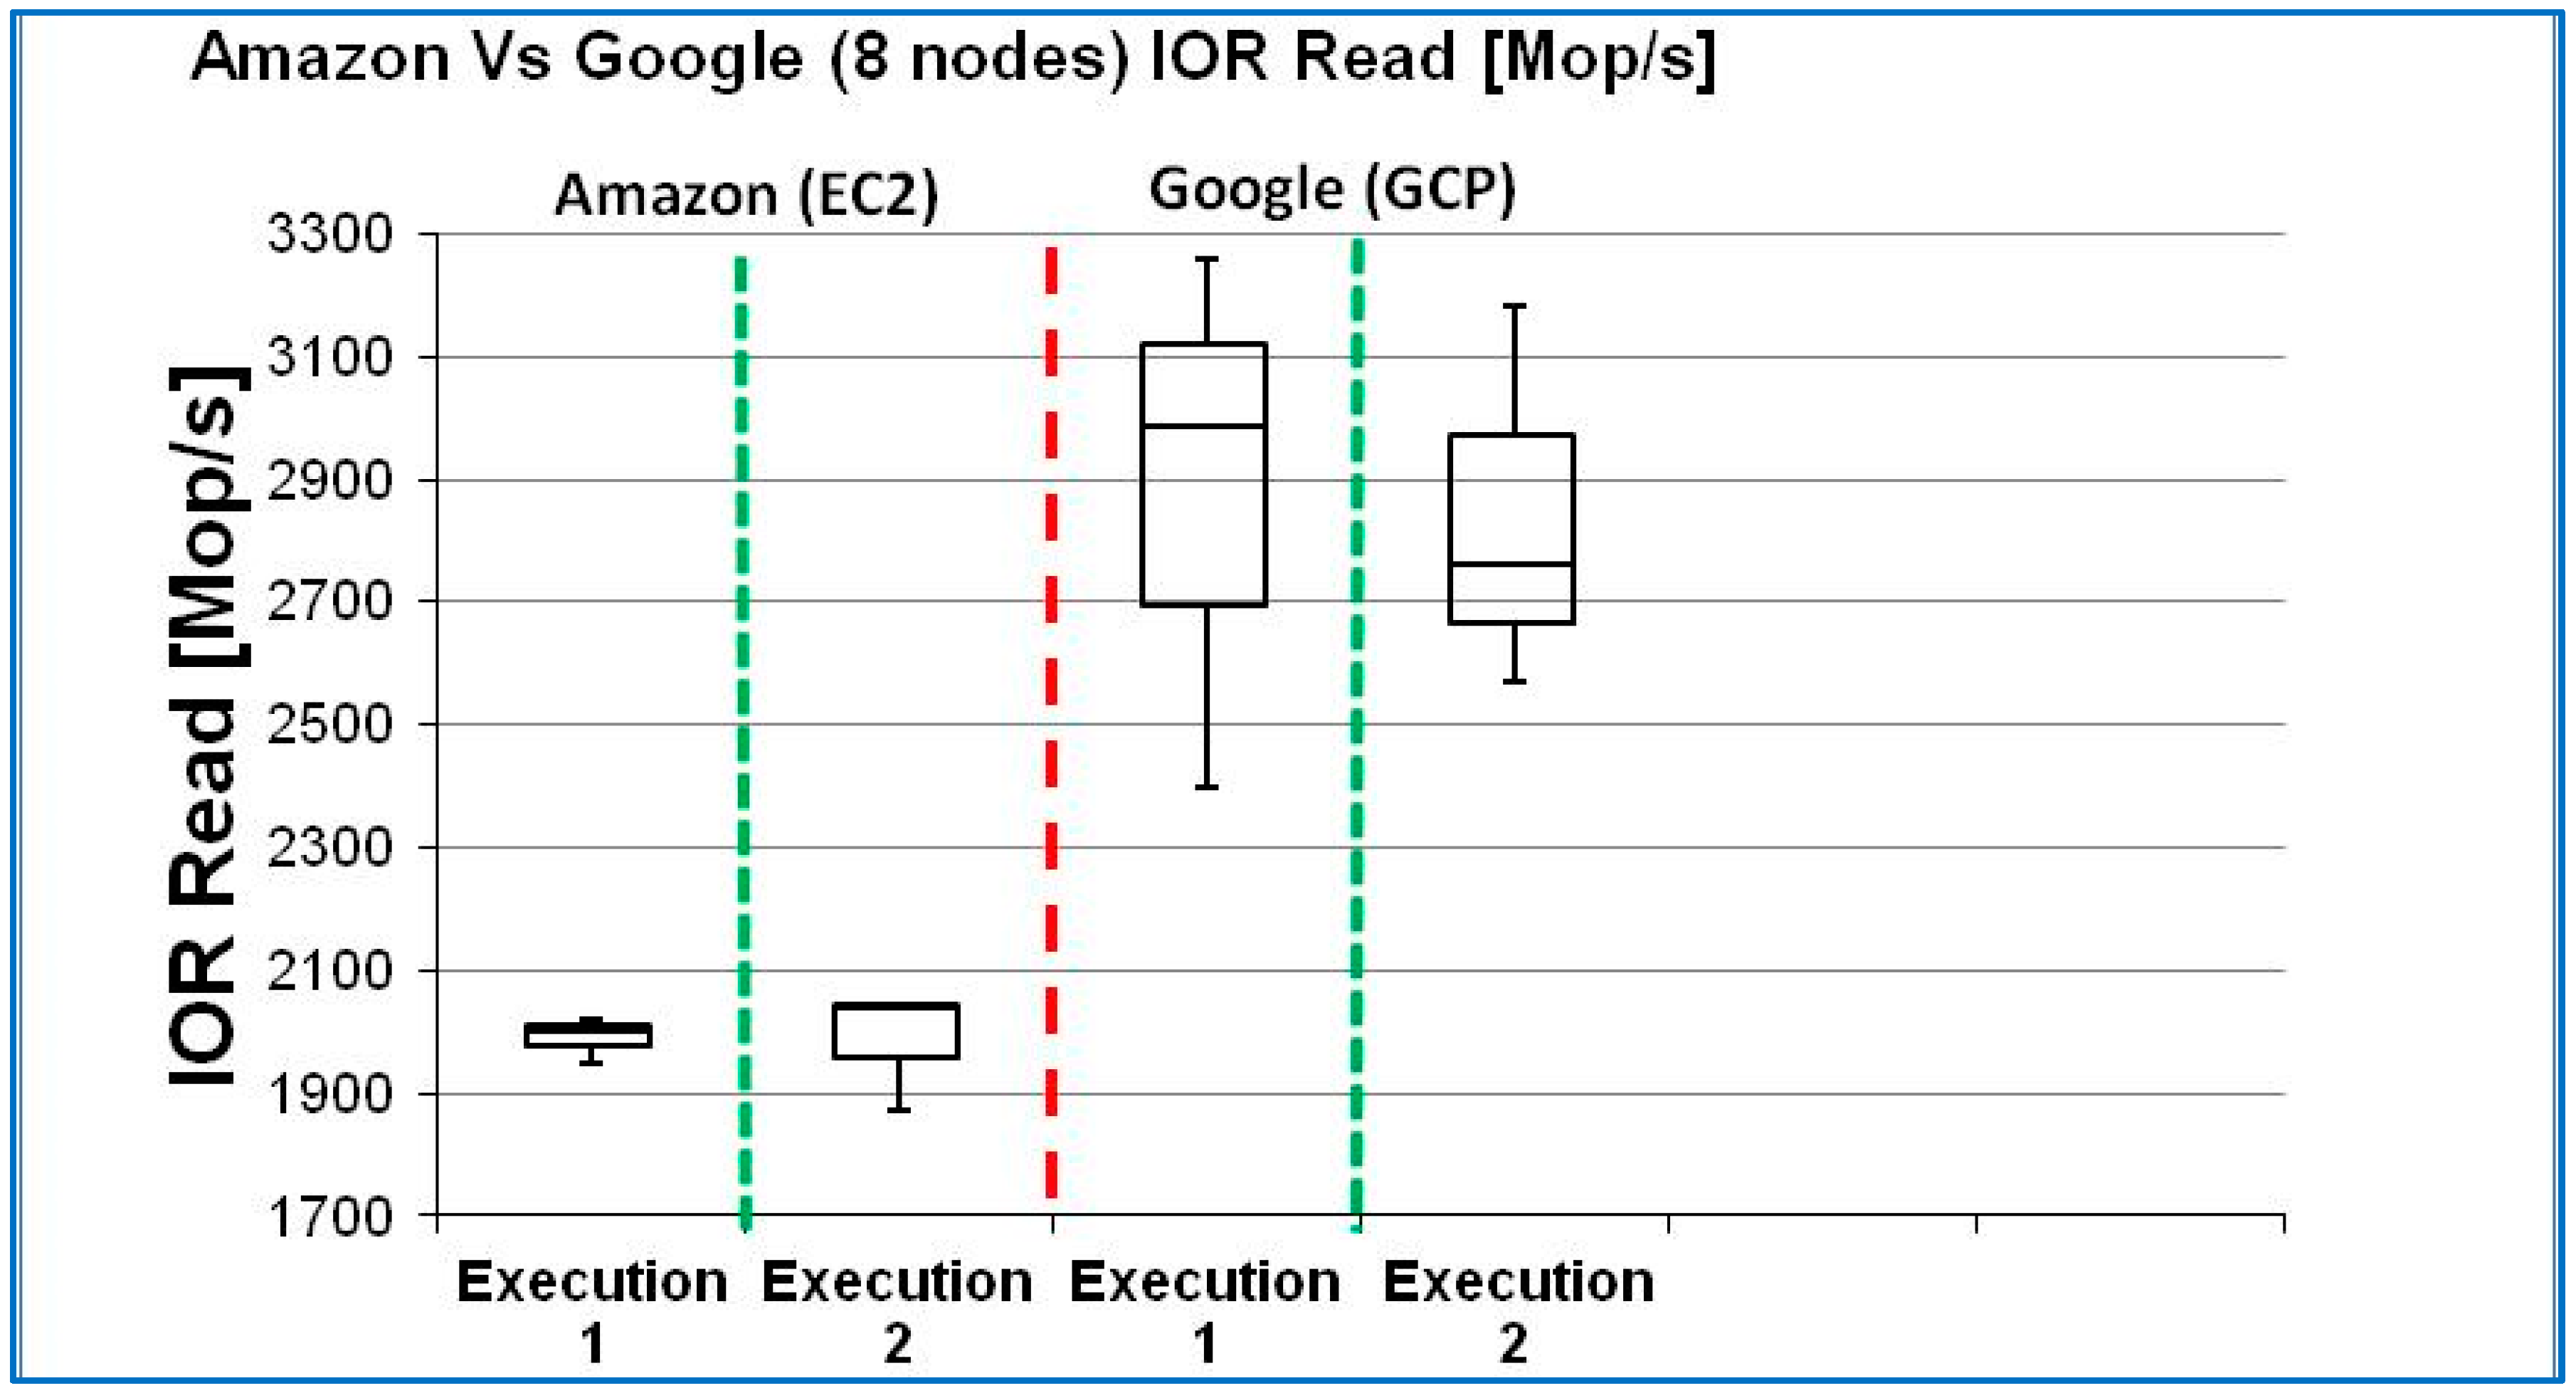
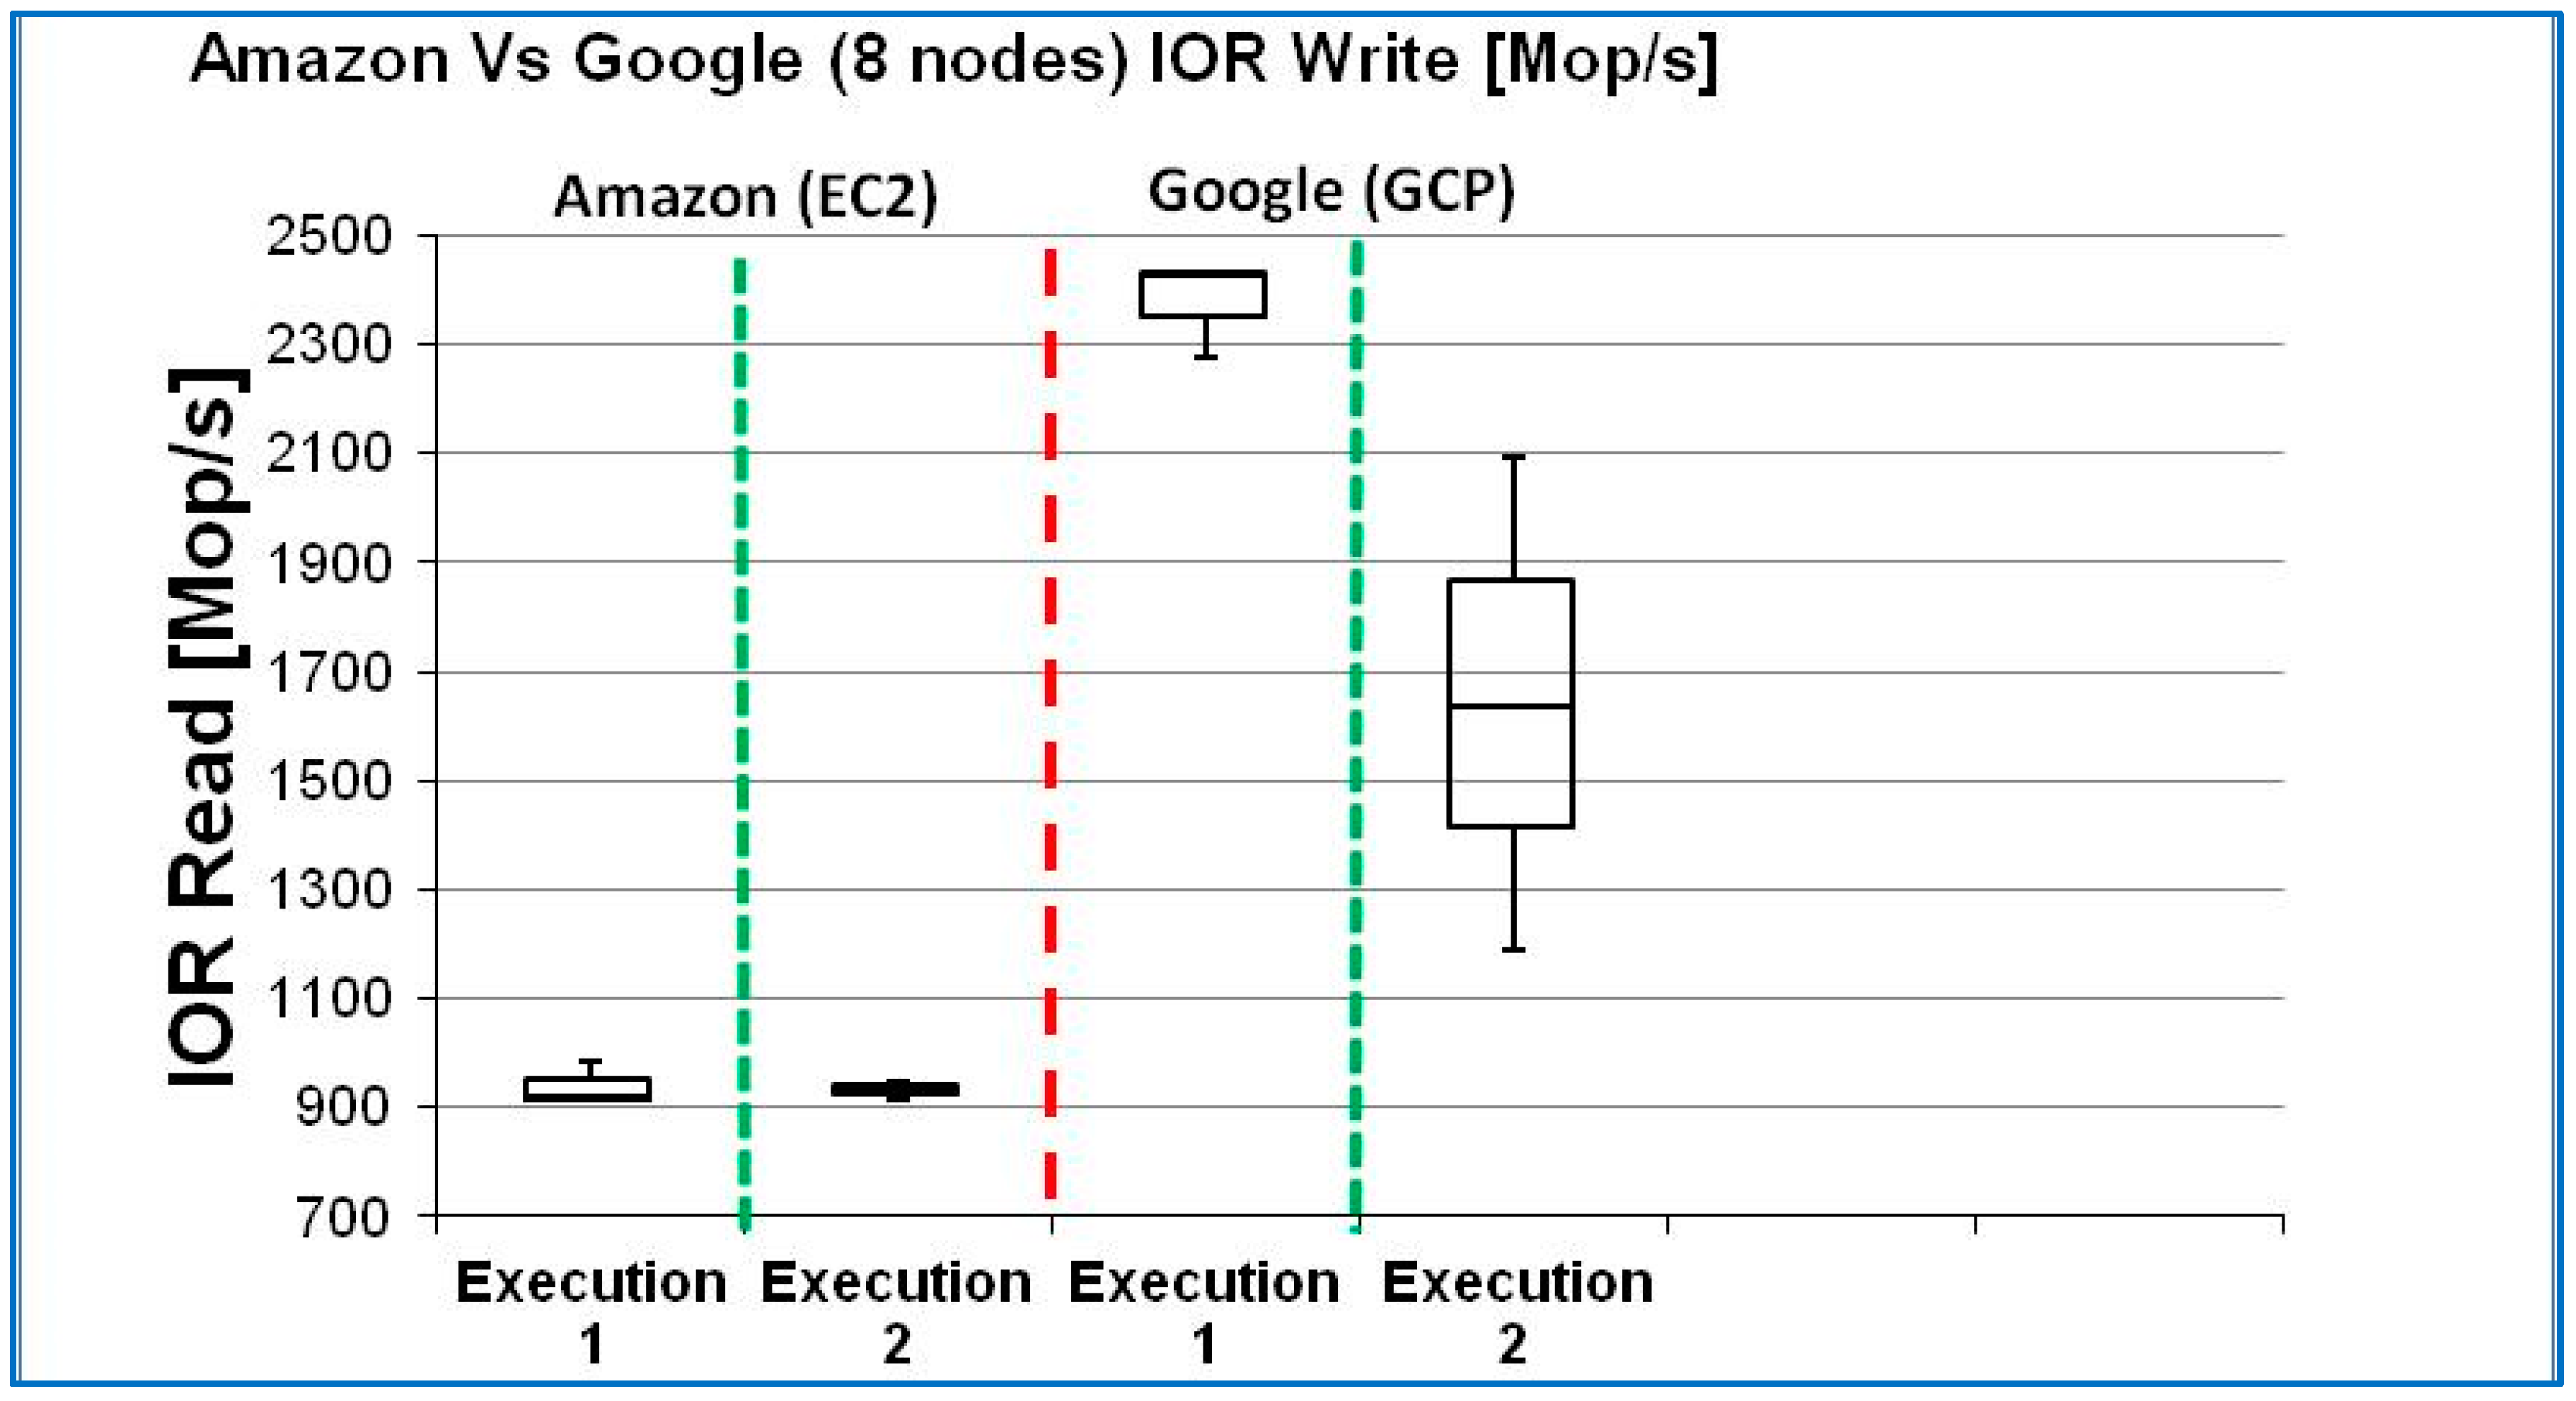
4.4.10. IOR Benchmark Box-Plot Analysis
4.4.11. IOR Benchmark Significance Test
5. Conclusions
Author Contributions
Funding
Institutional Review Board Statement
Informed Consent Statement
Data Availability Statement
Conflicts of Interest
References
- Sandhiya, V.; Suresh, A. Analysis of Performance, Scalability, Availability and Security in Different Cloud Environments for Cloud Computing. In Proceedings of the 2023 International Conference on Computer Communication and Informatics (ICCCI), Coimbatore, India, 23–25 January 2023; pp. 1–7. [Google Scholar]
- Amazon Web Services, Inc. Available online: https://aws.amazon.com/ec2/ (accessed on 15 March 2024).
- Google Cloud. Available online: https://cloud.google.com/compute/docs/machine-resource (accessed on 15 April 2024).
- Li, Z.; OBrien, L.; Ranjan, R.; Zhang, M. Early observations on performance of google compute engine for scientific computing. In Proceedings of the 2013 IEEE 5th International Conference on Cloud Computing Technology and Science, Bristol, UK, 2–5 December 2013. [Google Scholar]
- University of Virginia. STREAM Benchmark Reference Information. Department of Computer Science, School of Engineering and Applied Science. Available online: http://www.cs.virginia.edu/stream/ref.html (accessed on 15 April 2024).
- Villalpando, L.E.B.; April, A.; Abran, A. CloudMeasure: A Platform for Performance Analysis of Cloud Computing Systems. In Proceedings of the 2016 IEEE 9th International Conference on Cloud Computing (CLOUD), San Francisco, CA, USA, 27 June–2 July 2016; pp. 975–979. [Google Scholar]
- Shoeb, A.A.M. A Comparative Study on I/O Performance between Compute and Storage Optimized Instances of Amazon EC2. In Proceedings of the IEEE International Conference on Cloud Computing, Anchorage, AK, USA, 27 June–2 July 2014. [Google Scholar]
- Prasetio, N.; Ferdinand, D.; Wijaya, B.C.; Anggreainy, M.S.; Kumiawan, A. Performance Analysis of Distributed Database System in Cloud Computing Environment. In Proceedings of the 2023 IEEE 9th International Conference on Computing, Engineering and Design (ICCED), Kuala Lumpur, Malaysia, 31 October 2023; pp. 1–6. [Google Scholar]
- NASA Website. NAS Parallel Benchmarks. NASA Advanced Supercomputing Division, 28 March 2019. Available online: https://www.nas.nasa.gov/publications/npb.html (accessed on 15 April 2024).
- Sourceforge.net. “IOR HPC Benchmark”. Available online: https://sourceforge.net/projects/ior-sio/ (accessed on 14 April 2024).


| Feature | AWS EC2 [2] | Google Cloud Platform [3] | |
| a | Business model | Free entry-level VM instances for a limited use quota for 12 months. Multiple options of IaaS, PaaS, and SaaS at different pricing options to meet the customer’s operating environment. | Free entry-level VM instances for a limited use quota for 12 months. Multiple options of IaaS, PaaS, and SaaS at different pricing options to meet the customer’s operating environment. |
| b | VM instance types offered | A1 (medium, large, xlarge, 2xlarge, 4xlarge) T3 (nano, micro, small, medium, large, xlarge, 2xlarge) T2 (nano, micro, small, medium, large, xlarge, 2xlarge) M5 (large, xlarge, 2xlarge, 4xlarge, 12xlarge, 24xlarge, metal, d.large, d.xlarge, d.2xlarge, d.4xlarge, d.12xlarge, d.24xlarge, d.mental) M5a (large, xlarge, 2xlarge, 4xlarge, 12xlarge, 24xlarge) M4 (large, xlarge, 2xlarge, 4xlarge, 10xlarge, 16xlarge) T3a (nano, micro, small, medium, large, xlarge, 2xlarge) | Standard machine (n1-standard-1, 2, 4, 8, 16, 32, 64, 96) High-memory machine types (n1-highmem-2, 4, 8, 16, 32, 64, 96) High-CPU machine types (n1-highcpu-2, 4,8,16,32,64,96) Shared-core machine types (f1-micro, g1-small) Memory-optimized machine types (n1-ultramem-40, 80, 160, n1-megamem-96) |
| b.1 | # vCPUs and memory sizes | 128 and 3904 (GiB) | 96 and 1433 (GiB) |
| c | Storage | Throughput of up to 3.9 GB/s and provides customers with up to 48 TB of instance storage across 24 hard disk drives | Most instances can have up to 64 TB of total persistent disk space attached. |
| d | Development environment offered | AWS CloudFormation: Text files for modeling and provisioning cloud resources | Resource Manager: group, organize, and control access to resources; track and manage projects Cloud Deployment Manager: template-driven deployment |
| e | OS environments offered | Windows, SLES, Centos, CoreOS, OpenSURE, RHEL, CloudLinux, Debian, FreeBSD, Ubuntu, Oracle Linux | Windows, SLES, Centos, CoreOS, OpenSUSE, RHEL, Debian, FreeBSD, Ubuntu |
| f | Security | GuardDuty Macie Shield WAF | Cloud DLP Cloud Security Scanner |
| g | Performance and scalability | Provide high-performance network capability and can be programmatically launched into clusters, allowing applications to get the low-latency network performance required for tightly coupled, node-to-node communication. | Scale your resources up or down with intelligent Autoscaling Software-Defined Load Balancing Over One Million Queries Per Second Seamless Autoscaling Internal Load Balancing |
| h | Reliability and fault tolerance | Service Level Agreement commitment is 99.99% availability for each Amazon EC2 Region. | There is no publicly available information regarding reliability for GCP. |
| i | Pricing model | Per Hour, rounded up | Per minute, rounded up (minimum 10 min) |
| i.1 | Model | On demand, Spot, and Reserved | On demand—Sustained Use |
| j | Auto-Scaling/Elasticity | AWS Auto Scaling | Through managed instance groups |
| k | Monitoring tools/service provided | Amazon CloudWatch: real-time visibility into apps and infrastructure AWS CloudTrail: logging and monitoring of AWS accounts CloudWatch CloudTrail | Google StackDriver, including monitoring, logging, error reporting, tracing, and debugging Stackdriver |
| Characteristics | Amazon EC2 | Google GCP |
| Machine Type | t2.micro | f1.micro |
| Operating System | Ubuntu | Ubuntu |
| CPU | 1 CPU | 0.2 CPU |
| RAM | 1 GB | 0.6 GB |
| Benchmark | Timeframe | First Execution Set | Second Execution Set | Metrics |
|---|---|---|---|---|
| Stream | Morning | 1-, 2-, 4-, 6- and 8-node | 1-, 2-, 4-, 6- and 8-node | Best MBps Rate for Add, Copy Scale, and Triad |
| Mid-day | 1-, 2-, 4-, 6- and 8-node | 1-, 2-, 4-, 6- and 8-node | ||
| Evening | 1-, 2-, 4-, 6- and 8-node | 1-, 2-, 4-, 6- and 8-node | ||
| NPB | Morning | 1-, 2-, 4-, 6- and 8-node | 1-, 2-, 4-, 6- and 8-node | MOPS and Total Time (s) to completion |
| Mid-day | 1-, 2-, 4-, 6- and 8-node | 1-, 2-, 4-, 6- and 8-node | ||
| Evening | 1-, 2-, 4-, 6- and 8-node | 1-, 2-, 4-, 6- and 8-node | ||
| IOR | Morning | 1-, 2-, 4-, 6- and 8-node | 1-, 2-, 4-, 6- and 8-node | Read and Write Operations per second |
| Mid-day | 1-, 2-, 4-, 6- and 8-node | 1-, 2-, 4-, 6- and 8-node | ||
| Evening | 1-, 2-, 4-, 6- and 8-node | 1-, 2-, 4-, 6- and 8-node |
| Platform | Execution | Function | Mean | Median | Diff Mean & Median % | Range | Std. Deviation | Std. Deviation (%) |
|---|---|---|---|---|---|---|---|---|
| EC2 | Execution 1 | Add | 83,122.83 | 82,653.20 | 0.56% | 7789.90 | 3916.1271 | 5% |
| EC2 | Execution 2 | Add | 79,901.86 | 80,241.80 | 0.43% | 7404.40 | 3713.8862 | 5% |
| EC2 | Execution 1 | Copy | 68,926.36 | 67,725.20 | 1.74% | 5530.50 | 2954.4387 | 4% |
| EC2 | Execution 2 | Copy | 67,319.66 | 67,028.40 | 0.43% | 3267.20 | 1652.9598 | 2% |
| EC2 | Execution 1 | Scale | 68,623.03 | 68,054.80 | 0.83% | 5122.50 | 2608.0967 | 4% |
| EC2 | Execution 2 | Scale | 67,773.96 | 67,979.00 | 0.30% | 3225.90 | 1622.6942 | 2% |
| EC2 | Execution 1 | Triad | 80,490.50 | 80,750.30 | 0.32% | 5568.20 | 2793.1764 | 3% |
| EC2 | Execution 2 | Triad | 78,112.56 | 77,095.30 | 1.30% | 3909.20 | 2143.9647 | 3% |
| Platform | Execution | Function | Mean | Median | Diff Mean & Median % | Range | Std. Dev. | Std. Dev. (%) |
|---|---|---|---|---|---|---|---|---|
| GCP | Execution 1 | Add | 46,432.76 | 47,087.30 | 1.41% | 2875.40 | 1545.4098 | 3% |
| GCP | Execution 2 | Add | 46,595.20 | 46,592.60 | 0.01% | 1237.80 | 618.9040 | 1% |
| GCP | Execution 1 | Copy | 33,112.80 | 32,969.20 | 0.43% | 1328.60 | 675.8403 | 2% |
| GCP | Execution 2 | Copy | 33,097.03 | 33,112.40 | 0.05% | 295.30 | 148.2485 | 0% |
| GCP | Execution 1 | Scale | 36,784.23 | 37,027.60 | 0.66% | 1879.50 | 963.0942 | 3% |
| GCP | Execution 2 | Scale | 36,623.46 | 36,436.60 | 0.51% | 691.00 | 381.5227 | 1% |
| GCP | Execution 1 | Triad | 42,000.03 | 42,719.10 | 1.71% | 2309.80 | 1312.0924 | 3% |
| GCP | Execution 2 | Triad | 42,116.93 | 42,083.30 | 0.08% | 1294.10 | 647.7052 | 2% |
| Nodes | Function | EC2 Mean Value | GCP Mean Value | p Value |
|---|---|---|---|---|
| 1 | Add | 12,265.36 | 6311.80 | 0.000025 |
| Copy | 11,030.65 | 4544.65 | ||
| Scale | 11,176.48 | 5034.61 | ||
| Triad | 12,242.71 | 5691.90 | ||
| 2 | Add | 23,653.56 | 12,586.40 | 0.000034 |
| Copy | 21,106.71 | 9000.33 | ||
| Scale | 21,394.91 | 9943.43 | ||
| Triad | 23,631.03 | 11,285.93 | ||
| 4 | Add | 43,413.25 | 24,014.55 | 0.000022 |
| Copy | 37,799.90 | 17,277.01 | ||
| Scale | 38,570.11 | 18,897.70 | ||
| Triad | 43,139.91 | 21,829.96 | ||
| 6 | Add | 60,411.33 | 35,707.46 | 0.000014 |
| Copy | 51,085.33 | 25,686.30 | ||
| Scale | 51,957.98 | 28,284.40 | ||
| Triad | 58,369.00 | 32,596.50 | ||
| 8 | Add | 81,512.35 | 46,820.75 | 0.000090 |
| Copy | 68,123.01 | 33,282.98 | ||
| Scale | 68,198.50 | 36,931.85 | ||
| Triad | 79,301.53 | 42,288.10 |
| Platform | Execution | Mean | Median | Diff Mean and Median % | Max | Min | Range | Std. Dev. | Std. Dev. (%) |
|---|---|---|---|---|---|---|---|---|---|
| Amazon | 1 | 2.79 | 2.74 | 2.03% | 2.93 | 2.72 | 0.21 | 0.1159 | 4.23% |
| Amazon | 2 | 2.83 | 2.85 | 0.59% | 2.88 | 2.77 | 0.11 | 0.0568 | 2.00% |
| 1 | 192.04 | 195.78 | 1.95% | 197.3 | 183.1 | 14.19 | 7.7981 | 3.98% | |
| 2 | 189.41 | 188.32 | 0.58% | 193.8 | 186.1 | 7.73 | 3.9799 | 2.11% |
| Platform | Execution | Mean | Median | Diff Mean and Median % | Max | Min | Range | Std. Dev. | Std. Dev. (%) |
|---|---|---|---|---|---|---|---|---|---|
| READ | |||||||||
| Amazon | 1 | 13.99 | 13.93 | 0.41% | 14.15 | 13.88 | 0.27 | 0.1436 | 1.03% |
| Amazon | 2 | 14.01 | 14.03 | 0.12% | 14.35 | 13.66 | 0.69 | 0.3453 | 2.46% |
| 1 | 258.49 | 210.54 | 18.55% | 523.8 | 41.12 | 482.7 | 244.8914 | 116.32% | |
| 2 | 396.62 | 549.98 | 38.67% | 585.3 | 54.57 | 530.7 | 296.7502 | 53.96% | |
| WRITE | |||||||||
| Amazon | 1 | 16.71 | 16.79 | 0.48% | 16.81 | 16.53 | 0.28 | 0.1562 | 0.93% |
| Amazon | 2 | 16.76 | 16.78 | 0.10% | 16.8 | 16.71 | 0.09 | 0.0473 | 0.28% |
| 1 | 466.81 | 461.2 | 1.20% | 549.1 | 390.1 | 159 | 79.6481 | 17.27% | |
| 2 | 306.35 | 300.58 | 1.88% | 423.5 | 194.9 | 228.6 | 114.4190 | 38.07% | |
| Node Count | Function | Amazon | p Value | |
|---|---|---|---|---|
| 1 | IOR Read | 1279.465 | 842.277 | 0.1340 |
| IOR Write | 766.310 | 483.022 | ||
| 2 | IOR Read | 630.567 | 666.625 | 0.4325 |
| IOR Write | 90.525 | 429.345 | ||
| 4 | IOR Read | 41.353 | 521.590 | 0.1483 |
| IOR Write | 37.335 | 333.420 | ||
| 6 | IOR Read | 20.400 | 500.510 | 0.0956 |
| IOR Write | 23.220 | 377.102 | ||
| 8 | IOR Read | 14.000 | 327.555 | 0.0523 |
| IOR Write | 16.737 | 386.577 |
Disclaimer/Publisher’s Note: The statements, opinions and data contained in all publications are solely those of the individual author(s) and contributor(s) and not of MDPI and/or the editor(s). MDPI and/or the editor(s) disclaim responsibility for any injury to people or property resulting from any ideas, methods, instructions or products referred to in the content. |
© 2025 by the authors. Licensee MDPI, Basel, Switzerland. This article is an open access article distributed under the terms and conditions of the Creative Commons Attribution (CC BY) license (https://creativecommons.org/licenses/by/4.0/).
Share and Cite
Ahuja, S.; Lopez Chalacan, V.H.; Resendez, H. Performance Variability in Public Clouds: An Empirical Assessment. Information 2025, 16, 402. https://doi.org/10.3390/info16050402
Ahuja S, Lopez Chalacan VH, Resendez H. Performance Variability in Public Clouds: An Empirical Assessment. Information. 2025; 16(5):402. https://doi.org/10.3390/info16050402
Chicago/Turabian StyleAhuja, Sanjay, Victor H. Lopez Chalacan, and Hugo Resendez. 2025. "Performance Variability in Public Clouds: An Empirical Assessment" Information 16, no. 5: 402. https://doi.org/10.3390/info16050402
APA StyleAhuja, S., Lopez Chalacan, V. H., & Resendez, H. (2025). Performance Variability in Public Clouds: An Empirical Assessment. Information, 16(5), 402. https://doi.org/10.3390/info16050402