Abstract
The rapid transition to electric vehicles (EVs) requires a charging infrastructure that is both efficient and equitable. Conventional planning approaches, which often deploy chargers in proportion to current EV density, fail to account for the diverse characteristics of EV owners and the evolving patterns of adoption across different regions and time periods. This paper introduces an integrated, data-driven framework that addresses these limitations through three stages: segmentation of the EV market, spatio-temporal adoption forecasting for each segment, and optimizing charger placement through a constrained optimization model. The proposed optimization model incorporates equity constraints to ensure minimum service coverage for all user segments while maximizing overall utilization within a fixed budget. Methodologically, the paper contributes a transparent, reproducible framework that unifies user segmentation, geographically resolved adoption forecasting, and an equity-constrained MILP for charger placement. Applying this approach to a dataset of EV registrations in Washington State from 2010 to 2025 and extending it to projections through 2030 demonstrate important improvements in demand coverage. Overall coverage increases from 76.0% to 96.1% compared to a proportional-allocation baseline. More importantly, the proposed framework ensures a minimum of 70% coverage for all user segments. The presented approach is portable to other regions and budget scenarios. These findings show the potential for strategic, data-informed infrastructure planning that balances efficiency and equity, providing actionable insights for policymakers and network operators in the EV transition.
1. Introduction
The widespread adoption of electric vehicles (EVs) represents an important strategy for decarbonizing the transportation sector. This transition is primarily dependent on the establishment of a robust, accessible, and reliable public charging network. An obstacle to this progress is the hesitation of prospective EV buyers due to insufficient charging infrastructure, while investors delay expanding charging networks due to uncertain demand. Recent research presents that supply-side limitations, technology costs, and planning inefficiencies continue to impact EV adoption [1].
Research on EV charging infrastructure planning involves several interconnected domains. Many studies examine the integration of renewable energy sources for powering EVs. This research aims to reduce dependence and decarbonize the charging process [2,3,4]. Studies in this area have demonstrated the technical feasibility of renewable-powered EV charging while addressing the challenges posed by the intermittency of renewable energy. Common approaches include the use of energy storage systems, the utilization of advanced scheduling algorithms, and the implementation of smart energy management techniques to align variable power generation with fluctuating demand for EV charging [5,6]. While this research provides a foundation for sustainable energy supply systems, the present study focuses on the issue of the placement of EV charging infrastructure. Planning for charging infrastructure that is both efficient and equitable is important for the e-mobility transition.
Current infrastructure planning for EVs often uses proportional allocation, where chargers are distributed based on current EV density or traffic patterns. While this approach may seem intuitive, it fails to consider the heterogeneity of the EV market, which includes a diverse range of vehicles such as short-range battery electric vehicles (BEVs), long-range BEVs, and plug-in hybrids (PHEVs), each with distinct charging requirements. Also, it ignores the spatio-temporal dynamics of EV adoption, as growth rates and user behavior vary significantly across regions and time periods. Emerging research shows the limitations of this approach and proposes different solutions. Charging station placement can be optimized using multi-objective models by balancing factors such as customer satisfaction, risk, and cost [7]. A key research direction focuses on forecasting demand using granular and heterogeneous data. Advanced modeling techniques such as heterogeneous spatio-temporal graph convolutional networks have shown potential in predicting charging demand at detailed spatial and temporal scales [8]. Cluster-based forecasting is used to better understand adoption trajectories, showing that adoption is not uniform and varies by demographics and household attributes [9]. Clustering algorithms are widely employed to segment user populations and generate representative charging profiles. Studies have utilized techniques such as k-means and hierarchical clustering to classify unique patterns of driving and charging behaviors from large datasets [10,11]. Hierarchical clustering of state-of-charge (SoC) distributions from South Korean EV datasets identified seven representative charging profiles. These profiles capture variations in partial versus full charging tendencies, offering data for regional infrastructure sizing and power demand forecasting [12]. Custom k-means variants that incorporate population density and energy consumption optimize station locations by minimizing distances to demand hotspots while penalizing low-utilization areas, thus enhancing the efficiency of station placement [4]. In Austin, Texas, k-means clustering of EV registration data has found socioeconomic disparities in ownership. Specifically, affluent, predominantly white residents in West Austin exhibit higher adoption rates compared to underserved East Austin communities, underscoring the role of built environment factors in equity gaps for potential charging needs [13]. Also, some studies explore advanced probabilistic approaches, such as the Metalog distribution family, to capture the stochastic characteristics of energy resources relevant to EV charging, including photovoltaic energy generation [14]. The proposed framework integrates forecasting models and equity-constrained optimization to balance utilization and coverage, ensuring broader infrastructure planning.
Frameworks that incorporate traffic simulations, energy consumption modeling, and mobility equity metrics have demonstrated accessibility improvements, particularly in dense urban environments like New York City [15]. Many advanced methods for EV infrastructure planning depend on static demand estimates, which fail to account for the evolving and segmented nature of EV adoption. Existing studies often focus on specific aspects of the EV planning challenge. Some research focuses on renewable energy integration and power management to develop sustainable charging networks [2,3,4,5,6], while other studies concentrate on optimizing the spatial allocation of charging stations under cost or utilization constraints [7]. Although these approaches have contributed significantly to improving efficiency and sustainability, they often overlook the diverse characteristics of EV users and the spatio-temporal evolution of adoption patterns across regions.
To address these limitations, this study proposes an integrated, data-driven framework designed to segment the EV market based on adopter heterogeneity, forecast spatio-temporal adoption patterns for each segment, and optimize charger placement through an equity-constrained allocation model to ensure that minimum service levels are maintained equitably across all segments. By combining these stages, the proposed framework bridges the methodological gap between behavioral modeling and infrastructure optimization, enabling a more strategic and inclusive approach to the deployment of EV charging infrastructure. The framework operates through a three-stage process. First, it clusters EV adopters to identify behavioral and potentially technical heterogeneity. Second, it constructs spatio-temporal forecasts for each segment, enabling targeted planning that reflects regional growth dynamics. Third, it optimizes charger placement using a constrained allocation model that balances equitable coverage thresholds with maximized utilization. This approach is applied to a dataset of EV registrations in Washington State (2010–2025), with projections extending to 2030. We selected Washington due to its publicly available, geocoded registry, which includes model-year and vehicle attributes, facilitating segmentation and forecasting. Additionally, the state’s urban–rural diversity provides the context for testing equity-constrained optimization.
2. Literature Review
Research on EV charging infrastructure planning spans several complementary areas. Building on prior surveys [16,17], we organize related work into four categories: demand forecasting, location–allocation modeling, user segmentation and behavior analysis, and spatio-temporal and machine learning forecasting.
Accurate demand prediction is a prerequisite for effective planning. Early approaches relied on static projections from population or traffic counts, assuming uniform demand growth across regions and users. More recent studies apply time-series models to capture temporal dynamics. For example, Kim and Kim [18] used ARIMA to forecast aggregate station-level demand, while Akshay et al. [19] predicted power consumption for revenue estimation. Other methods include submodular optimization for utilization improvement [20] and probabilistic location targeting using Voronoi diagrams [21]. Although these models improve temporal realism, they generally treat the EV population as a single homogeneous group, overlooking variations between vehicle types and usage profiles. The presented study advances this area by disaggregating forecasts by user segment and geographic location, enabling more targeted infrastructure planning.
A large body of research formulates charging station placement as a location–allocation problem, a classic challenge in operations research. These models optimize facility locations to meet spatially distributed demand under various constraints. He et al. [22] proposed a contextualized approach for dense urban areas incorporating land use and points of interest. Eagon et al. [23] developed a model-based framework for optimizing station deployment. Bilsel et al. [7] used a multi-objective formulation balancing cost, risk, and customer satisfaction through grid-based spatial division. While these methods are powerful for spatial optimization, most rely on static or simplified demand estimates and do not incorporate robust forecasting of evolving demand composition.
Understanding heterogeneous charging behaviors is important for realistic demand estimation. Analyses of charging-related user reviews using modern language models with spatial linkage have demonstrated gains in representing user heterogeneity for infrastructure planning [24]. Karmaker et al. [25] applied customer classification to identify differences in plug-in behavior across user groups. Bose and Sivraj [26] examined operational-level charging coordination tailored to individual drivers, while Firouzjah and Ghasemi [27] explored clustering-based strategies for managing heterogeneous charging patterns with autonomous mobile chargers. Despite these advances, most segmentation studies do not integrate behavioral insights into a full infrastructure planning framework.
To better capture both geographic variation and temporal dynamics, recent work integrates spatio-temporal modeling with advanced prediction methods. Approaches include regression, time-series, and geospatial machine learning [28,29], as well as agent-based models simulating individual EV travel and charging [30]. Yang et al. [31] combined travel patterns and charging preferences in a coupled transportation–power network model, while Ostermann and Haug [32] applied probabilistic forecasting to over 350,000 charging sessions in Germany. Machine learning models—such as Random Forests, Gradient Boosting, ANNs, and LSTMs—have been used to capture complex, non-linear patterns [33,34]. For example, Orzechowski et al. [35] leveraged operational and weather data to forecast medium-term public charging demand in Scotland, achieving an SMAPE of 5.9%. These methods demonstrate strong predictive accuracy but often prioritize aggregate forecasts, offering limited insight into the adoption trends of distinct EV user segments.
This study proposes a data-driven and equity-focused framework for planning EV charging infrastructure. The main contributions are summarized as follows:
- Develop a three-stage planning framework that combines user segmentation, spatio-temporal adoption forecasting, and mixed-integer linear programming (MILP)–based charger placement optimization under budget constraints. This approach bridges behavioral modeling and infrastructure optimization, creating a reproducible workflow.
- Using K-Means clustering on detailed EV registration data, the framework derives segment-specific charging requirements. By classifying them based on vehicle attributes such as range, MSRP, and EV type, the framework captures behavioral and technical heterogeneity that has often been ignored in previous planning studies.
- The proposed framework includes an optimization model that incorporates minimum service coverage thresholds for each user segment, ensuring equitable access to charging infrastructure while maintaining efficiency.
- The framework is validated using over a decade of EV registration data from Washington State (2010–2025), achieving 96% total demand coverage and at least 70% service accessibility across all user groups.
This research presents one of the first comprehensive approaches to integrate user segmentation, geographically resolved forecasting, and equity-aware optimization in EV infrastructure planning. The proposed framework provides an adaptable foundation for designing efficient and socially inclusive EV charging infrastructure.
3. Data and Methodology
The proposed methodology employs a multi-stage pipeline to transform raw vehicle registration records into a data-driven, optimized, equitable, and forward-looking charging infrastructure plan. This process is structured around several interconnected components: (1) User Segmentation, (2) Spatio-Temporal Adoption Forecasting, (3) Demand and Needs Definition, and (4) Constrained Placement Optimization.
3.1. Electric Vehicle Population Dataset
The study is based on the publicly available Electric Vehicle Population dataset [36], which contains 261,698 anonymized records of Battery Electric Vehicles and Plug-in Hybrid Electric Vehicles registered in Washington State, sourced from Data.gov. Each record includes spatial information such as county, city, postal code, and precise geocoded coordinates, temporal information in the form of the model year, and vehicle characteristics including make, model, electric vehicle type, electric range in miles, and the base manufacturer’s suggested retail price (MSRP).
An exploratory analysis of the dataset shows an upward trend in EV registrations over the past decade. This trend aligns with national and global trends influenced by climate policies, technological advancements, and purchase incentives. Tesla emerged as the dominant EV manufacturer, accounting for 41.6% of all registered EVs, followed by Chevrolet (7.2%), Nissan (6.2%), Ford (5.3%), Kia (4.9%), Toyota and BMW (4.1%) and many others with smaller percentages, indicating a growing diversity of market offerings. Spatial distribution patterns showed that counties such as King and Snohomish have both higher concentrations of EVs and a prevalence of newer, longer-range models. This pattern likely correlates with variations in income levels, infrastructure availability, and travel behavior across regions. The distribution of electric ranges was asymmetric: most vehicles have relatively short ranges, while long-range EVs remain less common. This characteristic directly impacts charger types and placement.
This dataset was chosen for its robust spatial resolution, temporal coverage, and detailed technical attributes, all of which support the identification of distinct EV user segments. It also supports the analysis of historical adoption trends and the estimation of geographically specific charging demand to guide optimization efforts. Figure 1 illustrates the growth trajectory of EV adoption, and Figure 2 presents the distribution of electric vehicle ranges in Washington State.
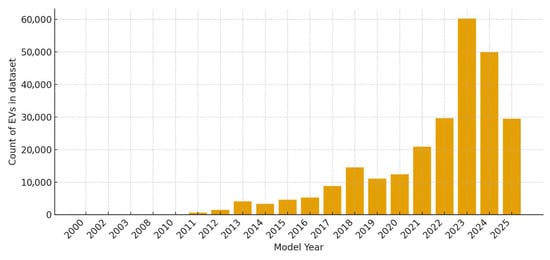
Figure 1.
Number of registered EVs by model year.
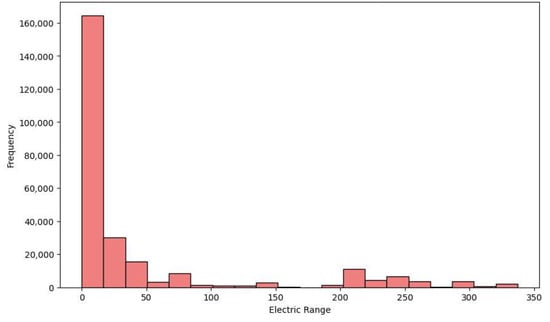
Figure 2.
Distribution of electric vehicle ranges within the dataset.
3.2. User Segmentation
The first stage of the framework recognizes that the EV market is heterogeneous, with distinct user groups exhibiting different charging requirements. To capture this diversity, EV owners are partitioned into a set of k behaviorally distinct segments, S = {s1, …, sk}, based on their vehicle’s intrinsic characteristics, which serve as a proxy for charging needs. We define a feature set F = {Electric Range, MSRP, EV Type} for each vehicle. All features were standardized using Z-score standardization, which centers values by subtracting the mean and scales them by the standard deviation. This ensures that range, MSRP, and EV type contribute comparably to the clustering process. Using these features, we apply the K-Means clustering algorithm [37] to group vehicles into k clusters. The objective is to find the set of segments S that minimizes the within-cluster sum of squares:
where fv is the scaled feature vector for vehicle v, and μi is the centroid of segment si. This data-driven approach allows us to identify emergent groups, such as ‘short-range economy BEVs,’ ‘long-range premium BEVs,’ and ‘PHEVs,’ each with a unique charging profile.
3.3. Spatio-Temporal Adoption Forecasting
With segments defined, we forecast their growth over a planning horizon T. For each spatial unit l ∈ L (e.g., a postal code) and each segment s ∈ S, we construct a time series of historical EV counts, Yl,s = {yl,s,t1, yl,s,t2, …, yl,s,tn}, based on model year data.
To project future counts, we employ Holt’s damped linear trend exponential smoothing method [38]. This model was selected based on observed adoption patterns, which show consistent growth with a gradual slowdown in recent years. Holt’s method is well suited to capturing this behavior, as it allows the trend to flatten progressively over time. Its computational efficiency and reliable performance with limited historical data make it appropriate for large-scale forecasting across multiple locations and user segments. The model is defined by the following equations:
where Lt is the smoothed level, and bt is the trend at time t. The smoothing parameters α and β control the weighting of recent observations, while the damping parameter φ ∈ [0, 1] dampens the trend over time. The h-step-ahead forecast is then given by:
The parameters (α, β, φ) are optimized for each time series individually by maximizing the likelihood of the historical data. This produces a granular forecast,
, of the number of vehicles for every segment in every location at the future target year.
3.4. Demand and Need Definition
The forecasted vehicle counts must be translated into quantifiable charging demand. We define a “demand unit” as a standardized measure representing the need for vehicle charging. To estimate infrastructure requirements, we assign heuristic weights to each user segment, reflecting their expected demand for Level 2 (L2) and DC Fast Chargers (DCFC). Because detailed data such as nearby land use, parking duration, and charger utilization is often limited or uncertain in small geographic areas, we use a simple heuristic approach rather than a complex model that might suggest a level of precision that is not supported by the available data. Let ws,c be the demand units required per vehicle of segment s for charger type c ∈ {L2, DCFC}. For example, a short-range BEV might have a high L2 and DCFC demand weight, while a PHEV would have a much lower weight for both. The total potential demand dl,s,c for segment s at location l for charger type c is calculated as:
This step systematically converts forecasted adoption into actionable demand figures for the optimization model.
3.5. Charger Placement Optimization
The final step is to allocate chargers to meet the forecasted demand as effectively and equitably as possible under a budget constraint. We formulate this as a Mixed-Integer Linear Program (MILP), which we implement using the PuLP library [39]. In this formulation, xl,c ∈ Z≥0 denotes the number of chargers of type c to install at location l, while yls,c ∈ R≥0 represents the portion of demand from segment s at location l that is met by chargers of type c. The total available budget is given by B, and costc specifies the installation cost of a single charger of type c. Each charger of type c can serve capacityc demand units per week. The forecasted demand from segment s at location l for charger type c is denoted by dl,s,c, and γs defines the minimum coverage requirement for segment s (for example, 0.7).
The objective is to maximize the total satisfied demand across all locations, segments, and charger types:
This objective is subject to the following constraints:
Constraint (7) ensures the total installation cost does not exceed the budget B. Constraint (8) links the served demand to the installed capacity, preventing a location’s chargers from being over-allocated. Constraint (9) ensures that satisfied demand cannot exceed potential demand. Finally, constraint (10) ensures equity by requiring that for each segment s, the total satisfied demand meets a minimum proportion γs of its total potential demand across the entire region. This prevents the model from ignoring less “profitable” or harder-to-serve segments in favor of maximizing the aggregate objective function.
4. Experimental Setup
The study area is defined by the geographical extent of the Electric Vehicle Population dataset [36], covering all postal codes within Washington State. Each postal code centroid is treated as a candidate site for charging infrastructure deployment, and its associated demand is determined from the segment-specific spatio-temporal forecasts described in Section 3. The planning horizon extends to 2030, with forecasts generated annually for each segment and location.
4.1. Implementation Details
The experimental evaluation is designed to assess the effectiveness of the proposed segmentation–forecasting–optimization framework in planning EV charging infrastructure. All experiments were implemented in Python 3.11.5, using scikit-learn for clustering, statsmodels for time-series forecasting, and PuLP for mixed-integer linear programming. The computational experiments are executed on a system equipped with an AMD Ryzen 9 7950X CPU (16 cores, 4.5 GHz) and 32 GB RAM running Windows 11. Random seeds are fixed to ensure reproducibility across runs.
The segmentation stage applies K-Means clustering (k = 4) using the sklearn.cluster. KMeans implementation on standardized values of electric range, MSRP, and EV type. The number of clusters (k = 4) was selected based on the elbow method, which showed diminishing returns in within-cluster variance reduction beyond this point. This choice also produced interpretable and behaviorally meaningful segments, distinguishing between short-range BEVs, long-range BEVs, mid-range BEVs, and PHEVs, each with distinct charging profiles relevant to infrastructure planning. The resulting clusters represent distinct behavioral segments of EV owners. Segment 0 corresponds primarily to older, low-range battery electric vehicles (BEVs). Segment 1 contains modern, long-range BEVs with higher MSRP values. Segment 2 represents mid-range BEVs with moderate range and price characteristics, while Segment 3 consists of plug-in hybrid electric vehicles (PHEVs) with limited electric range. These labels are assigned based on inspection of cluster centroids and are used throughout the analysis.
For each segment–postal code pair, we construct a historical time series of vehicle counts by model year. Adoption is then forecast to 2030 using Holt’s damped trend method as implemented in the statsmodels library. This approach captures both the underlying growth trend and a gradual deceleration effect, reflecting saturation in EV adoption rates over time.
The optimization stage is formulated as a mixed-integer linear program (MILP) using PuLP. Level 2 chargers are assigned a unit cost of $2500 and provide a capacity of 50 demand units per week, while DC fast chargers (DCFCs) cost $50,000 and serve 350 demand units per week. The available budget is fixed at $5,000,000. An equity constraint is enforced to ensure that each segment achieves a minimum coverage level of γs = 0.70 in the final solution. Demand weights (ws,c) are defined heuristically according to segment characteristics, with BEV segments assigned higher DCFC demand weights than PHEVs.
4.2. Baseline Model
To benchmark performance, we utilize a proportional allocation model designed to represent a non-segmented, non-forecasting approach to infrastructure planning. In this baseline model, the entire $5,000,000 budget is allocated across postal codes in proportion to their current EV density. Electric vehicle chargers are distributed using a fixed mix of 70% Level 2 chargers and 30% DCFC units, representing a simplified planning strategy. This static benchmark does not account for future adoption dynamics or the differentiated needs of user segments. In practice, the actual mix varies across regions. In the United States, recent NREL data for Q4 2023 show that public ports are predominantly Level 2 at about 77% of public ports, while DC fast accounts for about 23% [40]. In Europe, studies report a more gradual build-out of DC fast infrastructure, with many countries still relying heavily on slower AC charging outside of highways and major urban centers [41,42]. Therefore, the 70 to 30 split should be regarded as a stylized benchmark for comparison purposes rather than as an accurate representation of current deployment practices.
4.3. Evaluation Metrics
Performance is assessed using four metrics. Overall coverage measures the proportion of total forecasted demand met by installed capacity, while segment coverage reports this value separately for each behavioral segment. Overall utilization captures the efficiency of the deployment by quantifying the ratio of satisfied demand to total installed capacity. Lastly, total cost reports the total expenses on installed chargers in the solution. Together, these metrics offer a comprehensive evaluation of both the effectiveness and efficiency of the proposed infrastructure plans.
5. Results and Discussion
To evaluate the performance of the proposed framework, a series of experiments was conducted. These included an ablation study and a sensitivity analysis that examined its key components. The results show the advantages of the proposed data-driven approach compared to the traditional baseline. Specifically, the proposed framework excels in achieving both high overall service coverage and equitable distribution of charging resources across diverse user segments.
The results of the main experimental runs, summarized in Table 1, illustrate the effectiveness of the proposed framework. By integrating forecasting, segmentation, and equity constraints, the final method successfully meets its objectives. It effectively balances efficiency and equity in resource allocation, ensuring that even hard-to-serve user groups from Segment 1 (Long-Range BEV) achieve a guaranteed minimum level of service.

Table 1.
Summary of key results across experimental runs.
The baseline model, which allocates chargers based solely on current EV density, is both insufficient and highly inequitable. It achieves only 76.0% overall coverage and dramatically underserves key user groups (coverage of only 7.1% for Segment 1—Long-Range BEV). Although its overall utilization appears high at 67.4%, this is a misleading metric reflecting a poorly developed network that only services the easiest, most concentrated areas of demand while ignoring the broader market. These results show the critical limitations of static, proportional planning methods.
In contrast, the proposed optimization method without equity constraints shows an important improvement over the baseline. By incorporating forecasting and segmentation, it achieves a high overall service coverage of 96.1%. However, this unconstrained approach exposes a critical limitation: while maximizing overall objectives, it provides only 39.3% coverage for Segment 1. This demonstrates that even advanced optimization models tend to prioritize easily satisfied demand unless explicitly guided by equity principles.
Introducing a minimum coverage constraint of 70% for each segment leads to a key improvement in resource allocation. The final equity-constrained model achieves 96.1% overall coverage and an overall utilization rate of 52.2%. Importantly, it addresses the service gap for previously underserved groups: coverage for Segment 1 rises significantly to 70.2%, meeting the target threshold. Coverage for Segment 2 also improves to 70.9%, ensuring equitable service across all segments. These equity gains come with only a negligible trade-off in overall coverage, underscoring the effectiveness of the constrained approach.
The total cost in Figure 3 and Figure 4 shows a clear contrast between runs: the baseline totals $2.78 M, which follows from the dataset-driven allocation (chargers distributed proportionally to current EV density) and the assumed L2-heavy mix. Since L2 units ($2500) are far cheaper than DCFC ($50,000), the resulting hardware spend stays low. In comparison, the MILP-optimal configuration utilizes the entire $5,000,000 budget, as the optimization deploys additional hardware, often DCFC, wherever it still meets the demand while following the model’s constraints and the budget condition.
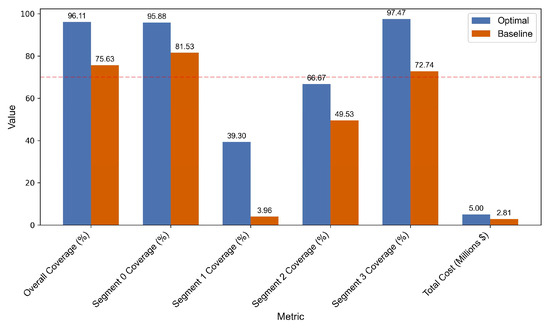
Figure 3.
The comparison of segment coverage before applying the equity constraint. Without equity constraints, Segment 1 (Long-Range BEV) coverage is insufficient at 39.30%. The dashed line indicates the 70% coverage threshold.
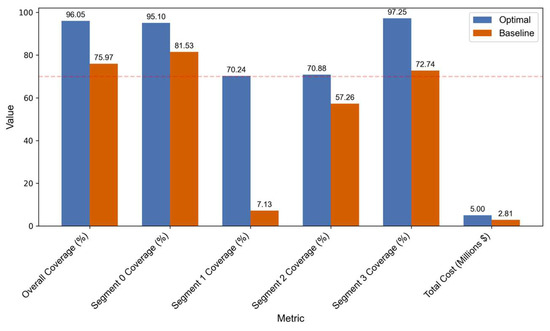
Figure 4.
The comparison of segment coverage before applying the equity constraint. After implementing a 70% coverage constraint, Segment 1 coverage has successfully increased to 70.24%. The dashed line indicates the 70% coverage threshold.
To illustrate the spatial outcomes of the planning framework, we aggregate optimized charging coverage to the postal code level across Washington State. The results show widespread accessibility, with most postal codes reaching high coverage under the optimized deployment. At the same time, some regional variation remains, particularly in more rural and peripheral areas (see Figure 5).
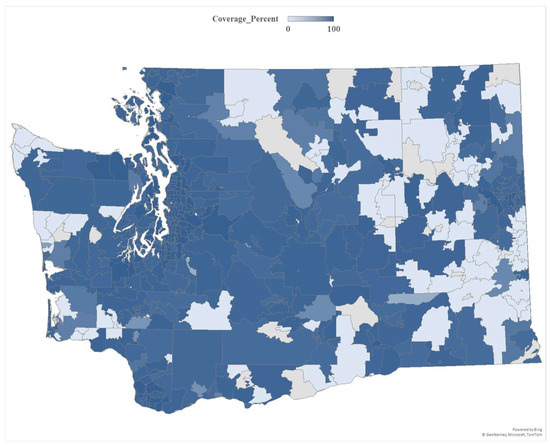
Figure 5.
Optimized EV charging coverage across Washington State at the postal code level.
The improvements in coverage for previously underserved segments underscore the importance of incorporating explicit equity constraints into the optimization framework. These findings demonstrate that the proposed approach not only achieves strong overall performance but also plays a critical role in balancing the dual objectives of efficiency and equity.
We conducted a sensitivity analysis to evaluate the responsiveness of optimized charging infrastructure deployment to two primary variables. The first variable examines the effect of equity constraints defined as minimum service levels for distinct segments. The second variable explores uncertainty in the segment-specific demand for L2 compared to DCFC. The analysis is constrained by a fixed total investment budget of $5 million. Unit costs and nominal service capacities are assumed to be $2500 per L2 charger (approximately 50 sessions) and $50,000 per DCFC unit (approximately 350 sessions). Model performance is evaluated based on four key metrics: overall demand coverage (the proportion of total demand served), capacity utilization, total installed capacity, and segment-specific coverage levels. For comparison, each optimized solution is benchmarked against a proportional baseline allocation strategy, which geographically distributes investment using a predetermined 70/30 emphasis on L2 chargers.
The experimental design defines equity by introducing a minimum coverage constraint for each driver segment, systematically varying this threshold at 0%, 60%, 70%, and 80%. Demand uncertainty is modeled, by applying multiplicative perturbations to the baseline demand coefficients Two distinct types of demand shocks are analyzed: (a) uniform shocks of −20%, 0%, and +20%, which are applied symmetrically across all charger types, and (b) asymmetric shocks, which specifically alter the relative demand for DCFC while keeping the demand for L2 charging stations constant.
The analysis reveals three key findings that are consistent across all tested scenarios: (i) the optimization model demonstrates superior performance compared to the proportional baseline allocator in every feasible case; (ii) a 70% minimum coverage requirement per segment is identified as a practical equity constraint that maintains high overall system performance; (iii) attempting to enforce a stricter minimum coverage level of 80% across segments proves to be infeasible due to the constraints imposed by the available budgetary limitations and unit cost parameters.
The analysis of coverage effects shows the performance improvements achieved through optimization. With a 20% increase in DCFC demand and a 70% minimum per-segment coverage constraint, the optimized solution achieves 80.2% overall coverage, representing a 33.1% improvement compared to the baseline’s coverage of 47.1% (see Figure 6). When DCFC demand is reduced by 20% under the same equity constraint, the optimized model still outperforms, providing an advantage of 28.3%.
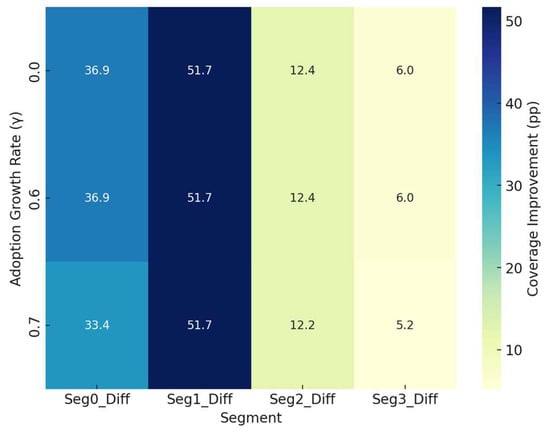
Figure 6.
Sensitivity analysis of segment coverage improvement.
The analysis of utilization and installed capacity reveals distinct patterns under varying demand conditions. A uniform 20% increase in demand produces the highest observed utilization rate for the optimized solution, reaching 54.7% under the 70% equity constraint, which is an improvement higher than the baseline’s 25–30% utilization under similar conditions. A uniform 20% decrease in demand decreases utilization within the optimized model, reflecting increased system slack, while still maintaining high overall coverage. In all feasible scenarios, the observed coverage improvements are distributed broadly across multiple segments rather than being concentrated in a single one (see Table 2).
Table 2.
Sensitivity analysis results across adoption growth rates (γ) and infrastructure cost multipliers.
The findings from this study related to the importance of segmenting the EV market for effective charging infrastructure planning are supported by prior research on consumer behavior and market dynamics. The study [43] on market electrification in Poland provides insights related to geographic variations in EV adoption. Using a survey-based analysis, the study [43] identified significant geographic differences in preferences for BEVs and PHEVs. Respondents from large cities and rural areas showed a stronger preference for BEVs, while those in mid-sized cities preferred PHEVs. This geographic heterogeneity aligns directly with the main idea of our work, presenting the inadequacy of conventional proportional allocation strategies that assume a uniform EV distribution based only on population density. Our proposed framework utilizes segment-specific spatio-temporal forecasting to account for these regional variations. By adapting charging infrastructure deployment to reflect distinct consumer adoption patterns, as identified in [43], our model can lead to a more equitable and efficient allocation of resources and facilitate a smoother transition to e-mobility.
The proposed framework demonstrates solid performance and practical applicability; however, several limitations highlight areas for further research and refinement.
First, the accuracy of the infrastructure planning outcomes depends strongly on the quality of the time-series forecasts. While Holt’s damped trend method provides a stable and interpretable baseline, it does not explicitly capture stochastic uncertainty or nonlinear behavioral effects. Future work could integrate advanced forecasting techniques, such as machine learning or probabilistic models, to better account for uncertainty and improve the robustness of predictions.
Second, the current definition of segment-specific charging needs relies on heuristic assumptions derived from vehicle attributes. Although this approach enables large-scale analysis, access to empirical charging session data would allow for the estimation of demand weights grounded in real user behavior, resulting in more context-sensitive planning outcomes.
Third, the budget and cost formulation assumes uniform per-unit installation costs and excludes fixed site-specific expenses, grid connection upgrades, and operational or maintenance costs. It also employs a single-period cost representation without discounting or phased investments. Future extensions could incorporate location-dependent cost parameters and multi-year deployment strategies to enhance the economic realism of the optimization model.
Finally, the current model operates on aggregated weekly demand and does not account for intra-day or intra-week temporal fluctuations such as commuting peaks or weekend usage. Incorporating finer temporal resolution and dynamic load modeling would improve both the precision and operational relevance of the resulting infrastructure plans.
6. Conclusions
This study addressed the challenge of planning an efficient and equitable EV charging infrastructure by developing an integrated, data-driven framework that combines user segmentation, spatio-temporal forecasting, and equity-focused optimization. Our empirical evaluation, using over a decade of data from Washington State, demonstrated the effectiveness of this approach. The framework increases overall demand coverage from 76.0% to 96.1% compared to the baseline, while ensuring at least 70% service coverage for all user segments. These results show the potential to optimize charging infrastructure placement not only for cost-effectiveness but also for social inclusivity.
The results carry significant policy implications. By incorporating equity constraints as a foundational design principle, our framework provides policymakers and network operators with a strategic tool to prevent the emergence of “charging deserts” and ensure underserved communities are not left behind in the e-mobility transition. This data-informed approach allows for infrastructure planning that strategically balances cost-effectiveness with social inclusivity, fostering a more resilient and accessible charging network for a diverse population of EV users. However, our study has limitations. The current model relies on heuristic demand weights, does not yet incorporate demand uncertainty, and addresses aggregate weekly demand rather than finer-grained intra-day variations.
Future research will focus on addressing these limitations and expanding the model’s capabilities. Incorporating probabilistic forecasting will enable the modeling of demand uncertainty, enhancing the robustness of predictions. The integration of real-time charging behavior data from operational networks will help refine demand profiles for specific user segments, improving the precision of infrastructure placement. Extending the optimization to a two-stage stochastic program will allow for the inclusion of intra-day and intra-week demand variations, supporting both strategic placement and dynamic resource allocation. Finally, exploring the integration of vehicle-to-grid (V2G) services may show new opportunities for aligning infrastructure deployment with grid stability needs.
Author Contributions
Conceptualization, F.G., G.-D.V. and M.D.; methodology, F.G.; software, F.G. and G.-D.V.; validation, G.-D.V. and M.D.; formal analysis, M.D. and C.-C.P.; investigation, F.G. and G.-D.V.; resources, F.G. and G.-D.V.; data curation, G.-D.V. and C.-C.P.; writing—original draft preparation, F.G., G.-D.V., and M.D.; writing—review and editing, G.-D.V., C.-C.P. and M.D.; visualization, G.-D.V.; supervision, F.G.; project administration, G.-D.V. All authors have read and agreed to the published version of the manuscript.
Funding
This work was supported by a grant from the Ministry of Research, Innovation and Digitization, CNCS-UEFISCDI, project number PN-IV-P2-2.1-TE-2023-1434, within PNCDI IV.
Institutional Review Board Statement
Not applicable.
Informed Consent Statement
Not applicable.
Data Availability Statement
Data will be made available upon request.
Conflicts of Interest
The authors declare no conflicts of interest. The funders had no role in the design of the study; in the collection, analyses, or interpretation of the data; in the writing of the manuscript; or in the decision to publish the results.
Abbreviations
The following abbreviations are used in this manuscript:
| EVs | Electric Vehicles |
| BEVs | Battery Electric Vehicles |
| PHEVs | Plug-in Hybrids |
| MSRP | Manufacturer’s Suggested Retail Price |
| DCFCs | DC Fast Chargers |
| MILP | Mixed-integer linear program |
| V2G | Vehicle-to-grid |
References
- Çelik, S.; Ok, Ş. Electric vehicle charging stations: Model, algorithm, simulation, location, and capacity planning. Heliyon 2024, 10, e29153. [Google Scholar] [CrossRef]
- Alkawsi, G.; Baashar, Y.; Abbas, U.D.; Alkahtani, A.A.; Tiong, S.K. Review of renewable energy-based charging infrastructure for electric vehicles. Appl. Sci. 2021, 11, 3847. [Google Scholar] [CrossRef]
- Jyothi, P.; Saketh, P.; Vignesh, C.; Devi, V.K. Renewable energy powered DC charging system for electric vehicle. In Proceedings of the Journal of Physics: Conference Series, Coimbatore, India, 13–14 August 2020; p. 012085. [Google Scholar]
- Khan, S.; Ahmad, A.; Ahmad, F.; Shafaati Shemami, M.; Saad Alam, M.; Khateeb, S. A comprehensive review on solar powered electric vehicle charging system. Smart Sci. 2018, 6, 54–79. [Google Scholar] [CrossRef]
- Manousakis, N.M.; Karagiannopoulos, P.S.; Tsekouras, G.J.; Kanellos, F.D. Integration of renewable energy and electric vehicles in power systems: A review. Processes 2023, 11, 1544. [Google Scholar] [CrossRef]
- Singh, S.; Chauhan, P.; Singh, N.J. Feasibility of grid-connected solar-wind hybrid system with electric vehicle charging station. J. Mod. Power Syst. Clean Energy 2020, 9, 295–306. [Google Scholar] [CrossRef]
- Bilsel, M.; Kilic, H.S.; Kalender, Z.T.; Tuzkaya, G. Multi-objective model for electric vehicle charging station location selection problem for a sustainable transportation infrastructure. Comput. Ind. Eng. 2024, 198, 110695. [Google Scholar] [CrossRef]
- Wang, S.; Chen, A.; Wang, P.; Zhuge, C. Predicting electric vehicle charging demand using a heterogeneous spatio-temporal graph convolutional network. Transp. Res. Part C Emerg. Technol. 2023, 153, 104205. [Google Scholar] [CrossRef]
- Ramadoss, T.V.; Lee, J.H.; Davis, A.W.; Hardman, S.; Tal, G. Classifying electric vehicle adopters and forecasting progress to full adoption. npj Sustain. Mobil. Transp. 2025, 2, 32. [Google Scholar] [CrossRef]
- Crozier, C.; Apostolopoulou, D.; McCulloch, M. Clustering of usage profiles for electric vehicle behaviour analysis. In Proceedings of the 2018 IEEE PES Innovative Smart Grid Technologies Conference Europe (ISGT-Europe), Sarajevo, Bosnia and Herzegovina, 21–25 October 2018; pp. 1–6. [Google Scholar]
- Kim, K.; Kim, G.; Yoo, J.; Heo, J.; Cho, J.; Ryu, S.; Kim, J. Data-Driven Clustering Analysis for Representative Electric Vehicle Charging Profile in South Korea. Sensors 2024, 24, 6800. [Google Scholar] [CrossRef]
- Magsino, E.; Espiritu, F.M.M.; Go, K.D. Discovering electric vehicle charging locations based on clustering techniques applied to vehicular mobility datasets. ISPRS Int. J. Geo-Inf. 2024, 13, 368. [Google Scholar] [CrossRef]
- Choi, S.J.; Jiao, J. Uncovering electric vehicle ownership disparities using K-means clustering analysis: A case study of Austin, Texas. J. Comput. Soc. Sci. 2024, 7, 2403–2456. [Google Scholar] [CrossRef]
- Małek, A.; Marciniak, A. Selection of the photovoltaic system power for the electric vehicle. Arch. Motoryz. 2023, 100, 44–61. [Google Scholar] [CrossRef]
- Kinchen, T.; Typaldos, P.; Malikopoulos, A.A. A United Framework for Planning Electric Vehicle Charging Accessibility. arXiv 2025, arXiv:2508.05827. [Google Scholar] [CrossRef]
- Yousuf, A.; Wang, Z.; Paranjape, R.; Tang, Y. An in-depth exploration of electric vehicle charging station infrastructure: A comprehensive review of challenges, mitigation approaches, and optimization strategies. IEEE Access 2024, 12, 51570–51589. [Google Scholar] [CrossRef]
- Yuvaraj, T.; Devabalaji, K.; Kumar, J.A.; Thanikanti, S.B.; Nwulu, N.I. A comprehensive review and analysis of the allocation of electric vehicle charging stations in distribution networks. IEEE Access 2024, 12, 5404–5461. [Google Scholar] [CrossRef]
- Kim, Y.; Kim, S. Forecasting charging demand of electric vehicles using time-series models. Energies 2021, 14, 1487. [Google Scholar] [CrossRef]
- Akshay, K.; Grace, G.H.; Gunasekaran, K.; Samikannu, R. Power consumption prediction for electric vehicle charging stations and forecasting income. Sci. Rep. 2024, 14, 6497. [Google Scholar] [CrossRef]
- Zhang, Y.; Wang, Y.; Li, F.; Wu, B.; Chiang, Y.-Y.; Zhang, X. Efficient deployment of electric vehicle charging infrastructure: Simultaneous optimization of charging station placement and charging pile assignment. IEEE Trans. Intell. Transp. Syst. 2020, 22, 6654–6659. [Google Scholar] [CrossRef]
- Qiao, Y.; Huang, K.; Jeub, J.; Qian, J.; Song, Y. Deploying electric vehicle charging stations considering time cost and existing infrastructure. Energies 2018, 11, 2436. [Google Scholar] [CrossRef]
- He, S.; Tang, W.; Huang, P.; Li, X.; Xiao, Q. Electric Vehicle Charging Load Prediction Based on User Portrait. In Proceedings of the 2023 6th Asia Conference on Energy and Electrical Engineering (ACEEE), Chengdu, China, 21–23 July 2023; pp. 365–371. [Google Scholar]
- Eagon, M.; Fakhimi, S.; Lyu, G.; Yang, A.; Lin, B.; Northrop, W.F. Model-Based Framework to Optimize Charger Station Deployment for Battery Electric Vehicles. In Proceedings of the 2022 IEEE Intelligent Vehicles Symposium (IV), Aachen, Germany, 4–9 June 2022; pp. 1639–1648. [Google Scholar]
- Hou, Y.; Wang, P.; Yao, Z.; Zheng, X.; Chen, Z. Enhancing Electric Vehicle Charging Infrastructure Planning with Pre-Trained Language Models and Spatial Analysis: Insights from Beijing User Reviews. ISPRS Int. J. Geo-Inf. 2025, 14, 325. [Google Scholar] [CrossRef]
- Karmaker, A.K.; Sturmberg, B.; Behrens, S.; Hossain, M.; Pota, H. Characterizing electric vehicle plug-in behaviors using customer classification approach. In Proceedings of the 2023 IEEE International Conference on Energy Technologies for Future Grids (ETFG), Wollongong, Australia, 3–6 December 2023; pp. 1–6. [Google Scholar]
- Bose, P.; Sivraj, P. Smart charging infrastructure for electric vehicles in a charging station. In Proceedings of the 2020 4th International Conference on Intelligent Computing and Control Systems (ICICCS), Madurai, India, 13–15 May 2020; pp. 186–192. [Google Scholar]
- Firouzjah, K.G.; Ghasemi, J. A clustering-based approach to scenario-driven planning for EV charging with autonomous mobile chargers. Appl. Energy 2025, 379, 124925. [Google Scholar] [CrossRef]
- Dipto, D.R.; Rahman, M.T.; Shib, S.K.; Shufian, A.; Islam, R. Dynamic Load Forecasting in EV Charging Systems Using Deep Neural Networks. In Proceedings of the 2025 4th International Conference on Robotics, Electrical and Signal Processing Techniques (ICREST), Dhaka, Bangladesh, 11–12 January 2025; pp. 81–85. [Google Scholar]
- Zhou, X.; Zhang, K.; Jia, X.; Fan, J. Electric Vehicle Charging Load Demand Forecasting Model based on Spatial and Temporal Characteristics. In Proceedings of the Journal of Physics: Conference Series, Chengdu, China, 18–20 November 2023; p. 012005. [Google Scholar]
- Chaudhari, K.S. Agent-Based Modelling of Electric Vehicle Charging for Optimized Charging Station Operation. Ph.D. Thesis, Nanyang Technological University, Singapore, 2019. [Google Scholar]
- Yang, X.; Yun, J.; Zhou, S.; Lie, T.T.; Han, J.; Xu, X.; Wang, Q.; Ge, Z. A spatiotemporal distribution prediction model for electric vehicles charging load in transportation power coupled network. Sci. Rep. 2025, 15, 4022. [Google Scholar] [CrossRef]
- Ostermann, A.; Haug, T. Probabilistic forecast of electric vehicle charging demand: Analysis of different aggregation levels and energy procurement. Energy Inform. 2024, 7, 13. [Google Scholar] [CrossRef]
- Venkatesan, P.K.A.G.; Farhan, M.A.; Subramanian, G.S.; Manivannan, G.; Reddy, R.R.P. Forecasting of energy demand for electric vehicles using machine learning techniques. In Proceedings of the 2023 IEEE International Conference on Energy Technologies for Future Grids (ETFG), Wollongong, Australia, 3–6 December 2023; pp. 1–6. [Google Scholar]
- Amezquita, H.; Guzman, C.P.; Morais, H. Forecasting Electric Vehicles’ Charging Behavior at Charging Stations: A Data Science-Based Approach. Energies 2024, 17, 3396. [Google Scholar] [CrossRef]
- Orzechowski, A.; Lugosch, L.; Shu, H.; Yang, R.; Li, W.; Meyer, B.H. A data-driven framework for medium-term electric vehicle charging demand forecasting. Energy AI 2023, 14, 100267. [Google Scholar] [CrossRef]
- Washington State Department of Licensing. Electric Vehicle Population Dataset. Available online: https://data.wa.gov/Transportation/Electric-Vehicle-Population-Data/f6w7-q2d2/about_data (accessed on 16 August 2025).
- Hartigan, J.A.; Wong, M.A. Algorithm AS 136: A k-means clustering algorithm. J. R. Stat. Soc. Ser. C 1979, 28, 100–108. [Google Scholar] [CrossRef]
- Gardner Jr, E.S. Exponential smoothing: The state of the art. J. Forecast. 1985, 4, 1–28. [Google Scholar] [CrossRef]
- Mitchell, S.; OSullivan, M.; Dunning, I. Pulp: A linear programming toolkit for python. Univ. Auckl. Auckl. N. Z. 2011, 65, 25. [Google Scholar]
- Brown, A.; Cappellucci, J.; Gaus, M.; Buleje, H. Electric Vehicle Charging Infrastructure Trends from the Alternative Fueling Station Locator: Second Quarter 2024; National Renewable Energy Laboratory (NREL): Golden, CO, USA, 2024. [Google Scholar]
- Szumska, E.M. Electric vehicle charging infrastructure along highways in the EU. Energies 2023, 16, 895. [Google Scholar] [CrossRef]
- Guerrero-Silva, J.A.; Romero-Gelvez, J.I.; Aristizábal, A.J.; Zapata, S. Optimization and Trends in EV Charging Infrastructure: A PCA-Based Systematic Review. World Electr. Veh. J. 2025, 16, 345. [Google Scholar] [CrossRef]
- Dudziak, A.; Droździel, P.; Stoma, M.; Caban, J. Market Electrification for BEV and PHEV in Relation to the Level of Vehicle Autonomy. Energies 2022, 15, 3120. [Google Scholar] [CrossRef]
Disclaimer/Publisher’s Note: The statements, opinions and data contained in all publications are solely those of the individual author(s) and contributor(s) and not of MDPI and/or the editor(s). MDPI and/or the editor(s) disclaim responsibility for any injury to people or property resulting from any ideas, methods, instructions or products referred to in the content. |
© 2025 by the authors. Licensee MDPI, Basel, Switzerland. This article is an open access article distributed under the terms and conditions of the Creative Commons Attribution (CC BY) license (https://creativecommons.org/licenses/by/4.0/).